construction industry training board (citb)construction industry training board (citb) annual report...
TRANSCRIPT

citb.co.uk
Construction Industry Training Board (CITB)
Annual Report and Accounts 2012
Ensuring the
construction industry
has the right skills in
the right place at the
right time

Construction Industry Training Board (CITB)
Annual Report and Accounts 2012
Annual Report and Accounts presented to Parliament pursuant to s8 (4) of the Industrial Training Act 1982.
Ordered by the House of Commons to be printed 19 June 2013.
HC 122 LOndOn: THe STATiOneRy OffiCe £21.25

© Construction Industry Training Board 2013The text in this document (excluding the Royal Arms and other departmental or agency logos) may be reproduced free of charge in any format or medium providing it is reproduced accurately and not used in a misleading context.
The material must be acknowledged as CiTB copyright and the title of the document specified. Where third party copyright material has been identified, permission from the respective copyright holder must be sought.
Any enquiries regarding this document should be sent to: Corporate Governance Unit, CiTB, Bircham newton, King’s Lynn, norfolk Pe31 6RH
you can download this publication from citb.co.uk/about-us/how-were-run/corporate-publications
iSBn: 9780102983517
Printed in the UK for The Stationery Office Limited on behalf of the Controller of Her Majesty’s Stationery Office
id 2560036 06/13
Printed on paper containing 75% recycled fibre content minimum

ContentsIntroduction
foreword 3
The Business and economic environment 4
Corporate Performance 2012 6
Public Benefit 8
Looking after information 8
Corporate Responsibility 9
Business Activities
CiTB in england 11
CiTB in Scotland 15
CiTB in Wales 17
CiTB yng nghymru 19
Annual Accounts
CiTB Trustees 21
financial Report 22
Statement of the Board’s and the Accounting Officer’s Responsibilities 32
Remuneration Report 33
Governance Statement 35
Certificate and Report of the Comptroller and Auditor General 39
financial Statements 41
Statistical Information
Statistical information for the year ended 31 december 2012 62
Appendices
Appendix A: Membership of the Board and its Committees 66
Appendix B: Register of interests of Board Members 68
Appendix C: employer Organisations 70
Appendix d: CiTB Statutory Basis 71
Appendix e: Breakdown of 2012 Achievements 75
Appendix f: Location of CiTB Offices and national Construction College (nCC) Centres 76
Appendix G: Glossary 78
citb.co.uk
Contents

3
ForewordWelcome to our 2012 Annual Report, for a year that was full of ups and downs for our industry. Leading the ‘up’ side of the ledger was the Olympics: world-class sports stars performing inspiring feats in fabulous facilities built by the terrific workforce of a superb industry.
But the ‘down’ side of the ledger reflected the toll taken on our industry by a stuttering economy, as construction firms went out of business by the thousand: devastating for those affected and sobering for all of us who swear by the power of construction to make a difference to the economy and to society. My belief in that power remains unshakeable, even as we face a tough 2013, because, as an industry, we are resourceful and resilient.
2013 will be a year in which CiTB continues to up its game in support of the industry, in support of employers and in support of the talent pool that we daren’t neglect. Our ambition is a big one: for the construction sector in this country to become world class. no small goal. in addition, in our business plan, the Board has set out its expectations of the organisation. These make challenging reading: always to be the best at anticipating and providing innovative skills solutions for the industry; to be responsible in the stewardship of employer and public funding; and to be a ‘Best Place to Work’.
Our broader aims and actions for the coming year are also set out clearly in our Business Plan under the strategic aim of developing a 10-year plan to increase ambition for, and investment in, skills across the industry. Consultation with the industry showed us that we face six key challenges: leadership, productivity, recruitment and retention, low carbon, employer engagement and education and training.
We will be addressing these challenges through rigorous planning, a determined focus and, crucially, through effective action. Because the industry doesn’t exist in the pages of a business plan; it doesn’t thrive in print or online. it thrives on the ground, on site, where it comes to life. it thrives in the minds and imaginations of all of us who work in the industry every day. it thrives in the hands of craftsmen and women: joiners, bricklayers, surveyors, plasterers, roofers, managers, designers, painters and decorators and a whole range of other specialist trades and occupations. Without them there is no industry, no development, there are no houses and offices and shops and hospitals and schools; no sports stadia or bridges or roads.
This is what’s at the heart of our planning and our commitment at CiTB: ensuring a pipeline of talent. Because without it, there’s no construction industry, let alone one that can take on the world. The executive has promised to innovate and it will; to prepare for the needs of emerging sectors such as nuclear and we will. But underpinning all our efforts are basic enduring values – quality talent, properly skilled and ready for a top-class industry, delivering what is asked for and more.
To deliver these promises we need to make sure that we communicate with clarity, simplicity and passion. Of course our levy payers are our priority audience but beyond them we need to be effective and relentless in making the case for the benefits that construction brings to the economy and to society. These audiences will include Government, investors and of course the people who use our product – from families to corporations.
We need to be persistent and determined in how we serve our levy payers and in how we communicate the value of that service. Our job will never be done. We need a pipeline flowing with talent that will learn new and traditional skills and that’s a relentless task. The executive is determined to improve our delivery year on year and that’s best done in partnership with the employers we serve. Our industry isn’t known for its shrinking violets and nor should it be – so continue to tell us what you think.
Construction is a tough, competitive business that rewards those who work hard and stick at it. Thomas Jefferson, the third President of the United States once said: “i’m a great believer in luck; i’ve found that the harder i work, the luckier i get.” That’s a good maxim for our industry – we rely on our own efforts to generate the luck we need and sometimes to tide us over the less fortunate moments.
The team at CiTB will be working hard for you in 2013, ensuring the pipeline of skilled talent. That’s our pledge for the coming twelve months.
James Wates Chairman
Postscript: in April 2013, Mark farrar told me and the Board that he wished to leave CiTB after seven busy years. Mark has led the organisation through challenging times in the industry, securing ongoing levy and other funding. He leaves CiTB with our thanks and wholehearted best wishes.
Introduction
4
Introduction
Industry profileWhilst 2012 provided a great platform for celebrating the quality and achievements of UK construction, enhancing the industry’s international reputation for delivering major projects, it was tempered by a return to recession as demand waned. indeed, the year proved to be very bad for jobs and growth. With an estimated fall in output of nearly 9% in real terms, poor performance in 2012 has scuppered any notion that the sector is over the worst of the downturn.
The drop was inevitable given cuts in public expenditure resulting from the austerity programme. However, the situation has been exacerbated by a weak economy affecting the private sector. Although poor performance in the public housing and public non-housing sectors had been expected (given ongoing expenditure cuts), private sector recovery was hit by a resurgence of the sovereign debt crisis in the eurozone in the middle of the year, which cut consumer and business confidence.
Certainly the coalition Government’s deficit reduction programme has been a major constraint on growth, but a dearth of private sector investment has compounded the lack of growth elsewhere. Continuing pressure on disposable incomes, job uncertainties and tough credit conditions is affecting consumers’ and developers’ decisions to buy or to take forward new projects.
despite a generally positive performance in 2012, 2% output growth proved impossible to sustain and the worst fears of many across the industry proved correct as the sector slipped back into recession. As a result, construction output is estimated to have fallen back to close to 2009 levels.
Whilst private sector investment is still seen as the most likely driver of growth, there is a new-found realism that it will not plug the gap left by less public funding. new orders have largely stabilised, but in 2012 hit their lowest level in real terms since 1980.
This lack of demand, along with intense competition for work, has combined to keep tender prices down, although they appear to be staying in touch with building input costs. However, margins remain low and cash flow is the predominant concern, particularly among SMe builders and specialists.
The Construction Products Association (CPA) reports that late payment is adversely affecting cash flow, with only 7% of specialist contractors being paid within 30 days.
This is reported to be the single most important issue currently affecting contractors’ businesses.
The impact of reduced cash flow is that many firms remain at risk of insolvency. Whilst data from experian shows that construction sector insolvencies eased up slightly in 2012, construction companies are continuing to fail at almost twice the rate of other sectors, and the number of construction insolvencies is likely to increase in 2013.
With the focus on survival continuing to take up the energies of the vast majority of firms within the sector, the challenge is to ensure that skills development is at the heart of their planning rather than being another casualty of recession.
Workforce profileConstruction employment now stands at about 1.84m people, or 2.47m if the wider supply chain of building professional and mechanical and electrical services is included.
The combined employment of construction workers and professional services accounts for about 8% of the UK workforce, but the size of the construction workforce has contracted substantially since the start of the recession. Construction employment declined by 2.5% in 2012, and is estimated to have fallen by 11% in the five years to 2012.
Although unemployment growth in the industry has continued to slow over 2012, the number of long term unemployed remains stubbornly high. it is projected that construction employment will continue to fall to 2016 and only grow marginally in the following year. Overall employment in the industry is forecast to be around 80,000 lower in 2017 than in 2012 (at 1.76m), its lowest level since 2000.
The relative lack of employment opportunities is also apparent in vacancies data. Though there has been a marginal rise in vacancies throughout 2012 – about 3% a month on average – this is from a very low base and is much lower than pre-recession levels.
data from CiTB’s Construction Skills network (CSn) suggests that employment in the industry will continue to fall at an annual average rate of 0.8% before stabilising in 2016 and then rising slightly in 2017, but it will still be 17% below its 2008 peak. CSn data suggests that, over the 2013–2017 forecast period, an average recruitment of 29,050 workers per year will be required to deliver the forecast growth and replace those leaving the industry.
The Business and Economic Environment

5
Introduction
One of the main reasons for low recruitment over the forecast period is that, although there will be a considerable level of inflow from unemployment once the industry starts to show sustained recovery, the signs are that levels of underemployment (that is, those not working at full capacity in terms of hours) have risen in the construction industry over the past five years.
This ‘slack’ will need to be taken up before sustained growth in employment re-emerges and this is likely to lengthen the normal lag that would be expected between the start of output growth and rising employment.
Industry performanceThe sector’s performance is typically characterised by strong geographic and sectoral variation, and in this respect 2012 was no different to years past. Although all GB nations and english regions experienced negative growth, Greater London and the east of england fared slightly better than most in 2012, with considerably lower decreases (but decreases all the same). Analysis of output and employment suggests that the greater South east has generally fared better than northern regions of england over the course of the downturn.
With the exception of industrial construction, which showed marginal growth of 1%, all sectors experienced negative growth in 2012. The private housing sector and repair and maintenance held up relatively well, with only single-digit falls. All other sectors experienced a double-digit decline in output.
Public housing and public non-housing were the worst performing sectors of 2012, both experiencing a decline in output of some 20%. The fall was inevitable given cuts in public expenditure imposed through the austerity programme. However, it does look like the decline in both public housing and public non-housing output is beginning to flatten out.
Perhaps the biggest surprise was the 15% fall in infrastructure, which had experienced unprecedented growth between 2008 and 2011. it is speculated that weak output was possibly due to a hiatus in activity on other projects, bad weather in June and a suspension of works for the Queen’s Jubilee and the Olympics. The sector is predicted to return to growth in 2013, albeit at much lower levels.
Industry prospectsThe road to sustained recovery for the UK construction industry, and for the economy as a whole, is proving longer and rockier than anyone anticipated.
The forecast for national and regional output growth over the next five years remains muted, with much of the growth coming towards the end of the 2013–2017 forecast period. Annual average growth is expected to be 0.8%, much less than past projections, an indicator of the tough economic climate.
Since activity in the public housing and public non-housing sectors will continue to fall and the private sectors will struggle to take up the slack in the short term, construction output is predicted to fall in 2013, albeit by a more modest 3%. Marginal growth of around 1% is projected for 2014 as the worst of the falls in public construction should be over by then and the prospects for private construction improve a little. However, it will be 2015 before output growth accelerates to a level that might start to boost employment under normal conditions.
interestingly, the profile of output growth at the regional/devolved nation level is not as south-east-centric as previous forecasts (given that London and the South east have tended to be the focus for many large projects). The devolved nations are on a par with, or slightly above, the UK average. The north east is also showing positive signs, although it is coming back up from a very low base. nevertheless, the greater South east has weathered the last five years better than elsewhere, and continues to outperform the UK average. The outlook for other areas is worse than previous forecasts, and remains particularly difficult for the north West, yorkshire and the Humber, and the east and West Midlands.
Private housing and infrastructure present the main areas of opportunity in the short term, in terms of volume and size of market, although the latter is no longer the engine of growth it once was and is set to decline over the 2013–2017 forecast period.
even in the repair and maintenance sectors, a moribund housing market is no guarantee of growth. Pressures on disposable incomes and job insecurities are just as likely to adversely affect consumers’ decisions on home improvements as new house purchase. Thus private housing repair, maintenance and improvement will remain well below its early 2000s peak.
it is estimated that in 2017 construction output will be 12% below its 2007 peak and on current projections will probably not return to pre-recession levels until 2022, a 15 year gap instead of the usual decade seen after previous recessions. This is a picture that lends weight to the suggestion that the healing of the construction industry, like that of the UK economy as a whole, will be a slow and difficult process.

6
Introduction
The 2012 Corporate Plan was created against the background of the Government’s decision to ‘retain and reform’ CiTB.
The Board and executive took the opportunity to reshape business strategy, including re-organising it around eight key activities (Attracting Talent, Apprenticeships, Awarding Organisation, Business information Advice and Guidance, directing new Approaches, employer funding, Leadership, Training, Testing and Assessment), mapped to the existing industry challenges which formed the basis for the structure of the plan and performance table.
Key deliverables and targets for 2012 were focused on building foundations for the future and ensuring that the negative impact of the ongoing recession on training and skills needs was minimised.
2012 proved another tough year for the sector, with continuing public expenditure cuts and recession in the wider economy having a particularly severe impact. in this challenging environment, we are pleased to report a range of successes.
Perhaps the most notable success was being rated as ‘Outstanding’ by Ofsted in all three inspection categories: Outcomes for learners, Quality of teaching, learning and assessment, and effectiveness of leadership and management. in addition, we began redeveloping student accommodation on the nCC east campus, and launched the West Midlands Construction UTC (University Technical College) for student intake in September 2014.
Other future-focused achievements during the year were defining and benchmarking the familiarity and favourability of construction careers; developing and agreeing with industry the new definition of competency; and initiating work to rebalance the distribution of levy funds in support of incentivised training, especially in light of the weakening demand for existing grants.
Since Construction4Growth (C4G) launched in September 2012, it has built momentum with more employers pledging support, and a series of parliamentary events taking place covering investment, skills and green issues. The joint investment strategy also led to funding agreements with the Scottish and Welsh governments and in england with the deCC Green deal and UKCeS employer Ownership of Skills projects.
Having a commercial focus, the Cskills Awards accreditation service was launched as planned in July 2012 after a successful pilot scheme. The Health, safety and environment test contract was
re-let with enhanced integrity of testing. in addition, our relationship with CSCS has been refreshed and is progressing towards an agreement on how the scheme will work for industry in the future.
Undergraduate and graduate grant demand exceeded expectations (target one), while apprentice grants came in lower than forecast (target two). extra measures to stimulate training were introduced in the last quarter.
following the launch of the Shared Apprenticeship Scheme, all eight (target three) planned schemes were operational in 2012 (two in Wales and six in england, including one in the specialist sector).
Whilst unable to hit a high target, our framework achievement rates (target four) stayed above the sector average in a market that continues to decline overall.
The number of achievements for national Vocational Qualifications (nVQs) and training qualifications exceeded target (target five), but fell short of 2011 levels.
Since their launch in 2010, the use of business and skills reviews by employers has grown (target six), exceeding target to be much higher than in 2011. While not hitting a stretching target, focused engagement with employers delivered over 17,000 visits (target seven). Grant support for registered employers investing in skills development (target eight) was less than forecast, mainly because of lower than anticipated apprentice grant demand. This was partly offset by higher grant rates later in the year.
At £7m, the contribution from trading income (target nine) was below target despite a rise of 15% in nCC trainee numbers, reflecting tough trading conditions.
employer and stakeholder surveys (target ten) met their target, a positive result given the economic picture. employee engagement (target 11) came in higher than target and 2012 results were extremely positive given the organisation’s implementation of a strategic change programme.
The Board recognised the delivery of a range of positive results against some stretching targets in a challenging environment, and supported steps being taken to address shortfalls and build on these achievements in 2013.
Corporate Performance 2012

7
Introduction
Our performance – impact measures Activity based strategy – industry challenge
2012 Target
2012 Achieved
2011 Achieved
1 Undergraduates and graduates supported via our grants
Attracting Talent – recruitment and retention
3,650 5,275 5,556
2 Apprenticeships supported via our Grants Scheme
Apprenticeships – recruitment and retention
17,500 17,073 18,231
3 Launch further Shared Apprenticeship Schemes
Apprenticeships – recruitment and retention
8 8 -
4 Framework achievement rate (%)
Apprenticeships – recruitment and retention
78% 74% 78%
5 NVQ and training qualifications achieved
Awarding organisation – productivity
56,000/
47,000
56,521/
49,158
63,658/
49,925
6 Business and Skills Reviews delivered with employers
Business information, advice and guidance – employer engagement
1,200 2,026 1,193
7 Employer visits
Business information, advice and guidance – employer engagement
20,000 17,332 18,028
8 Grant available to support registered employers investing in skills development (£m)
employer funding – employer engagement
79.0 78.2 65.7
9 Contribution from trading income (£m)
Running the business
9.0 7.3 1.8
10 Employer/stakeholder satisfaction survey (%)
Running the business
76% / 85% 76% / 85% 76% / 90%
11 Employee engagement survey (%)
Running the business
70% 72% 69%

8
Introduction
CiTB aims to improve the training of people working, or wanting to work, in construction and has been registered as a charity since 1972.
The Board has regard to the Charity Commission’s general guidance on public benefit when planning activities to achieve its aims. Amongst other factors, the Board believes that:
• enhancingtheskillsandcompetenceofpeoplein construction benefits the competitiveness of an industry that employs more than 2.4m people, contributes 8% of UK GdP, and improves the quality of the built environment
• spottingandmitigatingskillsgapsandshortagesand maintaining training capacity is vital to the UK economy
• encouragingindividualstodeveloptheirskillsthrough lifelong learning benefits them personally and contributes to a stable and productive society.
To achieve our aims effectively and efficiently, we collect and make use of personal information about individuals, such as employers, suppliers, apprentices, employees and applicants for posts.
We are committed to protecting the rights and freedoms of individuals in respect of the processing of their personal data, and undertake to comply with our obligations and responsibilities under the data Protection Act 1998 at all times. We ensure that:
• informationisprotectedfromunauthorisedaccess
• integrityofinformationismaintained
• informationisavailablewhenneeded
• regulatoryandlegislativerequirementsaremet
• weconsiderandimplementasappropriateanyrequirements, recommendations and best practice guidance from Government and industry
• FairProcessingNoticesareissuedeachyearasking employers to update the details we hold and giving them the chance to opt in or out of receiving marketing information
• businesscontinuityplansareproduced,maintained and tested
• staffaretrainedtofulfiltheirresponsibilitiestoprocess information securely
• allbreachesofinformationsecurityareinvestigated.
Our aims are delivered mainly by:
• givinggrantstoemployersengagedintraining
• offeringadviceandsupporttoemployersabouttheir training needs
• creatingandmaintainingstandardsandqualifications in consultation with employers
• managingschemesforrecordingachievement
• providingtrainingwherethemarketdoesnotofferadequate coverage.
This report illustrates how in 2012 these aims have been delivered across england, Scotland and Wales.
nearly 14,300 employers received grants towards their training needs during 2012.
details of our financial performance are on pages 22 to 31. information about our performance against other business targets is on pages 6 and 7, analysed by nation in Appendix e, page 75.
Public Benefit
Looking after InformationWe follow Cabinet Office guidance in relation to incidents involving protected personal data.
in 2012, three incidents involved the potential loss of personal data. in each case, one record was affected.
in addition, three encrypted laptops were stolen during the year. Two had been cleaned of data prior to reassignment and were stolen in transit, while the third was lost in a house burglary, in which an encrypted BlackBerry and digital pen were also taken. finally, two encrypted BlackBerrys were reported lost on trains.
These incidents were not reported to the information Commissioner as it was considered that there was immaterial risk of data loss.

9
Introduction
We improved health, safety and environmental management by rolling out OHSAS 18001 (the health and safety standard) and iSO 14001 (the environmental standard) across the business (nCC having gained this certification several years ago). The organisation remains committed to its employees via the development of a strong people strategy and roll-out of the ‘Total Reward framework’, which introduced a system of flexible benefits. We continue to hold investors in People (iiP) accreditation, with an ‘Advanced’ rating, exceeding core standards in many areas.
The ‘Making a difference’ scheme encourages staff to become engaged with CR. in 2011, this was via an award for inventive ways of cutting the organisation’s carbon footprint. The winning entry was a car sharing scheme ‘liftshare’ which generated much interest among staff. in 2012, the scope of the award was widened to encourage greater take up. each director encouraged teams to make a difference by limiting their environmental impact and supporting local communities, with many staff signing a pledge to do so.
The marketplaceOur strategy is to build a reputation as a responsible business, helping to maintain positive relationships in the marketplace with our customers, stakeholders and industry.
One of our 2012 achievements was the ‘Outstanding’ rating in the Ofsted inspection of provision for learners in england. With this powerful external recognition comes enormous responsibility, but we are not complacent. As a leading organisation in the construction industry, we are committed to going beyond expectations in all three nations and will continue to look for opportunities to drive up standards further.
Under the chairmanship of Judy Lowe, we continue to back the industry Leadership Group for fairness, inclusion and Respect (fiR) developing a co-ordinated approach for disseminating good fiR practices across the built environment sector. in 2012, this included the development and successful test phase of the Be faiR framework, a tool tailored for built environment employers to assess and accredit their endeavour to support fiR in their organisations and wider work. The framework will be piloted in 2013 by main contractors and SMes.
We began to embed Corporate Responsibility (CR) principles into the business at the end of 2010, establishing strategy and policy during 2011, and setting goals around four areas of activity: the workplace, the marketplace, the environment and local communities.
Why is CR important to CITB?Growing statutory and regulatory pressure encourages organisations to understand and address a wide range of risks, including their impact on the environment and local communities. Commitment to CR helps businesses differentiate themselves from each other, stimulates innovation, helps maintain a positive reputation among stakeholders and the workforce, and reduces inefficiency. We have approached CR from a continual improvement perspective, aware of the challenge of being a sustainable organisation.
The executive agrees CR strategy and policies, leads staff engagement and monitors the targets which support our balanced scorecard. The organisation was determined to build on progress during 2012, aiming to bring a consistent approach to material CR issues. One of our values emphasises that CR is a key part of our business planning process supported by the Board and the executive.
According to Bridget Plowright (our CR practitioner), “evidence suggests most people want to work for a responsible organisation whose values are consistent with their own. This view is backed by the results of our own employee satisfaction survey. Our CR polices and activities support a values-led and sustainable organisation by encouraging staff to become involved, which leads to healthier communities and ecosystems in which we operate”.
The workplaceOur strategy is to be a good place to work by having policies and systems that support employees and encourage a healthy and effective workplace, creating an environment in which all employees can develop their skills and realise their potential.
Several notable achievements have contributed to this in 2012, including retaining equality Standard accreditation for england, Scotland and Wales, and being upgraded to Gold Award standard. This shows continued commitment to equality and a desire to promote good equality and diversity practice within the workplace and with service users. Wales was also awarded the C2e (Committed to equality) Standard.
Corporate Responsibility

10
Introduction
nCC has a long history of supporting its local communities and at the same time enabling students to gain valuable experience through projects such as providing support for the construction of a new helipad at the Queen elizabeth Hospital in King’s Lynn, and building a scaffolding eiffel Tower for the village of Great Bircham for its annual french day.
We are beginning to develop ways across the organisation of supporting our local communities, as well as working on environmental projects and supporting staff with their personal efforts in charitable events and fundraising.
Our plansWe will continue to build on our progress to ensure that our approach is consistent with stakeholder expectations, and supports organisational values which resonate with staff.
The environmentWe aim to reduce our impact on the environment by understanding what our impact is, and are developing a management system to ensure regulatory compliance and continual improvement across the business.
Having set targets to improve environmental performance, we are monitoring energy use, paper consumption, mileage and waste management. The installation of a biomass boiler at nCC east (Bircham newton) has helped to cut the amount of non-renewable energy used for heating.
We aim to meet the requirements of HM Treasury’s sustainability reporting guidelines by 2014. So in 2013, we will look further at measuring the organisation’s carbon footprint as accurately as possible.
More widely, our environmental management system supports continual improvement in the management of impacts; implementing vehicle fleet management during 2014 will support this further. We will look closely at our climate change risk in terms of our performance on climate change adaptation and mitigation, in line with the Government’s national Adaptation Programme.
The communityOur strategy is to make a positive impact on local communities by identifying social issues pertinent to the organisation within the communities we operate, developing a programme of support for them.
The communities within which we exist and operate are important stakeholders we affect daily just by our existence.

Business Activities
11
LeadershipThe prime focus in 2012 was on Construction4Growth, a campaign created jointly with many of the sector’s trade associations aimed at persuading Government that investment in construction is vital for delivering economic growth. This included an event at 11 downing Street in early January 2013, preceded by three House of Commons lunches with key MPs and stakeholders. Getting the sector to speak with a single voice on issues of importance to it is vital if messages are to be heard by policymakers.
A range of activities aimed to drive forward issues of importance to the sector. for example, 2012 saw CiTB facilitate sector support for the Government’s employer Ownership of Skills pilot. We are now managing a project submitted by a group of employers that is worth £15m, which adds public funding to the sector’s investment. it will deliver a range of interventions, including work experience, pre- and initial employment, Apprenticeships, upskilling, and leadership and management. The project incorporates specialist skill requirements, sustainability and building information modelling.
Our Skills Strategy team engaged with all 39 Local enterprise Partnerships across england, with key cross industry objectives and priorities being represented through interventions that included localism dinners, builders’ breakfasts, LMi, and the alignment of objective messaging on the importance of Construction for Growth in each locality. This activity has been well supported by our employer-led Skills for Growth forums and federations.
Working in partnership with other Sector Skills Councils (SSCs) across the built environment in the Green deal Skills Alliance, we established six exemplar projects and undertook a baseline survey of skills activity within the Green deal. We also delivered the competency framework that supported the Green deal.
Employer fundingThe Board’s focus during 2012 was on ensuring support for training was deployed effectively through the Grants Scheme and other ways of encouraging employers to continue to train. it agreed to boost key grant rates, to make more funds available to Training Groups and allocated money to some specific interventions. These included the Growth fund, Management and Supervisory development Programme and associated transition funds, which together delivered 94 projects, helping the industry to develop skills and business growth in a range
of subjects, including sustainability, leadership and management, specialist and new technologies.
The Growth fund also contributed to joint-funded initiatives such as the Green deal, which gave significant support for specialist sectors, such as insulation, by developing key skills and competencies. This resulted in increased confidence and enabled improved business opportunities. Other well-received Growth fund allocations include stimulating skills development in order to prepare the industry for the nuclear new build programme, and for joint construction skills investment initiatives with both the Scottish and Welsh governments.
ApprenticeshipsLast year’s recruitment of 3,606 apprentices was an increase on 2011 and ahead of our target, and achievement rates stayed well above the sector average. Achieving growth in present conditions is a tribute to the work of our field teams in promoting the benefits of Apprenticeships to industry and employers.
near the end of 2012, our Apprenticeship provision (managed by employer services teams across england) was inspected by Ofsted. its overall judgment was Outstanding (Grade 1), made up of Outstanding assessments in each of the three main categories of Management and leadership, Outcomes for learners, and Teaching and learning. This is the first time we have been awarded such a grading. it reflects extremely well on the work undertaken by our teams and our ability to act as the leadership body for Apprenticeships in the construction sector.
during 2012, we launched our Shared Apprenticeship Schemes, which are now ahead of schedule, with five operating with partners across england and others due to start recruitment during 2013. Shared Apprenticeship Schemes deliver extra skills and Apprenticeship opportunities, and were cited as an excellent example of a sector skills intervention by Ofsted. We are also strengthening partnership working across the college network, with nine centres joining our new supplementary agreement, under which CiTB takes responsibility for learner management and the performance of all construction apprentices. in addition, during 2012, we introduced our first Higher Apprenticeship in Construction Management.
for the specialist sector, the national Specialist Accredited Centre (nSAC) delivered more than 1,300 n/SVQs across some 60 occupations.
CITB in England

Business Activities
12
engaged with the programme during 2013 as well as diversifying into adult upskilling and working with unemployed people with a construction background.
Keeping construction on the agenda as a potential career at a time of recession is difficult, but there are always opportunities to showcase the range and relevance of the industry to potential recruits. for example, we have developed an online all-age careers progression mapping tool which will go live in 2013. This will be of significant benefit to individuals seeking to enter or re-enter the industry, as well as employers, careers advisors and influencers.
We worked with the British Science Association to pilot the CReST Award for construction (with 45 students participating) which will be rolled out across the country after its successful trial in 2012.
We worked with employers and stakeholders to maximise the number of University Technical Colleges (UTCs) engaging with the development of a construction-related principal learning qualification. At present, there are five approved construction specialist UTCs (including our own, due to open in September 2014). We also engaged with early adopters of the studio school approach and stakeholders to ensure they are involved in the ongoing development of high quality construction-related qualifications to replace the CBe diploma.
The national Skills Academy for Construction was recognised by the Association of Consultant Architects for the development of the early Contractor engagement supplementary guidance as part of the Client Based Approach. CiTB received the innovation Award for leading partnering within the sector, with 190 clients being engaged over 2012.
in 2012, national Skills Academy for Construction projects delivered 240 Apprenticeship starts, 76 full Apprenticeship framework completions, 333 structured work experience placements for 14-19 year olds, 684 construction jobs advertised in local communities, 485 pre-employment courses, leadership and management training for 249 construction supervisors and managers. 92 supply chain subcontractors implemented or renewed company training plans as a result of their involvement in a Skills Academy.
in addition, 4,477 students were engaged through specific curriculum support activities run or supported by Skills Academy employers, with a further 3,720 students engaged in careers events, with much of this activity involving the 59 new construction ambassadors trained through Skills Academies in 2012.
To help people displaced by redundancy to rejoin the sector, the national Specialist Team (nST) introduced Specialist Upskilling Programmes (SUPs), which allow those with some construction-related skills and knowledge to train and qualify in a specialist trade within a reasonable timescale.
nST worked with the national Specialist Contractors Council (nSCC) to pilot a sector-specific model training plan designed to help specialist employers to access grants towards the cost of training.
The development of a federation-linked Shared Apprenticeship Scheme with the Hire Association europe (HAe) recognises the national rather than regional model of operation in the specialist sector.
Business Information, Advice and Guidance (BIAG)during 2012, staff undertook more than 14,000 visits to employers, helping them to access value-added products and services, such as Business and Skills Reviews (BSRs). Our aim is to support employers’ business planning, identifying training needs and improving productivity as we move our advisory offer towards closer partnership working that is focused upon business improvement. Company development advisors carried out 1,800 business and skills reviews with in-scope employers, including 200 aimed specifically at developing new business and skills in emerging markets such as nuclear and Green deal, through our Equipped4 BSR range.
We held advisory forums in each region of england during the year. These give in-scope companies, predominantly SMes, the chance to engage directly with their industry training board and make proposals that can shape and improve the products and services they receive. As a result of employer requests, we are increasing the number of events held in 2013 and will launch employer workshops aimed at delivering business advice, accreditations, and skills development relevant to companies by size and sector.
Attracting TalentOur careers advisors delivered 593 schools events across england during 2012. These are primarily focused on promoting the construction industry as a career of choice and are often co-presented with one of our industry construction ambassadors.
Our work experience scheme ‘experience Construction’ has been very successful both for young people and employers. 525 young people joined the programme during the year, with some 75% going on to secure a full-time Apprenticeship with the employer. We aim to increase the numbers
Business Activities
13
As part of the continuing review of our products and services, during 2012, we completed a major rewrite and repackaging of the Ge700 Construction site safety manual, turning it into a modular and more accessible format for launch in January 2013.
We also worked with (and received funding from) deCC to deliver the first tranches of training on Solid Wall insulation to support the Green deal initiative. We also piloted and soft-launched a scheme with several major contractors to map and accredit in-house training courses.
Registrations for sector qualifications offered by the Construction Awards Alliance were affected by the general decline in training across the sector. nonetheless, 128,000 registrations were recorded in 2012 across Great Britain, 117,000 of which were in england.
The National Construction College (NCC)The Outstanding grade given by Ofsted at the end of 2012 to CiTB’s Managing Agency was a huge achievement to which nCC contributed, and it is a credit to the whole team that the quality of its teaching, learning and assessment has been so resoundingly recognised. But this was not the only third party endorsement in 2012. Apart from the British Safety Council’s 5-star Health and Safety Award and presentation of the Sword of Honour to nCC Scotland at inchinnan, the reaccreditation of our BSi Standards (Management, environment and Health and Safety), equality and diversity standard and matrix (our information, Advice and Guidance Standard) were all substantial achievements.
The building of two new accommodation blocks at Bircham newton and the securing of funding for a third has created a real sense of transformation there. With the Tunnelling and Underground Construction Academy (TUCA), nCC embraced a new centre and new products, including two new Apprenticeship programmes in Sprayed Concrete Lining and Tunnelling Operations, as well as a more standard Plant Mechanics Apprenticeship. in all, there are four Apprenticeship groups running and two more will start in late January 2013.
A positive feeder for the Apprenticeship has been our pre-employment programmes. Previously delivered through an eSf project (which saw nCC deliver training to more than 1,200 unemployed learners) and more recently utilising the Adult Skills Budget, we have created courses tailored to Crossrail’s Labour forecasting Tool. in addition, we have been successful in running workforce development courses in areas including Gantry Crane, Locomotive Training and Assessment,
Major projectsThis initiative was introduced to help to identify solutions required by the industry to the employment and skills challenges associated with large infrastructure projects. These include the effective co-ordination of skills provision and the development of the right training and education, the use of accurate relevant information in planning, and the early engagement of a range of stakeholders to maximise the employment and skills dividend.
in 2012, we engaged with the UK nuclear new Build programme, Thames Tideway, High Speed 2, and the Vauxhall nine elms Battersea redevelopment.
We have already achieved significant success in engaging with critical stakeholders, and we have learnt valuable lessons as a result of engaging with the UK’s nuclear new build programme. These have come particularly through our efforts to support the sector employment and skills agenda through engagement with the nuclear environment Skills Alliance and by working closely with the client and contractors on the edfe Hinkley Point project. A wide range of new qualifications has been developed to support this and the wider construction industry, including a new institute of Leadership and Management qualification and a new Apprenticeship for Steel fixing as well as a new test to prove competency in nuclear builds.
Trading2012 was a difficult year for our trading operations, as construction businesses cut back on training and development. fewer people completed qualifications, attended training programmes, applied for record cards or undertook testing than expected. nevertheless, there were some significant achievements and close attention to costs enabled us to continue to provide the sector with high quality, good value provision.
during 2012, the familiar Health and Safety (H&S) test was updated to become the Health, safety and environment test (HS&e) to reflect the changing needs of the sector. At the same time, a new supplier, Pearson-VUe, took over from our previous contractor, Prometric. The handover was not as smooth as we had hoped, and we are grateful for the patience of customers while we overcame these teething troubles.
The test is delivered from two types of centre. Most tests are taken at centres operated by Pearson-VUe, with a smaller number at independent providers known as internet test centres (iTCs). The overall pass rate in 2012 was 79.3%, with 462,000 tests booked in england alone.

Business Activities
14
it also delivered successful pre-employment and work-based training programmes, engaging with further education institutions and universities across all three nations. Plans to open the first construction-focused University Technical College (UTC) in Walsall – closely linked with nCC – are well advanced.
nCC developed several new products during the year, some in partnership with others, and continues to engage with local communities by supporting community projects, offering taster sessions for schools and running events for careers advisors.
Sprayed Concrete Lining, Tunnel Safety Card, SMSTS, SSSTS, PASMA, CSCS and, more recently, Confined Space/Self Rescue training, which we now have awarding body accreditation to deliver and expect to be running these courses weekly.
in a demanding year, when the industry contracted, nCC increased the number of learners it served and managed to raise income levels by doing business with more customers.
nCC recognised the achievements of its learners and their supporting employers through popular awards ceremonies. Learner feedback shows how positively learners rate their training. it was also great to see nCC apprentices participating in and winning awards at SkillBuild.
in 2012, nCC took on six apprentices of its own, showing its commitment to training the next generation.

Business Activities
15
LeadershipThe Scottish housing market remains volatile and is likely to remain so until mortgages are easier to secure. The Scottish Government supported the Mi new Home scheme launched in September 2012, which offers 95% mortgages. it is hoped this will have an impact in 2013 as more lenders join.
We play a major role in consultation over sustainable housing and construction procurement, having met Scottish Government representatives and the Chair/deputy Chair of the Procurement Review. We influence processes such as Standard PQQs, combined consents, social/economic benefits of contracts, community benefit clauses and whole life values. Our client-based approach – linking procurement to training – helps maximise Apprenticeship opportunities on major contracts.
This has been well received with all five of the Scottish futures Trust hubs. We are discussing with local authorities, housing associations, the Big Lottery fund, Historic Scotland, Transport Scotland, and the nHS the potential for them to adopt this approach. We continue to work with big projects like the Southern General Hospital and new forth Crossing.
This connects well with the Linking Training to Procurement project, part of our Joint investment Strategy (JiS). We ran several workshops across Scotland to raise awareness of the procurement approaches. five of the workshops focused on clients to raise awareness and identify opportunities for using the guidance across forthcoming procurements. A further five were run for employers to raise awareness of the approaches and to embed them into their responses to tender documentation, and to help SMes understand how to maximise their chances of successful bidding.
Our strategy team has now had contact with some 54 clients to adopt the client-based approach and we have written confirmation from local authorities who wish to adopt it once procurement begins.
The JiS will be a focus of PR activity in 2013 and projects such as the Constructionarium and augmented reality are likely to be popular in the media. Along with On Site and Women in Construction, these projects show strong working relationships with universities and all parties benefit from the resulting knowledge transfer in areas such as health and safety and project management. Other areas of the JiS will benefit recruitment under the Pre-Voc project.
Attracting TalentWe worked with several partners to promote Scottish Apprenticeship Week, which began on 21 May 2012. it opened at edinburgh Castle with a traditional skills demonstration for stonemasonry and roofing involving nfRC, Telford College, Historic Scotland and CiTB. fiona Hyslop, Cabinet Secretary for Culture and external Affairs, opened the event.
Apprenticeship Week school visits to the Commonwealth Games village in Glasgow were facilitated by Mactaggart and Mickel Ltd, providing information about the massive planning and contractual processes involved in building such a project. This gave a greater breadth of knowledge to schools about the industry, and how all areas of construction come together to complete projects of this size. This was attended by Shona Robison, Minister for Commonwealth Games and Sport.
employer events were staged in edinburgh, Perth and Glasgow, providing information on employment legislation and the availability of CiTB grants. Orkney Construction Training Group supported a competition for 2nd year pupils, and inverness College provided the facility for an Active Schools network event for primary school pupils in the Highland area. A site visit to the new University of the Highlands and islands was also organised.
new Modern Apprenticeship frameworks are now available for Specialist Apprenticeships at SVQ Level 2, Craft Apprenticeships at SVQ Level 3 and Technical, Supervisory and Management Apprenticeships at SVQ Levels 3, 4, and 5. Work is underway with the institution of Civil engineers to link their technical membership with the Modern Apprenticeship in Civil engineering. it is anticipated that this model can be widened to include RiCS, CiAT and CiOB, to link their associated membership schemes to a Modern Apprenticeship.
Business – Information, Advice and Guidance (BIAG)The Construction Scotland annual conference on 22 October 2012 saw the ministerial launch of the new industry strategy Building for the future. following this successful event, Construction Scotland will progress with the development of the industry Leadership Group (iLG) and the Theme and Working Groups in line with the strategy document and developing action plan. We continue to be represented on the Board of this organisation.
We recently took part in a ministerial summit entitled investing in Scotland Building Traditions, attended
CITB in Scotland

Business Activities
16
CiTB in Scotland has worked in partnership with SQA, SBATC and SPAdAC to consult with employers to ensure that Apprenticeship training meets industry’s current and future requirements. This has resulted in industry steering groups being established to review the knowledge-based training qualifications for the main crafts. new tailored frameworks have been set up in response to employer demand, such as interior Partitioning Modern Apprenticeship Level 2 course for 30 operatives at the Southern General site.
in 2011/12, 613 Specialist Modern Apprenticeships were started and an increase was forecast. The early figures suggest that a continuing rise in Specialist Apprenticeships is likely. Overall growth in MA recruitment is forecast for Traditional Crafts at SVQ Levels 2 and 3. These numbers will be strengthened by the uptake of new Modern Apprenticeships at SVQ 2 in Roof Tiling, Lead Roofing and Timber frame erection.
College attendance patterns are to change after consultation with SBATC and SPAdAC. The number of weeks in years 1 and 2 will be reduced so that a week in years 3 and 4 can be introduced. This will enable craft apprentices to practise the skills required for the skills test and give centres access to apprentices throughout the four years of the Apprenticeship. in 2011 skills testing in eight different occupations by 2,296 apprentices was carried out. A new skills test for floor Covering at SVQ Level 3 will be developed in 2013.
There are currently 41 colleges in Scotland; however the college sector has been largely unreformed in the last 20 years. The Scottish Government has been looking at how to improve the way colleges are funded and, following consultation, has confirmed 12 college regions working with individual colleges and the Scottish funding Council to put the necessary arrangements into place from 2012-13. This will result in a number of colleges merging or working in much closer collaboration.
by fiona Hyslop, Cabinet Secretary for Culture and external Affairs. This was organised by Historic Scotland (Alba Aosmhor) and the Cabinet Secretary highlighted the work we will be doing in this area. This project will use our client-based approach benchmarks to identify and monitor suitable employment and skills outcomes by type and value of activity in a geographic area.
We continued to deliver Green deal workshops as part of the Joint investment Strategy, with good delegate feedback. Workshops have been held in dumfries, inverness, Aberdeen, Arbroath, edinburgh, Glasgow, Orkney and Shetland.
not only do we have a new sector skills agreement with Historic Scotland but also a MOU with them and SQA. One of their stated priorities is to grow Scotland’s construction industry through increasing availability and quality of traditional skills.
We continue to brief politicians, meeting regularly with nicola Sturgeon, deputy first Minister and Cabinet Secretary for infrastructure, Capital investment and Cities, Margaret Burgess, Minister for Housing and many others. We also attended the Scottish economic forum – a meeting with the Scottish Cabinet including the first Minister. This gives us high level leverage to influence Scottish Government policies for the benefit of the sector in Scotland and to bring key sector status.
ApprenticeshipsThe market remains a mixed bag and, while some elements of the industry are thriving, others are struggling. The number of redundant apprentices reduced in 2012, which is encouraging. We have been successful in restarting some 80% of redundant apprentices through our Managing Agency since the recession started. Another encouraging factor is that we saw a 15% increase in the number of new entrants registering for a Modern Apprenticeship in 2012 compared with 2011.
in response to the Scottish Government’s youth employment Strategy we would highlight that over 75% of our total entrants are 16-19 year old apprentices. We will also mirror Construction Scotland’s recently published strategy to concentrate on apprentice completion rates, which plays well into our record of restarting redundant apprentices.

Business Activities
17
Leadershipduring 2012, relationships with Assembly Members and the Welsh Government deepened through regular meetings and briefings which helped to ensure there were effective flows of information between the industry in Wales, industry stakeholders and CiTB.
This led to a Joint investment Strategy agreed with BeTS (the Welsh Government department responsible for supporting the construction sector panel) and a proposal for £4m of business support for the sector. This partnership approach relies on CiTB having an excellent understanding of the sector’s concerns and needs, and will deliver a tailored package of support for companies ranging from awareness-raising workshops to bespoke consultancy and practical support in iT exploitation.
By working with the three regional forums (Professional Services, CSn, Qualifications and Traditional and Sustainability groups – all employer-led) we actively engage with over 4,000 construction companies and have been building on our reputation as the leadership body for the sector. This is shown in our responses to consultations and the evidence given (both written and verbal) to several national Assembly for Wales committees. These have either been supported by members of the industry or soundings taken at meetings to ensure we give an industry view. This method recognises regional differences in Wales and acknowledges the wide range of companies which make up the sector – which we help present as one voice through the national Wales Construction Skills Group.
As the recognised voice of the industry, we represent the sector on several Welsh Government bodies. Aware of industry concerns about procurement policies in Wales, including the lack of an overall strategy for a process which is complex, burdensome and costly to smaller companies, and in which regulations create a barrier between procurers and communities, we worked with Value Wales on the construction procurement strategy steering group to develop a construction procurement strategy and action plan. This supports implementation of the strategy and will ensure it remains fit for purpose, linking to the Welsh Government’s work on assessing and addressing capacity and capability within Welsh public sector procurement.
We represent the sector on the Community Benefits Task Group, established by the finance Minister with the aim of strengthening social and economic
benefits delivered through public procurement. its community benefits approach encourages contractors to deliver wider outcomes within contracts, via ‘social clauses’ that require each tenderer to develop plans for providing benefits such as training, employment, work experience, the use of supported businesses and local supply chains.
To help the sector to achieve these ambitions, we expanded the Shared Apprenticeship Scheme, launching a second scheme with Melin Homes, which will operate across South east Wales. it includes housing associations, local authorities and other public sector clients, and promises to be substantial, being planned to grow from 35 starts in 2012 to 60 in 2013.
despite the challenging industry environment, our activity in 2012 remained strong. Apprenticeship recruitment defied the overall downward employment trend, with nearly 600 apprentice and over 300 Pathways to Apprenticeships (PTA) starts. This testifies to employers’ ongoing commitment to Apprenticeships and to the strategic vision of the Welsh Government and public sector clients to implement community benefits in public sector procurement. Quality remains high and we expect the final framework completion successes to be over 75%.
The Cross Party Group heard from representatives from each regional forum and professional services group on issues affecting or that could have an effect in the industry including BReeAM, Building information Modelling (BiM), building regulations, planning and housing and community benefits. At members’ request, we circulate briefing papers to all the main political parties, to aid understanding of these issues as well as the solutions the sector feels will help ensure Wales has a world class construction industry.
during 2012, we completed the first round of both the delivering Low Carbon Skills (dLCS) and Research into Transformational Change Sector Priorities fund Programme (SPfP) projects. The dLCS project successfully trained over 600 people and helped to develop the capacity of the training provider network so that they can deliver low carbon training for the built environment workforce, upskill the built environment workforce in Wales, and test employer demand for upskilling their workforce with low carbon skills.
After the publication of a report produced by the Research into Transformational Change project, a working group was set up to discuss its
CITB in Wales

Business Activities
18
Our CSn data shows that the next few years will be challenging. The 20 Twenty Leadership Programme provides practical, people-oriented management skills, to help business leaders deliver profitable growth, encourages them to adapt flexibly to change and gives them the skills to compete in an increasingly difficult trading environment. To date, we have registered more than 30 candidates from a wide range of construction companies.
in addition, our Company development Advisors (CdAs) have undertaken a rigorous exercise to become Sfedi-accredited and have been working to support the Growth fund supported fMB Build Project, aiming to develop a number of key performance indicators which result in a BUiLd scorecard approach to planning, monitoring and reporting construction business growth.
Apprenticeships2013 promises to be more challenging for Apprenticeships, as we seek to expand Shared Apprenticeship Schemes to north Wales and to grow civil engineering-focused provision. Our CdAs will work with the construction sector team via the Joint investment Strategy programme (Construction futures Wales) to deliver business diagnostics.
Building on the success of our SPfP projects we will engage with industry and training providers to help inform future project proposals at the planning phase to ensure a more cohesive approach in time for further funding calls. initial discussions show areas for investigation in green skills with an emphasis on retrofit and multi-skilling, especially refurbishment and new qualifications, including a Level 3 professional pathway bridging course and Higher Apprenticeships.
The work of our construction careers advisors has attracted plaudits from schools and Careers Wales and we will aim to capitalise on this in 2013 by ensuring that creating the right message and image to those considering a career in construction is integral to our recruitment strategy.
Collaboration with Cardiff University’s Welsh School of Architecture via the Built environment Sustainability Training (BeST) project has continued. We are developing a ten-year educational strategy and training delivery roadmap, and will offer sustainability and equality related training and learning at Level 4 and above to construction employees and professionals in the industry.
2013 will also see further development work being undertaken with iCe on Technical Apprenticeships.
recommendations and produce an action plan which prioritised those points requiring implementation over the short term. One of these was the need to establish a transparent governance structure with a shadow management group to drive forward the realisation of a responsive and effective network of skills delivery services for the sector.
We played an important role in several positive developments and opportunities to improve learning prospects across the industry and within schools and further education colleges. Most significant will be the outcome of the review of qualifications commissioned by the Welsh Government, which could radically change the Welsh education and training environment and will seek to improve the range of qualifications available. in anticipation, we worked closely with WJeC (Welsh Joint education Committee) to develop new qualifications in construction (similar to the GCSe) which will be suitable for 14-16 year old learners. in addition, one of the outcomes of CiTB’s review of the construction qualifications strategy was a Welsh action plan. employer input was critical in its development. The action plan emphasises that construction Apprenticeships should be at a minimum of Level 3, the development of Higher Apprenticeships and enabling provision for traditional skills to be mainstreamed.
in addition, we worked with the Welsh Government, the Welsh Awarding Body (AGORed) and a specialist company in Powys to accredit units relating to airtight testing. This training will be the first training in construction to be accredited via the Quality Assured Life Long Learning pillar of the Credit and Qualifications framework for Wales.
Throughout 2012, we have sought to develop new markets for CiTB’s products and services in Wales and are pleased to have gained endorsement from the industry and Welsh Government for the first national Skills Academy for Construction in Wales. The £100m Heads of the Valley upgrade project (the first stage of which is managed by Carillion) has been identified by the Welsh Government and Blaenau Gwent Council as a key opportunity to provide value-added training and employment to the area which has suffered from low skills and high unemployment.
Capitalising on collaborative work done with the enhancing Leadership and Management Skills (eLMS) programme, we have worked with Cardiff Metropolitan University to create a construction-specific leadership programme.

19
Gweithgareddau Busnes
yn ystod 2012, mae perthnasau rhwng Aelodau Cynulliad a Llywodraeth Cymru wedi dwysáu trwy gyfarfodydd a briffiau rheolaidd a helpodd i sicrhau yr oedd yna lifoedd effeithiol o wybodaeth rhwng y diwydiant yng nghymru, rhanddeiliaid diwydiant a CiTB.
Arweiniodd hwn at Strategaeth Cyd-fuddsoddi a gytunwyd arni â BeTS (yr adran yn Llywodraeth Cymru sy’n gyfrifol am gefnogi’r Panel Sector Adeiladu) a chynnig am £4m o gymorth busnes ar gyfer y sector. Mae’r dull partneriaeth yn dibynnu ar allu CiTB i ddeall pryderon ac anghenion y sector yn drwyadl a bydd yn darparu pecyn teilwredig o gymorth ar gyfer cwmnïau, yn amrywio o weithdai codi ymwybyddiaeth i ymgynghoriaeth bwrpasol a chymorth ymarferol ar ddatblygu TG.
Trwy weithio â’r tri fforwm rhanbarthol (Gwasanaethau Proffesiynol, Rhwydwaith Sgiliau Adeiladu ((CSn)), Grwpiau Cymwysterau a Grwpiau Traddodiadol a Chynaliadwyedd -y mae pob un ohonynt yn cael eu harwain gan gyflogwyr) rydym yn ymgysylltu’n weithredol â dros 4,000 o gwmnïau adeiladu ac wedi bod yn adeiladu ar ein henw da fel corff arwain y sector. dangosir hwn yn ein hymatebion i ymgynghoriadau a’r dystiolaeth a roddir (yn ysgrifenedig ac ar lafar) i amryw o bwyllgorau Cynulliad Cenedlaethol Cymru. Mae’r rhain naill ai wedi’u cefnogi gan aelodau o’r diwydiant neu recordiadau a gymerwyd mewn cyfarfodydd i sicrhau ein bod yn rhoi barn y diwydiant. Mae’r dull hwn yn cydnabod gwahaniaethau rhanbarthol yng nghymru a’r ystod eang o gwmnïau sy’n ffurfio’r sector – rydym yn helpu i’w cyflwyno fel un llais trwy Grwp Sgiliau Adeiladu Cymru cenedlaethol.
fel llais cydnabyddedig y diwydiant, rydym yn cynrychioli’r sector ar nifer o gyrff Llywodraeth Cymru. Trwy fod yn ymwybodol o bryderon y diwydiant ynglyn â chyrff caffael yng nghymru, gan gynnwys diffyg strategaeth gyffredinol ar gyfer proses sy’n gymhleth, beichus a drud i gwmnïau llai, a lle mae rheoliadau’n creu rhwystr rhwng caffaelwyr a chymunedau, gweithiom â Gwerth Cymru ar y Grwp Llywio Strategaeth Caffael Adeiladu i ddatblygu Strategaeth Caffael Adeiladu a chynllun gweithredu. Mae hwn yn cefnogi gweithrediad y Strategaeth a bydd yn sicrhau ei bod yn aros yn addas i’r diben, yn cysylltu â gwaith Llywodraeth Cymru ar asesu a mynd i’r afael â chapasiti a galluogrwydd o fewn caffael sector cyhoeddus Cymru.
Rydym yn cynrychioli’r sector ar Grwp Gorchwyl Manteision Cymunedol a sefydlwyd gan y Prif Weinidog â’r nod o gryfhau buddiannau
cymdeithasol ac economaidd a ddarperir trwy gaffael cyhoeddus. Mae ei ddull Manteision Cymunedol yn annog contractwyr i ddarparu deilliannau ehangach o fewn contractau, trwy ‘gymalau cymdeithasol’ sy’n gofyn i bob tendrwr ddatblygu cynlluniau am ddarparu buddiannau megis hyfforddiant, cyflogaeth, profiad gwaith, defnydd busnesau a gynorthwyir a chadwyni cyflenwi lleol.
i helpu’r sector i gyflawni’r uchelgeisiau hyn, ehangom y rhaglen Brentisiaeth a Rennir, yn lansio ail gynllun â Chartrefi Melin a fydd yn gweithredu ar draws de-ddwyrain Cymru. Mae’n cynnwys Cymdeithasau Tai, awdurdodau lleol a chleientiaid sector cyhoeddus eraill, ac mae’n addo bod yn sylweddol, â chynlluniau i’w thyfu o 35 o leoliadau dechrau yn 2012 i 60 yn 2013.
er amgylchedd heriol y diwydiant, arhosodd ein gweithgaredd yn 2012 yn gryf. Beiddiodd y broses recriwtio prentisiaeth y duedd gyflogaeth gyffredinol ar i lawr â bron 600 o leoliadau dechrau i brentisiaid a dros 300 o leoliadau dechrau ar Lwybrau at Brentisiaethau (PTA). Mae hwn yn tystio i ymrwymiad parhaus cyflogwyr i Brentisiaethau ac i weledigaeth strategol Llywodraeth Cymru a chleientiaid Sector Cyhoeddus i weithredu Manteision Cymunedol ym mhroses gaffael y sector cyhoeddus. Mae ansawdd yn aros yn uchel ac rydym yn disgwyl i lwyddiannau Cwblhau fframwaith terfynol fod yn fwy na 75%.
Clywodd y Grwp Trawsbleidiol gan gynrychiolwyr o bob fforwm rhanbarthol a’r Grwp Gwasanaethau Proffesiynol ar faterion sy’n effeithio ar neu a allai gael effaith ar y diwydiant gan gynnwys BReeAM, Modelu Gwybodaeth Adeiladu, Rheoliadau Adeiladu, Cynllunio a Thai a Manteision Cymunedol. yn ôl gofyn aelodau, rydym yn cylchredeg papurau briffio i bob un o’r prif Bleidiau Gwleidyddol i gynorthwyo dealltwriaeth o’r materion hyn yn ogystal â’r datrysiadau y mae’r sector yn teimlo y byddant yn helpu i sicrhau bod gan Gymru ddiwydiant Adeiladu o safon fyd-eang.
yn ystod 2012, cwblhaom rowndiau cyntaf projectau Rhaglen y Gronfa Blaenoriaethau Sector (SPfP) “darparu Sgiliau Carbon isel” (dLCS) ac “ymchwil i newid Trawsffurfiol”. Hyfforddodd y project dLCS dros 600 o bobl yn llwyddiannus a helpodd i ddatblygu capasiti rhwydwaith y darparwyr hyfforddiant fel y gallant ddarparu hyfforddiant carbon isel ar gyfer gweithlu’r amgylchedd adeiledig, uwchsgilio gweithlu’r amgylchedd adeiledig yng nghymru a phrofi galw ymhlith cyflogwyr i uwchsgilio’u gweithluoedd â sgiliau carbon isel.
CITB yng Nghymru

20
Gweithgareddau Busnes
flynyddoedd nesaf yn heriol. Mae’r rhaglen arwain 20 Twenty yn darparu sgiliau rheoli ymarferol, sy’n canolbwyntio ar bobl i helpu arweinwyr busnesau i ddarparu twf proffidiol, yn eu hannog i addasu’n hyblyg i newid ac yn rhoi’r sgiliau iddynt i gystadlu mewn amgylchedd masnachu sy’n fwyfwy anodd. Hyd yn hyn, rydym wedi cofrestru mwy na 30 o ymgeiswyr o ystod eang o gwmnïau adeiladu.
yn ogystal, mae ein Cynghorwyr datblygu Cwmnïau (CdAau) wedi ymgymryd ag ymarfer llym i ddod yn achrededig gan Sfedi ac maent wedi bod yn gweithio i gefnogi Project Adeiladu ffederasiwn y Meistr Adeiladwyr a gefnogir gan y Gronfa Twf, sy’n anelu at ddatblygu nifer o ddangosyddion Perfformiad Allweddol sy’n diweddu â dull cerdyn sgorio BUiLd tuag at gynllunio, monitro ac adrodd twf busnes adeiladu.
PrentisiaethauMae 2013 yn addo bod yn fwy heriol ar gyfer prentisiaethau, wrth i ni chwilio i ehangu Cynlluniau Prentisiaeth a Rennir yng ngogledd Cymru a thyfu darpariaeth a ffocysir ar Beirianneg Sifil. Bydd ein CdAau’n gweithio â’r Tîm Sector Adeiladu trwy’r Rhaglen Strategaeth Cyd-fuddsoddi (“dyfodol Adeiladu Cymru”) i gyflenwi diagnosteg busnes.
yn adeiladu ar lwyddiant ein projectau SPfP, byddwn yn ymgysylltu â diwydiant a darparwyr hyfforddiant i helpu i hysbysu cynigion project dyfodol yn y cyfnod cynllunio i sicrhau dull mwy ystyrlon mewn amser ar gyfer galwadau ariannu pellach. Mae trafodion cychwynnol yn dangos meysydd i’w hymchwilio mewn Sgiliau Gwyrdd â phwyslais ar retroffitio ac amlsgilio, yn arbennig ailwampio a chymwysterau newydd gan gynnwys cwrs pontio Llwybrau Lefel 3 a Phrentisiaethau Uwch.
Mae gwaith ein Cynghorwyr Gyrfaoedd Adeiladu wedi denu cymeradwyaeth gan ysgolion a Gyrfa Cymru a byddwn yn anelu at gyfalafu ar hwn yn 2013 gan sicrhau bod trosglwyddo’r neges a delwedd gywir i’r rheiny sy’n ystyried gyrfa mewn Adeiladu’n gyfannol i’n strategaeth recriwtio.
Mae gwaith ar y cyd ag ysgol Saernïaeth Cymru Prifysgol Caerdydd trwy broject Hyfforddiant Cynaliadwyedd yr Amgylchedd Adeiledig (BeST) wedi parhau. Rydym yn datblygu strategaeth addysg a rhaglen fapio darpariaeth hyfforddiant 10 mlynedd, a byddwn yn cynnig hyfforddiant sy’n ymdrin â chynaliadwyedd a chydraddoldeb ar Lefel 4 ac uwch i gyflogeion adeiladu a phobl broffesiynol yn y diwydiant.
Bydd 2013 hefyd yn gweld gwaith datblygu pellach yn cael ei wneud â Sefydliad y Peirianwyr Sifil (iCe) ar Brentisiaethau Technegol.
Ar ôl i adroddiad a gynhyrchwyd gan y project ymchwil i newid Trawsffurfiol gael ei gyhoeddi, sefydlwyd gweithgor i drafod ei argymhellion a chynhyrchu cynllun gweithredu a oedd yn blaenoriaethu’r pwyntiau hynny a oedd angen eu gweithredu dros y tymor byr. Un o’r rhain oedd yr angen i sefydlu strwythur llywodraethu tryloyw â Grwp Rheoli Cysgodol i yrru gwireddiad rhwydwaith ymatebol ac effeithiol o wasanaethau darparu sgiliau i’r sector yn ei flaen.
Chwaraeom rôl bwysig mewn nifer o ddatblygiadau a chyfleoedd cadarnhaol i wella rhagolygon dysgu ar draws y diwydiant ac o fewn ysgolion a Cholegau Addysg Bellach. yr elfen fwyaf arwyddocaol fydd canlyniad yr adolygiad o gymwysterau a gomisiynwyd gan Lywodraeth Cymru, a allai wneud newidiadau radical i amgylchedd addysg a hyfforddiant Cymru a fydd yn chwilio i wella’r ystod o gymwysterau sydd ar gael. Mewn disgwyliad, gweithiom yn agos â CBAC (Cyd-bwyllgor Addysg Cymru) i ddatblygu cymwysterau newydd mewn adeiladu (yn debyg i’r TGAU) a fydd yn addas i ddysgwyr 14-16. yn ogystal, un o ddeilliannau adolygiad CiTB o Strategaeth Cymwysterau Adeiladu oedd Cynllun Gweithredu Cymru. Roedd mewnbwn cyflogwr yn gritigol wrth ei ddatblygu. Mae’r cynllun gweithredu’n pwysleisio’r awgrymiad y dylai Prentisiaethau Adeiladu fod ar isafswm o Lefel 3, yr angen i ddatblygu Prentisiaethau Uwch a galluogi i ddarpariaeth sgiliau traddodiadol gael ei phrif ffrydio.
yn ogystal, gweithiom â Llywodraeth Cymru, y Corff dyfarnu Cymraeg (AGORed) a chwmni arbenigol ym Mhowys i achredu unedau sy’n ymwneud â Phrofi Aerdyndra. Hwn fydd yr hyfforddiant cyntaf mewn Adeiladu i gael ei achredu trwy’r piler dysgu Gydol Oes gyda Sicrwydd Ansawdd sef fframwaith Credydau a Chymwysterau Cymru.
Trwy gydol 2012, rydym wedi chwilio i ddatblygu marchnadoedd newydd ar gyfer cynhyrchion a gwasanaethau CiTB yng nghymru ac rydym yn falch o ennill ardystiad gan y diwydiant a Llywodraeth Cymru ar gyfer yr Academi Sgiliau Genedlaethol gyntaf dros Adeiladu yng nghymru. Mae’r project uwchraddio Blaenau’r Cymoedd £100m (y rheolir ei gyfnod cyntaf gan Carillion) wedi’i adnabod gan Lywodraeth Cymru a Chyngor Blaenau Gwent fel cyfle allweddol i ddarparu hyfforddiant a chyflogaeth gwerth ychwanegol i’r ardal sydd wedi dioddef o sgiliau isel a chyfradd diweithdra uchel.
yn cyfalafu ar waith cydweithredol a wnaethpwyd â’r Rhaglen Wella Sgiliau Arwain a Rheoli (eLMS), rydym wedi gweithio â Phrifysgol fetropolitan Caerdydd i greu rhaglen arwain benodol i adeiladu.
Mae ein data CSn yn dangos y bydd yr ychydig o

Annual Accounts
21
The names of those serving as charitable Trustees of CiTB on 11 April 2013 are shown below, together with the names of those who stepped down during 2012.
As specified in Schedule 1 of the industrial Training Act 1982, Trustees are appointed by the Secretary of State for Business, innovation, and Skills, normally for five years, following a public appointment process governed by the Office for the Commissioner of Public Appointments (OCPA), including the advertising of vacancies on the Government’s Public Appointments website (http://publicappointments.cabinetoffice.gov.uk).
nominations of candidates from the industry’s employers are sought from the principal trade associations, while those for employees are made by the trades unions. Candidates from the education sector are appointed after consultation with the ministers concerned with education in england, Scotland and Wales.
Trustees are introduced to CiTB’s work through an induction meeting with the senior management team and receive ongoing support from the Corporate Governance Unit. As all members are required to have industrial or commercial experience, further training (whether formal or informal) is provided to support specific duties, such as participation in the Audit Committee.
Trustees are responsible for developing and agreeing CiTB’s policies, business and financial plans, delegating operational decision-making to the executive Team. in addition to serving on the Board, most will also take part in policymaking as members of the Board’s sub-committees, as shown in Appendix A (pages 66 and 67). These non-executive bodies are also supported by other volunteers from the industry.
CITB Trustees
Current and former Trustees (2012/13)James Wates, CBe, fCioB, fRSA – Chairman
Judith Ann Lowe, BA, fCiL, fRSA, fiOd – deputy Chairman
Harry Adam
John Allott
ian Billyard
darin Burrows (from 1 March 2012)
Professor Barry Clarke, eur ing, fiCe, fGS, Phd, BSc
dave Cochrane (until 31 August 2012)
Bob Collins
John dickson (from 10 december 2012)
derek field, fCioB
Jim Gilmour
Geoff Holt, fioR, Minstd
Chris Jones, BSc (Hons), MBA, Ceng, MiCe
Billy Kirkwood
John Lorimer, BSc Civil engineering, Ceng, MiCe
Stephen Murphy (from 1 March 2012)
Tim Peach
Martyn Price, fiOC
Harold Rackham
Ray Wilson
Graham Wren, BSc, Ceng, MiCe (granted leave of absence from 1 July 2012)
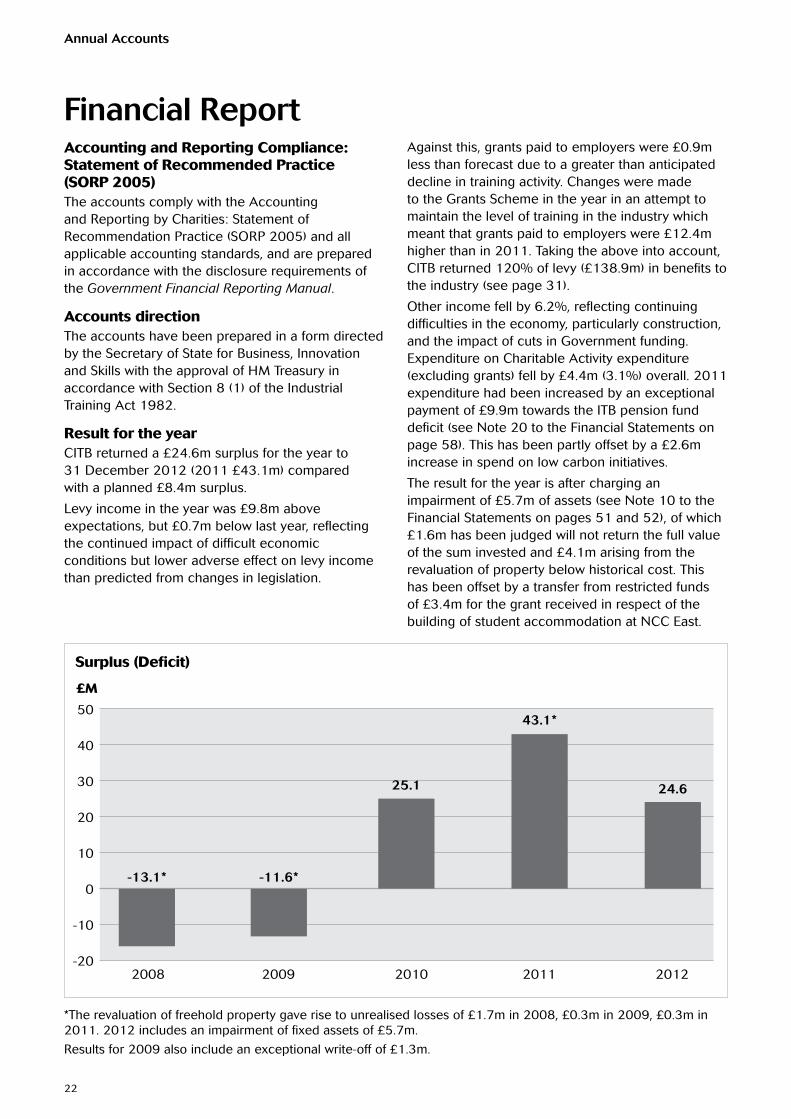
Annual Accounts
22
Accounting and Reporting Compliance: Statement of Recommended Practice (SORP 2005)The accounts comply with the Accounting and Reporting by Charities: Statement of Recommendation Practice (SORP 2005) and all applicable accounting standards, and are prepared in accordance with the disclosure requirements of the Government Financial Reporting Manual.
Accounts directionThe accounts have been prepared in a form directed by the Secretary of State for Business, innovation and Skills with the approval of HM Treasury in accordance with Section 8 (1) of the industrial Training Act 1982.
Result for the yearCiTB returned a £24.6m surplus for the year to 31 december 2012 (2011 £43.1m) compared with a planned £8.4m surplus.
Levy income in the year was £9.8m above expectations, but £0.7m below last year, reflecting the continued impact of difficult economic conditions but lower adverse effect on levy income than predicted from changes in legislation.
Against this, grants paid to employers were £0.9m less than forecast due to a greater than anticipated decline in training activity. Changes were made to the Grants Scheme in the year in an attempt to maintain the level of training in the industry which meant that grants paid to employers were £12.4m higher than in 2011. Taking the above into account, CiTB returned 120% of levy (£138.9m) in benefits to the industry (see page 31).
Other income fell by 6.2%, reflecting continuing difficulties in the economy, particularly construction, and the impact of cuts in Government funding. expenditure on Charitable Activity expenditure (excluding grants) fell by £4.4m (3.1%) overall. 2011 expenditure had been increased by an exceptional payment of £9.9m towards the iTB pension fund deficit (see note 20 to the financial Statements on page 58). This has been partly offset by a £2.6m increase in spend on low carbon initiatives.
The result for the year is after charging an impairment of £5.7m of assets (see note 10 to the financial Statements on pages 51 and 52), of which £1.6m has been judged will not return the full value of the sum invested and £4.1m arising from the revaluation of property below historical cost. This has been offset by a transfer from restricted funds of £3.4m for the grant received in respect of the building of student accommodation at nCC east.
50
40
30
20
10
0
-10
-20 2008 2009 2010 2011 2012
£M
24.6
-13.1* -11.6*
25.1
43.1*
Surplus (Deficit)
Financial Report
*The revaluation of freehold property gave rise to unrealised losses of £1.7m in 2008, £0.3m in 2009, £0.3m in 2011. 2012 includes an impairment of fixed assets of £5.7m.
Results for 2009 also include an exceptional write-off of £1.3m.

Annual Accounts
23
IncomeLevyLevy income in 2012 was £143.8m (2011 £144.4m), comprising £135.8m (2011 £142.2m) in respect of the current year’s assessment plus an adjustment of £8.0m (2011 £2.2m) for the reassessment of prior year charges.
Levy rates remained unchanged at 0.5% on direct labour payments (PAye) and 1.5% on labour-only sub-contract payments (LOSC), as did the £80,000 small business levy exemption level. However the 2012 Levy Order, which came into force on 28 March 2012 and covers assessments raised in 2012, 2013 and 2014, did contain some significant changes. These included the introduction of a small business levy reduction of 50% for employers whose total PAye and LOSC payments fall between £80,000 and £99,999; the exclusion from labour-only agreements of contracts requiring substantial use of plant or specialist equipment or both; and the withdrawal of some specific exclusions from PAye payments e.g. payments in respect of people normally working less than eight hours per week. Because the 2012 Levy Order was raised after the submission of many 2011 Levy Returns, which form the basis for the 2011 assessment raised in April 2012, employers were given the opportunity to resubmit their Levy Return data early in 2012 to reflect the changes in the legislation.
The reduction in the current year’s Levy Assessment income, compared to 2011, was due to a fall in the number of employers assessed to levy, reflecting the current depressed state of the industry, and higher than previous levels of provisions for bad debts and reassessments. The bad debt provision has increased from 4.9% to 5.4% of levy income in anticipation of a worsening economic climate in 2013. The increase in the reassessment provision, from 7% to 11% of levy income, stems from the assessments being raised two months later than in 2011 (as a result of the need to wait until the 2012 Levy Order had been passed by Parliament) and the potential for further negative impact flowing from the legislation changes. Levy income was largely unaffected by the decrease in the number of directly employed personnel within the industry as this was more than compensated for by the increase in the use of labour-only sub-contractors at the higher levy rate.
The prior years’ reassessment adjustment (£8.0m additional levy income) was due to two main reasons. The most significant was the agreement of certain assessments which had been subject to dispute over the interpretation of labour-only agreements and which were fully settled following the change in legislation. The disputed elements had been fully provided for. The other reason was that the value of reassessments and bad debts written off were unexpectedly lower than forecast at 31 december 2011.
Government and other public authoritiesCiTB receives no grant-in-aid. funding itemised here is in respect of specific projects undertaken.
Overall, funding from Government and other public authorities fell from £13.6m to £8.9m (see note 2 to the financial Statements on page 47).
income from central Government departments and the Scottish and Welsh governments fell from £11.9m to £7.1m. This was mainly due to a reduction in income of £2.7m from the SfA for adult work-based learning programmes; the completion of the low carbon project in Wales (£1.0m) and a reduction in funding towards the support of displaced apprentices in Scotland (£0.5m).
income from the UK Commission for employment and Skills (UKCeS) rose from £1.7m to £1.8m. funding for SSC core contract activities from UKCeS was £0.8m (2011 £1.7m), to match expenditure on specific contracted activities. This drop in income reflects the termination of core contract funding in March 2012.
from April 2012 SSC funding moved to a competitive tender basis to deliver specific outcomes. funding from the UKCeS to deliver non-core contract activities increased by £0.9m to £1.0m as a consequence of this change.
Investment incomeinvestment income at £2.3m rose by 17.7% over 2011 as a result of the increased gross return rates of managed funds but this was offset by an unrealised loss on the value of those investments at 31 december 2012 of £0.9m. Average net investment returns for the year fell to 1.3% (2011 1.4%).
Other incomeOther income totalled £90.7m, down from £93.1m in 2011, due to the reasons outlined in the section ‘industry skills challenges’ on pages 27 and 28.

Annual Accounts
24
Income by category as a percentage of total incoming resources 2012 (2011 in brackets)
This is a graphic presentation of the data shown under incoming Resources on the Statement of financial Activities (SOfA) on page 41. it shows the percentages and the value, comparing 2012 with 2011. Values are shown in £’000s.
Productivity* 16.99% 41,727 (16.32% 41,304)
Employer engagement*0.15% 379 (0.18% 440)
Levy 58.53% 143,758 (57.08% 144,414)
Recruitment*19.23% 47,227 (19.76% 50,008)
Government and other public authorities 3.61% 8,862 (5.37% 13,598)
Investment income 0.93% 2,273 (0.76% 1,931)
Low carbon* 0.06% 148 (0.02% 42)
Non charitable activities 0.07% 174 (0.04% 111)
Education and training* 0.22% 539 (0.27% 681)
Leadership* 0.21% 518 (0.21% 530)
* See industry Skills Challenges on pages 27 and 28.

Annual Accounts
25
ExpenditureGrantsGrant expenditure rose from £65.7m to £78.2m in 2012, helping to support 17,073 apprentices (including 6,048 framework achievements), 2,068 Training and development Plans, 22,591 VQ achievements and 20,287 plant tests.
Although training activity within the industry continued at relatively low levels compared to the pre-recession position, due to reduced employment numbers and cuts in training budgets, grant expenditure rose because of increases in grant rates from August 2012. Most notably the three year Apprenticeship package increased from £9,000 to £10,250, the VQ Achievement grant went up from £275 to £400 and the Training Plan/Short duration day rate jumped from £22.50 to £50.
A number of short-term initiatives were also put in place to help stimulate training, including £1.2m allocated to Training Groups to organise free/discounted training to their members and a bonus of £250 payable for the achievement of VQ Level 4 and above.
Apprentice numbers were lower than planned but otherwise training volumes were in line with plan and similar to 2011.
The total number of employers claiming grant in 2012 was 14,267 (2011 15,648).
Governance costsGovernance costs represent the costs of the governance infrastructure (as defined in the SORP 2005) and include the costs of the Board and committees, corporate assurance, external audit, business planning and related support costs.
Total expenditure for 2012 was £1.0m (2011 £0.9m) (see notes 1 and 8 to the financial Statements on pages 44-46 and 49 respectively).

Annual Accounts
26
Expenditure by category as a percentage of total outgoing resources 2012 (2011 in brackets)
This is a graphic presentation of the data shown under Resources expended on the Statement of financial Activities (SOfA) on page 41. it shows the percentages and the value, comparing 2012 with 2011. Values are shown in £’000s.
Recruitment*26.8% 59,740 (31.4% 65,733)
Grants 35.0% 78,156 (31.4% 65,745)
Productivity*21.7% 48,275 (23.9% 49,989) Low carbon*
3.8% 8,588 (2.9% 6,026)
Employer engagement*3.3% 7,425 (3.5% 7,421)
Impairment of assets2.5% 5,666 (nil)
Leadership*2.5% 5,575 (2.6% 5,476)
Levy collection and grant processing costs2.2% 4,878 (2.1% 4,336)
Education and training*1.5% 3,438 (1.6% 3,299)
Governance costs0.5% 1,012 (0.4% 926)
Non charitable activities0.1% 158 (0.1% 102)
Investment management costs0.1% 38 (0.1% 34)
*See industry Skills Challenges on pages 27 and 28.

Annual Accounts
27
Industry Skills ChallengesThe SSA is vital to delivering our commitments as an SSC. it is structured to ensure that the activities we undertake, and those that we look to other stakeholders to deliver, address the sector’s most immediate skills priorities and training needs. As a result, the Statement of financial Activities (see page 41) reports income and expenditure against six industry skills challenges:
• productivity
• lowcarbon
• leadership
• recruitment
• employerengagement
• educationandtraining.
Resources associated with these activities are allocated against the six challenges, showing the amount of incoming and expended resources between the six.
The productivity challengePriority activities are centred on supporting employer and industry competitiveness by:
• qualifyingtheworkforceandraisingskillslevels
• improvinghealth,safety,welfareandcompetence
• understandingandaddressingemployers’business skills needs.
income and expenditure in this area arises from industry initiatives for qualifying the workforce through Health and Safety Testing and Training, experienced Worker Assessment, certification schemes and nVQ/SVQ registrations.
income rose by £0.4m (1%) to £41.8m because of higher revenues from publications sales, and the start-up of the Tunnelling and Underground Construction Academy. These increases were partially offset by reductions in the sale of Health and Safety tests and competence cards.
expenditure at £48.3m (2011 £50.0m) fell as a result of a reduction in the cost of providing Health and Safety tests and costs associated with the adult work-based learning programmes, the income effect of which is reflected under Government and other public authorities (see Statement of financial Activities on page 41).
The low carbon challengePriority activities are centred on supporting industry’s future skills needs by:
• managingtheCuttheCarboncampaign
• mappingskillsandqualifications
• deliveringsolutionsandaccreditingtraining
• workinginpartnershiponlowcarbonissues,tomaximise influence over policy and funding for future skills.
income during 2012 increased by £0.1m to £0.15m, reflecting the developmental nature of the challenge. income is primarily funding for research and management training activity.
expenditure covers a number of work streams, including development for emerging skills needs, publications, research and marketing activities to raise awareness of the low carbon challenges facing the industry.
in 2012 the level of spend on this challenge increased by £2.6m (43%) to £8.6m. £2.0m of this increase was in respect of Growth fund initiatives that supported an additional 58 projects in the year, 58% of which were innovation and sustainability-focused. expenditure also included £1.7m (2011 £2.7m) on the Management and Supervisory development Programme (M&SdP) fund, which has supported approximately 36 applications in 2012 (2011 75) spread across the three nations. Of this, 44% (2011 47%) was spent on innovation and sustainability projects. 2012 also saw an increase in spend of £0.8m to support low carbon initiatives, which was funded by the UKCeS and recognised in income as being from Government and other public authorities.
The leadership challengePriority activities, aimed at providing industry leadership on skills and leadership training for employers, are centred on:
• workingwithemployersandtheirrepresentativebodies, professional bodies, trades unions, delivery partners, clients, other SSCs and related bodies to develop an integrated approach
• leveragingourresearchtoinfluenceGovernmentpolicy on the industry’s behalf
• understandingandaddressingemployers’management and leadership skills needs.
income and expenditure arise from a number of areas, including SSC activities on devolved skills across the SSC partnership, research projects, the production and sale of publications and the development and delivery of training courses in management and leadership.

Annual Accounts
28
The education and training challengePriority activities are focused on working with providers to deliver ‘right skills, right place, right time’ through:
• understandingskillsprovisiontoinfluencefunding
• workingwithprovidersacrossthelearninglifecycleto ensure the industry’s current and future skills needs are met
• developingaccreditationschemestoassureeducation and training provision.
income in this area mainly arises from bespoke health and safety training at nCC. However, expenditure is a combination of training delivery costs and development activity, covering new training courses, and training plans. There is also a focus on developing and maintaining a dynamic Construction Qualifications Strategy supported by home nations’ action plans that meet industry needs and regulatory requirements. These include setting national Occupational Standards (nOS) and qualifications, Apprenticeship frameworks and other measures aimed at influencing higher education institutions and promoting CPd and lifelong learning.
There was a reduction in the funding available in 2012 to meet the costs of this work (down £0.1m at £0.5m), but income from the UKCeS continues to support the development of standards and qualifications. expenditure was up by £0.1m (4%) at £3.4m as support for this challenge was maintained despite the funding cuts.
Balance sheetThe balance sheet shows net assets of £125.4m at 31 december 2012 (£101.6m at 31 december 2011). The rise in relation to 2011 reflects the surplus for the year of £24.6m, less £0.7m which was transferred from restricted funds brought forward at 1 January 2012 (see note 17 to the financial Statements on page 57). Working capital (net current assets) increased by £24.0m to £111.0m (see below).
Fixed assetsThe net book value of fixed assets decreased by £0.2m to £14.9m, reflecting additions of £7.7m less depreciation charges of £1.5m, impairments of £5.7m and an unrealised loss on revaluation of £0.5m.
All freehold properties were revalued at 31 december 2012 (see note 10 to the financial Statements on page 51).
income, arising mainly from training delivery, was unchanged at £0.5m but expenditure rose by £0.1m to £5.6m.
The recruitment challengePriority activities, aimed at keeping the pipeline of talent flowing, are centred on:
• supportingnewentrants
• providinginformation,adviceandguidanceonqualifications and careers to potential recruits and their influencers
• activelypromotingequalityanddiversity.
income is derived from Apprenticeship funding in england, Skills development Scotland and the Welsh Government, as well as funding for specialists from the SfA, covering programmes such as inspire Scholarships, Women into Work and the development of 14-19 year olds. expenditure includes college fees, trainee allowances and related operating costs.
income of £47.2m was £2.8m down on 2011. 2012 saw a fall in Apprenticeship income due to cuts in funding rates for adult Apprenticeships, and lower Apprenticeship recruitment and achievement rates. expenditure of £59.7m decreased by £6.0m as a result of the volume decrease associated with the income fall, lower college fees, and a reduction in the cost of delivery at nCC.
The employer engagement challengePriority activities are focused on recognising and responding to skills needs by:
• promotingthebenefitsofinvestingintraininganddevelopment
• diagnosingskillsneedsandprovidingsolutions
• extendingourreachthroughemployergroups.
Major costs in this area are in respect of the Advisory and national Specialist support teams. Costs are partly supported by SSC funding to undertake research work to support labour market intelligence. Other expenditure includes directly supporting the Constructionarium and regional activity, as well as implementing stakeholder strategy through engagement with industry and other key organisations at local and national level.
income of £0.4m was received (2011 £0.4m). expenditure was unchanged from 2011 at £7.4m.

Annual Accounts
29
Trade debtors rose by £1.7m to £13.6m as a consequence of a higher level of trading income in the last quarter of the year compared to 2011 and a slower debt recovery, reflecting more difficult trading conditions.
Accrued income rose by £0.4m to £3.4m as a consequence of a higher level of interest receivable from investments at the end of the year.
Amounts due from intra-Government bodies reduced by £0.6m at 31 december 2012 (mainly £1.2m from the Welsh Assembly Government due to a reduction in amounts owed in respect of the Work Based Learning contract, and offset by an increase in amounts owed by Skills development Scotland).
CreditorsCreditors increased by £7.2m to £49.9m at 31 december 2012.
Training grant accruals rose by £5.0m. The increase was mainly as a consequence of an increase in rates for non-Apprenticeship grants on 1 August 2012 which resulted in a rise of £5.7m. This increase was partly offset by a fall of £0.7m in apprentice grants and allowances outstanding at the year end to £3.6m primarily due to a tightening of the deadline rules on claiming grant.
An increase in deferred income is a rise in amounts owing to intra-Government bodies of £1.7m to £3.8m, primarily due to an amount received from deCC during the year for the delivery of training to support Green deal initiatives which will be delivered in 2013.
Net current assets/reservesnet current assets, which are taken as a measure of CiTB’s reserves, increased from £86.9m at 31 december 2011 to £111.0m at 31 december 2012 as a result of the surplus for the year of £24.6m, a reduction of £0.2m in the level of fixed assets held, less £0.7m which was transferred from restricted funds brought forward at 1 January 2012.
Reserves (net current assets) at £111.0m were above the year-end target level of £38.4m, as agreed with Government. The target range for reserves is calculated using a risk-based formula (see the section ‘Reserves’ within note 1 to the financial Statements on page 46).
ProvisionsThe level of provisions remained constant at £0.4m and represents provision for future leasehold property dilapidations (see note 16 to the financial Statements on page 57).
Of the expenditure on fixed assets, £4.0m, together with £0.9m in 2011, was spent on building new student accommodation at the nCC site at Bircham newton – an SfA grant-aided project which commenced in 2011 and was completed in 2012. However, the existing use valuation of freehold property at 31 december 2012 resulted in the value of properties below historical cost, giving rise to an impairment of £4.1m.
iT expenditure totalled £2.9m, including £2m on projects in development at the end of the 2012. The primary focus has been the ongoing iT improvement programme, to rebuild infrastructure and systems that will automate business and workflow processes, improve customer service and reduce future costs. A review of the sums spent on this iT improvement Programme against the level of benefits to be achieved has led to an impairment of these assets of £1.6m.
DebtorsTotal debtors at 31 december 2012 were £44.1m (2011 £20.0m).
net levy debtors rose from £3.6m to £25.8m, because of the two month delay in raising Levy Assessments in 2012 compared to 2011. in 2011, assessments were raised in february, enabling all ten monthly direct debit payments to be received by the end of the year, whereas, in 2012, assessments were raised in April (as soon as the 2012 Levy Order came into force) resulting in two of the ten instalment payments being outstanding at 31 december 2012. £17m of the outstanding levy was paid by direct debit instalments in January and february 2013. The debt recovery cycle is also running two months behind that of the previous year and consequently the provisions for bad debts and reassessments have been increased by £2.9m. These increases also reflect an anticipated difficult year for the industry in 2013 and the potential for further amendments to the 2011 Levy Return data caused by the change in legislation.
Outstanding levy debts cannot be written off unless they are due from employers who have become insolvent, ceased to trade, dissolved or are untraceable. The bad debt provision of £17.7m at 31 december 2012 includes provisions of £10.5m against levy debts of £11.2m relating to assessments raised in 2010 and before, which are unlikely to be recovered.
non-levy debtors increased by £2.0m to £18.3m (see note 11 to the financial Statements on page 53).

Annual Accounts
30
Payment policy and performanceCiTB’s payment policy is to pay all undisputed invoices within 30 days (or the agreed contractual terms if otherwise specified). The aim is to pay 100% of undisputed invoices, and disputed invoices once the dispute has been settled, on time within these terms. The payment performance for the whole of 2012 was 96% compared with 99% in 2011.
Investment policy and performanceCiTB invests available funds within strict guidelines set by Government. These are designed to ensure that the risk of loss is minimised and the range of investments available is consequently tightly controlled. environmental, social and ethical factors are considered to the extent permitted by current guidelines.
funds invested directly by CiTB generated a return of 1.22% for the year compared with a benchmark (Charities Official investment fund) rate of 0.88%. funds invested by funding managers investec fell by £0.9m to £25.2m, reducing the net value. A net return of 1.6% was achieved in the year.
Other InformationEmployer registrationsThe number of employers on the Levy and Grant register decreased by 5,119 to 73,167 at 31 december 2012 – see Statistical information Table 3 on page 63. during the year, 4,703 employers were added to the register and there were 9,822 deletions resulting from firms going out of business or out-of-scope to CiTB.
Grant policyCiTB publishes a Grants Scheme annually and registered employers are entitled to claim training grants in line with its conditions.
Risk managementThe major risks to which CiTB is exposed, as identified by management, have been reviewed and systems have been established to mitigate those risks (see the Governance Statement on pages 35 to 38).
Material cash support paymentsThe names of the recipients and the aggregate amounts of material grant and support payments are disclosed in note 6 to the financial Statements on page 48.
Events since the end of the yearno events have occurred since the end of the year that affect the reader’s understanding of the financial Statements.
Charitable donationsno charitable donations were made during the year.
Auditor The Comptroller and Auditor General (C&AG) is appointed under statute as CiTB’s auditor. The statutory audit fee for 2012 amounted to £52,500 (2011 £49,500).
Disclosure of information to the AuditorsThe Chief executive has taken all the steps that he ought to have taken to make himself aware of any relevant audit information and to establish that CiTB’s auditors are aware of that information. So far as the Chief executive is aware, there is no relevant audit information of which CiTB’s auditors are unaware.

Annual Accounts
31
Grants Scheme represents training grant payments (see note 5 to the financial Statements on page 47).
Other grants to employers represent direct payments made on behalf of employers including £7.7m on the following – nCC apprentice support (£4.3m), apprentice travel and lodging allowances (£2.0m) and specialist courses (£1.4m).
Grants to industry bodies represent payments to groups of employers, such as Training Groups (£1.6m), and include funding through the Growth fund (£2.0m) set up to support business growth.
Other support represents college fees paid on behalf of employers (£29.4m) as well as expenditure on industry-wide initiatives such as the cost of providing business advice and guidance to employers (£7.4m) and marketing, consultancy and research projects (£5.6m).
Third party funding represents leveraged funds and benefits for the industry which do not enter CiTB financial Statements, such as college fee discounts.
Direct and other operating costs (see figures below) include the direct cost of goods and services of non-levy income generating activities, staff, premises and other support costs.
What the industry gets backin 2012, CiTB collected £138.9m in levy after deducting the costs (£4.9m) of collecting levy and processing grants, and generated £99.4m in self-funded commercial activity, which enabled the organisation to return £166.7m in benefits (see table below).
Detailed in the Financial Statements (page 41) as: £m
Levy income 143.8
Less: levy collection/grant processing costs
(4.9)
2 Net levy 138.9
1 Total benefits 166.7
Less: Third party funding (20.7)
Add: direct and other operating costs 70.1
Total cost of charitable activities 216.1
Financial benefits statement £m Total Grants Other Grants to Other Third Scheme grants to industry support party employers bodies funding
Apprentices 91.1 41.0 7.1 32.2 10.8
Training courses 27.8 21.2 0.3 5.8 0.5
Graduates/undergraduates 6.3 6.1 0.2
national Skills Academies for Construction 0.6 0.6
VQ achievements (non-apprentice) and Qualifying the Workforce support 8.4 5.4 0.8 0.9 1.3
Plant 3.5 3.5
Advice 7.4 7.4
Consultancy and research, marketing campaigns and press coverage 13.5 5.6 7.9
Training Groups 2.6 1.0 1.6
Specialist support 1.4 1.4
Management and Supervisory development Programme 1.7 1.7
Growth fund 2.0 2.0
Joint investment strategies 0.4 0.2 0.2
Total benefits 166.7 1 78.2 8.5 7.4 51.9 20.7
Net levy 138.9 2
Percentage return on levy 120%

Annual Accounts
32
Under section 8 (1) of the industrial Training Act 1982, the Board is required to prepare for each financial year a statement of accounts in the form and on the basis determined by the Secretary of State for Business, innovation and Skills with the consent of the Treasury.
The accounts are prepared on an accruals accounting basis and must show a true and fair view of CiTB’s state of affairs at the year end and of its income and expenditure and cash flows for the financial year.
in preparing that statement of account, the Board is required to comply with the relevant requirements of the Government Financial Reporting Manual and in particular to:
a) observe the accounts direction issued by the Secretary of State for Business, innovation and Skills, including the relevant accounting and disclosure requirements, and apply suitable accounting policies on a consistent basis
b) make judgements and estimates on a reasonable basis
c) state whether applicable accounting standards as set out in the Government Financial Reporting Manual have been followed, and disclose and explain any material departures in the financial Statements, and
d) prepare the financial Statements on a going concern basis unless it is inappropriate to presume that CiTB will continue in operation.
The Accounting Officer for the department for Business, innovation and Skills has designated the Chief executive of CiTB as Accounting Officer for CiTB. The responsibilities of an Accounting Officer, including responsibility for the propriety and regularity of the public finances for which the Accounting Officer is answerable, for keeping proper records and for safeguarding CiTB assets, are set out in Managing Public Money published by HM Treasury.
Statement of the Board’s and Accounting Officer’s Responsibilities
Annual Report approved by the Board on 11 April 2013 and signed on its behalf by:
James WatesChairman
8 May 2013
Mark FarrarChief executive
8 May 2013

Annual Accounts
33
Policy on contracts, notice periods and termination paymentsdirectors are permanent employees of the organisation. notice periods are six months. Termination payments, if applicable, are paid in accordance with standard CiTB staff terms and conditions.
Non-cash remunerationno non-cash remuneration is made. The provision of company cars and free fuel – offset by a private use contribution – is part of the standard terms and conditions of employment for senior grades of staff. As an alternative, a cash option and business mileage allowance are paid.
Salary and pension entitlements (audited)The sections on the following page provide details of the remuneration for the year and the pension benefits of the most senior members of CiTB’s staff.
Board members’ remunerationThe Remuneration Committee is not responsible for considering Board members’ remuneration.
Payments to the Chairman and deputy Chairman are authorised under Schedule 1 (4) of the industrial Training Act 1982. no other Board members are remunerated. note 22 (page 59) provides more information about this.
MembershipThe Remuneration Committee is a sub-committee of the Board. its purpose is to determine general policy on remuneration and individual remuneration packages for directors.
its membership is made up of the Chairman, deputy Chairman and three Board members (Tim Peach served throughout the year, dave Cochrane was replaced during the year by Ray Wilson, and the remaining vacancy was filled by Harry Adam early in 2013).
The Communications and Change director and Head of Human Resources provide information to the committee to inform its decisions.
Policy on the remuneration of directorsSalaries and benefits are benchmarked against external market comparators on a triennial basis to ensure appropriate remuneration packages are paid to attract and retain capable individuals.
individual remuneration for directors is reviewed annually with regard to external market changes and an assessment of individual performance evidenced by the performance management process. individual performance payments, which are not consolidated into annual salaries, range from 0-6% of basic pay.
All employees, including directors, are eligible for membership of the iTB Pension funds Scheme.
Remuneration Report

Annual Accounts
34
Remuneration Salary Benefits in kind
2012 Total
2011 Total
£’000 £’000 £’000 £’000
Mark farrar – Chief Executive 230.3 1.4 231.7 223.1
Mike Bialyj – Employer Services Director 100.2 13.4 113.6 111.5
Colin evans – Business Services Director 113.0 1.7 114.7 114.4
Steve Geary – Skills Strategy Director 114.3 1.7 116.0 115.3
erika Stoddart – Corporate Services Director (resigned with effect from 21 July 2013)
119.1 0.9 120.0 118.1
nicola Thompson – Communications and Change Director 108.2 1.2 109.4 103.9
Andy Walder – NCC Director 108.4 1.7 110.1 100.3
Salary includes gross pay, payments in lieu of car and luncheon allowance. Benefits in kind include the use of allocated cars and medical insurance.
Pension benefits Real increase/ (decrease) in pension at normal
retirement date
Total accrued pension at
normal retirement date as at
31 Dec 2012
Cash equivalent transfer value at
01 Jan 2011
Real increase/ (decrease) in the cash equivalent
transfer value during the year
Cash equivalent transfer value at
31 Dec 2012
£’000 £’000 £’000 £’000 £’000
Mark farrar 0 - 2.5 15 - 20 233 24 265
Mike Bialyj 0 - 2.5 20 - 25 331 7 348
Colin evans 0 - 2.5 0 - 5 36 9 46
Steve Geary 0 - 2.5 0 - 5 23 20 44
erika Stoddart 0 - 2.5 5 - 10 51 14 67
nicola Thompson 0 - 2.5 15 - 20 184 4 193
Andy Walder 0 - 2.5 15 - 20 224 17 248
James WatesChairman of the Remuneration Committee
8 May 2013
Mark FarrarChief executive
8 May 2013
Comparison of median pay to highest earner’s remuneration
2012 2011
Highest earning executive director’s total remuneration £231,700 £223,100
Median total remuneration £28,552 £26,831
Ratio of median remuneration to remuneration of highest earning executive 8.1 8.3

Annual Accounts
35
Scope of responsibilityAs Chief executive and Accounting Officer, i am responsible for ensuring there is a sound system of governance and internal control to support the achievement of CiTB’s policies, aims and objectives whilst safeguarding the funds and assets entrusted to me, ensuring they are properly accounted for and used economically, efficiently and effectively in line with responsibilities assigned to me in Managing Public Money.
The purpose of the Governance StatementThe Governance Statement, for which as Accounting Officer i take personal responsibility, is intended to facilitate a clear understanding of the dynamics of the business and its control structure. essentially, it records the organisation’s stewardship (supplementing financial information in the accounts) and gives an insight into how the governance structure directs, challenges and reviews plans and performance.
This Statement explains how CiTB has complied with the principles of good governance and reviews the effectiveness of these arrangements.
How CITB is governedCiTB is directed by its employer-led Board, composed primarily of unpaid volunteers. its make-up reflects the main stakeholders in the construction sector. Members are appointed through a process managed by the department for Business, innovation and Skills (BiS) and the Office of the Commissioner for Public Appointments (OCPA). Appointments are generally for five years, and a second five-year term is possible, depending on an assessment of performance over that period, but members cannot serve for more than ten years. during 2012, one member’s term of office came to an end as a result of retirement, and two were appointed, the second to complete recruitment begun in 2011.
Board members are charitable trustees, and have an over-riding obligation to place the interests of beneficiaries before all others, including their own. More information about those who served as trustees during 2012 is shown on page 21.
The Board is supported by several employer-led advisory and functional bodies including the Audit, finance, Remuneration and Training Committees. Members are drawn from the Board and may also be nominated by stakeholders including the principal trade associations in the sector.
Meeting five times annually, the Board gives strategic direction, maintains oversight of business and financial planning and performance, makes key decisions about the raising and spending of levy, and authorises (if appropriate) significant policy or
investment proposals. Average attendance at the Board in 2012 was 77% and individual attendance records are shown below.
Name Attended Possible
Harry Adam 4 5
John Allott 3 5
ian Billyard 4 5
darin Burrows 3 4
Barry Clarke 3 5
dave Cochrane 2 3
Bob Collins 5 5
John dickson1 0 0
derek field2 1 5
Jim Gilmour 3 5
Geoff Holt 4 5
Chris Jones 5 5
Billy Kirkwood 4 5
John Lorimer 5 5
Judy Lowe 5 5
Stephen Murphy 0 3
Tim Peach 3 5
Martyn Price 5 5
Harold Rackham 5 5
James Wates 5 5
Ray Wilson 4 5
Graham Wren 2 2
Governance Statement
Board performancein 2012, the Board asked Professor Bob Garratt, supported by KPMG, to conduct an evaluation of its effectiveness. He recommended changes to improve performance, which a small working party led by the Chairman and deputy Chairman will consider early in 2013. Once development priorities have been agreed, these will become the focus for an action plan. further self-evaluation will be carried out during 2013.
As a registered charity, CiTB follows the Charity Commission’s Statement of Recommended Practice (SORP) rather than the UK Corporate Governance Code. it complies with the Code’s principles with the following exceptions:
• TheBoardiswhollynon-executive.
• ApartfromtheChairmanandDeputyChairman,whose remuneration is set by Government, no trustee is remunerated.
• TheBoardholdsdialoguewithstakeholdersthrough engagement programmes but does not have shareholders/investors or hold an AGM.
1 John dickson’s appointment was confirmed by BiS in January 2013, but
backdated to 10 december 2012.
2 derek field’s attendance was affected by serious illness during 2012.

Annual Accounts
36
The Board further developed its strategic thinking in 2012, and will use a Learning Board model in 2013 to improve its effectiveness. How best to deploy resources to support and stimulate training during the continuing recession has been a constant consideration. during the year, members discussed the impact of building information modelling on the sector, the changing education and training policy landscape and the implications of this for investments such as the planned University Technical College for construction, and undertook a comprehensive review of nCC’s provision. Members were briefed on their responsibilities under the Bribery Act and endorsed a sustainable Total Reward Strategy recommended by the Remuneration Committee.
Audit Committee performanceMeeting three times annually, the Audit Committee advises the Board on the adequacy of strategic and other processes for the management of risk, control and governance, maintains oversight of the internal audit function, agrees its annual audit plan and ensures this is well co-ordinated with the work of external auditors. Average attendance across the year was 79% and individual records are shown below.
Purpose of the system of internal controlThe system of internal control is designed to manage risk to a reasonable level rather than to eliminate all risk of failure to achieve policies, aims and objectives; it can therefore only provide reasonable and not absolute assurance of effectiveness. it is based on a process designed to identify and prioritise risks to the achievement of business policies, aims and objectives. it is also designed to evaluate the likelihood of those risks being realised, the impact should they be realised, and to manage them efficiently, effectively and economically. The system of internal control has been in place for the year ended 31 december 2012 and up to the date of approval of the Annual Report and Accounts, and accords with Treasury guidance.
The risk and control frameworkAs a registered charity, the organisation has a prudent and proportionate attitude to risk, placing emphasis on its risk management and control framework. Risk management is integral to business planning and performance monitoring, and risks are considered not just corporately and at directorate level, but also by departments. A risk management strategy, framework and policy are in place which will identify new risks. Corporate Assurance supports directorates, and reports the principal risks facing them and the business to the executive, the Risk and Audit Committees.
each directorate’s risk profile is monitored regularly by review meetings between the director and the Corporate Risk Manager, during which the quality and timeliness of risk management documentation is central to discussion. The organisation has built risk management and wider assurance capability over the past three years and its risk maturity is one of ‘risk defined’. This is a strong foundation on which to build.
A summary of each directorate’s principal risks (giving an organisational view) is reported monthly to the executive, and regularly (see below) to the Risk and Audit Committees.
definitions of the various business risk appetites, together with assessment, appear in risk guidance located on the intranet. The appetite was last reviewed in early 2012 and will again be reviewed in early 2013 by the Risk Committee and executive.
Risk registers, completed by risk owners, are in place for each department, consolidated at directorate level. These are held on an electronic audit/risk platform, enabling trained risk owners to maintain their identified risks online, and permitting monitoring of their involvement (actions) in the process. Progress is reviewed annually.
Name Attended Possible
Harry Adam 3 3
duncan Canney 3 3
Kevin fitzpatrick 3 3
John Lorimer 1 2
Amit Shah 1 3
Name Attended Possible
dave Cochrane 1 2
Judy Lowe 3 3
Tim Peach 2 3
James Wates 3 3
Ray Wilson 1 2
in 2012, the Audit Committee developed its approach to risk and assurance management, using a wider range of assurance sources. it considered questions of materiality in relation to audit opinions and agreed a framework of questions for challenging directors attending its meetings.
Remuneration Committee performanceThe Remuneration Committee met three times in 2012.
its remit is described more fully on page 33. As well as undertaking the annual review of rewards across the business, it led work to ensure that pension provision is set on a more sustainable footing for the future.
Average attendance across the year was 77% and individual records are show below.

Annual Accounts
37
Another key risk document is the Assurance framework, deployed in the same way as Risk registers. Completed by departmental risk owners, the framework provides an end-to-end process view of risks, controls, any gaps, mitigations and evidence to prove mitigating actions. These have been completed and consolidated at directorate level.
An annual Accountability Statement completed by senior managers and directors gives further assurance that risk is handled effectively. This involves senior managers making a personal commitment to the organisation’s Accounting Officer, formally stating the manager’s assessment of the effectiveness of control over activities for which they have been responsible. Where a shortfall is identified, the manager is invited to provide a solution or action.
Risk management is at an individual level, with operational managers and directors receiving guidance and challenge from a dedicated Corporate Risk Manager.
Risk CommitteeThe Risk Committee meets six times annually to review progress on embedding risk documentation in directorates, top organisational risks and any changes in them, risk appetite and health and safety statistics. A meeting summary is sent to the executive. The Audit Committee sees Risk Committee minutes. it also receives summary information on each directorate’s top three risks, the organisation’s top risks and a progress summary on embedding risk documentation within directorates.
Management of risks to informationWe routinely review our systems and processes for handling data securely against revised Government guidelines and to ensure we continue to meet best practice. The information Management Group, consisting of senior staff from information management-related areas of the business, considers how information is managed and controlled. The group reports periodically to the executive Team.
detailed information about the organisation’s approach to information security is shown on page 8.
Current emphasisThe current transformational change agenda will have a major impact on the future shape of the organisation. Two major programmes – Modernisation and Orion – have been taking this agenda forward.
The Modernisation Programme, spanning several years, involves major business, process and iT systems change. This is a complex programme posing serious programme and project management risks which the organisation has found challenging. At the end of 2012, a pause was implemented in order to consolidate and reorient the programme. As a result, we expect to restructure objectives into a more manageable portfolio in early 2013. Some individual elements have been abandoned after the review, which has resulted in a write-off of £1.6m (see page 29).
The Orion programme, created by the Board to address the sector desire for a more holistic service across the built environment, as well as from the Government’s 2011 ‘retain and reform’ decision, gathered pace during 2012 and has its own associated programme and project risks. Programme risks are managed within the organisation’s audit/risk platform, enabling more transparency and simpler reporting.
Maintaining stakeholder supportTo continue to meet industry expectations CiTB must maintain support from a range of stakeholders. We liaise with industry at all levels and an independent survey of employers’ attitudes is carried out annually. Results are used to gauge industry support for the levy and to inform business planning and longer-term strategies.
Links with federations, trades unions and educational bodies are very important for supporting strategic reviews of training priorities. Work with Government (for example, the departments for Business, innovation and Skills and for education, the Scottish and Welsh governments) ensures mutual understanding and alignment of policies and goals.
Corporate Assurance opinionCorporate Assurance is the dedicated internal audit unit working to standards defined by HM Treasury and in accordance with professional guidelines.
its opinion on the quality of internal control, governance and risk management at the end of 2012 was that these were ‘Satisfactory’ – in that ‘isolated areas of control weaknesses were identified which, whilst not systematic, put some business objectives at risk’. This is based on delivery of the 2012 plan of work across all the directorates, and inputs from risk management activity and governance arrangements.

Annual Accounts
38
The recommendations required that:
• themostseniorstaffinapublicbodyhadtobeon the payroll (unless there were exceptional temporary circumstances); and
• publicbodieshadtoensuretheyhadtherighttoseek assurance about the tax arrangements of long-term specialist contractors.
These obligations applied to all arrangements lasting six months or longer entered into after 23 August 2012. CiTB was asked to ‘seek to apply’ the Review’s principles to arrangements entered into before then.
i confirm compliance with the recommendations of the Alexander Review, published on 23 May 2012, as applied by BiS. no exceptional arrangements have been made.
Review of effectivenessAs Accounting Officer, i have responsibility for conducting an annual review of the effectiveness of the system of the organisation’s governance, risk management and internal control. This is informed by the work of executive managers and internal auditors within the organisation who are responsible for developing and maintaining the governance structures and internal control framework and comments made by the external auditors in their management letter and other reports. The Governance Statement represents the end product of the review of the effectiveness of the governance framework, risk management and internal control.
i have been advised on the implications of the result of the review of the effectiveness of the system of governance, internal control and risk management by the Audit Committee and a plan to address weaknesses and ensure continuous improvement of the system is in place.
i have considered the evidence linked to the production of the Annual Governance Statement. The conclusion is that CiTB’s overall governance and internal control structures are ‘Satisfactory’.
Accounting Officer
Mark FarrarChief executive
8 May 2013
Acknowledged on behalf of the Board
Harry AdamChairman of the Audit Committee
8 May 2013
Conflicts of interestCiTB provides a unique focal point for integrating strategic skills planning, standards setting and the delivery of national training resources.
As a non-departmental public body (ndPB) it is accountable to the Secretary of State for Business, innovation and Skills and must abide by principles of regularity and propriety, ensuring that its work is not adversely impacted by a conflict of interest. it believes that transparency of decision making and rigorous scrutiny by stakeholders, combined with well maintained information and other structural barriers, will help it attain these goals.
it is subject to much external and independent scrutiny; its accounts are audited annually by the national Audit Office and (as a registered charity) it reports to the Charity Commission and Office of the Scottish Charities Regulator (OSCR). Allegations of maladministration may be investigated by the Parliamentary Commissioner for Administration (the Ombudsman). its Accounting Officer may be called before the Public Accounts Committee. its levy proposals must be agreed by both Houses of Parliament – if industry support has been confirmed.
it adopts a balanced approach to developing standards, qualifications and training, to ensure sustainable solutions are embedded for the benefit of those who need training and those who supply it.
its composite nature allows for the integration and testing of developments across all stages of the educational process, acting as a provider of training resources in specialist or other market sectors which are not otherwise supported.
Off-payroll arrangementsin May 2012, the Government published a review of the tax arrangements of public appointees, including recommendations to be applied by public bodies intended to improve the tax transparency of arrangements made with contractors. The review recognised that such arrangements could be sensible – to bring in specialist skills, or to help address fluctuating demand for services – and that the cost of placing such individuals on the payroll might not offer best value. However, the public sector should be more transparent than other employers about such matters.
Guidance from BiS was subsequently received indicating that BiS and its associated public bodies would apply the recommendations more stringently than the Alexander Review had recommended.

Annual Accounts
39
i certify that i have audited the financial statements of CiTB for the year ended 31 december 2012 under the industrial Training Act 1982. These comprise the Statement of financial Activities, the Balance Sheet, the Cash flow Statement and the related notes. These financial statements have been prepared under the accounting policies set out within them. i have also audited the information in the Remuneration Report that is described in that report as having been audited.
Respective responsibilities of the Board, Accounting Officer and auditor As explained more fully in the Statement of the Board’s and Accounting Officer’s Responsibilities, the Board and Accounting Officer are responsible for the preparation of the financial statements and for being satisfied that they give a true and fair view.
My responsibility is to audit, certify and report on the financial statements in accordance with the industrial Training Act 1982. i conducted my audit in accordance with international Standards on Auditing (UK and ireland). Those standards require me and my staff to comply with the Auditing Practices Board’s ethical Standards for Auditors.
Scope of the audit of the financial statementsAn audit involves obtaining evidence about the amounts and disclosures in the financial statements sufficient to give reasonable assurance that the financial statements are free from material misstatement, whether caused by fraud or error. This includes an assessment of whether the accounting policies are appropriate to CiTB’s circumstances and have been consistently applied and adequately disclosed; the reasonableness of significant accounting estimates made by CiTB; and the overall presentation of the financial statements. in addition i read all the financial and non-financial information in the Annual Report to identify material inconsistencies with the audited financial statements. if i become aware of any apparent material misstatements or inconsistencies i consider the implications for my report.
in addition, i am required to obtain evidence sufficient to give reasonable assurance that the expenditure and income recorded in the financial statements have been applied to the purposes intended by Parliament and the financial transactions recorded in the financial statements conform to the authorities which govern them.
Opinion on regularityin my opinion, in all material respects the expenditure and income recorded in the financial statements have been applied to the purposes intended by Parliament and the financial transactions recorded in the financial statements conform to the authorities which govern them.
Opinion on financial statements in my opinion:
• thefinancialstatementsgiveatrueandfairviewof the state of CiTB’s affairs as at 31 december 2012 and its incoming resources and application of resources for the year then ended; and
• thefinancialstatementshavebeenproperlyprepared in accordance with the industrial Training Act 1982 and directions issued thereunder by the Secretary of State for Business, innovation and Skills.
Opinion on other mattersin my opinion:
• thepartoftheRemunerationReporttobeauditedhas been properly prepared in accordance with the industrial Training Act 1982 and Secretary of State directions issued thereunder; and
• theinformationgiveninthesectionsheadedfinancial Report, Key deliverables 2012, CiTB Trustees and Appendix B: Register of interests of Board members for the financial year for which the financial statements are prepared is consistent with the financial statements.
Certificate and Report from the Comptroller and Auditor General to the Houses of Parliament and the Board of CITB

Annual Accounts
40
Matters on which I report by exceptioni have nothing to report in respect of the following matters which i report to you if, in my opinion:
• adequateaccountingrecordshavenotbeenkeptor returns adequate for my audit have not been received from branches not visited by my staff; or
• thefinancialstatementsandthepartoftheRemuneration Report to be audited are not in agreement with the accounting records and returns; or
• Ihavenotreceivedalloftheinformationandexplanations i require for my audit; or
• theGovernanceStatementdoesnotreflectcompliance with HM Treasury’s guidance.
Reporti have no observations to make on these financial statements.
Amyas C E MorseComptroller and Auditor General
29 May 2013
National Audit Office157–197 Buckingham Palace Road Victoria London SW1W 9SP

Annual Accounts
41
INCOMING RESOURCES notes 2012 £’000
2011 £’000
incoming resources from charitable activities non-levy income Skills challenges Productivity 41,727 41,304 Low carbon 148 42 Leadership 518 530 Recruitment 47,227 50,008 employer engagement 379 440 education and training 539 681 Government and other public authorities 2 8,862 13,598 Total non-levy income 99,400 106,603 Levy income 3 143,758 144,414incoming resources from generated funds investment income 2,273 1,931incoming resources from non-charitable activities 4 174 111
245,605 253,059RESOURCES EXPENDEDCost of generating funds investment management costs 38 34Charitable activities Grants 5, 6 78,156 65,745 Skills challenges Productivity 48,275 49,989 Low carbon 8,588 6,026 Leadership 5,575 5,476 Recruitment 59,740 65,733 employer engagement 7,425 7,421 education and training 3,438 3,299 Levy collection and grant processing costs 4,878 4,336 Total cost of charitable activities 7 216,075 208,025
non-charitable activities 4 158 102Governance costs 8 1,012 926impairment of assets 10 5,666 –
Total resources expended 222,949 209,087
Net income for the year 22,656 43,972Other recognised gains and losses Realised loss on investments - (86) Realised loss on sale of property (9) – Unrealised loss on investments 13 (905) (402) Unrealised loss on revaluation of freehold properties 10, 17 (533) (335) Transfer from restricted funds 17 3,403 –Net movement in unrestricted funds 9, 17 24,612 43,149
Accumulated unrestricted fund at 01 January 100,827 57,678
Accumulated unrestricted fund at 31 December 17 125,439 100,827
incoming resource – nCC east development fund 17 2,662 741Accumulated restricted fund at 01 January 741 –Net movement in restricted funds – transfer to unrestricted funds 17 (3,403) –Accumulated restricted fund at 31 December 17 - 741
Accumulated funds at 31 December 17 125,439 101,568
The above results include all recognised gains and losses and are derived from continuing activities. notes 1-27 on pages 44-61 form an integral part of these accounts.
Financial StatementsStatement of Financial Activities for the Year Ended 31 December 2012 (incorporating an income and expenditure account)

Annual Accounts
42
notes 2012 2011FIXED ASSETS £’000 £’000 £’000 £’000
Tangible assets 10 14,874 15,049
CURRENT ASSETS
debtors 11, 15 44,104 19,970
Properties held for sale 12 450 655
investments 13,15, 19 114,880 108,687
Cash at bank 15, 19 1,439 333
160,873 129,645
CREDITORS
Amounts falling due within one year 14, 15 (49,920) (42,726)
Net current assets 110,953 86,919
Total assets less current liabilities 125,827 101,968
PROVISIONS FOR LIABILITIES AND CHARGES 16 (388) (400)
NET ASSETS 125,439 101,568
FINANCED BY
Accumulated fund 17 125,439 101,568
notes 1-27 on pages 44-61 form an integral part of these accounts.
Approved by the Board on 11 April 2013 and signed on its behalf by:
Chairman James Wates8 May 2013
Chief Executive Mark Farrar8 May 2013
Balance Sheet as at 31 December 2012

Annual Accounts
43
Reconciliation of net resources used to net cash inflow from operating activities
notes 2012 2011
£’000 £’000
net incoming resources before other recognised gains and losses 22,656 43,972
interest receivable (2,273) (1,931)
Operating surplus 20,383 42,041
depreciation charges 10 1,486 1,527
Profit on sale of tangible fixed assets (577) (3)
impairment of assets 10 5,666 –
Realised loss on investments – (86)
Realised loss on sale of property (9) –
increase in debtors (23,481) (1,747)
(increase)/decrease in creditors and provisions 7,428 (11,061)
Net cash inflow from operating activities 10,896 30,671
CASH FLOW STATEMENT
Net cash inflow from operating activities 10,896 30,671
Returns on investments and servicing of finance 18 1,826 1,660
Capital expenditure (net) 18 (4,518) (2,758)
Management of liquid resources (call accounts, term deposits, money market and externally managed funds)
18 (7,098) (30,867)
Increase/(Decrease) in cash at bank 19 1,106 (1,294)
Reconciliation of net cash flow to movement in net funds
Increase/(Decrease) in cash at bank in the period 1,106 (1,294)
Management of liquid resources (call accounts, term deposits, money market and externally managed funds)
18 7,098 30,867
Other non-cash movements in the year 13 (905) (402)
Movement in net funds in the year 7,299 29,171
Net funds at 01 January 109,020 79,849
Net funds at 31 December 19 116,319 109,020
Represented by:
Investments 13 114,880 108,687
Cash at bank 1,439 333
116,319 109,020
notes 1-27 on pages 44-61 form an integral part of these accounts.
Cash Flow Statement for the Year Ended 31 December 2012

Annual Accounts
44
Notes to the Financial Statements for the Year Ended 31 December 2012
1. ACCOUNTING POLICIES
Going concernThese accounts are prepared on a going concern basis.
Accounting conventionThe financial Statements are prepared in accordance with the industrial Training Act 1982 and directions made thereunder by the Secretary of State for Business, innovation and Skills. The accounts comply with the requirements of Accounting and Reporting by Charities: Statement of Recommended Practice (SORP 2005).
The accounts also meet the disclosure requirements of the 2011-12 Government Financial Reporting Manual in so far as they are applicable and do not conflict with the requirements of SORP 2005.
These accounts are prepared under the historical cost convention as modified to reflect the revaluation of fixed assets and investments. debtors and creditors are shown at face value as any impairments are covered by provisions.
Incoming resources
LevyLevy income is that receivable from assessments based on the employment details returned by employers, with an estimate for those from which employment details have not been received. estimated assessment income is reduced by a provision for reassessments, based on historical trends, to allow for their normal write down in value following the receipt of a Levy Return declaring actual direct employment and labour-only sub-contract payments. A provision for bad debts, based on identified doubtful debts, prior year experience and the economic state of the industry, is also applied against levy debts and both the movement in the provision between 1 January and 31 december and the actual bad debts written off in the year are set off against levy income. Levy Assessments are recognised in the Statement of financial Activities (SOfA) in the period in which they are raised.
Government and other public authoritiesGovernment grants received are recognised in the SOfA so as to match them with the expenditure towards which they are intended to contribute, which may give rise to deferred income for grants received in advance of expenditure incurred.
Skills challengesincome is allocated to the challenges either directly or apportioned by staff time spent. income in respect of all challenges is accounted for on an accruals basis except for Recruitment, where income from output-related funding is included in the period in which the trainee attains the specified achievements. income may also be received in advance of goods and services being delivered; this is treated as deferred income.
Resources expended
GrantsThe charge in the SOfA consists of the training grants paid during the year together with an estimate of the liability for unpaid grants for the period and any adjustments to accruals made in earlier years.
Skills challengesThe costs of activities are allocated to each challenge either directly or apportioned by staff time spent. The charges in the SOfA are recognised on an accruals basis. The Recruitment challenge includes payments in relation to new entrant Training made during the year together with an estimate of the liability for unpaid course fees for the period.

Annual Accounts
45
Notes to the Financial Statements for the Year Ended 31 December 2012 (continued)
1. ACCOUNTING POLICIES (continued)
LeasingRentals paid under operating leases are charged in the SOfA on a straight line basis over the lease term.
Allocation of resources expendedCosts are allocated either directly or apportioned by staff time spent as follows:
Cost of generating funds – direct
Charitable and non-charitable activities – direct and by staff time
Governance costs – direct and by staff time, including the costs of Board and committees, Corporate Assurance, Business Planning, Legal, finance and Audit fees.
Other recognised gains and losses
Realised on investmentsThe SOfA recognises the net value of all gains and losses on the sale of investments, calculated as the difference between the cost and sales proceeds of each investment liquidated.
Unrealised on investmentsThe difference between the cost and the year-end market value of all investments held at the balance sheet date is recognised in the SOfA.
Assets
Estimation techniquesLevy debtors represent the estimated recoverable amounts of unpaid Levy Assessments, having taken account of provisions for bad debts and for reassessing estimated assessments following the late receipt of Levy Returns. CiTB only writes off levy debts when it has evidence that an employer has become insolvent, ceased to trade, is dissolved or, having made all reasonable efforts to locate the debtor, concludes that the debtor is untraceable.
Tangible fixed assetsTangible fixed assets are stated at modified historical cost. Costs of acquisition, comprising only those costs that are directly attributable to bringing the asset into working condition for its intended use, are capitalised. The threshold for capitalisation is £2,500.
freehold land is not depreciated. Motor vehicles are depreciated on a reducing balance basis at 30% per annum. All other tangible fixed assets are depreciated evenly to write off the value of the asset over their estimated useful economic lives. These lie within the following ranges:
freehold buildings – 50 years (permanent buildings)
– 20 years (improvements and temporary buildings)
– nil (buildings under construction)
Leasehold land and buildings – the lease term
Plant and machinery – 5 to 10 years
Office equipment – 4 to 10 years
Computer equipment – 4 years
freehold properties are fully revalued every five years and all tangible fixed assets are subject to an annual impairment review.
Properties held for sale and investmentsProperties held for sale and investments are stated at market value at the balance sheet date. investments are considered to be liquid resources as they are all redeemable on demand.

Annual Accounts
46
Notes to the Financial Statements for the Year Ended 31 December 2012 (continued)
1. ACCOUNTING POLICIES (continued)
Liabilities
Estimation techniquesGrant and college fees creditors: Amounts payable in relation to college fee invoices and training plan grant claims not yet received are calculated on the basis of historical payment patterns adjusted for any known changes in circumstances. Accruals for apprentice grant claims are based on known liabilities at the year end. As the Grants Scheme runs from 1 August to 31 July, all other grant claims for the period from 1 August to 31 december each year are accrued at the year-end on the basis of 5/12 of the annual forecast expenditure for the Grants Scheme year, less payments made.
Financial instrumentsA financial instrument is any contract that gives rise to a financial asset of one entity and a financial liability or equity instrument of another entity. financial instruments are classified in the following categories: loans and receivables, available-for-sale and other financial liabilities. CiTB’s financial instruments are not considered to be held-to-maturity investments, nor does CiTB hold financial assets or liabilities expressly for trading purposes. Material classes of financial instruments are separately identified under these categories in the notes to the accounts.
Loans and receivables‘Loans and receivables’ financial instruments are non-derivative financial assets with fixed or determinable payments that are not quoted in an active market, for example trade debtors and deposits held in banks. Subsequent to initial recognition, these assets are carried at cost less impairment where material.
Available-for-sale‘Available-for-sale’ financial instruments are non-derivatives that are either designated in this category or not classified in any of the other categories. CiTB’s investments are considered to fall within this category. Subsequent to initial recognition these assets are recorded at fair value, with any realised and unrealised gains or losses reflected in the SOfA.
Other financial liabilities‘Other financial liabilities’ financial instruments are short-term creditors.
Other
VATirrecoverable VAT is charged to the relevant expenditure category or included in the capitalised purchase cost of fixed assets. Where output tax is charged or input tax is recoverable, the amounts are stated net of VAT.
PensionsThe expected costs of pensions are provided on systematic and rational bases over the estimated average service lives of members of the schemes. Variations arising from actuarial surpluses are spread over the average remaining service lives of members to the extent that the resulting credit does not exceed the regular cost.
ReservesReserves (defined as net current assets) are required to cover exposure to delays in income receipts and acceleration of grants and costs which are outside the control of CiTB and to ensure continuity of funding to the construction industry.
A risk-based formula, as agreed with the UK Government, is used to calculate an appropriate year-end target level of reserves. Actual reserves should fall within the range of plus or minus 5% of the agreed target.
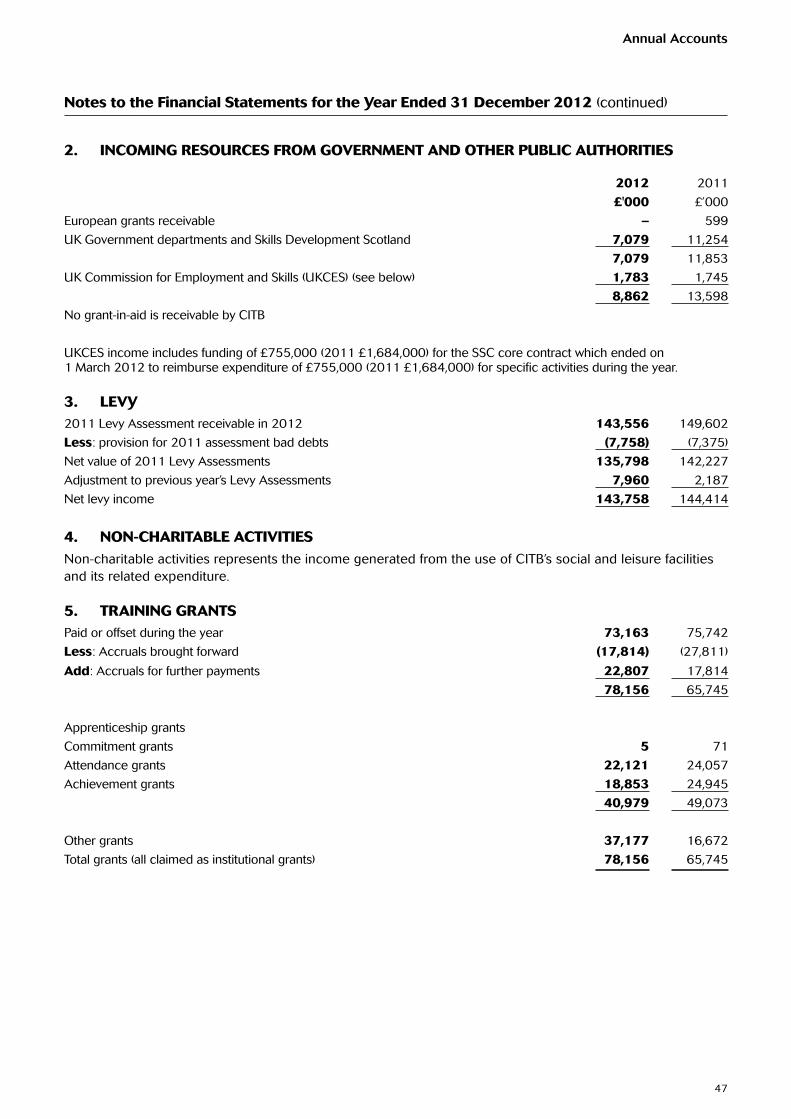
Annual Accounts
47
2. INCOMING RESOURCES FROM GOVERNMENT AND OTHER PUBLIC AUTHORITIES
2012 2011
£'000 £’000
european grants receivable – 599
UK Government departments and Skills development Scotland 7,079 11,254
7,079 11,853
UK Commission for employment and Skills (UKCeS) (see below) 1,783 1,745
8,862 13,598
no grant-in-aid is receivable by CiTB
UKCeS income includes funding of £755,000 (2011 £1,684,000) for the SSC core contract which ended on 1 March 2012 to reimburse expenditure of £755,000 (2011 £1,684,000) for specific activities during the year.
3. LEVY2011 Levy Assessment receivable in 2012 143,556 149,602
Less: provision for 2011 assessment bad debts (7,758) (7,375)
net value of 2011 Levy Assessments 135,798 142,227
Adjustment to previous year’s Levy Assessments 7,960 2,187
net levy income 143,758 144,414
4. NON-CHARITABLE ACTIVITIES
non-charitable activities represents the income generated from the use of CiTB’s social and leisure facilities and its related expenditure.
5. TRAINING GRANTSPaid or offset during the year 73,163 75,742
Less: Accruals brought forward (17,814) (27,811)
Add: Accruals for further payments 22,807 17,814
78,156 65,745
Apprenticeship grants
Commitment grants 5 71
Attendance grants 22,121 24,057
Achievement grants 18,853 24,945
40,979 49,073
Other grants 37,177 16,672
Total grants (all claimed as institutional grants) 78,156 65,745
Notes to the Financial Statements for the Year Ended 31 December 2012 (continued)

Annual Accounts
48
Notes to the Financial Statements for the Year Ended 31 December 2012 (continued)
6. MATERIAL CASH SUPPORT PAYMENTS IN RESPECT OF TRAININGAccounting and Reporting by Charities: Statement of Recommended Practice 2005 requires material grants made to be disclosed. disclosure must include the name of the recipient and the aggregate amount of grants made to that recipient. The definition of grants includes grants, trainee allowances and college fee payments, and these are reconciled below. Training grants make a contribution towards an employer’s training costs. Aggregate payments/offsets over £110,000 made during the year:
Recipient £’000
Carillion plc* – CiTC £5,130 – other £690 5,820Balfour Beatty plc 1,326Laing O’Rourke 1,214Morgan Sindall Group plc 1,109Royal BAM Group 1,090Kier Group plc 1,350Barratt developments plc 658Galliford Try plc 583Keepmoat Plc 567interserve plc 553Vinci 549Mears Group plc 534Costain Group plc 534Taylor Wimpey plc 521Skanska UK 477Willmott dixon Group 470Seddon Group Ltd 452Bouygues 438Redrow plc 425Mitie Group plc 409insight Solutions GRP Recruitment Ltd 354May Gurney integrated Services plc 354Ashtead Group plc 350Sir Robert McAlpine 336Bell Group UK Ltd 318Cape intermediate Holdings plc 299Speedy Hire plc 287ferrovial SA 267C C G (Holdings) Ltd 265
Recipient £’000
Cruden Holdings Ltd 256Volker Wessels UK Ltd 240Wates Group Ltd 234GWKS Ltd t/a 228J Murphy & Sons Ltd 224Alfred Bagnall & Sons Ltd 219Morrison Utility Services Ltd 208enterprise Group Holdings Ltd 207Gap Holdings Ltd 200The Clancy Group plc 195Barhale Construction plc 189Construction Works (Services) Ltd 186Crest nicholson plc 174R G Carter Group Ltd 174Persimmon plc 173The Miller Group Ltd 163Lavendon Group plc 159Jones Bros Ruthin Co Ltd 155Cabretta Holdings Ltd 155Ashleigh (Scotland) Ltd 154Bowmer & Kirkland Ltd 150Lakehouse Holdings Ltd 141forrest Corporate Ltd 141Muirfield Holdings Ltd 140north Midland Construction plc 136Thomas Vale Group plc 135Renew Holdings plc 121Ainscough Crane Hire Ltd 116 26,882 Other recipients 78,279Total payments 105,161
* This employer operates a managing agency (providing training opportunities for more than its own needs) and so could claim a greater number of new
entrant Training grants.
The number of employers claiming grant decreased from 15,648 in 2011 to 14,267 in 2012 (-8.8%).
Reconciliation with charges: Accruals B/f Payments Accruals C/f Charges £’000 £’000 £’000 £’000
Training grants (note 5) (17,814) 73,163 22,807 78,156
Trainee allowances (375) 4,134 375 4,134
College fees (6,917) 27,864 7,286 28,233
(25,106) 105,161 30,468 110,523
College fees and trainee allowances are included within expenditure attributed to Recruitment in the Statement of financial Activities (page 41).
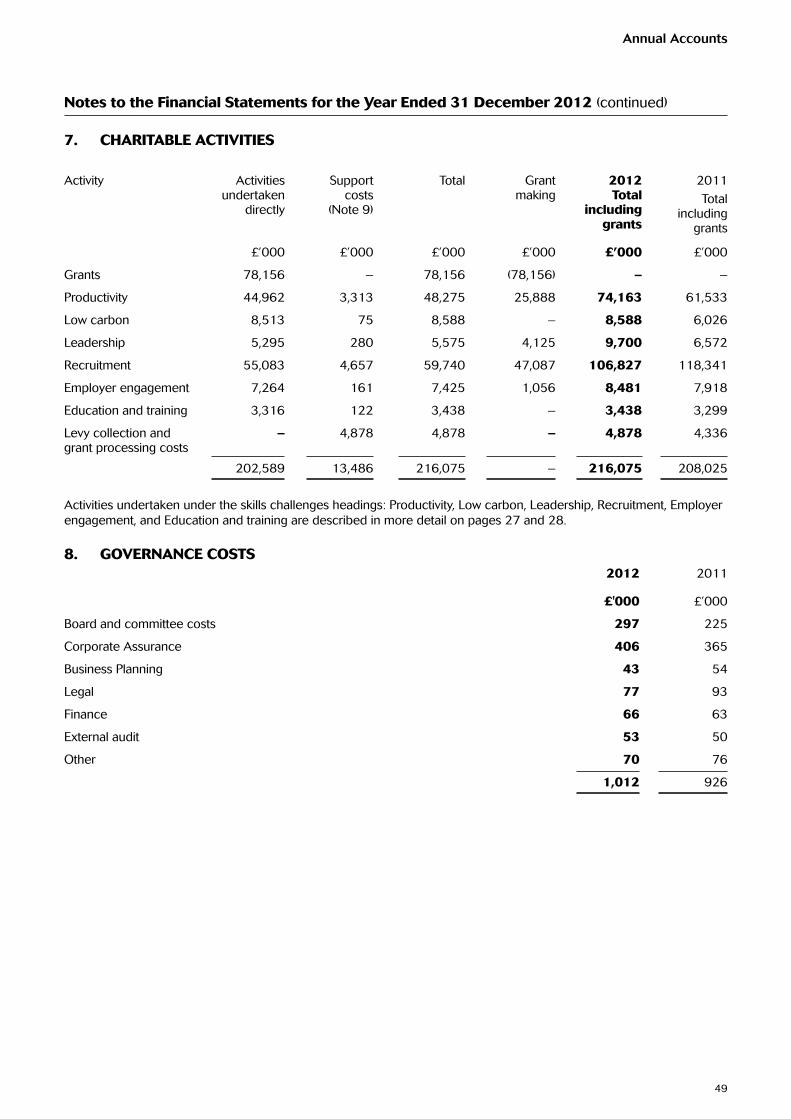
Annual Accounts
49
7. CHARITABLE ACTIVITIES
Activity Activities undertaken
directly
Support costs
(note 9)
Total Grant making
2012 Total
including grants
2011
Total including
grants
£’000 £’000 £’000 £’000 £’000 £’000
Grants 78,156 – 78,156 (78,156) – –
Productivity 44,962 3,313 48,275 25,888 74,163 61,533
Low carbon 8,513 75 8,588 – 8,588 6,026
Leadership 5,295 280 5,575 4,125 9,700 6,572
Recruitment 55,083 4,657 59,740 47,087 106,827 118,341
employer engagement 7,264 161 7,425 1,056 8,481 7,918
education and training 3,316 122 3,438 – 3,438 3,299
Levy collection and grant processing costs
– 4,878 4,878 – 4,878 4,336
202,589 13,486 216,075 – 216,075 208,025
Activities undertaken under the skills challenges headings: Productivity, Low carbon, Leadership, Recruitment, employer engagement, and education and training are described in more detail on pages 27 and 28.
8. GOVERNANCE COSTS2012 2011
£'000 £’000
Board and committee costs 297 225
Corporate Assurance 406 365
Business Planning 43 54
Legal 77 93
finance 66 63
external audit 53 50
Other 70 76
1,012 926
Notes to the Financial Statements for the Year Ended 31 December 2012 (continued)

Annual Accounts
50
9. NET MOVEMENT IN FUNDS
2011 2010
£’000 £’000
The net movement in funds for the year of £24,612,000 (2011 £43,149,000) was arrived at after (crediting)/charging:
Profit on sale of fixed assets (577) (3)
Board members’ remuneration (see note 22) 32 32
Rentals paid under operating leases
•Hireofplantandmachinery 87 81
•Otheroperatingleases 1,082 1,002
Auditors’ remuneration
•Auditfees 53 50
depreciation
•Ownedassets 1,486 1,527
SSC activities (see note 2) 755 1,684
indemnity insurance 14 10
Support costs (see below) 13,486 13,334
indemnity insurance covers breach of professional duty by reason of any neglect, error or omission committed in good faith by any employee or agent.
Support costs are allocated on a staff time basis as follows:
Support costs Levy collection and grant
processing
Productivity Low carbon
Leadership Recruitment employer engagement
education and
training
Total
£’000 £’000 £’000 £’000 £’000 £’000 £’000 £’000
Levy and Grant 3,842 – – – – – – 3,842
Management 91 161 70 243 206 126 72 969
finance 210 516 1 5 741 5 5 1,483
information technology
447 1,945 3 22 2,786 21 34 5,258
Human resources
92 537 1 8 658 8 8 1,312
Legal 196 154 – 2 266 1 3 622
2012 4,878 3,313 75 280 4,657 161 122 13,486
2011 4,336 3,486 63 253 4,939 142 115 13,334
Notes to the Financial Statements for the Year Ended 31 December 2012 (continued)

Annual Accounts
51
10. TANGIBLE FIXED ASSETSfreehold property
Plant and machinery
Motor vehicles
Office and computer
equipment
Assets under development
Total
(a) Summary £’000 £’000 £’000 £’000 £’000 £’000
Cost or valuation
01 January 2012 9,025 7,647 1,971 8,690 2,740 30,073
Additions 4,007 40 696 610 2,306 7,659
disposals – (1,973) (718) – – (2,691)
Transfers 935 – – 672 (1,607) –
impairments (4,108) – – (85) (1,473) (5,666)
Write-off – (16) – – – (16)
Revaluation (see below) (533) – – – – (533)
31 December 2012 9,326 5,698 1,949 9,887 1,966 28,826
Valuation 2012 8,725 – – – – 8,725
Cost 601 5,698 1,949 9,887 1,966 20,101
9,326 5,698 1,949 9,887 1,966 28,826
Depreciation
01 January 2012 107 6,581 1,583 6,753 – 15,024
Charges for the year 30 401 181 874 – 1,486
disposals – (1,919) (624) – – (2,543)
Write-off – (15) – – – (15)
31 december 2012 137 5,048 1,140 7,627 – 13,952
Net Book Value
31st December 2012 9,189 650 809 2,260 1,966 14,874
31st december 2011 8,918 1,066 388 1,937 2,740 15,049
At 31 december 2012, CiTB received professional, external valuations of its freehold property. fdP Savills undertook the valuation of the property at Bircham newton, valuing the training centre and head office on an existing use basis and the agricultural land at market value. Lambert Smith Hampton carried out the valuations of freehold property held at Glasgow, Birmingham and erith on an existing use basis. These valuations were made in accordance with the Practice Statements in the Royal institution of Chartered Surveyors Appraisal and Valuation Manual, which resulted in a reduction in value of £4,641,000, of which £4,108,000 has been treated as an impairment, being the reduction in value below historical cost.
Notes to the Financial Statements for the Year Ended 31 December 2012 (continued)
2012 2011
(b) Historical cost information £’000 £’000
if the valuations had not been included then freehold property would have been included at the following amounts:
Cost 18,252 14,161
Accumulated depreciation (3,966) (3,811)
14,286 10,350(c) Freehold property
freehold land cost 3,635 3,694
freehold property cost 5,691 5,331
Accumulated depreciation freehold property only (137) (107)
9,189 8,918

Annual Accounts
52
10. TANGIBLE FIXED ASSETS (continued)
(d) Modified historic cost accountingApart from freehold property, fixed assets are included at cost less accumulative depreciation. no adjustment has been made in respect of modified historical cost accounting as the amount is not considered to be material.
(e) Capital commitmentsThere were capital commitments of £2,671,000 at 31 december 2012 (2011 £4,056,000) for nCC east redevelopment and computer equipment.
(f) Plant equipment on loannCC has the use of equipment on loan, free of charge, from plant equipment suppliers equivalent to a purchase value of approximately £430,000 (2011 £330,000).
(g) TANGIBLE FIXED ASSETS 2011 (comparative table - restated)
Notes to the Financial Statements for the Year Ended 31 December 2012 (continued)
freehold property
Plant and machinery
Motor vehicles
Office and computer
equipment
Assets under development
Total
Summary £’000 £’000 £’000 £’000 £’000 £’000
Cost or valuation
01 January 2011 9,225 5,999 2,644 4,204 – 22,072
Assets reinstated (see below)
– 2,047 – 3,856 – 5,903
Additions – 65 60 1,235 2,740 4,100
disposals – – (733) – – (733)
Write-off – (464) – (605) – (1,069)
Revaluation (see below)
(200)
–
–
–
–
(200)
31 December 2011 9,025 7,647 1,971 8,690 2,740 30,073
Valuation 2011 8,465 – – – – 8,465
Cost 560 7,647 1,971 8,690 2,740 21,608
9,025 7,647 1,971 8,690 2,740 30,073
depreciation
01 January 2011 79 4,461 1,987 2,724 – 9,251
Assets reinstated (see below)
– 2,047 – 3,856 – 5,903
Charges for the year 28 537 184 778 – 1,527
disposals – – (588) – – (588)
Write-off – (464) – (605) – (1,069)
31 December 2011 107 6,581 1,583 6,753 – 15,024
Net book value
31 December 2011 8,918 1,066 388 1,937 2,740 15,049
31 december 2010 9,146 1,538 657 1,480 – 12,821
Assets reinstated represent the gross cost and depreciation of assets with a nil net book value but still in use.

Annual Accounts
53
Notes to the Financial Statements for the Year Ended 31 December 2012 (continued)
11. DEBTORS: AMOUNTS FALLING DUE WITHIN ONE YEAR
2012 2012 2011 2011
£'000 £'000 £’000 £’000*(Restated)
Levy debtors 43,460 18,419
less: provision for bad debts (see below) (17,699) (14,781)
Total levy debtors 25,761 3,638
Trade and other debtors 14,065 12,122
Less: provision for bad debts (510) (210)
Total trade and other debtors 13,555 11,912
Accrued income 3,404 3,042
Prepayments 1,384 1,378
Total Debtors 44,104 19,970
Balances with intra-Government bodies
Central Government bodies 7,886 9,035
Public corporations 556 76
Local authorities 52 27
8,494 9,138
Other trade debtors (see note 15) 7,189 4,987
Balances with other bodies: 28,421 5,845
Total Debtors 44,104 19,970
* The restatement of 2011 figures is a reclassification of certain balances within the note.
As stated in the Accounting Policies (see note 1 on page 44), CiTB only writes off levy debts when it has evidence that an employer has become insolvent, has ceased to trade, has been dissolved or, having made all reasonable efforts to locate the debtor, is untraceable. As a consequence, there is a high proportion of prior years’ assessments for which full provision is required. At 31 december 2012, £11,155,000 was outstanding for 2010 and prior Levy Assessments (2011 £9,585,000 for 2009 and prior assessments), against which a provision for bad debts of £10,536,000 – 94.4% (2011 £8,849,000 – 92.3%) has been made.
12. PROPERTY HELD FOR SALEProperties held for sale represents one Scottish property (2011:2) that is surplus to requirements and is stated at market value at 31 december 2012.

Annual Accounts
54
Notes to the Financial Statements for the Year Ended 31 December 2012 (continued)
13. INVESTMENTS
Analysis of movement of investments 2012 2011
£’000 £’000
Carrying value (market value) at beginning of year 108,687 78,222
Additions to investments at cost 289,490 329,943
disposals at carrying value (282,392) (298,990)
net loss on revaluation (905) (488)
Carrying value (market value) at end of year 114,880 108,687
Listed securities managed by fund managers 25,230 26,134
deposits with banks and building societies 89,650 82,553
114,880 108,687
included in the above are the following investments that individually represent more than 5% of the total investment portfolio:
2012 2011
£’000 £’000
8% UK Treasury Stock 2013 7,395 7,926
Term deposits
Bank of Scotland 10,000 10,000
nationwide 10,000 10,000
nat West Bond 10,000 10,000
Svenska Handelsbanken 10,000 10,000
Lloyds TSB 10,000 –
Santander 10,000 –
national Australia 10,000 –
Clydesdale Bank – 10,000
BBVA – 6,000
Money market funds
RBS Global Treasury funds 7,826 –
Barclays Business Premium 6,921 6,807

Annual Accounts
55
Notes to the Financial Statements for the Year Ended 31 December 2012 (continued)
14. CREDITORS: AMOUNTS FALLING DUE WITHIN ONE YEAR
2012 2011 *(restated)
£’000 £’000
Trade creditors 4,471 4,235
Taxation and social security 1,267 1,154
deferred income 3,546 1,912
Accruals:
Training grants and allowances payable to 31 december 23,182 18,188
College fees 7,286 6,917
Other 10,168 10,320
Total Creditors 49,920 42,726
Balances with intra-Government bodies
Central Government bodies 3,620 1,819
Public corporations 85 233
Local authorities 46 40
3,751 2,092
Balances with other bodies 46,169 40,634
Total Creditors 49,920 42,726
* The restatement of 2011 figures is a reclassification of certain balances within the note.
15. FINANCIAL INSTRUMENTSfRS 29 requires the disclosure of information to enable users to evaluate the significance of financial instruments for CiTB’s financial position, the nature and extent of risks arising from financial instruments to which it was exposed during the period and at the reporting date and how these are managed.
Financial assets and liabilities by categorySet out below are the accounting classifications of each class of financial assets and liabilities as at 31 december 2012, together with any associated gains and losses. Their carrying value less impairment provision of trade debtors (see Credit Risk below) are assumed to be approximate to their fair value.
Loans and receivables
Available for sale
Other financial liabilities
Total 2012
Total 2011
£’000 £’000 £’000 £’000 £’000 *(Restated)
debtors excluding prepayments 42,720 – – 42,720 18,592
investments – 114,880 – 114,880 108,687
Cash at bank 1,439 – – 1,439 333
Creditors – – (49,920) (49,920) (42,726)
2012 44,159 114,880 (49,920) 109,119 84,886
2011 18,925 108,687 (42,726) 84,886
investment losses £’000 £’000
Loss on disposal of investments – (86)
net movement in fair value of available-for-sale investments (905) (402)
(905) (488)
* The restatement of 2011 figures is a reclassification of certain balances within the note.

Annual Accounts
56
15. FINANCIAL INSTRUMENTS (continued)
Financial risk managementQualitative information on CiTB’s approach to financial risk management is disclosed in the ‘investments’ and ‘Reserves’ sections of the Annual Report above, and in the Governance Statement. Quantitative disclosures are included here. All investments are reported at market value at 31 december 2012.
Credit riskCiTB is exposed to credit risk of £7,189,000 (2011 £4,987,000) in other trade debtors (see note 11 on page 53), which are stated at fair value, after making an impairment provision of £510,000 (2011 £210,000) for bad debts. However, this is not considered to be significant as major customers are familiar and loss experience has been small. 93% of non-levy debts have been recovered over the past year and it is expected that the majority of the current outstanding figure will be settled within normal payment terms. Any amounts that are overdue or impaired are adequately provided for. no collateral is held in respect of any debtors. Levy debtors arise as a consequence of raising statutory assessments on in-scope employers and are not perceived to be a credit risk.
As at 31 december 2012, term deposits and cash holdings are all placed with approved UK banks and are spread across several institutions. CiTB has not suffered any loss during 2012 (2011 nil) in relation to cash held by bankers.
Liquidity risk58.5% of CiTB’s income in 2012 was derived from the statutory levy (2011 57.0%), and the right to raise this levy was confirmed for the three years 2012 to 2014.
The reserves policy is set out under accounting policies (note 1 on pages 44 to 46). CiTB believes that the level of unrestricted reserves at the end of 2012, combined with secure matching of expenditure to funding income for the year ahead and the continuation of levy receipts, is such that CiTB is not exposed to unacceptably high liquidity risks.
Market risks
Interest rateCiTB’s financial assets, excluding short-term debtors and creditors, are made up of investments and cash. information about material investments is disclosed at note 13 on page 54.
Cash is held in a variety of non-interest bearing bank accounts.
interest income for the year made up 0.9% (2011 0.8%) of CiTB incoming resources and no loans are held, so exposure to interest rate risk is minimal. The effect of a 1% movement in interest rates in 2012 would have been approximately £1,074,000.
Foreign currencyAll of CiTB’s financial assets are denominated in pounds sterling; therefore there is no exposure to any foreign currency risk.
Other priceexposure to wider price risks is reduced by appropriate procurement controls coupled with competitive tendering and the securing of longer-term fixed price contracts where possible. Whilst some contracts have an element of variability based on the Retail Price index, any risks arising from these are not deemed to be material.
Notes to the Financial Statements for the Year Ended 31 December 2012 (continued)
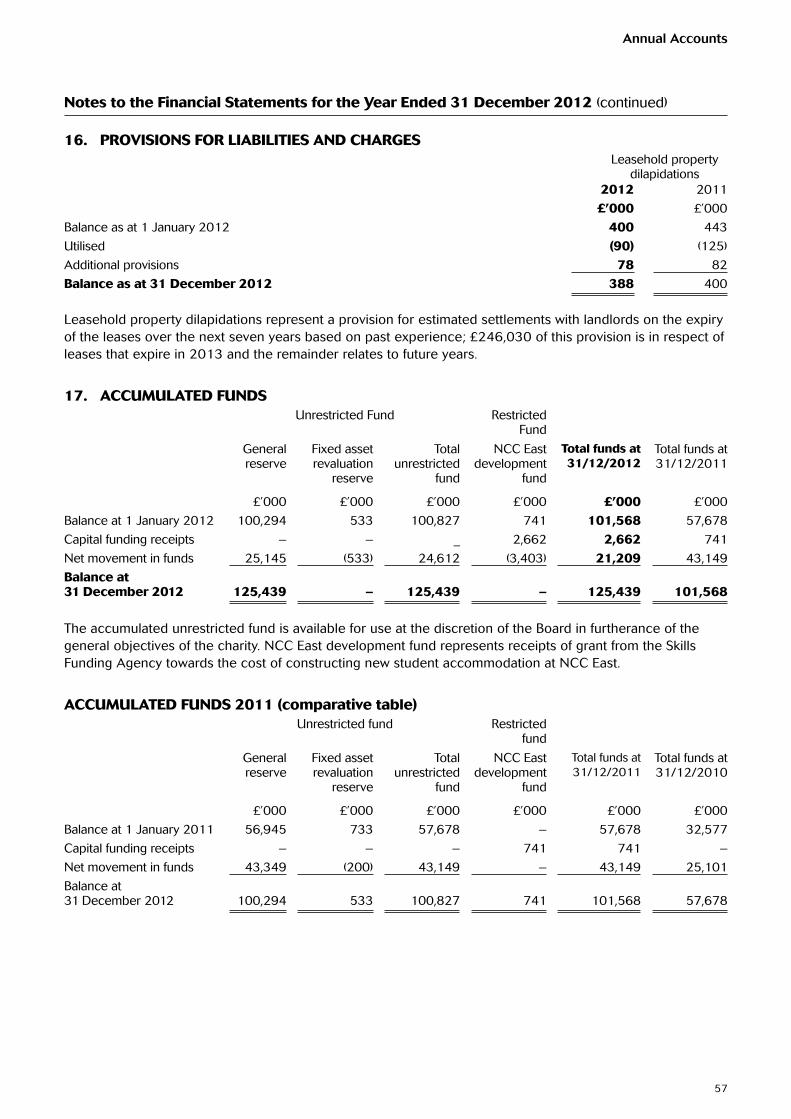
Annual Accounts
57
Notes to the Financial Statements for the Year Ended 31 December 2012 (continued)
16. PROVISIONS FOR LIABILITIES AND CHARGESLeasehold property
dilapidations2012 2011
£’000 £’000
Balance as at 1 January 2012 400 443
Utilised (90) (125)
Additional provisions 78 82
Balance as at 31 December 2012 388 400
Leasehold property dilapidations represent a provision for estimated settlements with landlords on the expiry of the leases over the next seven years based on past experience; £246,030 of this provision is in respect of leases that expire in 2013 and the remainder relates to future years.
17. ACCUMULATED FUNDSUnrestricted fund Restricted
fund
General reserve
fixed asset revaluation
reserve
Total unrestricted
fund
nCC east development
fund
Total funds at 31/12/2012
Total funds at 31/12/2011
£’000 £’000 £’000 £’000 £’000 £’000
Balance at 1 January 2012 100,294 533 100,827 741 101,568 57,678
Capital funding receipts – – _ 2,662 2,662 741
net movement in funds 25,145 (533) 24,612 (3,403) 21,209 43,149
Balance at 31 December 2012
125,439
–
125,439
–
125,439
101,568
The accumulated unrestricted fund is available for use at the discretion of the Board in furtherance of the general objectives of the charity. nCC east development fund represents receipts of grant from the Skills funding Agency towards the cost of constructing new student accommodation at nCC east.
ACCUMULATED FUNDS 2011 (comparative table)Unrestricted fund Restricted
fund
General reserve
fixed asset revaluation
reserve
Total unrestricted
fund
nCC east development
fund
Total funds at 31/12/2011
Total funds at 31/12/2010
£’000 £’000 £’000 £’000 £’000 £’000
Balance at 1 January 2011 56,945 733 57,678 – 57,678 32,577
Capital funding receipts – – – 741 741 –
net movement in funds 43,349 (200) 43,149 – 43,149 25,101
Balance at 31 december 2012
100,294
533
100,827
741
101,568
57,678

Annual Accounts
58
Notes to the Financial Statements for the Year Ended 31 December 2012 (continued)
18. GROSS CASH FLOWS2012 2011
£’000 £’000
Returns on investments and servicing of finance
interest received on investments 1,826 1,660
Capital expenditure
Payments to acquire tangible fixed assets (7,905) (3,647)
Receipts from sales of tangible fixed assets 725 148
Capital grant receipts 2,662 741
(4,518) (2,758)
Management of liquid resources
Placed on deposit and purchase of externally managed investments (289,490) (329,943)
deposit withdrawals and sale of externally managed investments 282,392 299,076
(7,098) (30,867)
19. ANALYSIS OF CHANGES IN NET FUNDS
At 01/01/12 Cash flows Other non-cash movements
At 31/12/12
£’000 £’000 £’000 £’000
Current asset investments on call 16,553 3,098 – 19,651
Other current asset investments 92,134 4,000 (905) 95,229
108,687 7,098 (905) 114,880
Cash at bank 333 1,106 – 1,439
109,020 8,204 (905) 116,319
20. ITB PENSION FUNDCiTB is a participating employer in the iTB Pension funds, a defined benefit scheme. The most recent triennial valuation of the scheme was performed as at 31 March 2010.
The principal future assumptions used are that the real rate of return (net of pension increases) would be 1.9% pa, the nominal rate of investment return on assets would be 5.8% pa; the rate of pension increases (Old and new Sections) would be in line with the Retail Prices index (RPi) changes (and assumed to be 3.8% pa); and ‘real’ salary inflation would be 1.5% pa.
The 2010 valuation indicated that the actuarial value of the assets held by the total Scheme fund showed a deficit of £76m against the Scheme liabilities, based on fRS 17 methodologies.
in accordance with the provisions of fRS 17 relating to multi-employer schemes, the Scheme has been accounted for as a defined contribution scheme, as the proportion of assets and funding level attributable to CiTB are not separately identified.
from 1 January 2011 all CiTB staff in the iTB Pension funds Scheme contribute to the 2007 section, having previously been in either the ‘Old Section’ or (if joining after 1 April 2008) the ‘new Section’. employee and employer contribution rates for the 2007 section are 6% and 7.6% respectively (2011 6% and 7.6% respectively). Total employer contribution payments to the Scheme for 2012 were 18.6% (2011 19.5%). This figure includes employer contributions and agreed fixed monthly deficit payments. Total deficit contributions of £3.6m were paid to the Scheme in the year (2011 £13.5m).
Staff starting employment with CiTB after 1 January 2013 who wish to join the iTB Pension funds Scheme will only be eligible to participate in a new defined contribution section, for which the employee and employer contribution rates are 4.0% and 6.0% respectively.
Total payments made in 2012 are shown in note 23 on page 60.
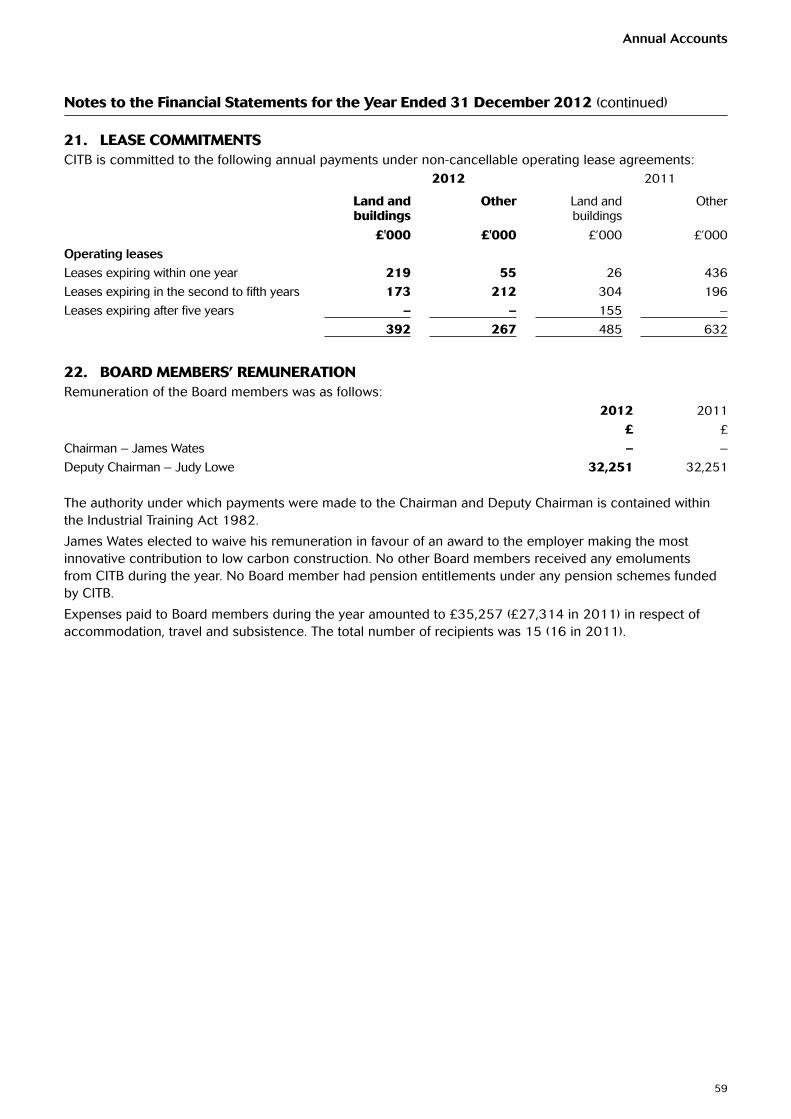
Annual Accounts
59
Notes to the Financial Statements for the Year Ended 31 December 2012 (continued)
21. LEASE COMMITMENTSCiTB is committed to the following annual payments under non-cancellable operating lease agreements:
2012 2011
Land and buildings
Other Land and buildings
Other
£'000 £'000 £’000 £’000
Operating leases
Leases expiring within one year 219 55 26 436
Leases expiring in the second to fifth years 173 212 304 196
Leases expiring after five years – – 155 –
392 267 485 632
22. BOARD MEMBERS’ REMUNERATIONRemuneration of the Board members was as follows:
2012 2011
£ £
Chairman – James Wates – –
deputy Chairman – Judy Lowe 32,251 32,251
The authority under which payments were made to the Chairman and deputy Chairman is contained within the industrial Training Act 1982.
James Wates elected to waive his remuneration in favour of an award to the employer making the most innovative contribution to low carbon construction. no other Board members received any emoluments from CiTB during the year. no Board member had pension entitlements under any pension schemes funded by CiTB.
expenses paid to Board members during the year amounted to £35,257 (£27,314 in 2011) in respect of accommodation, travel and subsistence. The total number of recipients was 15 (16 in 2011).

Annual Accounts
60
Notes to the Financial Statements for the Year Ended 31 December 2012 (continued)
23. PARTICULARS OF STAFFduring the year, the average number of staff directly and temporarily employed by CiTB (expressed in full-time equivalents) was as follows:
directly employed
Temporary 2012 number 2011 number
Training 883 51 934 919
Other activities 470 42 512 432
1,353 93 1,446 1,351
during the year, the following costs were incurred in respect of the above:2012 2011
*(restated)£’000 £’000
Salaries of directly employed staff 43,418 38,829
Temporary staff costs 6,961 4,728
Redundancy costs 904 649
Social security costs 3,484 3,018
Other pension costs (see note 20) 6,574 15,775
61,341 62,999
The restatement of 2011 figures is a reclassification of certain costs within the note.
The remuneration, pension entitlements and pension transfer values of the most senior members of CiTB’s staff can be found in the Remuneration Report on pages 33 and 34.
The emoluments, including benefits in kind but excluding pension contributions and redundancy payments, of employees earning more than £60,000, other than those stated in the Remuneration Report (pages 33 and 34), are within the ranges shown below.
Number of employees
2012 2011
£60,001 – £70,000 24 23
£70,001 – £80,000 14 12
£80,001 – £90,000 5 3
£90,001 – £100,000 3 2
All employees earning over £60,000 (with the exception of one employee falling within the £70,001 – 80,000 range) accrue benefits under the iTB Pension fund.
details of staff leaving the organisation during 2012 for whom exit packages were payable, are:
Exit package cost band Number of compulsory
redundancies
Number of other departures
agreed
Total number of exit packages by
cost band
2012 2011 2012 2011 2012 2011
<£10,000 46 3 – – 46 3
£10,000 – £25,000 22 13 2 – 24 13
£25,000 – £50,000 12 6 – 1 12 7
£50,000 – £100,000 – 2 – 1 – 3
Total number of exit packages 80 24 2 2 82 26
Total cost /£ £903,801 £649,443 £34,016 £139,466 £937,817 £788,909

Annual Accounts
61
24. TAXATIONAs a registered charity, CiTB is exempt from corporation tax on its charitable activities under section 505 of the income and Corporation Taxes Act 1988. However, incoming resources includes income which is deemed to be of a non-charitable nature, resulting in a taxable profit of £20,475 (2011 £9,000). This has given rise to a potential corporation tax liability of £4,095 (2011 £1,960), provision for which is included under taxation in creditors (note 14 on page 55).
25. RELATED PARTY TRANSACTIONSCiTB is sponsored by the department for Business, innovation and Skills (BiS) which is regarded as a related party. during 2012, there were some material transactions with other entities for which BiS is regarded as the parent department (namely the SfA and the UKCeS).
in addition, CiTB has had various material transactions with other Government departments and various central Government bodies. Most of these have been with Skills development Scotland, Welsh Assembly Government and HM Revenue and Customs.
At 31 december 2012 there were material debtor balances of £6,744,133 (2011 £7,032,771) with Skills funding Agency, £897,891 (2011 £498,519) with Skills development Scotland, £208,301 (2011 £1,458,099) with the Welsh Assembly Government and material creditor balances of £932,049 (2011 £1,125,129) with the Skills funding Agency, £263,174 (2011 £203,108) with HM Revenue and Customs and £256,555 (2011 £323,104) with UKCeS.
Appendix A (on pages 66 and 67) lists the members of the Board and its Committees, also giving the names of their employers. Appendix B (pages 68 and 69) shows the Register of interests of Board Members. On this basis, in the normal course of business, most Board members are likely to have commercial interests as levy payers and grant claimers which, as they are transacted at arm’s length, are not considered to be material for either party.
Material cash support payments paid during 2012, including those paid to employers of Board members, are set out in note 6 (page 48).
during the year, no key manager, employee or other related party has undertaken any material transactions with CiTB.
26. LOSSES AND SPECIAL PAYMENTSduring the year, no special payments were made. There was one reportable loss over £250,000 which relates to the impairment of £1,557,784 of iT assets which have been judged to be unusable to the value of the sums invested (see note 10). Total bad debts written off during the year amounted to £1,920,595 (2011 £3,118,821).
27. EVENTS AFTER THE BALANCE SHEET DATEThere have been no events after the balance sheet date requiring an adjustment to the financial Statements. The financial Statements were authorised for issue on the date the Comptroller and Auditor General signed (see page 40). events after this date have not been considered.
Notes to the Financial Statements for the Year Ended 31 December 2012 (continued)

Statistical information
62
Statistical Information for the year ended 31 december 2012Table 1: Distribution of employers by 2011 Levy Assessment band and main activity
Main activity
Levy value
Not assessed
£ Zero
£s 1-99
£s 100-499
£s 500-999
£s 1,000+
Total
Alteration to a building/part of a building 135 360 12 33 159 699Architectural steelwork installation 10 28 1 5 38 82Asbestos removal 15 23 4 10 41 93Asphalt and tar spraying 29 141 1 14 31 171 387Bricklaying 108 800 4 7 8 119 1,046Building and civil engineering 467 1,985 2 68 190 1,511 4,223Building repair and maintenance 381 2,341 2 125 263 1,170 4,282Cavity wall insulation or draught proofing 6 12 1 7 47 73Civil engineering 323 581 6 38 109 817 1,874Construction labour agencies 67 108 1 7 26 209Curtain walling/structural glazing 8 14 5 31 58damp proofing 6 52 6 5 26 95demolition 83 160 1 18 39 177 478developers 154 699 2 13 38 236 1,142diamond drilling 26 68 6 6 26 132dry lining or partitioning specialist 52 285 2 13 18 286 656erecting/dismantling exhibition stands 6 12 1 2 12 33felt roofing 8 118 8 14 69 217fire protection 12 20 1 2 33 68Kitchen/bedroom/bathroom installation 102 516 31 52 189 890flat glass glazing 9 105 1 11 30 41 197floor covering 3 101 1 7 15 71 198flooring 89 237 17 31 159 533General building 2,488 14,884 19 615 1,150 6,098 25,254Hard landscaping 30 128 5 8 34 205House building 206 1,229 47 95 839 2,416interior fit-out 91 162 11 17 310 591Joinery and carpentry (mainly site work) 650 4,385 9 123 187 818 6,172Joinery manufacture 168 870 1 91 262 462 1,854Mastic asphalting 7 30 1 8 19 65Mastic sealant application 5 30 5 10 23 73Painting and decorating 415 2,879 7 97 196 953 4,547Paving 12 130 6 4 20 172Piling 5 9 1 3 30 48Plant hire/repair and/or tool hire 232 929 1 100 244 658 2,164Plastering and/or artexing 268 1,330 3 29 38 474 2,142Preparing/fixing stone for building including stonemasonry
44 172 14 25 120 375
Reinforced concrete specialist 10 68 1 1 4 37 121Roof sheeting and cladding 69 173 14 28 242 526Roofing including slating and tiling 283 1,642 4 80 179 762 2,950Scaffolding 268 550 79 178 690 1,765Shop fitting 83 197 12 34 377 703Site preparation and groundworks 180 681 7 44 82 388 1,382Steeplejack/lightning conductor engineering
2 29 5 18 37 91
Suspended ceiling installation 51 196 1 14 20 206 488Swimming pool construction 2 18 1 7 21 49Utilities 48 36 2 3 46 135Wall and floor tiling 78 327 3 13 18 155 594Other activities 127 214 19 33 227 620Total 7,921 40,064 79 1,831 3,771 19,501 73,167
notes: not assessed – employers in their first year of registration and untraceable employers Zero – employers whose payroll and labour-only payments fall below the £80,000 threshold

Statistical information
63
Table 2: Levy income by employer size
Employer size Number of employers Number of employees Levy £'000
Large 233 222,517 40,518
Medium 1,384 132,526 31,381
Small 8,425 167,649 34,112
Micro 55,204 132,907 29,787
Other 7,921 not known nil
Total 73,167 655,599 135,798
Table 3: Number of employers assessable to levy
Number of employers Number of employees
Assessable to positive levy 25,182 522,925
Assessable to zero levy 40,064 132,674
not assessed 7,921 not known
Total 73,167 655,599
Table 4: Grant and support by size of employer
Number of employers claiming grant and
other support
Value of grant and other support
payments £'000
Percentage of total grant and other
support
Large 229 26,315 25%
Medium 1,238 29,024 28%
Small 4,462 22,511 21%
Micro 8,121 26,059 25%
Other 217 1,252 1%
Total 14,267 105,161 100%
Key to size of employer
Large: 250+ employees
Medium: 50 – 249 employees
Small: 10 – 49 employees
Micro: 0 – 9 employees
Other: includes new registrations

Statistical information
64
Table 5: Number of employers with new entrant trainees
Number of trainees
Employer size Total
Large Medium Small Micro
1 25 255 1,552 7,547 9,379
2 to 5 35 368 1,360 2,074 3,837
6 to 10 34 132 148 0 314
11 to 15 14 58 27 0 99
16 to 20 7 23 0 0 30
21 to 50 30 17 0 0 47
51 to 100 12 0 0 0 12
101 and over 4 0 0 0 4
Total 161 853 3,087 9,621 13,722
Table 6: Employers claiming grant by levy band
Levy banding Employers claiming grant Employers not claiming grant
Assessable to positive levy 8,021 11% 17,161 24%
Assessable to zero levy 5,347 7% 34,717 47%
Other 899 1% 7,022 10%
Total 14,267 19% 58,900 81%
Key to size of employer
Large: 250+ employees
Medium: 50 – 249 employees
Small: 10 – 49 employees
Micro: 0 – 9 employees
Other: includes new registrations
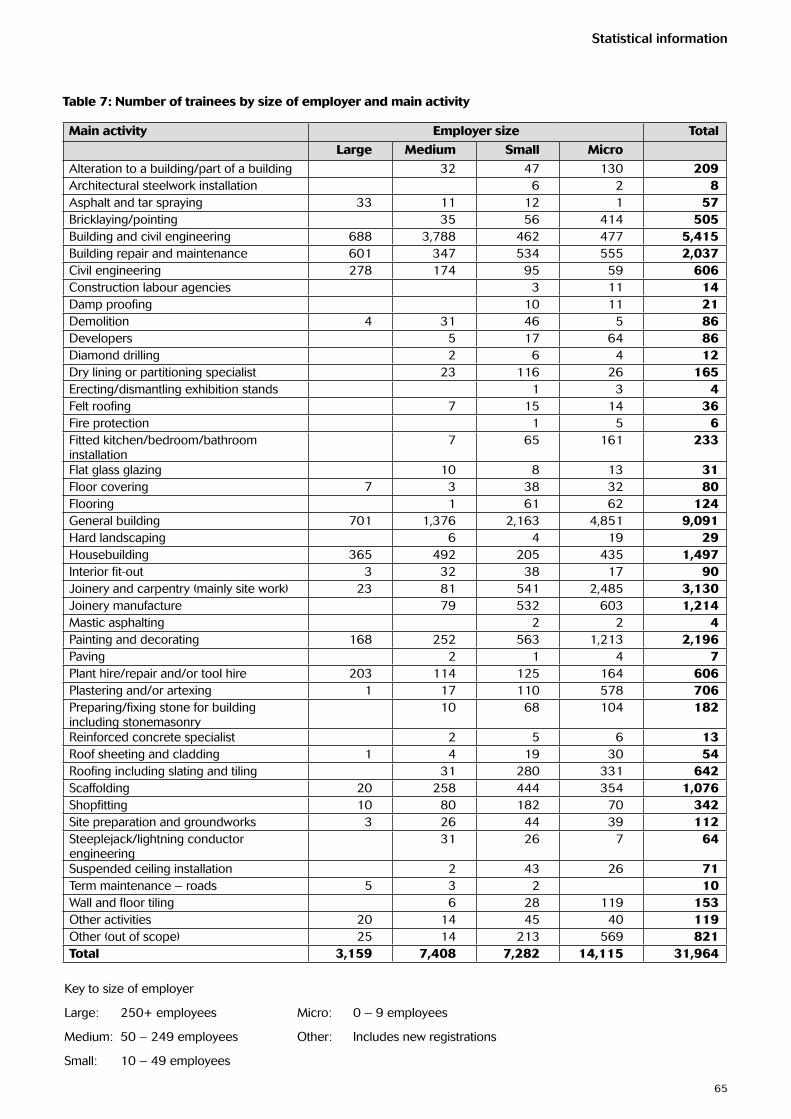
Statistical information
65
Table 7: Number of trainees by size of employer and main activity
Main activity Employer size Total
Large Medium Small Micro
Alteration to a building/part of a building 32 47 130 209Architectural steelwork installation 6 2 8Asphalt and tar spraying 33 11 12 1 57Bricklaying/pointing 35 56 414 505Building and civil engineering 688 3,788 462 477 5,415Building repair and maintenance 601 347 534 555 2,037Civil engineering 278 174 95 59 606Construction labour agencies 3 11 14damp proofing 10 11 21demolition 4 31 46 5 86developers 5 17 64 86diamond drilling 2 6 4 12dry lining or partitioning specialist 23 116 26 165erecting/dismantling exhibition stands 1 3 4felt roofing 7 15 14 36fire protection 1 5 6fitted kitchen/bedroom/bathroom installation
7 65 161 233
flat glass glazing 10 8 13 31floor covering 7 3 38 32 80flooring 1 61 62 124General building 701 1,376 2,163 4,851 9,091Hard landscaping 6 4 19 29Housebuilding 365 492 205 435 1,497interior fit-out 3 32 38 17 90Joinery and carpentry (mainly site work) 23 81 541 2,485 3,130Joinery manufacture 79 532 603 1,214Mastic asphalting 2 2 4Painting and decorating 168 252 563 1,213 2,196Paving 2 1 4 7Plant hire/repair and/or tool hire 203 114 125 164 606Plastering and/or artexing 1 17 110 578 706Preparing/fixing stone for building including stonemasonry
10 68 104 182
Reinforced concrete specialist 2 5 6 13Roof sheeting and cladding 1 4 19 30 54Roofing including slating and tiling 31 280 331 642Scaffolding 20 258 444 354 1,076Shopfitting 10 80 182 70 342Site preparation and groundworks 3 26 44 39 112Steeplejack/lightning conductor engineering
31 26 7 64
Suspended ceiling installation 2 43 26 71Term maintenance – roads 5 3 2 10Wall and floor tiling 6 28 119 153Other activities 20 14 45 40 119Other (out of scope) 25 14 213 569 821Total 3,159 7,408 7,282 14,115 31,964
Key to size of employer
Large: 250+ employees
Medium: 50 – 249 employees
Small: 10 – 49 employees
Micro: 0 – 9 employees
Other: includes new registrations

Appendices
66
TB FC TC AC RC VG HSECSteve ACASTeR, Persimmon Homes i
Harry AdAM, formerly ian Williams Ltd n ; l n
Russell AdfieLd, Health and Safety executive v
Rob ALLen, Clee Hill Plant Ltd n
John ALLOTT, Unite the Union o
John ARMSTROnG, Construction employers federation ni i
Robert BALdWin, Unite the Union o
Bruce BARCLAy, department for Business, innovation and Skills v
Gilbert BARROn, department for Business, innovation and Skills v
ian BiLLyARd, Leeds College of Building s s
Greg BROWn, Construction industry Council n
Paul BROWn, British Association of Construction Heads v
Vaughan BURnARd, CiOB v
darin BURROWS, Rullion Alltrades Ltd n
duncan CAnney, Willmott dixon Holdings Ltd n
John CARPenTeR, The Joint Board of Moderators v
Professor Barry CLARKe, Leeds University s
Richard CLARKe, Unite the Union o
Bob COLLinS, Stokey Plant n
ian diCKeRSOn, Kier Group Services n
John diCKSOn, Owen Pugh Holdings Ltd n
Keith dOnneLLy, Carillion Training Services s
Andrew dUnCAn, department for Business, innovation and Skills v
Richard eASTOn, A f Hadley Ltd, T/A Hadley Shopfitters n
Hayley eLLiS, federation of Master Builders v
derek fieLd, formerly McCarthy & Stone Retirement Lifestyles Ltd n n
Peter fiSHeR, Costain Ltd l
Kevin fiTZPATRiCK, Wates Group Ltd n
Jim GAMBLe, Union of Construction Allied Trades and Technicians o
Trevor GAMBLe, Ramble Containers Ltd ;
Jim GiLMOUR, Regency Homes (Scotland) Ltd n
Peter GOdSALL, interserve Ltd i
John HALLAM, Simons Construction Ltd n
Bob HARPeR, Ashstead Plant Hire Co Ltd n
Vaughan HART, Scottish Building t
Geoff HOLT, Associated Roofing and Maintenance Ltd n n
Robert HUdSOn, national Association of Shopfitters t
dafydd HUGHeS, Welsh Assembly Government v
Chris JOneS, BAM Construct UK Ltd n ;
Richard KAne, Stallard Kane Associates i
Billy KiRKWOOd, RdK Construction Ltd n
Alan KniGHT, Union of Construction, Allied Trades and Technicians o
A: Members of the Board and its Committees

Appendices
67
TB FC TC AC RC VG HSECRichard LATHAM, Persimmon plc n
duncan LAyZeLL, Swift Horsman Group Ltd n
Pat LeAVey, College of north West London i
Geoff LiSTeR, Greenwood estate and Property Maintenance Ltd ;
Robert LOCKey, national House-Building Council i
John LORiMeR, JLO innovation Ltd ` n
Judy LOWe, Strategic Consulting Ltd m n l m
Simon MAnTLe, national House-Building Council n
Terry McCOMiSKey, Council for the Curriculum, examinations and Assessments
v
Jim MCKeCHnie, JBM Contractors i
Katrine McLeOd, Scottish Qualifications Authority v
Hayden MeAd, dyer and Butler n
Stephen MURPHy, UCATT o o
Tim PeACH, Lend Lease n l n
Martyn PRiCe, Consign (Construction Skills Solutions) Ltd n n
Harold RACKHAM, G n Rackham & Sons Ltd n n
derek ROSS, BAM nuttall Ltd n
Lance SAUndeRS, CiOB i
John SCOTT, Morgan Sindall fit-out (a division of Morgan Sindall plc) n
Amit SHAH, Balfour Beatty plc n
frank SHePPARd, Unite the Union o
Geoff SnOW, OBe, Snows Construction 1976 Ltd n
Haydn STeeLe, Construction Plant-hire Association ;
Billy SWeeney, Scottish Building n
neil VeRnOn, UCATT o
James WATeS, Wates Group Ltd l l
Ray WiLSOn, Carillion Training Services n n
(This table shows the position as at 31 december 2012)
l Chairman t federation Member TB The Board
m deputy Chairman i Member FC finance Committee
n employer Member ` Client Member TC Training Committee
o Trades Union Member v Observer AC Audit Committee
s education Member ; ex-officio RC Remuneration Committee
VG Standards and Qualifications Validation Group
HSEC Health, Safety and environment Committee

Appendices
68
B: Register of Interests of Board MembersRelated party transactionsemployer Board members must be concerned in the management of the activities of an employer engaging in the construction industry in order for their appointment by the Secretary of State to be valid. All will therefore have business interests as levy payers or potential grant recipients that may be perceived to conflict with their responsibilities as Board members.
The following have in addition declared other personal or business interests.
John AllottNational Secretary for Construction. Unite the Union
John is a director of Construction Skills Certification Scheme Ltd.
Ian BillyardPrincipal, Leeds College of Building
ian is a governor of the david young Community Academy, Leeds, a Council member of the City & Guilds of London institute and a governor of the City of Leeds High School. He is also a director of LCB enterprises – a new company set up by Leeds College of Building.
Darin BurrowsOperations Director, Rullion Alltrades Ltd
darin is Operations director for Rullion Build Ltd and also sits on the Recruitment employment Confederation executive Committee (Construction Sector).
Barry ClarkeProfessor of Civil Engineering Geotechnics, University of Leeds
Barry is President of the institution of Civil engineers and a member of Council of that institution. He is a member of the executive of the Construction industry Council; Chairman of the engineering Accreditation Board; and a member of the executive Group of the engineering Professors Council.
Bob CollinsStokey Plant Hire Ltd
Bob is Current President of the Construction Plant-hire Association and a member of CiTB’s Construction Plant Competence Scheme Management Committee. He is a shareholder of Stokey Plant Hire Ltd, a company potentially in receipt of grant payments.
Jim GilmourDirector of Regency Building, Regency Finance and ODC Ltd
Jim is national President and a director of the federation of Master Builders. He is also a director of fMB Training Services Ltd.
Chris JonesBAM Construct UK Ltd
Chris is director of Learning and development for BAM Construct UK Ltd with responsibility for claiming training grants from CiTB.
Billy Kirkwood Managing Director of RDK Construction Ltd, RobertRyan Timber Engineering Limited and RobertRyan Homes. Director of Constructive Architectural Design.
Billy is a member and past president of the Scottish Building federation. He is also a member of Homes for Scotland and a Registered nHBC Builder. RdK Construction Ltd and the other businesses of which Billy is a director are all potential levy payers and grant recipients.
John Lorimer Director, JLO Innovation Ltd
JLO innovation Ltd provides consultancy services to public sector clients and contractors. John does not envisage any conflict but will declare any interest if appropriate. He is a member of the BiS BiM Task Group, Visiting Professor at Salford University and Project Board member at Oldham College.

Appendices
69
Martyn Price Chief Executive of Consign (Construction Skills Solutions) Ltd
Martyn chairs the SkillBuild and Skills Competitions Strategic Board and represents the construction sector on the Apprenticeship Ambassador network.
James WatesDeputy Chairman, Wates Group Ltd
James is Chairman of the UK Contractors Group, Commissioner on the UK Commission for employment and Skills, Vice Chairman of the CBi Construction Council, President of the British Council for Offices, a Trustee of BRe (the Building Research establishment) and immediate Past President of the CiOB.
Ray WilsonDirector and General Manager, Carillion Training Services Ltd
Ray is a member of the UKCG Training Sub-group, of its Apprenticeship Task Group and of the Cross-industry Construction Apprenticeship Taskforce. He is also a member of the B-Live Construction Careers Board.

Appendices
70
during 2012, CiTB maintained close contact with the following major employer organisations:
The British Woodworking federation
The Civil engineering Contractors Association
The Construction Plant-hire Association
The federation of Master Builders
The Hire Association europe
The Home Builders federation
The national Association of Shopfitters
The national federation of Builders
The national federation of demolition Contractors
The national Specialist Contractors Council
The Scottish Building federation
The Scottish decorators federation
The Scottish Plant Owners’ Association
The UK Contractors Group
CiTB also maintains regular contact with the following trades unions over skills and training issues:
Unite the Union (formerly TGWU)
Union of Construction, Allied Trades and Technicians (UCATT)
C: Employer Organisations

Appendices
71
As an industrial Training Board established to promote and improve the standard of training within an industry, the Construction industry Training Board – generally known as CiTB – is held to be established for exclusively charitable purposes and so is registered as a charity (Registered Charity number 264289). Members of the Board, who also act as Trustees of the charity, are identified on page 21.
its charitable activities are partly funded by the statutory levy established by the industrial Training Act 1982 and confirmed by Levy Orders passed by both Houses of Parliament. The most recent is the industrial Training Levy (Construction industry Training Board) Order 2012 (2012 no. 549) enacted on 27 March 2012 and coming into force on 28 March 2012. full details of the powers and responsibilities of CiTB as well as the restrictions placed on it can be found in the industrial Training Act 1982 and subsequent amendments.
in 2003, the organisation, operating with the Construction industry Council and CiTB northern ireland (another statutory body), was recognised as the Sector Skills Council (SSC) for Construction, an entity collectively known as ConstructionSkills. in 2009, after a rigorous review by the national Audit Office, its performance was assessed as Good against the framework established by the UK Commission for employment and Skills (UKCeS) and its licence to operate as an SSC renewed by the Secretary of State on the recommendation of the UKCeS.
The SSC is governed by a panel on which all three partner organisations are represented. This body advises on the development and delivery of a programme of work to give strategic leadership and influence in support of the learning and skills agenda across the construction sector and throughout the UK.
Since 2004, CiTB has maintained a Sector Skills Agreement (SSA) involving commitments from employers and their trade associations, the trades unions, the education sector and Government. it also created a robust forecasting model (the Construction Skills network (CSn)) for the sector’s future skill needs validated by industry locally and nationally. The CSn has developed increasingly sophisticated analysis of data on skills needs and training supply across the UK, which is used by governments, local authorities and other stakeholders.
in addition, the national Skills Academy for Construction (nSAfC), based on a project-driven approach to supporting training, helps to ensure that provision will be able to meet sector needs in more difficult economic times.
CITB’s aims and objectivesCiTB exists to help employers ensure that there are, and will continue to be, enough trained people to meet the needs of the construction industry. its principal activities are designed to achieve this end.
The industrial Training Act passed in 1964 made possible the establishment of industrial Training Boards ‘for the purpose of making better provision for the training of persons for employment… in any activities of industry’. in that July, the industrial Training (Construction Board) Order 1964 brought CiTB into being. The legislation also provided for the raising of a training levy to fund its activities. Rates of levy (which, with the consensus agreement of the industry expressed through employers’ organisations, is not based on exemption) are recommended by the Board and subject to affirmative resolution by both Houses of Parliament. for assessments payable in 2012, 2013 and 2014, levy rates are 0.5% of the total of payments made to employees and 1.5% of the payments made under labour-only agreements, offset by 1.5% of labour-only receipts from employers in the construction industry.
The Governance Statement (pages 35 to 38) gives more information about how the business is governed, and a list of those who served as trustees during 2012 is on page 21. Board and main committee membership is shown in Appendix A, on pages 66 and 67. Members of the senior management team are identified in the Remuneration Report on pages 33 and 34.
CiTB is indebted to the employers’ organisations and other bodies that provide valuable support and advice, and to the many employers and stakeholders who give their time freely to help direct the business. A list of the major employers’ and employee organisations with which CiTB maintains close contact is shown in Appendix C, page 70.
D: CITB Statutory Basis

Appendices
72
CITB’s structureActivities across Great Britain are covered in this report, with separate pages for england, Scotland and Wales (on pages 11-20), reflecting the diversity of national approaches to meeting the needs of employers.
The business aims to become Simpler to deal with, faster to respond to customers, and Closer to their needs. it has six directorates (Business Services, employer Services, nCC, Skills Strategy, Communications and Change, and Corporate Services), each headed by a director reporting to the Chief executive and collectively responsible to the Chairman and Board. A separate Corporate Assurance team reports directly to the Chief executive. Our five-year rolling activity-based business plan is informed by external industry-focused drivers and internal organisational development drivers. While clear accountabilities for delivery are seen as critical, the vital importance of interdependencies between directorates is also reflected in each activity plan. no single directorate can fully meet any of its accountabilities without the support of at least one other directorate.
CITB’s principal activitiesCiTB delivers its objectives primarily by giving financial help to employers engaged in training, offering advice about, and support for, their training needs, developing and maintaining a framework of standards and qualifications in consultation with the industry, and managing schemes for recording achievement. it provides training itself where there is no satisfactory market alternative. delivery plans are published in its Business Plan and updated annually. These include key performance indicators and targets for the forthcoming year and beyond. information about progress against those plans in 2012 is given on pages 6 and 7.
Research and developmentCiTB maintains an ongoing programme of research on matters relevant to training in construction. The CSn provides an authoritative basis for forecasting capacity, productivity and skills across the sector, which helps the organisation and industry plan for the impact of future trends on the workforce. Outputs from this and other research work are reported widely and available from our website, citb.co.uk. CiTB undertakes a regular review of national occupational standards, ensuring that they match current industry needs. This involves consultation and research with employers and trade associations across the four home countries. The development of appropriate training and other support material is undertaken separately.
CITB and public serviceAs a non-departmental public body, CiTB is expected continually to raise its standards of public service and to become more responsive to the wishes of users. As this report shows, CiTB constantly seeks to ensure that its policies accord with industry’s needs and that it operates cost-effectively in the interests of the levy payer.
in particular, CiTB believes that transparency of decision-making and rigorous scrutiny by stakeholders will help it attain these goals. Since december 2002, when it received the approval of the information Commissioner for a Publication Scheme compliant with the freedom of information Act 2000, a range of material produced by CiTB, including Board (and since 2006, the Training Committee and Health, Safety and environment Committee) agendas, minutes and papers, has been made available through the website: citb.co.uk/About-us/How-were-run/Our-Boards-committees/papers
further requests for information can be addressed to the Corporate Governance Unit, CiTB, Bircham newton, King’s Lynn, norfolk Pe31 6RH (email [email protected]).
in 2009, the Board approved a revised Code of Best Practice for its members, based on that published by HM Treasury. A Code of employee Conduct based on guidance issued by the Cabinet Office has been in place for more than a decade and is kept under regular review.

Appendices
73
Fairness, inclusion and respectCiTB’s Strategic equality Plan (statement, strategy and action plan), sets out our commitment to fairness, inclusion and respect (fiR) and details how we address these issues for the benefit of our staff, learners, organisation and the wider sector.
in late 2012, we successfully retained our equality Standard accreditation from equality north east and were upgraded to Gold Award, demonstrating our continued commitment to equality and a desire to promote good equality and diversity practice within the workplace and with service users, across england, Scotland and Wales. in addition, Wales gained the Committed to equality (C2e) standard. effective partnership working has helped build a strong People Strategy commended by equality north east along with the successful roll out of the Total Reward framework and the introduction of new policies that adopt a more supportive approach. To ensure continued improvement, our fiR guiding principles are embedded throughout all business planning across the organisation.
Under the chairmanship of Judy Lowe, we lead the industry Leadership Group for fiR, developing a co-ordinated approach for disseminating good fiR practices across the built environment sector. in 2012, this included developing and testing the Be faiR framework, a tool tailored for built environment employers to assess and accredit their work supporting fiR in their organisations and beyond. The framework will be piloted in 2013 by main contractors and SMes.
in our learning provision, the equality and diversity impact Measures (ediMs) strategy, providing a single overarching approach to recruitment, success, progression and learner enjoyment, and our continued support of learners through the delivery teams was commended by Ofsted late in 2012, when we received an Outstanding grade, demonstrating an improvement from satisfactory to outstanding for our equality and diversity work.
in december 2012, CiTB employed 27 people (2011, 25) who considered themselves to have a disability as set out in the disability discrimination Act 1995.
Safeguardingduring 2012, 45 reports were made. Reporting covered issues such as homesickness, the student’s fears about his or her ability to cope with the training, worries about temporary accommodation or personal relationships, as well as drugs and alcohol, bullying and physical assault. Where concerns related to the conduct of individuals, these included the apprentice’s employer, other learners and college staff (not CiTB). in all cases, appropriate steps were taken to protect the affected person from harm.
during the year, there were a number of developments in safeguarding practice, including:
• theintroductionofanupdatedcodeofbehaviourrelatingtotheuseofsocialnetworking
• afullreviewofaccommodationprovisionincludingtriallingandimplementinganewprocesstoaddressconcerns about availability, standards (including catering), and learner wellbeing away from home
• theprovisionofa24/7helplineforlearners
• areviewofallsafeguardingpoliciesandproceduresfollowingmajorchangesinlegislation
• aconferenceforallDesignatedPersonsandSafeguardingChampions.
Health, safety and welfare161 incidents were reported in 2012, an increase of 25 over 2011. Most (133) were reported by nCC, which is not unexpected, given the nature of nCC’s activities and the number of people affected. Corporate Services reported 25 incidents (14 in 2011) and Business Services reported eight. Almost all incidents were minor.
four incidents were reported to the HSe.
• Theinjuredperson(staffmember)felloverastepinthedarkinjuringtheirhand,hipandchest.Lightinginthe area was subsequently improved.
• Ascaffoldtoeboardfellfromheightcausinginjurytoaninstructor’sfootrequiringanovernighthospitalvisit. The work instruction for the fitting of toe boards was updated to avoid a recurrence.
• Aconstructioninstructorinjuredhisbackmovingshutters;ariskassessmentwasinplace,buttheinstructor had not followed the assessment.
• Aplantoperationsinstructorfelloveratyreinthetrainingareacausingabrokenwristandbrokennose.The procedure for clearing away the tyres after training has been enforced.

Appendices
74
Since last year, near-miss reporting cards have been placed in all high risk areas. However, the level of near-miss reporting remains low (12).
CiTB’s record is significantly better than most other sectors of the UK economy. it is particularly pleasing to note that performance is better than that of education, in which there is far less high risk activity than is undertaken across the business.
Employee relationsCiTB recognises Unite the Union and the GMB. The procedural agreement provides for negotiation, consultation and communication and the Joint Consultation Committee meets monthly in addition to joint working parties set up to constructively tackle issues and concerns. Union representatives sit on the Health and Safety and fairness, inclusion and Respect Steering Groups.
during 2012, there continued to be substantial constructive dialogue involving both the trades unions and a management group about the organisation’s Total Rewards framework proposals, which were implemented, with employee support, in May 2012.
A number of mechanisms are used to inform and get feedback from staff, such as monthly team meetings, video briefings from the Chief executive, focus groups and webcasts. in addition, regular staff forums have continued to facilitate ongoing dialogue in directorates.
As this suggests, we continue to develop ways of measuring staff engagement, as well as staff satisfaction. The principal way of doing this has been through a regular assessment of staff views. The overall response to the 2012 survey was slightly up on the previous year, at 70% (2011 68%). Category scores for 2012 remain stable compared with 2011 with the exception of Reward and Recognition (+9%) and Career development (+6%) where we saw significant gains. Perceptions of the organisation’s commitment to CSR also showed a big improvement.
The analysis of employee engagement shows very strong scores for the rational element (e.g. belief in the goals and objectives of the organisation), but less favourable scores for the emotional (e.g. pride) and behavioural (e.g. willingness to go the extra mile) elements, no doubt a reflection of employees’ concerns about the volume of change the organisation is going through. despite the uncertainty that accompanies change, the number of employees expecting management to act on problems identified in the survey has increased since 2011 (+11%) and staff continue to view CiTB as a good place to work.
We regularly monitor levels of absence. in 2012, the sickness absence rate was 3.5% (2011 2.93%), equivalent to 8.74 working days per head (2011 7.71). This compares with the latest report from the CiPd (relating to 2011) of a public sector average absence rate of 7.9 working days (2010 9.1 days) and a private sector average of 5.8 working days (2010 7.1 days).
Financial redress in cases of maladministrationAs part of its commitment to public service principles, CiTB offers financial recompense in cases of maladministration. in 2012, no payments were made under the terms of this policy.
Our mission for the industryensuring the construction industry has the right skills in the right place at the right time.
Our vision for the organisationTo be the leadership organisation for the UK construction industry’s skills and training needs.

Appendices
75
Area Shared Apprenticeship framework Business and Skills employer visits Schemes achievements Reviews delivered
england 5 80% 1,808 14,037
Scotland - 68% 161 1,159
Wales 2 65% 57 2,136
Other 1 70% – –
(Specialist) (Specialist)
Great Britain 8 74% 2,026 17,332
E: Breakdown of 2012 Achievements

Appendices
76
Head OfficeBircham newton King’s Lynn norfolk Pe31 6RH
Tel: 0300 456 7577
ENGLANDLondonCarthusian Court 12 Carthusian Street London eC1M 6eZ
ThurmastonSuites 1 and 2 1st floor, Bridge Business Park 674 Melton Road Thurmaston Leicestershire Le4 8BB
EastCompass House Cambridge Vision Park Chivers Way, Histon Cambridge CB24 9Ad
West MidlandsThe Regus Group Birmingham Blythe Valley Park Central Boulevard Blythe Valley Business Park Solihull B90 8AG
F: Location of CITB Offices and NCC Centres
SCOTLANDScottish Office4 fountain Avenue inchinnan Business Park inchinnan Renfrewshire PA4 9RQ
Tel: 0344 994 8800
Scotland NorthAlder House Cradlehall Business Park inverness iV2 5GH
WALESWelsh OfficeUnits 4 and 5, Bridgend Business Centre david Street, Bridgend industrial estate Bridgend Cf31 3SH
Tel: 01656 655226

Appendices
77
NCCNCC EastBircham newton King’s Lynn norfolk Pe31 6RH
Tel: 0344 994 4433
NCC Midlands83 Lifford Lane, Kings norton Birmingham B30 3JH
Tel: 0300 456 5620
NCC Central with JCBLadyhole Lane, Ashbourne derbyshire de6 1LR
Tel/fax: 0121 459 8000
NCC East London (Thames House)Royal docks Campus Gate 14, Woolwich Manor Way London e16 2Qy
NCC Waltham Forest/Cathall Road/LeytonstoneWaltham forest Construction Training Centre Hollydown Way, Leytonstone London e11 4dd
Tel: 0208 539 8729
NCC SouthManor Road, erith Kent dA8 2Ad Tel: 0300 456 5333
NCC Scotland4 fountain Avenue inchinnan Business Park inchinnan Renfrewshire PA4 9RQ
Tel: 0344 994 8800
NCC course enquiriesTel: 0844 844 0466
TUCAThe Tunnelling and Underground Construction AcademyLugg Approach ilford essex e12 5Ln
Tel: 0203 197 5002
OTHERCITB’s bankersBarclays Bank plc 17 Market Place fakenham norfolk nR21 9Be
CITB’s investment advisorsWilliams de Broe Ltd 21 new Street Bishopsgate London eC2M 4HR
CITB’s auditorsComptroller and Auditor General national Audit Office 157–197 Buckingham Palace Road London SW1W 9SP
CITB’s legal advisorClaire Shopland Head of Legal Bircham newton King’s Lynn norfolk Pe31 6RH

Appendices
78
AeeU Amalgamated engineering and electrical Union
AM Assembly Member
BACH British Association of Construction Heads
BiM Building information Modelling
BiS department for Business, innovation and Skills
BMe Black and Minority ethnic
BRe Building Research establishment
BSf Building Schools for the future
BSR Business and Skills Review
C&AG Comptroller and Auditor General
CBi Confederation of British industry
CCATf Cross industry Construction Apprenticeship Taskforce
CdA Company development Adviser
CiAT Chartered institute of Accounting Technicians
CiOB Chartered institute of Building
CiPS Chartered institute of Purchasing and Supply
CPCS Construction Plant Competence Scheme
CQS Construction Qualification Strategy
CR Corporate Responsibility
CSCS Construction Skills Certification Scheme
CSn Construction Skills network
deCC department for energy and Climate Change
dLCS delivering Low Carbon Solutions
eSf european Social fund
fe further education
fiR fairness, inclusion and Respect
fMB federation of Master Builders
fRA flat Roofing Alliance
GdP Gross domestic Product
HAe Hire Association europe
He Higher education
HMSO Her Majesty’s Stationery Office
HRd Human Resource development
HS&e Health, Safety and environment
iCe institution of Civil engineers
iiP investors in People
iTB industrial Training Board
JiS Joint investment Strategy
LdA London development Agency
LfS Labour force Survey
LMi Labour Market information
LSC Learning and Skills Council
MSf Manufacturing, Science and finance
MSP Member of the Scottish Parliament
nAO national Audit Office
nCC national Construction College
ndPB non-departmental Public Body
nfRC national federation of Roofing Contractors
nOS national Occupational Standards
nSAC national Specialist Accredited Centre
nSAfC national Skills Academy for Construction
nSCC national Specialist Contractors Council
nST national Specialist Team
nVQ national Vocational Qualification
OSAT On Site Assessment and Training
OSCR Office of the Scottish Charities Regulator
PASMA Prefabricated Access Suppliers and Manufacturers Association
PLA Programme Led Apprenticeship
R&M Repair and Maintenance
RiA Roofing industry Alliance
RiCS Royal institution of Chartered Surveyors
RTPi Royal Town Planning institute
SdS Skills development Scotland
SfA Skills funding Agency
SMe Small and Medium-sized enterprises
SMSTS Site Management Safety Training Scheme
SPfP Sector Priorities fund Programme
SPRA Single-ply Roofing Association
SQA Scottish Qualifications Authority
SSA Sector Skills Agreement
SSC Sector Skills Council
SSSTS Site Supervisors’ Safety Training Scheme
SVQ Scottish Vocational Qualification
TGWU Transport and General Workers Union
TUCA Tunnelling and Underground Construction Academy
UCATT Union of Construction, Allied Trades and Technicians
UKCeS United Kingdom Commission for employment and Skills
UKCG UK Contractors Group
UTC University Technical College
WJeC Welsh Joint education Committee
G: Glossary

CiTB, CiC and CiTB-ConstructionSkills northern ireland are working as ConstructionSkills, the Sector Skills Council for Construction. (CiTB Registered Charity number 264289)
citb.co.uk
Published by TSO (The Stationery Office) and available from:
Online www.tsoshop.co.uk
Mail, telephone, fax and email TSO PO Box 29, Norwich NR3 1GN Telephone orders/general enquiries: 0870 600 5522 Order through the Parliamentary Hotline Lo-Call 0845 7 023474 Fax orders: 0870 600 5533 Email: [email protected] Textphone: 0870 240 3701
The Houses of Parliament Shop 12 Bridge Street, Parliament Square, London SW1A 2JX Telephone orders/general enquiries: 020 7219 3890 Fax orders: 020 7219 3866 Email: [email protected] Internet: http://www.shop.parliament.uk
TSO@Blackwell and other accredited agents