construction materials...flat glass, and insulation products, and usg corporation, a gypsum product...
TRANSCRIPT
CONSTRUCTION MATERIALSResearch Brief
Sustainable Industry Classification System™ (SICS™) #NR0401
Research Briefing Prepared by the
Sustainability Accounting Standards Board®
June 2014
www.sasb.org© 2014 SASB™
T M
™

© 2014 SASB™
SASB’s Industry Brief provides evidence for the material sustainability issues in the industry. The
brief opens with a summary of the industry, including relevant legislative and regulatory trends
and sustainability risks and opportunities. Following this, evidence for each material sustainability
issue (in the categories of Environment, Social Capital, Human Capital, Business Model and
Innovation, and Leadership and Governance) is presented. SASB’s Industry Brief can be used
to understand the data underlying SASB Sustainability Accounting Standards. For accounting
metrics and disclosure guidance, please see SASB’s Sustainability Accounting Standards. For
information about the legal basis for SASB and SASB’s standards development process, please
see the Conceptual Framework.
SASB identifies the minimum set of sustainability issues likely to be material for companies within
a given industry. However, the final determination of materiality is the onus of the company.
Related Documents
• Non-Renewable Resources Sustainability Accounting Standards
• Industry Working Group Participants
• SASB Conceptual Framework
INDUSTRY LEAD
Himani Phadke
CONTRIBUTORS
Andrew Collins
Henrik Cotran
Stephanie Glazer
Anton Gorodniuk
Jerome Lavigne-Delville
Nashat Moin
Arturo Rodriguez
Jean Rogers
Gabriella Vozza
CONSTRUCTION MATERIALS Research Brief
SASB, Sustainability Accounting Standards Board, the SASB logo, SICS, Sustainable Industry
Classification System, Accounting for a Sustainable Future, and Materiality Map are trademarks
and service marks of the Sustainability Accounting Standards Board.
1RESEARCH BRIEF | CONSTRUCTION MATERIALS© 2014 SASB™
veloped and emerging countries. Much of the
economic growth in emerging markets today is
accompanied by an expansion in construction
activity, especially of industrial and transpor-
tation infrastructure, which in turns requires
greater production of construction materials.
However, with the emergence of new global
threats such as climate change, water scarcity,
and resource constraints, and greater public
concern about the environmental and health
impacts of resource extraction activities and
industrial production, regulatory action and
business needs around companies’ sustain-
ability performance are intensifying around the
world. Given the resource-intensity of indus-
tries involved in extractive activities, and their
potential wide-ranging environmental and so-
cial externalities, this sector has been the focus
of regulation and public attention.
The Construction Materials industry is being
challenged by regulators, customers, and the
general public to innovate and develop more
durable, safe, sustainably-sourced, and energy-
efficient products, as well as practice more
resource-efficient production activities.
Therefore, management (or mismanagement)
of material sustainability issues has the po-
tential to affect company valuation through
impacts on profits, assets, liabilities, and cost
of capital.
Investors would obtain a more holistic and
comparable view of performance with con-
struction materials companies reporting metrics
on the material sustainability risks and oppor-
SUSTAINABILITY DISCLOSURE TOPICS
Environment
• Greenhouse Gas Emissions
• Air Quality
• Energy Management
• Water Management
• Waste Management
• Biodiversity Impacts
Human Capital
• Workforce Health, Safety,
and Well-being
Business Model and Innovation
• Product Innovation
Leadership and Governance
• Pricing Integrity & Transparency
INTRODUCTION
Construction materials are an essential input to
the development of the commercial, residen-
tial, transportation, and industrial infrastructure
that drives economic growth. These materials
will continue to play an important role in global
economic development in the future, both in de-
2RESEARCH BRIEF | CONSTRUCTION MATERIALS© 2014 SASB™
tunities that could affect value in the near- and
long-term in their regulatory filings. This would
include both positive and negative externalities,
and the non-financial forms of capital that the
firms in this industry rely on for value creation.
Specifically, performance on the following
sustainability issues will drive competitiveness
within the Construction Materials industry:
• Reducing direct greenhouse gas (GHG) emis-
sions from operations;
• Reducing air pollution that can create haz-
ards for human health and the environment;
• Managing the efficiency and sourcing of
energy used in operations;
• Securing water supplies without exacerbat-
ing local water system stresses;
• Reducing and managing hazardous and solid
waste generated during operations;
• Mitigating the biodiversity impacts of raw
material extraction activities;
• Ensuring worker health and safety and pro-
moting a strong safety culture;
• Developing innovative solutions to reduce
the lifecycle impacts of their products; and
• Ensuring transparency in product pricing,
and avoiding direct or indirect market ma-
nipulation.
INDUSTRY SUMMARY
The Construction Materials industry includes
companies that mine, process, and produce
materials including cement and its aggregates,
ready-mix concrete, asphalt, sand, gravel, and
other construction products used in buildings,
such as glass, plasterboard, insulation, bricks,
and roofing materials, among others. Materials
producers operate their own quarries, mining
crushed stone or sand and gravel. They may
also purchase raw materials from the mining
and petroleum industries.I
Publicly-traded companies in the Construction
Materials industry generated approximately
$500 billion in revenues globally in 2013,
around 58 percent of which were generated
from sales from the Cement and Aggregates
segment.1 The top five global companies in
this segment account for almost 17 percent of
industry revenue and 30 percent of revenues
within the segment.2 Glass Products Manu-
facturing is the second largest segment with
$61 billion in revenues, followed by Concrete
Product manufacturers with $45 billion.3
Production volumes tend to reflect economic
activity broadly as demand is influenced by
private sector construction, as well as govern-
ment infrastructure investment. The majority
of growth in the cement segment comes from
I Industry composition is based on the mapping of the Sustainable Industry Classification System (SICSTM) to the Bloomberg Industry Classification System (BICS). A list of representative companies appears in Appendix I. Companies producing wood-building products are included in the Forestry and Paper industry under SICS and are not considered here.
3RESEARCH BRIEF | CONSTRUCTION MATERIALS© 2014 SASB™
emerging markets, particularly from China and
India. Overall, emerging markets account for
approximately 90 percent of the global cement
consumption.4 In 2011, three out of the top
five companies ranked by their capacity were
based in Europe, and the remaining two were
based in China. The top three companies, in-
cluding Lafarge (France), Holcim (Switzerland),
and CNBM (China) had an annual capacity
of more than 200 million metric tons (Mt) in
2011 and accounted for 33 percent of the
total capacity of the 20 largest global cement
producers.5
Key U.S.-domiciled companies in this segment
include Vulcan Materials, MDU Resources
Group, and Martin Marietta Materials. Howev-
er, the biggest U.S. companies in the Construc-
tion Materials industry are actually involved
in other production segments. These include:
Owens Corning, a manufacturer of roofing,
flat glass, and insulation products, and USG
Corporation, a gypsum product manufacturer.
The industry is in the early stages of global
consolidation since quarrying raw materials
requires large tracts of land and regulation is
beginning to restrict the development of new
lands. Companies with extractive operations
must obtain mining permits and establish
proven reserves in order to secure materials for
future production. In some countries, permits
for raw material extraction are allotted for a
limited time due to growing environmental
pressure. Limits on permit duration can affect
the amount of proven reserves. Quarrying is
typically conducted in an open-pit fashion,
which demands many acres of land. Quarrying
also requires blasting of rock and heavy ma-
chinery, including large trucks, excavators, and
stone-crushing machines. Since construction
materials are expensive to transport due
to their weight, most companies have opera-
tions in proximity to primary markets. The
location of plants plays a key role in company
competitiveness.
Aggregates, such as sand and gravel, are the
most-used material in the world after water,
with over 25 billion tons consumed.6 Construc-
tion materials producers generally operate their
own quarries or purchase raw materials from
the mining and petroleum industries, and sell
largely to construction firms. The industry is
characterized by high capital investment due to
the use of heavy machinery, high energy costs,
and use of large tracts of land.
The Construction Materials industry is resource-
and energy-intensive, and raw materials and
energy costs account for a considerable share
of expenses. Many industry processes, such as
glass, brick, and cement manufacturing require
high-temperature firing in kilns to induce
chemical changes in raw material inputs, such
as limestone and silica. In cement production,
limestone is blended with silica, alumina, and
iron ore and baked in a large rotating kiln at
1500 degrees Celsius to create a substance
called “clinker”. Clinker pellets are ground
with gypsum to make cement powder. Energy
inputs comprise roughly 33 percent of the cost
of cement production, while raw materials are
29 percent, labor 26 percent, and depreciation
12 percent.7
Important megatrends affecting the Construc-
tion Materials industry include the Green
Building movement. The adoption of green
building codes and standards, such as the U.S.
4RESEARCH BRIEF | CONSTRUCTION MATERIALS© 2014 SASB™
Green Building Council’s (USGBC) Leadership in
Energy and Environmental Design (LEED) rating
system, encourages the design and construc-
tion of buildings that are environmentally
friendly, as well as safer for their occupants.
This driver, combined with more demanding
customer preferences for products that assist
in obtaining LEED credit, has increased de-
mand for products, systems, and services that
contribute to building sustainable spaces. The
industry expects ongoing growth in demand
over time for products that meet regulatory
and customer sustainability standards, with
some estimates reporting that the industry for
green building materials could reach $254 bil-
lion by 2020.8
LEGISLATIVE AND REGULATORY TRENDS IN THE CONSTRUCTION MATERIALS INDUSTRY
Companies in the Construction Materials in-
dustry operate under a range of federal, state,
and local regulations related to environmental
performance and worker health and safety.
Environmental laws and regulations are evolv-
ing and becoming more stringent globally in
the context of increasing resource constraints,
greater urbanization, global challenges, such as
climate change, and greater public awareness.
The following section provides a brief summary
of key regulations and legislative efforts related
to this industry.II
There are a number of key pieces of legislation
in the U.S. with the potential to impact com-
pany value in the Construction Materials indus-
try. They include: the Clean Water Act (CWA);
Clean Air Act (CAA); Resource Conservation
and Recovery Act (RCRA); Comprehensive
Environmental Response, Compensation, and
Liability Act (CERCLA); and the Surface Mining
Control and Reclamation Act (SMCRA). The in-
dustry is also subject to regulations by the Mine
Safety and Health Administration (MSHA) and
the Occupational Safety and Health Adminis-
tration (OSHA).9
The CAA requires the U.S. Environmental
Protection Agency (EPA) to establish national
ambient air quality standards for certain com-
mon and widespread pollutants. In the context
of the Construction Materials industry, recent
actions include the following: in 2013, the EPA
issued a revised version of the final Portland
Cement National Emissions Standards for
Hazardous Air Pollutants (NESHAP) to reduce
mercury and other air emissions, setting a
compliance deadline by 2015.10 Similarly, in
2004, the EPA registered the NESHAP for Lime
Manufacturing Plants, which subjected the lime
manufacturing industry to Maximum Achiev-
able Control Technology (MACT) standards.11
Particular segments in the Construction Materi-
als industry are also subject to New Source
Performance Standards (NSPS). These standards
apply to new, modified, and reconstructed
affected facilities in specific source catego-
ries, which include, among others, glass and
cement manufacturers. All these rules cover
emissions of compounds, such as sulfur and
nitrogen oxides, mercury, hydrogen chloride,
and various hydrocarbons.12
II This section does not purport to contain a comprehensive review of all regulations related to this industry, but is intended to highlight some ways in which regulatory trends are impacting the industry.
5RESEARCH BRIEF | CONSTRUCTION MATERIALS© 2014 SASB™
Furthermore, the EPA requires reporting of
GHG emissions from large emissions sources in
the U.S. under its Greenhouse Gas Reporting
Program (GHGRP). The GHGRP includes report-
ing by 41 source categories, including cement
and glass production, and lime manufacturing.13
In some regions of the world, existing regula-
tions to reduce GHG emissions are becoming
more stringent. The European Union (E.U.)’s
Emission Trading System (ETS) is a GHG
emissions cap-and-trade system designed to
gradually reduce total GHG emissions in the
28 E.U. member states. The target is to reduce
emissions by 21 percent from 2005 levels by
2020. The ETS today covers approximately 45
percent of total E.U. GHG emissions. In 2009,
emissions allowances began to be auctioned
instead of allocated for free, in order to en-
courage carbon price stability.14 In 2013, 40
percent of allowances were to be auctioned.
Over time, it is predicted that prices for allow-
ances will increase, further compelling compa-
nies to reduce emissions. The scope of the ETS
includes facilities from the Construction Materi-
als industry. International offset credits are still
available under the E.U.’s ETS, but they cannot
account for more than 50 percent of GHG
reduction efforts from 2008 to 2020.15
The RCRA governs solid and hazardous waste
treatment, storage, and disposal, while CER-
CLA provisions can hold companies responsible
for remediation of hazardous substances.16 In
the context of construction materials compa-
nies, the EPA has been evaluating the regula-
tory status of cement kiln dust (CKD). In 1999,
the agency proposed to treat CKD as a non-
hazardous waste. In 2002, the agency issued
a notice that instead proposed CKD manage-
ment standards as a RCRA Subtitle D (solid
waste) rule. It proposed temporarily suspend-
ing the proposed RCRA Subtitle C (hazardous
waste) portion of the proposed rule for three
to five years to assess how CKD management
practices and state regulatory programs evolve.
However, as of June 2014, it had not finalized
this proposal.17
The SMCRA, administered by the Office of
Surface Mining Reclamation and Enforcement
(OSM), establishes mining, environmental pro-
tection, and reclamation standards for surface
and underground mining. Mining companies
are required to gain permits from the OSM
before proceeding with new projects.
As described in the Industry Summary section,
the Construction Materials industry’s growth
is being driven by demand from emerging
countries, such as China and India. Incidentally,
a significant competitive advantage for com-
panies that operate in emerging markets has
been generally less strict environmental stan-
dards. However, as environmental and social
impacts become apparent and public concerns
increase in such countries, industries are likely
to face higher compliance costs and stricter
enforcement of regulations. For example, in
China, public outcry over air pollution led the
government to reopen the amendment process
in 2013 for its national Air Pollution Preven-

6RESEARCH BRIEF | CONSTRUCTION MATERIALS© 2014 SASB™
tion and Control Law, which had not been
amended since 2000.18 China has also intro-
duced GHG emissions trading pilot programs
in several regions since 2013. The Construction
Materials industry will likely be impacted by
these new programs.
In addition to environmental regulations, the
industry is also subject to those governing
health and safety, and corporate governance
issues. The health and safety regulations fall
within the Federal Mine Safety & Health Act
and are enforced by the MSHA, a division of
the U.S. Department of Labor. The Act covers
mandatory safety standards regarding dust,
access to appropriate respiratory equipment,
noise standards and protection, treatment
of combustible materials, use of electrical
equipment and cabling, use of blasting and
explosives, emergency shelters, and commu-
nications. The MSHA’s agenda is to educate
mine operators and employees about both the
relevant aspects of mine safety and the regula-
tory compliance requirements.19
Finally, companies in this industry are also regu-
lated by antitrust agencies in several jurisdic-
tions.
SUSTAINABILITY-RELATED RISKS & OPPORTUNITIES
Industry drivers and recent regulations suggest
that while traditional value drivers will continue
to impact financial performance, intangible as-
sets such as environmental and social capitals,
company leadership and governance, and
the company’s ability to innovate to address
environmental and social issues are likely to
contribute increasingly to financial and busi-
ness value.
Broad industry trends and characteristics are
driving the importance of sustainability perfor-
mance in the Construction Materials industry,
including:
• Resource intensity and use of common
capitals: Construction materials compa-
nies use large amounts of natural capital
inputs, such as energy, water, limestone,
and gypsum, among other inputs in their
production process. Resource efficiency can
help avoid higher costs or unstable supply of
these inputs due to environmental pressures,
such as climate change and water scarcity.
Furthermore, human capital continues to be
important for the industry. A strong safety
culture can help mitigate and manage the
workplace dangers characteristic of heavy
industry manufacturing, which can affect
worker health and safety.
• Negative externalities: The production of
construction materials creates negative envi-
ronmental externalities, such as GHG emis-
sions, and air and water pollution, and can
harm human health. Increasingly stringent
environmental regulations have the potential
to increase operating costs and affect the
profitability of companies seen as contribut-
ing to these externalities.
• Social license to operate: Construction
materials companies, in particular those with
raw material extractive activities, depend on

7RESEARCH BRIEF | CONSTRUCTION MATERIALS© 2014 SASB™
support from employees and local commu-
nities to engage in operations that can be
harmful to human health and the environ-
ment. Negative impacts, or negative public
perceptions of such companies, therefore,
may disrupt or destroy their social license to
operate.
• Continuous innovation: Recent trends in
the establishment of green building codes
and the construction of energy-efficient
buildings have accelerated innovation in the
Construction Materials industry. Continued
environmental and social pressures on profit-
ability require companies to mitigate the
lifecycle impacts of their products through
innovative technologies and increased re-
search and development efforts.
As described above, the regulatory and legisla-
tive environment surrounding the Construction
Materials industry emphasizes the importance
of sustainability management and perfor-
mance. Specifically, recent trends suggest a
regulatory emphasis on the reduction of envi-
ronmental and human health impacts, which
will serve to align the interests of society with
those of investors.
The following section provides a brief descrip-
tion of each sustainability issue that is likely to
have material implications for companies in the
Construction Materials industry. Included in the
description is an explanation of how the issue
could impact valuation and evidence of actual
financial impact. Further information on the
nature of the value impact, based on SASB’s
research and analysis, is provided in Appendix
IIA and IIB. Appendix IIA also provides a sum-
mary of the evidence of investor interest in the
issues. This is based on a systematic analysis of
companies’ 10-K and 20-F filings, shareholder
resolutions, and other public documents, as
well as the results of consultation with experts
participating in an industry working group
convened by SASB.
A summary of the recommended disclosure
framework and accounting metrics appears in
Appendix III. The complete SASB standards for
the industry, including technical protocols, can
be downloaded from www.sasb.org. Finally,
Appendix IV provides an analysis of the quality
of current disclosure on these issues in SEC fil-
ings by the top companies in the industry.
ENVIRONMENT
The environmental dimension of sustainability
includes a company’s impact on the environ-
ment, either through the use of non-renewable
natural resources as the factors of production
(e.g., water, energy, minerals), or through
environmental externalities or other harmful
releases in the environment, such as air and
water pollution, waste disposal, and green-
house gas emissions.
The Construction Materials industry relies on a
steady stream of raw materials from the mining
and petroleum industries as well as on high

8RESEARCH BRIEF | CONSTRUCTION MATERIALS© 2014 SASB™
water and energy requirements. Moreover,
companies involved in quarrying operations
also rely heavily on resources extracted directly
from the natural environment. While technical
improvements have reduced the environmental
impacts from the industry in recent years, over-
all industry output is growing rapidly, driven by
demand from emerging markets; plus con-
struction material production and manufactur-
ing remains a resource-intensive activity relative
to other industries.
Greenhouse Gas Emissions
GHG emissions are a source of regulatory
risk for companies, which arises from current
and potential future regulations in the U.S.
and abroad. The production of construction
materials generates relatively large quantities
of greenhouse gases, including carbon dioxide
(CO2), nitrous oxides (N20), and methane (CH4).
Direct GHG emissions from cement produc-
tion occur as a result of production processes
as well as on-site combustion of fossil fuels.
Process emissions of CO2 occur when limestone
is heated within the kiln, through a process
known as “calcination.” Combustion emissions
materialize with the burning of fossil fuels,
such as coal, natural gas or oil, to heat the
kiln. Emissions from calcination account for 50
percent of all emissions from cement produc-
tion, while the use of fossil fuels accounts
for an additional 40 percent.20 Transportation
equipment used in mining operations and the
transportation of raw and finished materials
account for the rest.
Emissions from glass manufacturing are also
primarily a result of fuel combustion. Glass-
melting furnaces require significant amounts of
energy to heat and melt the raw materials to
form molten glass. This energy is usually gener-
ated through the combustion of natural gas,
although other fuels may be used as a back-
up. Glass manufacturing facilities may also
operate other stationary combustion sources,
all of which emit GHGs.21
Companies that cost-effectively reduce GHG
emissions from their operations by implement-
ing industry-leading technologies and process-
es can create operational efficiency. They can
mitigate the effect of increased fuel costs and
regulations that limit — or put a put a price on
— carbon emissions.
Company performance in this area can be
analyzed in a cost-beneficial way internally
and externally through the following direct or
indirect performance metrics (see Appendix III
for metrics with their full detail):
• Global Scope 1 emissions, percentage cov-
ered under a regulatory program; and
• Long- and short-term strategy to manage
Scope 1 emissions.
Evidence
The cement and aggregates segment alone ac-
counts for 5 percent of total global CO2 emis-
sions.22 It is estimated that, on average, produc-
ing a ton of cement releases approximately
1,700 pounds of CO2 into the atmosphere.23
Cement manufacturers have made consider-
able progress in reducing the carbon footprint
per ton of output over the last decade, with

9RESEARCH BRIEF | CONSTRUCTION MATERIALS© 2014 SASB™
CO2 emissions per ton of product falling by
17 percent since 1990.24 However, in absolute
terms, and driven by an increase of 74 percent
in production volumes, CO2 emissions from this
segment have increased by 44 percent over the
same period.25
In the U.S., cement and lime production ac-
counted for 48.4 million metric tons of CO2
equivalent in 2012.26 To put this figure in
context, this number represents the 8th highest
source of emission after fossil fuel combustion
(which includes electricity generation, trans-
portation, industrial, residential and commer-
cial), non-energy use of fossil fuels, and iron
and steel production and metallurgical coke
production. Long-term economic growth and
demand for construction materials have led to
an increase of emissions from cement produc-
tion in the U.S. of 5.3 percent from 1990 to
2012, an increase of 1.8 Tg CO2 equivalent.27
Total U.S. emissions from glass manufacturing
activities were estimated to be 4,425,269 mt
of CO2 equivalent in 2004. These emissions
include both process-related emissions (result-
ing in the release of CO2) and on-site stationary
combustion emissions (resulting in CO2, CH4,
and N2O emissions). The former accounted for
37 percent of the total, while the latter ac-
counted for the rest.28
The World Business Council for Sustainable
Development’s (WBCSD) Cement Sustainability
Initiative (CSI) is a global effort by 24 major ce-
ment producers to pursue sustainable devel-
opment of the industry, with a focus on GHG
emissions. The Initiative participants together
produce nearly 30 percent of global cement.29
The CSI has identified four major avenues for
carbon emissions reduction: energy efficiency,
alternative fuels, carbon sequestration, and
clinker substitution. As mentioned earlier, the
biggest share of the GHG emissions in cement
manufacturing comes from the chemical reac-
tions when raw materials are heated in the
kilns. These emissions can be captured but can-
not be decreased at source, so cement manu-
facturers’ strategies aimed at CO2 reduction are
mainly geared towards energy efficiency and
the use of alternative fuels.30
Examples of companies managing GHG
emissions in this industry are plentiful. For
example, CEMEX, a Mexican-based firm, has
been working to reduce overall GHG emis-
sions by increasing use of renewable energy
and biomass to fuel its clinker kilns, as well as
exploring technologies to capture and re-
cycle carbon dioxide. Eighteen percent of the
company’s electricity came from renewable
sources in 2010. The company benefits directly
by generating carbon reduction credits which
it can then use to offset emissions at other
company facilities.31 Ireland-based CRH reduced
its total gross CO2 emissions from 13.31 million
tons in 2008 to 8.85 million tons in 2012, and
its carbon intensity from 738 to 637 kg per ton
of product over the same period of time.32 This
was achieved through increased use of alterna-

10RESEARCH BRIEF | CONSTRUCTION MATERIALS© 2014 SASB™
tive fuels and materials, such as high efficiency
lime kilns, sustained investment in energy effi-
cient processes and abatement systems, as well
as product innovation aimed at lowering their
carbon intensity, CRH also increased the use
of alternative fuels at its cement plants by 30
percent and in the process the company saved
€ 25 million euro in 2012.33
Construction materials companies are aware
of the materiality of GHG emissions as many
firms already recognize climate change legisla-
tion as a risk factor in their SEC annual filings.
For example, Martin Marietta Materials, an
aggregates producer, mentions in its FY 2013
Form 10-K that climate change legislation may
adversely impact their business via increased
operating costs or taxes. The company also
recognizes that some of its products “compete
against other products that emit a lower level
of GHGs in their production. Therefore, [their
facility] may be required to absorb additional
costs due to the regulation of GHG emissions
in order to remain competitive in pricing in
that market.”34 Texas industries, a ready mix
concrete producer, also recognizes potential
impacts via energy costs that will increase due
to the impact of these regulations on the elec-
tric utility industry. Finally, USG Corp, a compa-
ny that manufacturers gypsum and insulation
products, informs its shareholders on negative
potential impacts, among other things, on their
capital expenditures: “stricter regulation of
emissions might require us to install emissions
controls or other equipment at some or all of
our manufacturing facilities, requiring signifi-
cant additional capital investments.”35
Value Impact
Managing GHG emissions can provide opera-
tional efficiency and affect the cost structure
of companies in the industry, with a direct,
ongoing impact on value. Companies can
benefit from reductions in energy costs, which
are a significant proportion of their operating
expenses.
GHG emissions caps or other regulatory restric-
tions on emissions could pose a long-term
threat to the industry. Such regulations could
result in increased, potentially unanticipated
capital expenditures and permitting costs if
companies are required to modify their facili-
ties, affecting cash flows. Delays in permitting
can disrupt production, or companies could
be forced to curb production, which would
lower revenues. A price on carbon emissions
could increase operating expenditures. Further-
more, companies could also face fines if GHG
emissions rules are violated, affecting one-time
costs.
Increased operating risks due to the relative
magnitude of emissions from the industry and
regulatory risks could create uncertainty about
the revenue growth and cost structure of com-
panies, leading to a higher cost of capital.
While regulatory development in this area is an
inherently slow and politically-charged process
whose exact outcome is nearly impossible to
predict, increasingly stringent GHG regulations
will be needed in different regions in order to
address climate change targets. The probability
and magnitude of these impacts are therefore
likely to increase in the future.

11RESEARCH BRIEF | CONSTRUCTION MATERIALS© 2014 SASB™
Air Quality
Emissions of air pollutants is a material concern
to construction materials companies as regula-
tions surrounding these emissions can directly
impact revenues through production limita-
tions, and affect costs through mandatory use
of emissions-reduction equipment. However,
impacts on companies will vary depending on
the specific location of operations and the pre-
vailing air emissions regulations, which may be
less developed in some regions and countries
than in others.
On-site fuel combustion and production pro-
cesses in the Construction Materials industry
emit criteria air pollutants and toxic chemicals,
including small quantities of organic com-
pounds and heavy metals. Some emissions
of particular concern are those of mercury,
nitrogen oxides, sulfur dioxides, and particulate
matter. These air emissions can have signifi-
cant, localized human health and environmen-
tal impacts. The EPA regulates these pollutants
under the Clean Air Act.36
In the cement and aggregates segment, air
emissions from the kiln system are the primary
concern; fuel combustion, the process of mak-
ing clinker and crushing and grinding opera-
tions have been identified by the EPA as the
major processes that cause air emissions.
Companies face regulatory compliance costs,
and higher operating and capital expenditures
for technological and process improvements to
keep emissions under control. Active man-
agement of facility emissions through imple-
mentation of industry best practices across
global operations can facilitate the transition
to sustainable production, lowering costs and
potentially enhancing operational efficiency.
Company performance in this area can be
analyzed in a cost-beneficial way internally
and externally through the following direct or
indirect performance metrics (see Appendix III
for metrics with their full detail):
• Air emissions from industry-specific
pollutants.
Evidence
Air emissions regulation is rapidly expanding as
developing nations contribute more volumes of
pollutants each year. For example, the EPA and
the UN Environmental Programme are currently
working on regulations that would limit the
amount of substances, such as mercury and
chlorine and particulate emissions. The latest
NSPS and NESHAP regulations cap cement
plant mercury emissions at 21 pounds per mil-
lion tons of cement produced. The EPA predicts
that the rules will cut mercury emissions by
up to 92 percent, as well as reduce particulate
matter by 92 percent and sulfur dioxide by 78
percent. This could mean a savings of $7 to
$19 in public health benefits for every dollar in
costs.37
According to data from the EPA’s 2008 Na-
tional Emissions Inventory (NEI), the cement
manufacturing segment accounted for ap-

12RESEARCH BRIEF | CONSTRUCTION MATERIALS© 2014 SASB™
proximately 4.6 thousand pounds of mercury
emissions, which is more than 39 percent of
the total emissions from industrial processes;
almost 75 thousand tons of NOX (28 percent
of the industrial emissions); and more than 20
thousand tons of SO2, or 6.9 percent of the
total industrial emissions.38
Companies in the Construction Materials
industry are cognizant of the potential risks
stemming from air emissions mismanage-
ment and have achieved significant reductions
over the past decades. For example, CEMEX
reduced its mercury emissions by shutting ce-
ment kiln dust from the kiln system to finish
grinding and injecting activated carbon into
kiln exhaust gases. Overall, from 2005 to 2013
the company achieved 59.1 percent reduc-
tion of dust-specific emissions, 21.2 percent of
NOx -specific emissions, and 58.6 percent of
SOx -specific emissions.39 Similarly, faced with
increasingly stringent air emission standards,
Lafarge was able to reduce NOx emissions by
more than half with the introduction of new
technology in one of its Romanian plants.40
Failing to meet air pollution regulations can be
costly for companies in the industry. In 2013,
for example, the EPA fined Ash Grove Cement
$2.5 million for allegedly violating the CAA by
emitting excessive amounts of nitrogen oxides
and sulfur dioxide into the atmosphere. As a
result of the penalty, the company agreed to
invest $30 million in pollution control equip-
ment, as well as $750,000 to mitigate the
excess emissions from other facilities.41 As
another example, in 2011 the EPA imposed
a $1.4 million fine on CEMEX for CAA viola-
tions at its cement plant in Fairborn, Ohio. The
company was required to spend $2 million on
measures to reduce its NOx and SO2 emissions.
Value Impact
Managing air emissions can provide opera-
tional efficiency and affect the cost structure of
companies in the industry, with a direct, ongo-
ing impact on value.
Air pollution may result in regulatory penalties,
higher regulatory compliance costs, or new
capital expenditures to upgrade equipment.
While the timeline for regulatory compliance is
partly designed to allow companies to real-
locate resources to cover the costs, companies
are nonetheless likely to face higher ongoing
operating costs. Companies could face one-off
impacts on cash flows and liabilities as a result
of fines. There may be legal challenges from
the local population or businesses that are
directly affected by air pollutants, also result-
ing in liabilities. Companies could face delays
in obtaining permits if they do not meet state
or local emissions limits, which could impact
production, and therefore, revenues. Produc-
tion could also be affected due to unscheduled
downtime from incidents resulting in emissions
of harmful pollutants.
Active management of the issue – through
technological and process improvements –
could allow companies to limit the impact
of regulations and benefit from operational
efficiencies that could lead to a lower cost
structure over time.
Public concern and regulatory action on im-
proving air quality is increasing globally. As a
result, the probability and magnitude of impact
on financial results is likely to increase in the
near-term.

13RESEARCH BRIEF | CONSTRUCTION MATERIALS© 2014 SASB™
Energy Management
Despite gains in energy efficiency in recent
years, the production of construction materi-
als requires significant quantities of energy,
sourced primarily from the direct combus-
tion of fossil fuels and the electrical grid. This
energy-intense production has implications for
climate change, due to Scope 1 GHG emis-
sions from direct fossil fuel use. The regulatory
implications of this were discussed earlier in
the “Legislative and Regulatory Trends” and
“Greenhouse Gas Emissions” sections. How-
ever, in addition to the industry’s direct GHG
emissions, electricity purchases from the grid
create environmental concerns, such as indirect
impacts on the climate through Scope 2 emis-
sions. Purchased electricity consumption, al-
though unlikely to create direct regulatory risks
for companies from Scope 2 GHG emissions,
could have a material impact on company
value through its impact on cost of production.
Construction materials companies also use
alternative fuels for their kilns, such as scrap
tires and waste oil—often waste generated by
other industries. If properly managed, these
can lower energy costs and GHG emissions.
However, there could be potentially negative
impacts, such as releases of harmful air pollut-
ants that companies need to minimize in order
to obtain net benefits from using such fuels.
Decisions about use of alternative fuels,
renewable energy, and on-site generation of
electricity (versus purchases from the grid) can
play an important role in influencing both the
costs and reliability of energy supply. Long-
term prospects of increased energy demand
from emerging markets, in addition to energy
security, geopolitical, and climate change
concerns, indicate upward pressure on the
price, and limited availability, of conventional
sources of energy. Affordable, easily accessible,
and reliable energy is essential for competi-
tive advantage in this industry, with purchased
fuels and electricity accounting for a significant
proportion of total production costs.
Regulatory actions are placing greater empha-
sis on resource conservation, and innovations
in energy efficiency and alternative energy
are providing new avenues for energy man-
agement. The way in which a construction
materials company manages its overall energy
efficiency, its reliance on different types of en-
ergy and associated sustainability risks, and its
ability to access alternative sources of energy
can influence its profitability.
Companies in the industry have made strides in
reducing energy use largely through improved
efficiency of operations. Much of these gains
came from technological innovation and simple
process optimization and equipment upgrades.
Company performance in this area can be
analyzed in a cost-beneficial way internally
and externally through the following direct or
indirect performance metrics (see Appendix III
for metrics with their full detail):
• Total energy consumed, percentage from
purchased electricity, alternative sources, and
renewable sources.
Evidence
The U.S. Energy Information Administration
(EIA) recognizes the cement industry as the

14RESEARCH BRIEF | CONSTRUCTION MATERIALS© 2014 SASB™
most energy intensive of all manufacturing
industries.42 The Agency explains that although
the cement industry used only one-quarter of
one percent of total U.S. energy in 2012, it is
the most energy-intensive of all manufacturing
industries, with a share of national energy use
that is roughly 10 times its share of the nation’s
gross output of goods and services. The aver-
age energy input to produce a ton of cement is
4.4 million BTU.43 According to the EPA, major
sources of fuel energy in this segment include
coal and coke (75 percent), natural gas (3 per-
cent), and wastes (9 percent), while purchased
electricity represents 11 percent of total energy
used.44
Other segments within the Construction
Materials industry are also energy-intensive.
Data from the EIA shows that glass manufac-
turing – which includes construction materials
such as flat glass and fiberglass, among other
uses – accounts for 1 percent of total indus-
trial energy use in the U.S. Because glass has
a low volume of shipments compared to other
energy-intensive industries, the share of total
industrial energy use seems low; however,
energy consumption figures per unit of output
show that the glass manufacturing segment’s
energy intensiveness is similar to other energy-
intensive industries at 13,140 BTU per 2005
dollar shipment.45 The main fuel energy sources
used in this segment are natural gas (73 per-
cent) and purchased electricity (23 percent).46
According to 2011 data from the Annual
Survey of Manufactures of the U.S. Census
Bureau, the total cost of purchased fuels for
the cement and concrete product manufactur-
ing industry was approximately $1 billion and
accounted for about 5 percent of the total cost
of materials (for cement manufacturers alone,
the ratio was 23 percent), compared to 1.6
percent for all manufacturing industries. The
same data for the lime and gypsum product
manufacturing industry was $671 million in
purchased fuels, which represented 23 per-
cent of the total cost of materials (42 percent
for lime manufacturing and 13 percent for
gypsum). Finally, figures for the glass product
manufacturing segment were $821 million in
purchased fuel costs, representing 8.7 percent
of total costs of materials.47
At the same time, the total cost of purchased
electricity for the cement and concrete product
manufacturing industry was more than $816
million, and made up 4.3 percent of the total
cost of materials.48 Again, cement manufac-
turers accounted for the largest portion of
electricity purchases: $527 million or almost
20 percent of the total cost of materials.
Purchased electricity figures for the lime and
gypsum product manufacturing and the glass
product manufacturing segments were $207
million and $732 million, respectively. Both
figures represent about 7 to 8 percent of total
costs of materials.49
At a company level, energy efficiency and alter-
native energy projects can garner considerable
financial returns. A 2010 study by the Demand
Response Research Center at the Lawrence
Berkeley National Laboratory examined energy
demand response at cement plants in the U.S.
and potential implications for energy savings.50
Demand response programs can manage the
15RESEARCH BRIEF | CONSTRUCTION MATERIALS© 2014 SASB™
effects of variable energy prices due to demand
fluctuations. Cement plants generally operate
continuously for several months between shut-
down periods. Intermediate products, such as
clinker, can be stored for long periods of time,
allowing for optimal production schedules that
reduce demand on the grid during peak times.
In addition, equipment upgrades such as re-
placing ball mills with vertical rolling mills could
save 11-13 kWh per ton of cement.
In its 2012 Annual Results Presentation, China
Resources Cement Holdings reported that the
company had achieved almost 1 percent in
year-on-year savings due to reduced electricity
consumption. In absolute values, the total cost
savings was approximately HK $117 million
(around $15 million).51 Similarly, Lafarge reports
using 17 percent of alternative fuels during
its 2013 operations, of which 39 percent was
biomass;52 Holcim reports that it generates 25
percent of its electrical needs from its own
power plants, and that 13 percent is generated
from renewable energy sources.53 Finally, 25
percent of energy supplied to CEMEX’s Mexi-
can cement operations is provided by wind
farms in the state of Oaxaca. This has helped
the company avoid emitting approximately 582
thousand tons of total CO2. Moreover, energy-
efficient technologies in clinker production
have enabled the company to reduce energy
use by 40 percent in one of its UK facilities.54
A relatively recent development in the Con-
struction Materials industry is the increasing
use of solid wastes as an alternative fuel input
for kilns. This practice curbs waste-to-landfill
volumes, but hazardous air emissions from
waste could diminish the value of this develop-
ment.55,56
Innovations in energy efficiency and the push
towards using renewable energy sources are
likely to protect a company’s bottom line from
fluctuating energy prices. Many companies in
the Construction Materials industry recognize
the risks of changing energy and electric-
ity costs in their annual SEC filings. Martin
Marietta Materials, for example, reports in its
FY 2013 Form 10-K that in 2011, “increases in
energy costs when compared with 2010 low-
ered net earnings for our businesses by $0.27
per diluted share”.57
Value Impact
Energy management could have ongoing
impacts on company value and operating costs
given the industry’s energy intensity and rising
energy costs, as well as one-time effects on
cash flows through capital expenditures for
energy-related projects.
In the face of rising costs of fossil fuels and
electricity, construction materials companies
that develop more energy-efficient methods
of production can benefit from significant cost
reductions and gain a competitive advantage.
As a significant portion of production costs for
construction materials companies come from
purchased electricity, decisions about on-site
versus sourced electricity and diversification of
energy sources can also influence the volatility
and price of energy costs, and ultimately the
risk profile and cost of capital of construction
materials companies.
Given the industry’s energy intensity and rising
energy costs, the probability and magnitude of
impact is likely to increase in the near-term.
16RESEARCH BRIEF | CONSTRUCTION MATERIALS© 2014 SASB™
Water Management
While water has typically been a freely available
and abundant commodity in many parts of the
world, it is becoming a scarce resource due
to increasing consumption from population
growth and rapid urbanization, and poten-
tially reduced supplies due to climate change.
Furthermore, pollution can render water
supplies expensive to treat or unusable. Based
on recent trends, it is estimated that by 2025,
important river basins in the U.S., Mexico,
Western Europe, China, India, and Africa will
face severe water problems as demand over-
takes renewable supplies. Many important river
basins can already be considered “stressed.”
Water scarcity can result in higher supply costs
and social tensions, for many companies across
different sectors.58
Large volumes of water are required for aspects
of construction materials production, including
cooling cement and brick kilns, while actual
water discharge from production plants is rela-
tively low since closed-loop systems are in place
and water is lost through evaporation. Evapo-
ration generally accounts for the largest loss of
water in the Construction Materials industry.
Techniques such as using dry kilns instead of
wet kilns in cement production can significantly
reduce water consumption, when this switch
is technically feasible. However, production in
developing countries relies heavily on the older
wet kiln technology.
Excessive water use in regions of high water
stress can damage a company’s reputation and
impact operational costs, particularly when
competing with local communities and busi-
nesses for the resource. Companies that are
unable to secure a stable water supply could
face production disruptions, while rising water
prices could directly increase production costs.
Consequently, the adoption of technologies
and processes that reduce water consumption
could lower operating risks and costs for com-
panies and create a competitive advantage.
This could minimize the impact of regulations,
water supply shortages, and community-relat-
ed disruptions on company operations.
Company performance in this area can be
analyzed in a cost-beneficial way internally
and externally through the following direct or
indirect performance metrics (see Appendix III
for metrics with their full detail):
• Freshwater withdrawals, percentage re-
cycled, percentage in water-stressed regions.
Evidence
Despite significant reductions in water use in
recent years, the Construction Materials indus-
try is a water-intensive industry relative to oth-
ers. Industry operations are ranked 22nd out of
130 GICSIII sub-industries by water intensity.59
According to the EPA, in the cement and ag-
gregates segment, clinker plants with wet kilns
use between 23 to 130 gallons of water per
ton of clinker, and 93 to 560 liters per ton of
cement. As mentioned earlier, water consump-
tion per ton of output in dry kilns is signifi-
cantly lower at 16 gallons per ton of cement.60
While these figures show that water use per
ton of output can vary greatly, depending on
type of production and other factors, compa-
ny-specific figures provide a better understand-
III Global Industry Classification Standard. http://www.msci.com/products/indexes/sector/gics/

17RESEARCH BRIEF | CONSTRUCTION MATERIALS© 2014 SASB™
ing of the magnitude of water used. Holcim,
the industry’s largest company, uses 244 liters
of water per cubic meter of concrete, and 260
liters per ton of cement.61 Lafarge, the sec-
ond largest cement and aggregates producer,
reports that they use 284 liters of water to
produce one cubic meter of concrete, and 343
liters to produce a ton of cement.62
Moreover, water availability for construction
materials companies may vary significantly
from location to location across operations. For
example, in their 2012 Sustainable Develop-
ment Report, CEMEX provides a Relative Water
Stress Index (WSI) for their operations that
identifies 7 percent of the companies’ sites to
be located in water-scarce areas, 2 percent in
water-stressed areas, and 11 percent in regions
with a medium access to water.63 Lafarge has
estimated that 25 percent of its cement pro-
duction facilities are in areas of water scarcity.64
Water availability has direct impacts on operat-
ing costs. Faced with scarcity challenges, some
companies are seeking innovative ways to
recycle industrial water in order to reduce cost
and improve accessibility. For example, when
CEMEX faced rising water prices at one of its
plants in Colombia, the company found an
alternative source in wastewater from a nearby
ice cream factory, which was discharging 7,000
cubic meters of treated wastewater into a
nearby river. CEMEX agreed to buy the water
from this company instead of paying high mar-
ket prices. The company reduced its water bill
by almost 85 percent from $3 per cubic meter
to $0.5.65
Furthermore, companies are collaborating with
third parties to assess their water risks and
improve their energy efficiency. Lafarge, for ex-
ample, has partnered with WWF International
and reports that 100 percent of its cement and
aggregates sites have been assessed for water
risk, using WWF’s Water Risk Filter.66 Similarly,
the International Union for the Conservation of
Nature is working with CEMEX to implement
standardized water measurement and manage-
ment across the business in order to reduce the
firm’s water footprint.
Detailed disclosure around water risks is
seldom found in SEC filings. However, some
companies have started to identify these risks.
Martin Marietta Materials, for example, men-
tions in its FY 2013 Form 10-K that severe
droughts can restrict their access to water and,
in turn, restrict production. Texas Industries
provides similar disclosure informing its share-
holders that changes in weather patterns could
result in localized shortages of water and affect
operations.
Value Impact
According to a JP Morgan report, risks associ-
ated with water management create three
types of impacts on financial performance–
higher costs, delayed growth, and higher cost
of capital.67 Managing water consumption can
influence operational risks faced by companies,
with potentially acute impacts on value from
disruptions to production. Water manage-
ment can also affect ongoing operating costs
and impact cash flows through one-off capital
expenditures.
Water access is a long-term material concern
for companies in the Construction Materials in-
dustry, given its important role in the manufac-
turing process. Water shortages are a problem
in many regions of the world and are expected

18RESEARCH BRIEF | CONSTRUCTION MATERIALS© 2014 SASB™
to become a critical issue in several developing
nations where the industry operates. Higher
water prices or lack of availability directly af-
fect operating costs. Limits on industrial water
consumption could force producers to curb or
cease production, potentially impacting market
share and revenue growth.
Water intensity, particularly in regions with
water scarcity, can lead to social and political
unrest, and can impact a company’s reputation
and its license to operate, increasing its risk
profile and ultimately its cost of capital.
Water costs are gradually expected to rise
across the globe as human consumption rises
with higher standards of living, existing sources
become unfit for use due to pollution, and cli-
mate change causes variations in precipitation
patterns. Therefore, the probability and mag-
nitude of the impact of water management is
likely to increase in the near-term.
Waste Management
Due to high recycling rates within the Con-
struction Materials industry, solid waste vol-
umes are relatively low. However, local, state,
and federal regulations that cover the capture
and disposal of toxic dusts, sludge, spent fuels,
and filtered air emissions are evolving and
might pose a material risk to companies in the
industry.
In the cement manufacturing segment, apart
from other wastes, cement kiln dust (CKD) is
of particular concern. According to the EPA,
the tumbling and grinding of materials within
a kiln produce a great deal of dust that consists
mainly of ash and other tiny particles remain-
ing from burnt limestone. In addition, CKD
can contain metals and materials remaining
from the hazardous wastes sometimes used as
supplemental fuel within a kiln.68 CKD contains
high concentrations of unreacted raw materials
and is thus largely recycled back into produc-
tion. However, some CKD is not fit for reuse
and must be disposed of.69
In other industry segments, proper waste
management is also an important concern. In
the gypsum product manufacturing segment,
for example, environmental regulatory changes
might affect companies’ operations. The EPA
currently classifies synthetic gypsum as a non-
hazardous waste, but after a highly publicized
June 2008 coal ash spill, the EPA has proposed
two alternative regulations that would address
the storage and disposal of all coal combustion
by-products, including gypsum.70
As regulations evolve and there is increasing
concern about the health impacts from indus-
trial activities, companies that reduce waste
streams—hazardous waste streams in particu-
lar—and recycle by-products, could lower regu-
latory and litigation risks and costs. Company
performance in this area can be analyzed in
a cost-beneficial way internally and externally
through the following direct or indirect per-
formance metrics (see Appendix III for metrics
with their full detail):
• Amount of waste from operations, percent-
age hazardous, and percentage recycled.
19RESEARCH BRIEF | CONSTRUCTION MATERIALS© 2014 SASB™
Evidence
In general, dust emissions from U.S. cement
plants are regulated by the NSPS. The EPA
limits particulate matter to 0.15kg per metric
ton of dry kiln feed and 0.05 kg per metric ton
of cooler exhaust gases. The EPA categorized
CKD as a “special waste” and it is temporarily
exempted from hazardous waste regulations
under subtitle C of the RCRA. However, the
EPA is currently working to establish rules dic-
tating appropriate handling of CKD refuse.71
According to a Pollution Abatement Costs
and Expenditures Survey published by the EPA
in 2005, the total operating cost of pollution
abatement for cement and concrete, lime and
gypsum, flat glass, and clay building materials
manufacturing was $455.5 million, from which
58 percent went to treatment, 20 percent to
prevention, 7 percent to recycling, and 15
percent to disposal. Operating expenses related
to the solid waste pollution abatement were
$80.3 million or 17.6 percent of the total
abatement operating costs. The total pollution
abatement capital expenditures for the industry
were $171.5 million, with approximately 17
percent of the expenditures related to solid
waste abatement.72
Failure to manage waste disposal properly can
create one-time expenses in the form of fines,
and pose legal risks via lawsuits from those af-
fected. Construction materials companies can
incur significant costs associated with environ-
mental remediation due to mismanagement
of waste. For example, a San Francisco jury
awarded Modesto, CA, a $100 million settle-
ment from Vulcan Materials after ruling that
the company contaminated local groundwater
and soil with dry-cleaning solvents, including
perchloroethylene (PCE).73
Value Impact
Companies that fail to reduce waste from their
operations, or to deal with it appropriately
when it is generated, are likely to face higher
regulatory compliance costs and ongoing op-
erational costs for waste-handling. Conversely,
recycling solid wastes back into raw material
inputs can save disposal and raw materials
costs for materials producers.
Poor waste management practices can result in
one-time costs and contingent liabilities associ-
ated with legal actions, as well as reputational
damage, with impacts on brand value. This is
of particular significance for hazardous wastes
that are exempt under RCRA, where com-
munity concerns and negative impacts on the
environment and the public can result in sig-
nificant litigation costs or contingent liabilities
and erosion of brand value.
Biodiversity Impacts
The extraction and processing of construction
materials can impact the natural environment
through contamination of water, air, and land.
In addition, surface mining and mountain top
removal have a range of social and environ-
mental consequences, including altering the
landscape, removing vegetation and wildlife
habitats, and disrupting local communities.
Construction materials companies involved
in production of aggregates, cement, bricks,
glass, and gypsum often operate their own
quarries close to processing facilities. Quarrying
requires the removal of vegetation and topsoil
(overburden) and subsequent blasting and
crushing of underlying stone deposits. It is in-
20RESEARCH BRIEF | CONSTRUCTION MATERIALS© 2014 SASB™
herently a destructive process that usually leads
to permanent alterations of the landscape.
As mentioned earlier (see “Legislative and Reg-
ulatory Trends” section), the SMCRA establish-
es mining, environmental protection and recla-
mation standards for surface and underground
mining. Mine operators must obtain SMCRA
permits and permit renewals for mining opera-
tions. In addition, U.S. states require defunct
mined property to be restored to specific stan-
dards according to prior-approved reclamation
plans, including removing or burying refuse
piles, water treatment obligations, and disman-
tling facilities and roadway infrastructure.74
These obligations can result in significant costs
to construction material companies with quar-
rying operations. Due to the scale of opera-
tions, fines for regulatory non-compliance are a
fairly common occurrence despite attempts to
control ecological impacts.
The environmental characteristics of the land
where quarrying takes place could increase
extraction costs, due to increasing awareness
and protection of ecosystems. Companies
could also face regulatory or reputational bar-
riers to accessing sites in ecologically sensitive
areas. This may include new protection status
afforded to areas where sites are located. On-
going quarrying operations might result in the
violation of laws protecting endangered spe-
cies. Companies that have an effective environ-
mental management plan for different stages
of the project lifecycle—including restoration
during site decommissioning—could minimize
their compliance costs and legal liabilities.
These companies could face less community
resistance in quarrying at new sites and avoid
difficulties in obtaining permits and delays in
project completion.
Company performance in this area can be
analyzed in a cost-beneficial way internally
and externally through the following direct or
indirect performance metrics (see Appendix III
for metrics with their full detail):
• Description of environmental management
policies and practices for active sites; and
• Land disturbed, percentage of impacted area
restored.
Evidence
Members of the WBCSD’s Cement Sustain-
ability Initiative recognize their responsibility
for rehabilitation of quarry and processing
plant sites following their closure. In 2005,
the organization produced guidelines for an
Environmental and Social Impact Assessment
process for companies to use in the evaluation
of their projects.
Companies aware of the importance of this
issue have taken voluntary measures to mini-
mize risks to biodiversity and their operations;
including determining the share of operations
near areas of local biodiversity sensitivity. In
2013, Lafarge determined that 20 percent of
its active quarries were situated near eco-
logically sensitive areas, as determined by the
WWF. The company has collaborated with the
WWF over the past few years to develop bio-
diversity management plans and now reports
that 37 percent of these quarries have imple-
mented such plans.75 Similarly, CEMEX reports
that the percentage of active sites with quarry
rehabilitation plans went up to 92 percent

21RESEARCH BRIEF | CONSTRUCTION MATERIALS© 2014 SASB™
in 2013 from 89 percent in 2011, and the
percentage of active sites with high biodiver-
sity value where biodiversity action plans are
implemented has increased from 38 to 51 per-
cent over the same timeframe. The company
expects to achieve a 100 percent performance
on all the indicators by 2015.76
In fact, as concerns over ecological impacts
have grown in the past decade, additional
areas have been designated as protected
under new or existing laws, increasing risks
to company operations. From 1990 to 2010,
global protected area coverage increased from
8.8 percent to 12.7 percent on land, and from
0.9 percent to 4 percent in marine areas under
national jurisdiction.77
Construction materials companies can incur
significant costs associated with environmen-
tal remediation if biodiversity management
plans fail and ecological accidents happen. In
2010, Torromeo Industries, a private gravel
and cement producer, was fined $875,000 by
the EPA for violating the CWA. The company
illegally filled in a wetland area with gravel and
cement refuse and dumped process water into
wetlands and waterways without a permit. The
settlement required the company to restore 13
acres of wetlands.78
Perhaps more importantly, biodiversity con-
siderations are an important factor in a com-
pany’s proven and probable reserves estimates.
As Vulcan Materials reports in its FY 2013
Form 10-K, “technical and economic factors
also affect the estimates of reported reserves
regardless of what might otherwise be consid-
ered proven or probable based on a geologic
analysis. For example, excessive overburden or
weathered rock, rock quality issues, excessive
mining depths, groundwater issues, overlying
wetlands, endangered species habitats, and
rights of way or easements may effectively limit
the quantity of reserves considered proven and
probable.”79
Value Impact
Proper management of biodiversity impacts
becomes fundamental for creating true reserve
estimates, acquiring new permits and manag-
ing growth. Poor management of this issue can
result in higher regulatory compliance costs
and disruptions to permitting may occur when
ecological impacts are not carefully addressed,
leading to delays, additional costs and lost
revenue.
Conversely, active management of biodiversity
impacts–through the introduction of biodiver-
sity and land management programs–can help
companies gain easier access to new projects
and new sources of revenue. Biodiversity im-
pacts, to the extent that they impact local com-
munities, can lead to significant one-time costs
and contingent liabilities associated with legal
actions, as well as impacts on a company’s
reputation and brand value.

22RESEARCH BRIEF | CONSTRUCTION MATERIALS© 2014 SASB™
SOCIAL CAPITAL
Social capital relates to the perceived role of
business in society, or the expectation of busi-
ness contribution to society in return for its li-
cense to operate. It addresses the management
of relationships with key outside stakeholders,
such as customers, local communities, the pub-
lic, and the government. Social capital, broadly,
includes issues around local community
engagement, access to products and services,
affordability, responsible business practices in
marketing, and customer privacy.
The Construction Materials industry can affect
communities in which they are located through
air pollution, water consumption that exacer-
bates regional stresses, waste generation, and
impacts on land value and biodiversity. Com-
munity impacts can hurt a company’s social
license to operate affecting brand value. As
a result of public pressure, companies may
find it difficult to gain regulatory approvals
for expanding operations, or may face more
stringent regulations. Companies could also
have legal liabilities related to their commu-
nity impacts. These impacts are addressed by
the disclosure topics of “Air Quality,” “Water
Management,” “Waste Management” as well
as “Biodiversity Impacts.”
HUMAN CAPITAL
Human capital addresses the management
of a company’s human resources (employees
and individual contractors), as a key asset to
delivering long-term value. It includes fac-
tors that affect the productivity of employees,
such as employee engagement, diversity, and
incentives and compensation, as well as the
attraction and retention of employees in highly
competitive or constrained markets for specific
talent, skills, or education. It also addresses the
management of labor relations in industries
that rely on economies of scale and compete
on the price of products and services. Lastly, it
includes the management of the health and
safety of employees and the ability to create a
culture of safety for companies that operate in
dangerous working environments.
Worker health and safety are important consid-
erations for construction materials producers
due to inherent dangers in manufacturing. In-
vestments in strong safety programs, employee
training, and modern equipment can reduce
the risk of safety-related accidents and associ-
ated costs.
Workforce Health, Safety, and Well-being
The Construction Materials industry employs
millions of employees and contractors world-
wide; publicly traded companies alone directly
employ more than 2 million people across the
globe.80 Resource extraction activities inherent
to some segments of the industry, plus indus-
trial processes used in the manufacturing of
finished building products can present signifi-
cant risks to employees working at industry
quarries and facilities.
In the U.S., the industry is regulated by the
Mine Safety and Health Administration and

23RESEARCH BRIEF | CONSTRUCTION MATERIALS© 2014 SASB™
OSHA. While accident rates in the Construction
Materials industry are on a long-term decline,
worker injury can lead to negative publicity,
low worker morale, and increased healthcare
and injury compensation costs. Moreover,
OSHA usually levies fines against U.S. opera-
tors for non-compliance of worker health and
safety standards and preventable accidents.
Inhalation of dust containing silica and other
abrasives is a common health concern at many
cement and aggregate facilities. Both U.S.
regulators have established occupation thresh-
olds for crystalline silica exposure as respirable
dust. Exposure to cement dust can irritate
eyes, nose, throat, and the upper respiratory
system. Skin contact may result in moderate
irritation to thickening and cracking of skin to
severe skin damage from chemical burns. Silica
exposure can lead to lung injuries including
silicosis, which can be severely debilitating and
even fatal in some cases if untreated, and lung
cancer.81
Companies in the industry recognize the
importance to long-term value of maintaining
high standards of health and safety despite
pressures to reduce costs in order to protect
profitability. Company performance in this
area can be analyzed in a cost-beneficial way
internally and externally through the following
direct or indirect performance metrics (see Ap-
pendix III for metrics with their full detail):
• Injury and near-miss frequency rates for full-
time and contract employees; and
• Number of reported cases of silicosis.
Evidence
According to data from the Bureau of Labor
Statistics for 2012, there were 32 fatal occupa-
tional injuries in the non-metallic mineral prod-
uct manufacturing industry and another 16 in
the non-metallic mineral mining and quarry-
ing industry.IV The majority of them (22) were
attributable to cement and concrete product
manufacturing activities, and to a lesser extent
to construction sand and gravel mining (7), and
glass and glass product manufacturing (3).82
The number of cases of fatal injuries is relative-
ly higher for this industry; in fact, 2012 figures
are higher than industries involved in other re-
source extraction activities - such as oil and gas
extraction (26), coal mining (20) – and other
heavy manufacturing – such as petroleum and
coal products (14), primary metal manufactur-
ing (24) and chemical manufacturing (24).83
Data for non-fatal occupational injuries is also
relatively high for the industry. In 2012, the
rate of injury and illness cases per 100 full-time
employees was 5.1 and 2.3 for the industry’s
product manufacturing, and mining and quar-
rying activities, respectively. In comparison,
other resource extraction and heavy manufac-
turing industries recorded the following rates:
oil and gas extraction (2.1), coal mining (3.6),
petroleum and coal product manufacturing
(1.5), primary metal manufacturing (6.2) and
chemical manufacturing (2.3).84
Many companies put employee and contractor
safety as a priority and strive to reduce injuries
and fatalities at the workplace. For example,
CEMEX created the Global Cement Opera-
IV The Bureau of Labor Statistics uses the North American Industry Classification System (NACIS). The Non-Metallic mineral product manufacturing industry includes the following segments: clay products manufacturing, glass and glass product manufacturing, cement and concrete product manufacturing, and lime and gypsum product manufacturing. The non-metallic mineral mining and quarrying industry includes the following segments: stone mining and quarrying; sand, gravel, clay, and ceramic minerals; and other nonmetallic minerals.
24RESEARCH BRIEF | CONSTRUCTION MATERIALS© 2014 SASB™
tions Safety Taskforce with the goal to mitigate
incidents related to maintenance activities and
eliminate fatalities at operations. The com-
pany’s Lost-time Injury (LTI) Frequency Rate was
down 15 percent from 2 to 1.7 employees per
million hours worked. In 2013, the company
recorded 171 LTIs of employees and 90 of
contractors.85
Information about employee health and safety
is typically provided via sustainability reports,
such as the CEMEX case above, but some com-
panies in the industry have started providing
similar information in their SEC filings. Owens
Corning, for example, discusses progress on
its Recordable Incident Rates (RIR) in its FY
2012 Form 10-K. The company mentions that
its strong safety culture has resulted in a 95
percent reduction in its RIR since 2001; perhaps
more interestingly, the company acknowledges
the potential financial impact of its safety
initiatives: “our organization-wide expectation
[on safety] provides for a safer work environ-
ment for employees, improves our manufactur-
ing processes, reduces our costs and enhances
our reputation.”86
Non-compliance with OSHA standards, or
other health and safety regulators in other
jurisdictions, can create regulatory penalties
for companies, as well as additional operating
costs for achieving compliance. In addition,
mismanagement of health and safety issues
can also lead to lawsuits from those injured or
their families. In evidence, in 2012 one of the
top global cement manufacturers was fined
more than $200,000 for breaching sections of
the UK Health and Safety at Work Act of 1974
when an employee was burned in an electri-
cal fire caused by improper management of
electrical equipment. While one-time fines such
as these might seem low, higher-than-average
rates of fatal and non-fatal injuries in the in-
dustry might erode shareholder value over the
medium- to long-term.
Value Impact
In an industry with higher than average fatality
rates, poor health and safety records can in-
crease regulatory compliance costs from more
stringent oversight. In addition, a company’s
health and safety record can affect its insur-
ance premiums and therefore, operating costs.
Health and safety incidents can also result in
downtime or operations at reduced capacity,
and ultimately a loss of revenue-generating op-
portunities. Ultimately, it can lead to chronic
impacts on company value due to lower em-
ployee morale and productivity, and can impact
a company’s reputation and brand value.
Serious incidents with low probability of occur-
rence, but high potential magnitude of impacts
can lead to acute, one-time costs and contin-
gent liabilities from legal action or regulatory
penalties.
BUSINESS MODEL & INNOVATION
This dimension of sustainability is concerned
with the impact of environmental and social
factors on innovation and business models. It
addresses the integration of environmental and
social factors in the value creation process of
companies, including resource efficiency and
other innovation in the production process. It
also includes product innovation and efficiency
25RESEARCH BRIEF | CONSTRUCTION MATERIALS© 2014 SASB™
and responsibility in the design, use-phase, and
disposal of products. It includes management
of environmental and social impacts on tan-
gible and financial assets—either a company’s
own or those it manages as the fiduciary for
others.
Construction materials companies are increas-
ingly facing customers with preferences for
products that assist them in obtaining LEED
certifications. As a result, there is increased
demand for products, systems and services
that contribute to building sustainable spaces.
In this context, companies that focus research
and development efforts in product innova-
tions that minimize the lifecycle impact of their
materials could enjoy a strong competitive
position over the long-term.
Product Innovation
Over much of the past decade, environmental
concerns have shed light on the importance
of developing and using sustainable materials
for the construction of homes, buildings and
structures. Building construction uses large
quantities of natural resources; in fact, accord-
ing to the EPA, construction activities use 60
percent of the raw materials (other than food
and fuel) used in the entire U.S. economy.87
These materials include iron and steel prod-
ucts, fixtures, doors, and cabinetry, as well as
products manufactured by the Construction
Materials industry, such as cement, concrete,
bricks, tiles, drywall, wallboards, glass, insula-
tion products, and shingles and coating materi-
als. Apart from being resource-intensive, once
constructed, buildings are also a major source
of greenhouse gases. The EPA estimates that in
2012, direct GHG emissions from homes and
businesses accounted for approximately 10
percent of total U.S. GHG emissions.88
Key market and regulatory trends are con-
tributing to the growth of the green building
market and, in the process, are creating op-
portunities for construction material companies
that can innovate and manufacture products
that minimize impacts on the environment and
human health during their lifecycle.
Real estate developers and construction, engi-
neering and architecture firms are increasingly
seeking green building certification for their
projects. According to the USGBC, every day
more than 1.5 million square feet of space is
certified using LEED.89 In December 2013, the
organization announced that it had issued its
20,000th LEED certification since its creation in
1993. The organization reports that more than
56,000 commercial and institutional projects,
comprising 10.5 billion square feet of construc-
tion space worldwide, and more than 47,000
residential units currently participate in LEED.90
In addition, increased national, state and local
regulatory concerns over the environmental
and health impacts of buildings have spurred
the creation of new building codes that pro-
mote the use of energy-efficient products and
sustainable materials. Tax subsidies and operat-
ing costs savings have supported this trend.
Several governments, including in the U.S.,
have used financial incentives to encourage
the use of sustainable construction materials
and energy-efficient designs and appliances. As
these credits increase in value, the incentive to
use these materials increases as well.

26RESEARCH BRIEF | CONSTRUCTION MATERIALS© 2014 SASB™
The benefits of the construction of green
buildings are plentiful and include positive
environmental outcomes, such as resource sav-
ings, energy efficiency, water conservation, and
greenhouse gas mitigation, as well as social
benefits such as reduced negative impacts on
human health. Construction materials com-
panies that invest in technological advances
to bank on these trends are likely to gain a
competitive advantage over their peers as the
industry continues to be pressured by regula-
tory and market forces and as their customers
continue to seek green building certification.
Company performance in this area can be
analyzed in a cost-beneficial way, internally
and externally, through the following direct or
indirect performance metrics (see Appendix III
for metrics with their full detail):
• Percentage of products that can be used for
credits in sustainable building design and
construction certifications; and
• Total addressable market and share of mar-
ket for products that reduce environmental
impacts during usage and/or production.
Evidence
According to a report from Navigant Research,
the global market for green construction ma-
terials is expected to grow from $116 billion in
2013 to more than $254 billion in 2020, with
Europe accounting for about 50 percent of
the market.91 Increasing demand for construc-
tion materials aimed at improving resource
efficiency of buildings is also supported by a
survey of construction companies from Mc-
Graw-Hill Construction. The survey found that
51 percent of respondents reported that they
expected more than 60 percent of their work
to be green by 2015. This figure represents an
increase from the 28 and 13 percent of compa-
nies that said the same for their work in 2013
and 2008, respectively.92
In the U.S., revenue for the sustainable building
material manufacturing industry is expected
to increase at an average annual rate of 21
percent to total $31 billion by 2014.93 More-
over, during the next five years, the industry is
expected to continue expanding with revenue
forecasts increasing at an average annual rate
of 11.5 percent to $54 billion. In particular, lo-
cal demand has increased for sustainable floor-
covering products, precast concrete products
that use recycled materials (such as ash from
power furnaces), energy-efficient windows,
doors and roofs; cement-free concrete; and
structural building components made with
high recycled material content, such as gypsum
and cellulose insulation.94
Construction materials companies have quickly
adapted to rising demand for sustainable prod-
ucts. Companies in the cement and aggregates
segment provide multiple examples of products
that address impacts on water, greenhouse
gas emissions and waste. Vulcan Materials, for
example, has introduced a line of sustainable
aggregates products that enable customers
to gain LEED credits; one such innovation is
a water-permeable paving material designed
to improve natural drainage. CEMEX has a
portfolio of nine technology offers that address
environmental concerns. For example, the
company developed a product to reduce the
environmental impact of vertical concrete wall

27RESEARCH BRIEF | CONSTRUCTION MATERIALS© 2014 SASB™
systems; each home built with their product,
the company says, reduces building emissions
by a total of 170 metric tons of CO2 over the
course of 30 years.95
Finally, Ceratech, a Virginia-based cement
private company, is using fly ash waste from
coal-burning power plants as an input in their
production process. By using 95 percent fly ash
and 5 percent liquid inputs, Ceratech elimi-
nates the need to produce clinker in traditional
cement kilns. According to the company, the
cement is carbon-neutral, and in a three-story,
4,600-square-meter building, would divert 374
tons of fly ash from landfill and reduce carbon
dioxide emissions by 320 tons, steel reinforcing
bars by 34 tons, and concrete use by 183 cubic
meters.96
Companies operating in other industry seg-
ments have also adapted to the rising demand
in sustainable construction materials. Owens
Corning, for example, developed EcoTouch in-
sulation, which is formaldehyde-free, contains
at least 58 percent recycled glass content, and
contains a minimum of 99 percent plant- and
mineral-based compounds.97 USG Corp has a
portfolio of 12 acoustical ceiling panels that
improve a buildings’ environmental perfor-
mance and contribute toward healthier living
and working spaces. The company provides
environmental product declarations that detail
their products’ lifecycle impacts on the atmo-
sphere, water and other resources.
Several companies in the industry have started
to recognize the materiality of this issue in
their SEC filings. For example, in its FY 2013
Form 10-K, USG Corp states that it expects
“increased demand over time for products (…)
that meet regulatory and customer sustainabil-
ity standards and preferences and decreased
demand for products that produce significant
greenhouse gas emissions.”98 Furthermore, the
company states that its ability to navigate these
changes in customer preferences and continue
to provide sustainable construction materials
will be important in maintaining a competi-
tive position in the future. In a similar fashion,
U.S. Concrete states in its FY 2013 Form 10-K
Form that its green building product tech-
nology creates competitive advantages over
smaller concrete producers and larger vertically
integrated aggregates and cement companies
that do not focus on this type of products as a
first solution; the company goes on to say that
it is well-positioned to take advantage of the
growing demand for sustainable products with
potential positive impacts on revenues, profits,
and operating margins.
Value Impact
Sustainable construction materials are be-
coming a key market for the industry, driving
competitive advantage and long-term revenue
growth through higher increased market share
and pricing power. Companies who are able to
take advantage of emerging trends may gain a
competitive advantage over their rivals, improv-
ing their conditions for cost of capital. More-
over, initiatives to develop sustainable building
materials are likely to impact research and
development expenses. Sustainable products
can also lead to lower costs to the extent that
production incorporates recycled raw materials.

28RESEARCH BRIEF | CONSTRUCTION MATERIALS© 2014 SASB™
Given increasing consumer demand for sustain-
able construction materials, the probability
and magnitude of impact on financial results is
likely to increase in the near-term.
LEADERSHIP AND GOVERNANCE
As applied to sustainability, governance
involves the management of issues that are
inherent to the business model or common
practices in the industry and that are in po-
tential conflict with the interest of broader
stakeholder groups (government, community,
customers, and employees), and therefore cre-
ate a potential liability, or worse, a limitation
or removal of license to operate. This includes
regulatory compliance, lobbying, and political
contributions. It includes risk management,
safety management, supply chain and resource
management, conflict of interest, anti-competi-
tive behavior, and corruption and bribery.
In the Construction Materials industry, gov-
ernance issues arise from the relative lack of
transparency in the pricing of some construc-
tion materials, which can in turn create the po-
tential for market manipulation with an impact
on customers and businesses.
Pricing Integrity & Transparency
The potential for market manipulation prac-
tices exists when market power is concentrated
in the hands of a few players. Antitrust prac-
tices include measures to obtain or maintain
market domination by reducing competition;
such practices may harm the public by limit-
ing choice, increasing prices, and stifling
innovation. Antitrust regulations, such as the
Sherman Act in the U.S., seek to maintain a
competitive environment in order to provide
consumers with the benefit of lower prices,
high quality products and services, more
choices, and greater innovation.
Several factors make the Constructions Materi-
als industry prone to antitrust risks. First, as de-
scribed in the Industry Summary section, some
segments within the industry, in particular the
cement and aggregates segment, are in the
process of global consolidation. This segment is
already characterized by a handful of dominant
companies, and planned mergers – such as the
one between Holcim and Lafarge – will likely
increase the market power of some companies
in both global and regional markets. Second,
barriers to entry are relatively high due to high
capital expenditure requirements needed in
order to extract and process raw materials.
Third, the lack of close substitutes and a grow-
ing demand for cement and cement-based
products to fuel the development of world
infrastructure, give companies in the industry
relative power over their customers.
Company performance in this area can be
analyzed in a cost-beneficial way internally
and externally through the following direct or
indirect performance metrics (see Appendix III
for metrics with their full detail):
• Amount of legal and regulatory fines and
settlements associated with cartel activities,
price fixing, and anti-trust activities.
Evidence
In late 2012, USG Corp and seven other manu-
facturers of drywall products, including Nation-

29RESEARCH BRIEF | CONSTRUCTION MATERIALS© 2014 SASB™
al Gypsum and Lafarge North America, were
named as defendants in a class-action lawsuit
alleging that since September 2011, they
conspired to fix and raise the price of gypsum
wallboard sold in the U.S. market.99 USG Corp
mentions in its FY 2013 Form 10-K that the
lawsuit is still in its preliminary stages while also
informing its shareholders that similar lawsuits
have been filled in Canadian courts on behalf
of purchases of the same product in Canada.
Examples of market manipulation lawsuits and
investigations in other jurisdictions are also
available. For example, in 2008 and 2009, the
EU Commission carried out unannounced in-
spections in eight Member States at the prem-
ises of cement and aggregate companies. Such
inspections led to the opening of antitrust pro-
ceedings against eight cement manufacturers,
including Holcim, Lafarge, HeidelbergCement
and CEMEX, among others, on the grounds
of market sharing and price coordination. The
final ruling is still pending as several companies
unsuccessfully appealed the Commission’s re-
quest for information to investigate the alleged
infringement.100
The cement and aggregates segment is not the
only one that has been under investigation by
the EU Commission. In November 2007, the
European body imposed fines totaling almost
€490 million euro on four flat glass produc-
ers, including the two largest publicly traded
companies in the segment, after surprise
inspections that began in 2005. The investiga-
tion concluded that Saint-Gobain (France) and
Asahi Glass (Japan), alongside Guardian Indus-
tries (U.S.) and Pilkington (U.K.), who together
controlled 80 percent of the flat glass market
in the European Economic Area, organized sev-
eral rounds of price increases and fixed mini-
mum prices and other commercial conditions in
an attempt to manipulate the market.101
Fines for market manipulation practices have
also being levied in emerging countries, where
the bulk of the industry’s growth is com-
ing from. In May 2014, for example, Brazil’s
anti-trust watchdog, Cade, fined Holcim Ltd.
and Cimpor Cimentos de Portugal, among
four other Brazilian cement manufacturers, a
total of $1.4 billion for alleged price-rigging
over a two-decade timespan. Moreover, the
companies were ordered to dispose of certain
assets, including cross-shareholdings and to
cut installed capacity in concrete services by 20
percent in large markets.102 Cade estimates that
as a result of the collusion, Brazil was losing
1.4 billion reais annually while the companies
were controlling 85 percent of the nation’s
cement market and forcing competitors out of
the market by setting agreed prices.103
Moreover, antitrust authorities in the U.S. and
abroad are becoming cautious about the impli-
cations of mergers and acquisitions to consum-
ers and industry competitors. In April 2014,
Holcim and Lafarge, the two largest cement
manufacturers, agreed to form the world’s
largest cement maker when they announced
plans to merge. The merger plan includes sell-
ing assets with $6.9 billion in revenues in order
to win regulatory approvals from 15 antitrust
authorities, including those in the U.S. and
other countries, such as Canada, Brazil, India
and China.104 If the merger is approved, the
30RESEARCH BRIEF | CONSTRUCTION MATERIALS© 2014 SASB™
combined group would account for $40 billion
in annual revenue105, which is twice as much
as the third largest cement maker, CNBM of
China. Several antitrust authorities, including
the EU Commission have already expressed
their concern that a merger may harm consum-
ers by increases in prices and reduced competi-
tion.106
Value Impact
Companies’ ability to manage the chang-
ing legal and regulatory environment, as well
as their ability to ensure their operations are
competitive, could have both acute and chronic
impacts on value. Acute impacts could arise
from major regulatory sanctions in the form of
extraordinary expenses and contingent liabili-
ties to compensate third parties. Such rulings
may also impose limits on companies’ ability to
charge higher prices and restrict their license to
operate in certain markets, with dual impacts on
revenue in terms of market share and pricing.
Over the long-term, repeated violations —
whether resulting in minor or significant regu-
latory penalties at the time — could affect a
company’s reputation. This chronic effect could
restrict a company’s ability to gain regulatory
approvals and expand operations, limiting
its long-term revenue growth potential, and
raising its risk profile, and therefore, cost of
capital.
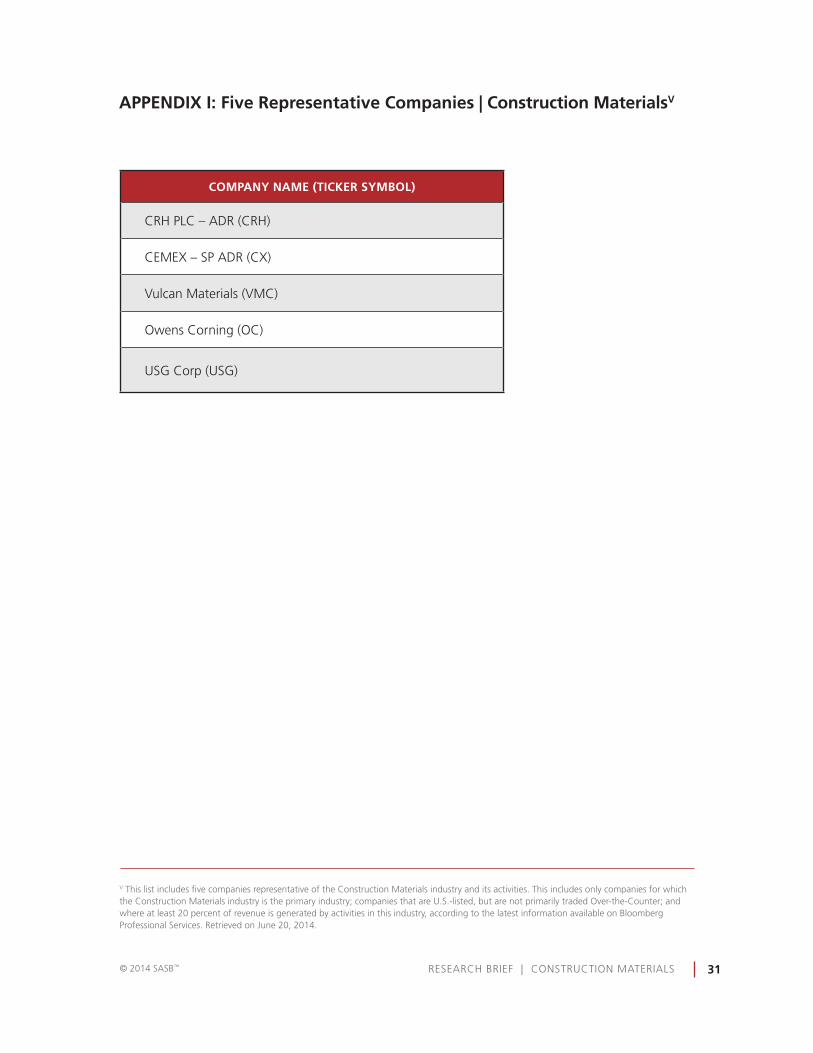
31RESEARCH BRIEF | CONSTRUCTION MATERIALS© 2014 SASB™
APPENDIX I: Five Representative Companies | Construction MaterialsV
COMPANY NAME (TICKER SYMBOL)
CRH PLC – ADR (CRH)
CEMEX – SP ADR (CX)
Vulcan Materials (VMC)
Owens Corning (OC)
USG Corp (USG)
V This list includes five companies representative of the Construction Materials industry and its activities. This includes only companies for which the Construction Materials industry is the primary industry; companies that are U.S.-listed, but are not primarily traded Over-the-Counter; and where at least 20 percent of revenue is generated by activities in this industry, according to the latest information available on Bloomberg Professional Services. Retrieved on June 20, 2014.

32RESEARCH BRIEF | CONSTRUCTION MATERIALS© 2014 SASB™
APPENDIX IIA: Evidence for Sustainability Disclosure Topic
Sustainability Disclosure Topics
EVIDENCE OF INTERESTEVIDENCE OF
FINANCIAL IMPACTFORWARD-LOOKING IMPACT
HM (1-100)
IWGsEI
Revenue & Costs
Assets & Liabilities
Cost of Capital
EFIProbability & Magnitude
Exter- nalities
FLI% Priority
Greenhouse Gas Emissions 40* 100 2 High • • High • • Yes
Air Quality 40* 100 5 High • • High • Yes
Energy Management 60* 100 1 High • • High • Yes
Water Management 35 100 3 High • • • Medium • Yes
Waste Management 50* 92 7 High • • Medium No
Biodiversity Impacts 45* 85 8 Medium • • High • Yes
Workforce Health, Safety, and Well-being
70* 92 4 High • • Medium No
Product Innovation 50* 92 6 High • • • High • Yes
Pricing Integrity & Transparency 50* 85 9 Medium • • • High No
HM: Heat Map, a score out of 100 indicating the relative importance of the topic among SASB’s initial list of 43 generic sustainability issues; asterisks indicate “top issues.” The score is based on the frequency of relevant keywords in documents (i.e., 10-Ks, shareholder resolutions, legal news, news articles, and corporate sustainability reports) that are available on the Bloomberg terminal for the industry’s publicly-listed companies; issues for which keyword frequency is in the top quartile are “top issues.”
IWGs: SASB Industry Working Groups
%: The percentage of IWG participants that found the disclosure topic to likely constitute material information for companies in the industry. (-) denotes that the issue was added after the IWG was convened.
Priority: Average ranking of the issue in terms of importance. One denotes the most important issue. (-) denotes that the issue was added after the IWG was convened.
EI: Evidence of Interest, a subjective assessment based on quantitative and qualitative findings.
EFI: Evidence of Financial Impact, a subjective assessment based on quantitative and qualitative findings.
FLI: Forward Looking Impact, a subjective assessment on the presence of a material forward-looking impact.

33RESEARCH BRIEF | CONSTRUCTION MATERIALS© 2014 SASB™
APPENDIX IIB: Evidence of Financial Impact for Sustainability Disclosure Topics
Evidence of
Financial Impact
REVENUE & EXPENSES ASSETS & LIABILITIES COST OF CAPITAL
Revenue Operating Expenses Non-operating Expenses Assets Liabilities
Risk ProfileIndustry
Divestment Risk
Market Size Pricing Power COGS R&D CapExExtra-
ordinary Expenses
Tangible Assets
Intangible Assets
Contingent Liabilities & Provisions
Pension & Other
Liabilities
Greenhouse Gas Emissions • • • • •
Air Quality • • • • •
Energy Management • • •
Water Management • • • • •
Waste Management • • • •
Biodiversity Impacts • • • • • • •
Workforce Health, Safety, and Well-being
• • • •
Product Innovation • • • • • • •
Pricing Integrity & Transparency • • • • • •
H IGH IMPACTMEDIUM IMPACT
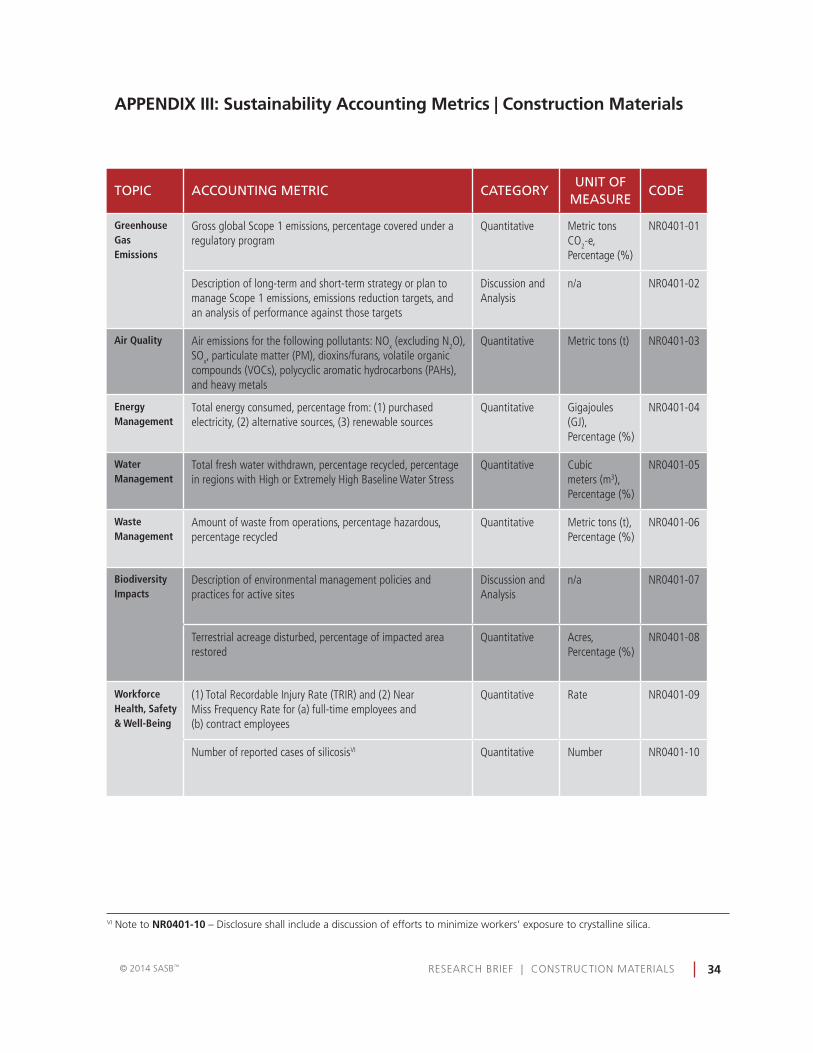
34RESEARCH BRIEF | CONSTRUCTION MATERIALS© 2014 SASB™
APPENDIX III: Sustainability Accounting Metrics | Construction Materials
TOPIC ACCOUNTING METRIC CATEGORYUNIT OF
MEASURECODE
Greenhouse Gas Emissions
Gross global Scope 1 emissions, percentage covered under a regulatory program
Quantitative Metric tons CO2-e, Percentage (%)
NR0401-01
Description of long-term and short-term strategy or plan to manage Scope 1 emissions, emissions reduction targets, and an analysis of performance against those targets
Discussion and Analysis
n/a NR0401-02
Air Quality Air emissions for the following pollutants: NOx (excluding N2O), SOx, particulate matter (PM), dioxins/furans, volatile organic compounds (VOCs), polycyclic aromatic hydrocarbons (PAHs), and heavy metals
Quantitative Metric tons (t) NR0401-03
Energy Management
Total energy consumed, percentage from: (1) purchased electricity, (2) alternative sources, (3) renewable sources
Quantitative Gigajoules (GJ), Percentage (%)
NR0401-04
Water Management
Total fresh water withdrawn, percentage recycled, percentage in regions with High or Extremely High Baseline Water Stress
Quantitative Cubic meters (m3), Percentage (%)
NR0401-05
Waste Management
Amount of waste from operations, percentage hazardous, percentage recycled
Quantitative Metric tons (t), Percentage (%)
NR0401-06
Biodiversity Impacts
Description of environmental management policies and practices for active sites
Discussion and Analysis
n/a NR0401-07
Terrestrial acreage disturbed, percentage of impacted area restored
Quantitative Acres, Percentage (%)
NR0401-08
Workforce Health, Safety & Well-Being
(1) Total Recordable Injury Rate (TRIR) and (2) Near Miss Frequency Rate for (a) full-time employees and (b) contract employees
Quantitative Rate NR0401-09
Number of reported cases of silicosisVI Quantitative Number NR0401-10
VI Note to NR0401-10 – Disclosure shall include a discussion of efforts to minimize workers’ exposure to crystalline silica.

35RESEARCH BRIEF | CONSTRUCTION MATERIALS© 2014 SASB™
APPENDIX III: Sustainability Accounting Metrics | Construction Materials (cont.)
TOPIC ACCOUNTING METRIC CATEGORYUNIT OF
MEASURECODE
Product Innovation
Percentage of products that can be used for credits in sustainable building design and construction certifications
Quantitative Percentage (%) by annual sales revenue
NR0401-11
Total addressable market and share of market for products that reduce energy, water, and/or material impacts during usage and/or production
Quantitative U.S. Dollars ($), Percentage (%)
NR0401-12
Pricing Integrity & Transparency
Amount of legal and regulatory fines and settlements associated with cartel activities, price fixing, and anti-trust activitiesVI
Quantitative U.S. Dollars ($) NR0401-13
VII Note to NR0401-13 – Disclosure shall include a description of fines and settlements and corrective actions implemented in response to events.
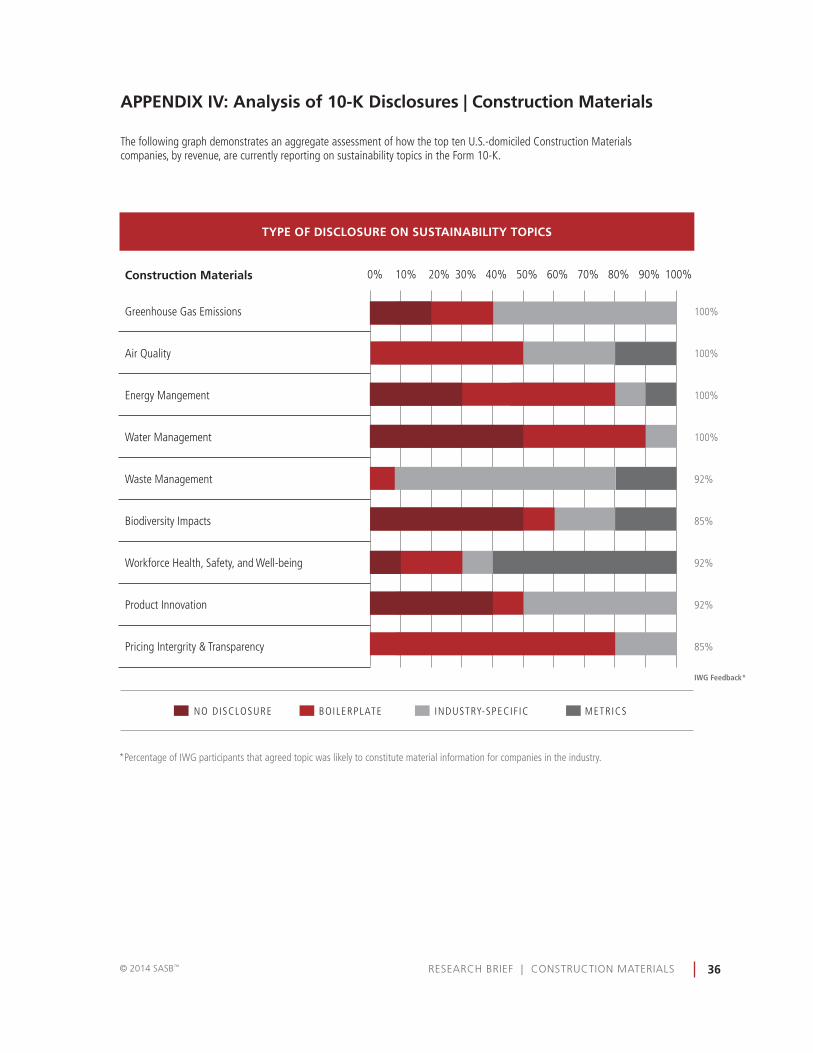
36RESEARCH BRIEF | CONSTRUCTION MATERIALS© 2014 SASB™
APPENDIX IV: Analysis of 10-K Disclosures | Construction Materials
The following graph demonstrates an aggregate assessment of how the top ten U.S.-domiciled Construction Materials companies, by revenue, are currently reporting on sustainability topics in the Form 10-K.
Construction Materials
Greenhouse Gas Emissions
Air Quality
Energy Mangement
Water Management
Waste Management
Biodiversity Impacts
Workforce Health, Safety, and Well-being
Product Innovation
Pricing Intergrity & Transparency
0% 10% 20% 30% 40% 50% 60% 70% 80% 90% 100%
TYPE OF DISCLOSURE ON SUSTAINABILITY TOPICS
100%
100%
100%
100%
92%
85%
92%
92%
85%
IWG Feedback*
NO DISCLOSURE BOILERPLATE INDUSTRY-SPECIF IC METRICS
*Percentage of IWG participants that agreed topic was likely to constitute material information for companies in the industry.

37RESEARCH BRIEF | CONSTRUCTION MATERIALS© 2014 SASB™
References
1 Data from Bloomberg Professional service using ICS <GO> command. The data represents global revenue numbers of companies listed on global exchanges, or traded over-the-counter, from the Construction Materials industry, using the Levels 2 and 3 Bloomberg Industry Classification System. The calculation excludes Wood Building Products. Accessed June 12, 2014.
2 Ibid.
3 Ibid.
4 Lechtenberg, Marie. “Top 20 global cement companies.” Global Cement. Accessed June 18, 2014. http://www.globalcement.com/magazine/articles/741-top-20-global-cement-companies
5 Ibid.
6 Lafarge SA. 2012 Annual Report. Page 36.
7 Portland Cement Association. “Cement Manufacturing.” 2013. Accessed August 1, 2013. http://www.cement.org/manufacture/man_fuels.asp
8 Martin, Richard. “Green Building Materials Will Reach $254 Billion in Annual Market Value by 2020.” Navigant Research. Accessed July 8, 2013. http://www.navigantresearch.com/newsroom/green-building-materials-will-reach-254-billion-in-annual-market-value-by-2020
9 Vulcan Materials Inc. 2012 Form 10-K.
10 CEMEX 2013 Form 20-F. Page 19.
11 IBIS World Industry report 32741. Lime Manufacturing in the US. August 2013.
12 Kennedy, Kevin. “EPA’s New Source Performance Standards: A Positive Step Toward Reducing Greenhouse Gas Emissions.” World Resource Institute. June 26, 2013. Accessed July 14, 2013. http://insights.wri.org/news/2012/06/epas-new-source-performance-standards-positive-step-toward-reducing-greenhouse-gas-emis
13 U.S. EPA. “Greenhouse Gas Reporting Program.” Accessed June 10, 2014. http://www.epa.gov/ghgreporting/reporters/subpart/index.html
14 European Commission. “The EU Emissions Trading System.” 2013. Accessed July 12, 2013. http://ec.europa.eu/clima/policies/ets/index_en.htm
15 International Emissions Trading Association. “The EU’s Emissions Trading System.” Accessed June 10, 2014. http://www.ieta.org/index.php?option=com_content&view=article&catid=54:3-minute-briefing&id=324:the-eu-emissions-trading-system
16 Goddard, Leah. “IBISWorld Industry Report 33111 Iron & Steel Manufacturing in the US.” IBISWorld. April 2014.
17 U.S. EPA. “Cement Kiln Dust Waste.” Accessed on June 22, 2014. http://www.epa.gov/solidwaste/nonhaz/industrial/special/ckd/index.htm
18 Finamore, Barbara. “Air Pollution Crisis Gives New Momentum to Environmental Regulation in China.” Natural Resources Defense Council Staff Blog. February 22, 2013. Accessed June 10, 2014. http://switchboard.nrdc.org/blogs/bfinamore/air_pollution_crisis_gives_new.html
19 IBIS World Industry report 32741. “Stone Mining in the US.” May 2014.
20 Rubenstein, Madeleine. “Emissions from the Cement Industry”. The Earth Institute. Columbia University. Accessed June 19, 2014. http://blogs.ei.columbia.edu/2012/05/09/emissions-from-the-cement-industry/
21 Environmental Protection Agency. Technical Support Document for the Glass Manufacturing Sector: “Proposed Rule for Mandatory Reporting of Greenhouse Gases.” January 2009. Page 1.
22 Oekom Industry Focus. “Cement Production in the U.S.” 2013.
23 Ibid.
24 Environmental Leader. “Cement Industry cuts carbon emissions 17%.” July 16, 2013. https://www.environmentalleader.com/2013/07/16/cement-industry-cuts-carbon-emissions-17/
25 Ibid.
26 U.S. EPA. Inventory of U.S. Greenhouse Emissions and Sinks: 1990-2012. April, 2014. Page ES-5.
27 U.S. EPA. Inventory of U.S. Greenhouse Emissions and Sinks: 1990-2012. April, 2014. Page ES-12.
28 Environmental Protection Agency. Technical Support Document for the Glass Manufacturing Sector: Proposed Rule for Mandatory Reporting of Greenhouse Gases. January 2009. Page 1.
29 World Business Council for Sustainable Development, Cement Sustainability Initiative. 2013. http://www.wbcsdcement.org/
30 “CRH: Sustainability Report 2012 - RESPONSIBLE PERFORMANCE & GROWTH.” Page 35.
31 Walzer, Robert. “A cement giant tackles its CO2 emissions.” New York Times. January 13, 2010. http://green.blogs.nytimes.com/2010/01/13/cement-giant-tackles-its-footprint/
32 “CRH: Sustainability Report 2012 - RESPONSIBLE PERFORMANCE & GROWTH.” Page 69.
33 Ibid. Page 8.
34 Martin Marietta Materials. Form 10-K for fiscal year 2013. Page 18.
35 USG Corp. Form 10-K for fiscal year 2013. Page 14.
38RESEARCH BRIEF | CONSTRUCTION MATERIALS© 2014 SASB™
References (cont.)
36 U.S. EPA. “Cement manufacturing, At a glance 1996 – 2005.” Accessed on June 22, 2014. http://www.epa.gov/sectors/pdf/2008/cement_manufacturing.pdf
37 Vijayaraghavan, Akhila. “The Costs of Inaction: Cement Company Fined $1.7M for Clean Air Act Violations.” Triple Pundit. January 6, 2013. http://www.triplepundit.com/2012/01/costs-inaction-cement-company-fined-17m-clean-air-act-violations/
38 Environmental Protection Agency. “The 2008 National Emissions Inventory.” EPA. Accessed June 18, 2014. http://www.epa.gov/ttn/chief/net/2008inventory.html
39 CEMEX: 2013 sustainable development report. Page 45.
40 Lafarge. Sustainable Development. Case Studies – Environment. Accessed June 19, 2014. http://www.lafarge.com/wps/portal/2_4_4_1-EnDet?WCM_GLOBAL_CONTEXT=/wps/wcm/connect/Lafarge.com/AllCS/Env/AQ/CS040411/CSEN
41 Associated Press. “EPA fines ash grove cement.” June 19, 2013. Accessed July 14, 2013. http://www.bakercityherald.com/Local-News/EPA-fines-Ash-Grove-Cement
42 U.S. Energy Information Administration. “The cement industry is the most energy intensive of all manufacturing industries”. July 2013. Accessed June 19, 2014. http://www.eia.gov/todayinenergy/detail.cfm?id=11911
43 Portland Cement Association. “Cement Manufacturing.” 2013. Accessed August 1, 2013. http://www.cement.org/for-concrete-books-learning/cement-manufacturing/industry-overview
44 U.S. EPA: 2008 Sector Performance Report. Sector Strategies. Page 19.
45 U.S. Energy Information Administration. “Glass manufacturing is an energy-intensive industry mainly fueled by natural gas”. Accessed June 19, 2014. http://www.eia.gov/todayinenergy/detail.cfm?id=12631
46 Ibid.
47 U.S. Census Bureau, Annual Survey of Manufacturers - General Statistics: Statistics for Industry Groups and Industries. Released: December 17, 2013.
48 Ibid.
49 Ibid.
50 Daniel Olsen et al. “Opportunities for Energy Efficiency and Demand Response in the California Cement Industry.” L.O. Berkeley National Laboratory. 2010. http://drrc.lbl.gov/publications/opportunities-energy-efficiency-and-demand-response-california-cement-industry
51 China Resources Cement Holdings: 2012 Annual Results Presentation. Page 21-22.
52 Lafarge. Energy use and resources efficiency. Accessed June 19, 2014. http://www.lafarge.com/wps/portal/2_8_2-Ambitions-2020-Consommation-energie-et-Gestion-ressources
53 Holcim. “Reducing our carbon impact.” Accessed June 19, 2014. http://www.holcim.com/sustainable-development/environment/energy-and-climate/reducing-our-carbon-impact.html
54 CEMEX: 2013 sustainable development report. Page 34.
55 Murray, Ashley, and Lynn Price, “Use of Alternative Fuels in Cement Manufacture: Analysis of Fuel Characteristics and Feasibility for Use in the Chinese Cement Sector.” Ernest Orlando Lawrence Berkeley National Laboratory, June 2008. Accessed on June 22, 2014. http://china.lbl.gov/sites/all/files/lbl-525e-alternative-fuels-cementjune-2008.pdf
56 “Environmental Benefits of Using Alternative Fuels in Cement Production.” CEMBUREAU, February 1999. Accessed on June 22, 2014. http://www.wbcsdcement.org/pdf/tf2/CEMBUREAU.pdf
57 Martin Marietta Materials. Form 10-K for fiscal year 2013. Page 27.
58 JPMorgan Global Equity Research, “Watching water. A guide to evaluating corporate risks in a thirsty world.” March 31, 2008.
59 MSCI ESG Issue Report: Water: Upstream and Downstream Impacts from a Well Running Dry –Executive Summary, September 2013, Figure 2.
60 EPA, ENERGY STAR: Energy Efficiency Improvement and Cost Saving Opportunities for Cement Making. August 2013. Page 7.
61 Holcim. Water. Accessed June 19, 2014. http://www.holcim.com/sustainable-development/environment/water.html
62 Lafarge. “Water, a key component of the WWF partnership.” Accessed June 19, 2014. http://www.lafarge.com/wps/portal/2_3_5-Preserver_eau/
63 CEMEX: 2013 sustainable development report. Page 40.
64 Lafarge SA. 2012 Annual Report. Page 131.
65 CEMEX: 2013 sustainable development report. Page 30.
66 Lafarge. “Water, a key component of the WWF partnership.” Accessed June 19, 2014. http://www.lafarge.com/wps/portal/2_3_5-Preserver_eau/
67 Levinson, Marc et al. “Watching water.” Global Equity Research, March 31, 2008. http://www.wri.org/publication/watching-water
68 U.S. EPA. Cement manufacturing, at a glance 1996 – 2005. Page 23.
69 U.S. EPA. “Cement Kiln Dust.” Accessed July 23, 2013. http://www.epa.gov/osw/nonhaz/industrial/special/ckd/
70 USG Corp. Form 10-K for fiscal year 2013. Page 13.
71 U.S. EPA. “Cement Kiln Dust.” Accessed July 23, 2013. http://www.epa.gov/osw/nonhaz/industrial/special/ckd/

39RESEARCH BRIEF | CONSTRUCTION MATERIALS© 2014 SASB™
References (cont.)
72 Pollution Abatement Costs and Expenditures: 2005 Survey. http://yosemite.epa.gov/EE%5Cepa%5Ceed.nsf/webpages/pace2005.html
73 Bloomberg News. “Modesto Awarded $175 Million.” Los Angeles Times. June 15, 2006. Accessed June 22, 2014. http://articles.latimes.com/2006/jun/15/business/fi-vulcan15
74 Alliance Resource Partners, L.P. Item 1. Form 10-K for fiscal year 2012.
75 Lafarge. Natural Resources. Accessed June 19, 2014. http://www.lafarge.com/wps/portal/2_8_1-Ambitions-2020-Ressources-naturelles#editoEncartVide0000000000038283
76 CEMEX: 2013 sustainable development report. Page 8.
77 International Institute for Sustainable Development. “Biodiversity Policy and Practice. UNEP-WCMC/IUCN Report Highlights Growth in Protected Areas.” 7 September 2012. Accessed June 8, 2012. http://biodiversity-l.iisd.org/news/unep-wcmciucn-report-highlights-growth-in-protected-areas/.
78 Schreiber, Jason. “Kingston Firm fined $835,000 for violating clean water act, filling wetlands.” New Hampshire Union Leader. April 4, 2013. Accessed July 8, 2013. http://www.unionleader.com/article/20130405/NEWS02/130409504/0/news03
79 Vulcan Materials. Form 10-K for fiscal year 2013. Page 21.
80 Data from Bloomberg Professional service using EQS <GO> command. The data represents total employees for FY 2013 for companies listed on global exchanges, or traded over-the-counter, from the Construction Materials industry, using the Levels 2 and 3 Bloomberg Industry Classification System. The calculation excludes Wood Building Products. Accessed June 18, 2014.
81 Occupational Safety and Health Administration. Concrete Manufacturing – Pocket Guide. OSHA 3221 – 2004. https://www.osha.gov/Publications/concrete_manufacturing.html
82 Bureau of Labor Statistics. Work-related Fatalities, Injuries, and Illnesses 2012. http://www.bls.gov/iag/tgs/iag327.htm#fatalities_injuries_and_illnesses
83 Ibid.
84 Ibid
85 CEMEX: 2013 sustainable development report. Page 88.
86 Owens Corning. Form 10-K for fiscal year 2012.
87 Environmental Protection Agency. “Choosing Green Materials and Products.” Accessed June 14, 2014. http://www.epa.gov/greenhomes/SmarterMaterialChoices.htm
88 Environmental Protection Agency. “Sources of Greenhouse Gas Emissions – Commercial and Residential.” Accessed June 14, 2014. http://epa.gov/climatechange/ghgemissions/sources/commercialresidential.html
89 USGBC. U.S. Green Building Council Certifies 20,000th LEED Commercial Project. Accessed June 18, 2014. http://www.usgbc.org/articles/us-green-building-council-certifies-20000th-leed-commercial-project
90 Ibid.
91 Environmental Leader. “Green Building Materials ‘$254bn Annual Market by 2020’.”. Accessed May 23, 2014. http://www.environmentalleader.com/2013/05/02/green-building-materials-254bn-annual-market-by-2020/
92 Environmental Leader. “Green Building to Accelerate, Survey Finds.” Accessed June 18, 2014. http://www.environmentalleader.com/2013/03/04/green-building-to-accelerate-survey-finds/
93 IBIS World. Sustainable Building Material Manufacturing Industry Report. June 2014.
94 Ibid.
95 CEMEX. Sustainable Building Materials. Accessed June 18, 2014. http://www.cemex.com/SustainableDevelopment/SustainableMaterials.aspx
96 Ceratech, Inc. “Sustainability.” 2013. http://www.ceratechinc.com/Sustainability
97 Owen Corning website. “Sustainable Products.” 2013. Accessed July 25, 2013. http://sustainability.owenscorning.com/contents/products/2010-Product-Innovations/EcoTouch/
98 USG Corp. Form 10-K for fiscal year 2013. Page 5.
99 Smythe, Christie. USG Accused in Lawsuit of Fixing Drywall Prices. Bloomberg. Accessed: June 18, 2014. http://www.bloomberg.com/news/2012-12-17/usg-accused-in-lawsuit-of-fixing-drywall-prices.html
100 Europa Press Release Database. “Antitrust: Commission welcomes General Court judgments in cement cartel case confirming its investigatory powers.” Accessed June 18, 2014. http://europa.eu/rapid/press-release_MEMO-14-192_en.htm
101 Europa Press Release. “Antitrust: Commission fines flat glass producers € 486.9 million for price fixing cartel”. Accessed June 18, 2014. http://europa.eu/rapid/press-release_IP-07-1781_en.htm

40RESEARCH BRIEF | CONSTRUCTION MATERIALS© 2014 SASB™
References (cont.)
102 Goy, Leonardo, and Guillermo Parra-Bernal. “UPDATE 2-Brazil fines cement firms $1.4 bln for price rigging, orders asset sales.” Reuters. Accessed May 30, 2014. http://www.reuters.com/article/2014/05/29/brazil-cement-antitrust-idUSL1N0OE2IF20140529
103 Lima, Mario Sergio. “Holcim Among Six Fined $1.4 Billion in Brazil Cartel Case.” Bloomberg.com. Accessed May 30, 2014. http://www.bloomberg.com/news/2014-05-29/holcim-among-six-fined-1-4-billion-in-brazil-cartel-case.html
104 Winters, Patrick. “Holcim to Merge With Lafarge to Form Biggest Cement Maker.” Bloomberg. Accessed June 18, 2014. http://www.bloomberg.com/news/2014-04-07/holcim-to-merge-with-lafarge-to-form-biggest-cement-maker.html
105 Ibid.
106 Chee, Foo. “EU antitrust chief sees lengthy review of Holcim, Lafarge deal.” Reuters. Accessed May 23, 2014. http://www.reuters.com/article/2014/04/10/us-holcim-lafarge-eu-idUSBREA390H420140410

SUSTAINABILITY ACCOUNTING STANDARDS BOARD®
75 Broadway, Suite 202
San Francisco, CA 94111
415.830.9220
www.sasb.org
ISBN#: 978-1-940504-27-8
The information, text, and graphics in this publication (the “Content”) is owned by Sustainability Accounting Standards Board. All rights reserved. You may use the Content only for non-commercial and scholarly use, provided that you keep intact all copyright and other proprietary notices related to the Content, and that you make no modifications to the Content. The Content may not be otherwise disseminated, distributed, republished, reproduced, or modified without the prior written permission of Sustainability Accounting Standards Board. To request permission, please contact us at [email protected].