construction of templates for restoration of longleaf pine ecosystems robert k. peet university of...
Post on 20-Dec-2015
214 views
TRANSCRIPT

Construction of templates for restoration of longleaf
pine ecosystems
Robert K. PeetUniversity of North Carolina
&
Richard P. DuncanLincoln University

Boyd Tract
Wade Tract
True old-growth trees are essentially gone, and may not be the most critical conservation target anyway.

• Few sites with ‘old-growth’ understory remain.• Conservation requires a combination of preservation and restoration.

Our goal was to demonstrate how to develop restoration targets for longleaf pine sites.
Restoration requires a target.

Target attributes should include:
- Species pool and geographic turnover
- Species richness
- Plant types
- Local environmental variation
- Landscape pattern

Numerical methods can be used to classify plots and relate them to critical environmental factors.
Compositional variation of longleaf systems of SE North Carolina largely reflects soil texture and moisture.

Fagaceae
Liliaceae
Fabaceae
Orchidaceae
Consistent patterns occur in species composition

Longleaf pine systems exhibit considerable geographic turnover. Restoration strategies must include differences among longleaf ecoregions.
Longleaf ecoregions of the Carolinas

For our demonstration we focus on the longleaf pine vegetation of the Fall-line Sandhills

Dataset:
- 188 plots across fall-line sandhills of NC, SC, & GA
- All sites contained near-natural, fire-maintained groundlayer vegetation
- Carolina Vegetation Survey protocol with nested quadrates (0.01 – 1000 m2).
- Soil attributes included for both the A and B horizon: sand, silt, clay, Ca, Mg, K, P, S, Mn, Na, Cu, Zn, Fe, BD, pH, organic content, CEC, BS.


Step 1. Develop a classification of the major vegetation types of the ecoregion.
We used a cluster analysis with a matrix of 188 plots x 619 species.
The vegetation types were seen to be differentiated with respect to texture, moisture, nutrient status, & geography.

Hierarchical classification of Fall-line Sandhill pinelands
1. Pinus palustris woodlands of poorly drained soilsPinus serotina – Pinus palustris / Nyssa sylvatica – Cyrilla (5)Pinus palustris – Pinus serotina / Clethera – Amelanchier (11)Pinus serotina – Pinus palustris / Osmunda cinnamomea / Dichanthelium ensifolium (6)
2. Pinus palustris woodlands of mesic, silty uplandsPinus palustris /Aristida stricta – Panicum virgatum – Eupatorium rotundifolium (6)
3. Pinus palustris – Kalmia woodlands of clayey slopesPinus palustris / Kalmia – Vaccinium arboreum (4)
4. Pinus palustris mixed hardwood woodlandsPinus palustris – Pinus taeda – Carya pallida / Cornus florida / Aristida stricta (9)
5. Pinus palustris barrensPinus palustris / Quercus laevis / Chrysoma pauciflosculosa (2)
6. Pinus palustris woodlands of xeric uplands and ridge topsPinus palustris / Quercus margarettiae / Clethera – Symplocus (3)Pinus palustris / Quercus marilandica / Vaccinium crassifolium / Aristida stricta (12)Pinus palustris / Quercus laevis / Gaylussacia dumosa – Toxicodendron pubescens (10)Pinus palustris / Quercus laevis / Aristida stricta – Tephrosia virginiana (6)Pinus palustris / Quercus laevis / Aristida stricta – Baptisia cinerea – Stylisma (17)
7. Pinus palustris woodlands of mesic and subxeric sites south of range of Aristida strictaPinus palustris / Quercus laevis / Gaylussacia dumosa / Schizachyrium (13)Pinus palustris / Quercus laevis / Toxicodendron / Andropogon spp.(13)Pinus palustris / Aristida beyrichiana – Schizachyrium – Tephrosia virginiana (6)Pinus palustris / Vaccinium myrtifolium / Schizachyrium – Tephrosia virginiana (11)
8. Pinus palustris woodlands of mesic and subxeric sites within range of Aristida strictaPinus palustris / Aristida stricta – Coreopsis major – Rhexia alifanus (4)Pinus palustris / Quercus marilandica / Aristida stricta – Parthenium integrifolium (14)Pinus palustris / Quercus laevis – Quercus incana / Aristida stricta – Astragalus michauxii (6)Pinus palustris / Quercus laevis – Quercus marilandica / Aristida stricta – Tephrosia virginana (21)

Step 2. Forward selection in linear discriminant analysis to identify predictor variables.
Test with cross validation – Sequentially leave out a plot and look to see if it is correctly classified, and iterate.
Observe the percent of plots correctly classified. Select the lowest number of variables needed to achieve high accuracy.

2 4 6 8 102 12
Number of environmental variables
Perc
ent
corr
ect
pre
dic
tions
to s
eri
es
80
70
60
50
40

- First 5 environmental variables added to the discriminant functions model correctly identified 75% of the plots to vegetation series. Adding more did little to improve accuracy.
- Critical variables were Latitude, Manganese, Phosphorus, Clay, Longitude.
- 4 of 8 series had multiple communities. Percent communities within a series that were correctly classified = 68, 73, 86, 76%.
- Hierarchical approach improved accuracy.
- We are examining whether a regression tree approach might yield higher accuracy.

-2 -1 0 1 2 3
Log Area (m2)
0.0
0.5
1.0
1.5
2.0
Log
Ric
hnes
s
Sand barrens
Dry sandy uplandWet savanna
Mesic silty upland
Step 3. Determine how many species to expect through species-area relations.

For each community, quadratic regression was used to relate the number of recorded species to plot area (m2):
ln(species richness) = b0 + b1*ln(area) + b2*[ln(area)]**2.

Step 4. Select species.
1.Generate a list of all species in type (species pool) with frequency and mean cover values.
2.Randomly order the list
3.Compare species frequency to a random number between 0 & 1, and if the random number is less than the proportion of plots the species is selected.
4.Continue until the number in list of selected species equals the number predicted.

The result is selection of species in proportional to actual occurrence.
This probabilistic occurrence mimics natural processes
In essence two steps:– at broad scale predict by discriminant functions– at fine scale we model variation using random selection
Two improvements possible in a future refined version1 – Select species from functional groups2 – Nested species selection using more than one scale

Example – Savannah River Site (SRS)
- 12,000 ha of the 78,000 ha site fall within the Fall-line Sandhills.
- 16 plots used; 9 from SRS and 7 on adjacent private lands.
- All plots showed some evidence of fire suppression, though 7 showed evidence of recent fire.
- 9 plots contained wiregrass (A. beyrichiana), which suggested no history of cultivation.

Example continued
- 16 times we constructed new discriminant models omitting one focal plot.
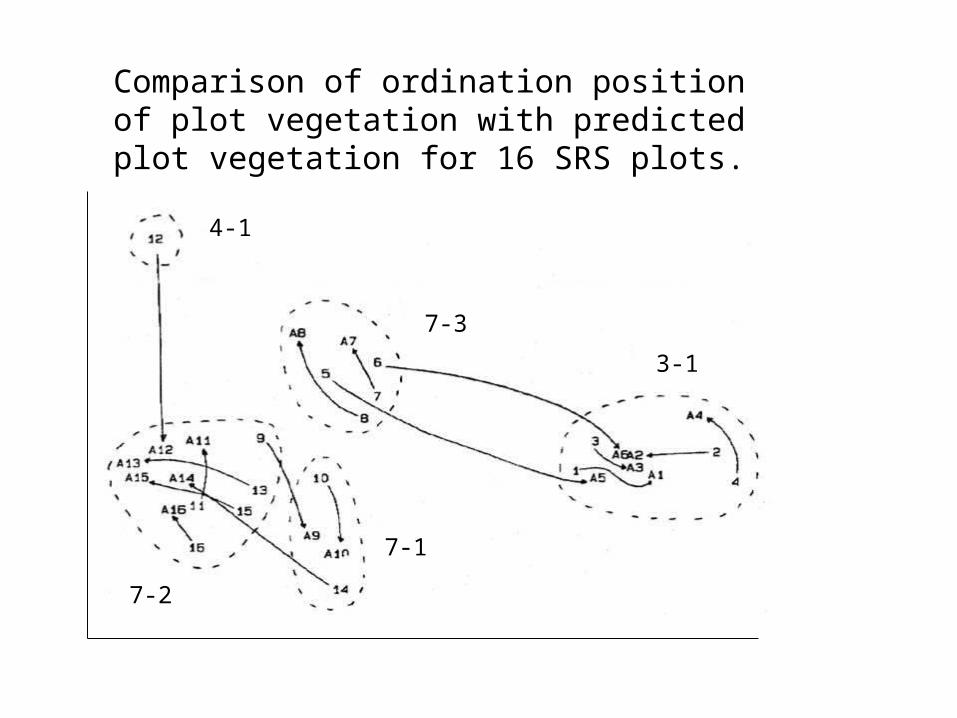
- Reconstructed vegetation at the 16 sites and then ordinated the 32 plots x 213 species using NMDS
- 11 of 16 plots fit well; 3 misclassified to series and 2 to community
4-1
7-3
3-1
7-2
7-1
Comparison of ordination position of plot vegetation with predicted plot vegetation for 16 SRS plots.

Species richness fit expectation well except for cases where the wrong series was predicted.
Plot Area Actual Predict Diff Misclass?(m2) Species Species *=yes
1 300 18 17 -12 200 13 15 +23 400 25 18 -74 100 13 12 -15 1000 64 24 -40 *6 1000 55 21 -34 *7 200 39 42 +38 200 49 42 -79 1000 74 44 -30 *10 1000 56 44 -1211 1000 83 78 -512 500 66 70 +4 *13 1000 69 78 +914 1000 36 78 +42 *15 600 64 72 +816 1000 79 78 -1

Overall strategy:• Identify biogeographic region and obtain
appropriate model,
• Validate ranges of pool of candidate species,
• Divide site into environmentally homogenous areas, stratifying by topography and soil.
• Use models to select species number and composition
Caveats• Method is data-intensive to develop,
• Restoration biologists will need an expert system to apply.