consumer acceptance and quality parameters of the
TRANSCRIPT

foods
Article
Consumer Acceptance and Quality Parameters of theCommercial Olive Oils Manufactured with CultivarsGrown in Galicia (NW Spain)
Sol Zamuz 1 , Laura Purriños 1, Igor Tomasevic 2 , Rubén Domínguez 1 , Mladen Brncic 3,Francisco J. Barba 4 and José M. Lorenzo 1,*
1 Centro Tecnológico de la Carne de Galicia, Parque Tecnológico de Galicia, 32900 Ourense, Spain;[email protected] (S.Z.); [email protected] (L.P.); [email protected] (R.D.)
2 Faculty of Agriculture, Department of Animal Source Food Technology, University of Belgrade, Nemanjina 6,11080 Belgrade, Serbia; [email protected]
3 University of Zagreb, Faculty of Food Technology and Biotechnology, Pierottijeva ulica 6,10000 Zagreb, Croatia; [email protected]
4 Universitat de València, Faculty of Pharmacy, Preventive Medicine and Public Health, Food Science,Toxicology and Forensic Medicine Department, Nutrition and Food Science Area,Avda.Vicent Andrés Estellés, s/n, 46100 Burjassot, València, Spain; [email protected]
* Correspondence: [email protected]; Tel.: +34-988-548-277
Received: 3 March 2020; Accepted: 30 March 2020; Published: 3 April 2020�����������������
Abstract: Mansa and Brava are olive autochthonous cultivars from Galicia, a new olive-growingzone from NW Spanish, from which high-quality extra virgin olive oils (EVOOs) are obtained.The oils obtained as by co-crushing Mansa and Brava olives in different proportions as by blendingwith others olives cultivars have different composition that influence in their sensory quality.The consumer acceptance of commercial oils elaborated with Local Galician cultivars was evaluatedand a quality-mapping of olive oils was created. It was found that the both Local oils had goodphysical-chemical quality parameters. From sensory analysis viewpoint, Local-MB oils presented thehighest intensity values for color, odor, taste, and flavor, and the consumers had a higher acceptanceand preference by Picual, Local-MBPA (60% Mansa and Brava, 25% Picual, and 15% Arbequina andLocal-MB (60% Mansa and 40% Brava) oils. A quality-mapping of olive oils indicate that attributesbetter scored from the consumer are high intensity for color, odor, taste and flavor, and pungent andfloral series, and bitter is rejected by them.
Keywords: Brava; Mansa; EVOO; quality parameters; fatty acids; sensory acceptance;volatile compounds
1. Introduction
Spain ranks first in olive grove area and the main olive-growing zone in terms of production isAndalucía (South Spain) due to the warm and dry climate [1,2]. Although the climate in Galicia (NWSpain) is typically defined as Atlantic climate, there are different areas with Mediterranean climatewhere the best climatic conditions for olive growing are given [3,4]. Galicia has gradually emergedas a new Spanish olive-growing zone [5] and though Arbequina and Picual varieties predominate inplantations, Mansa and Brava are olive autochthonous cultivars (known by producers as Local) fromwhich high-quality extra virgin olive oils (EVOOs) are obtained. The current trend of the olive oilmarket is the production of EVOOs with specificity of origin and particular and differentiated sensory,nutritional, and health characteristics [6].
Foods 2020, 9, 427; doi:10.3390/foods9040427 www.mdpi.com/journal/foods

Foods 2020, 9, 427 2 of 13
The EVOO is highly appreciated by consumers for its nutritional properties and its healthyeffects [7]. Several studies shown that oils obtained as by co-crushing Mansa and Brava olives indifferent proportions (usual practice adopted by elaboration of these oils) as by blending these Localolives with Picual and/or Arbequina olives have differentiated aromatic, fat, and phenolic compositionwhich results in different organoleptic attributes and sensory characteristics influencing the sensoryquality [8–11].
The sensory concept is a multidimensional concept that include both sensory evaluationsperformed by trained experts panel coupled with acceptance and preferences of the consumers [12].The two quality and commercial categories (extra virgin olive oil and virgin olive oil) are establishedby taste panel according to the sensory analysis carried out following official method supported byInternational Olive Council (IOC) [13]. This evaluation takes into account three positive attributesfor olive oils (fruity, bitter and pungent) and absence of five main defects (rancid, musty, winey,metallic, and fusty). However, the rejection of bitterness and pungency is a natural reaction and theseattributes are frequently rejected by consumers, who related this sensory characteristic with poisonousor toxic substances [14]. Thus, in contrast with trained panelist, most of consumers do not relate thesecharacteristics as positive sensorial attributes of olive oil [15]. There are fewer avenues for consumersto become acquainted with expert recommendations which have influence in buying decisions. Thus,acceptance and preference evaluations are very important in the oil industry and are being consideredas analytical tools to evaluate marketing acceptability of new EVOOs.
In this context, the main objective of this study was to evaluate the consumer acceptance ofcommercial EVOOs elaborated with Local Galician cultivars and experimental monovarietal oilelaborated with Mansa cultivar. A second goal was to compare the consumer acceptance of EVOOselaborated with autochthonous Galician cultivars with the consumer acceptance of others commercialmonovarietal oils elaborated with Picual and Arbequina cultivars which are highly appreciated byconsumers. Finally, quality-related parameters were determined in all studied oils to establish therelations between them and the acceptance results and to create the quality-mapping of olive oils fromthe consumer viewpoints.
2. Materials and Methods
2.1. Oil Samples
Three different Local oils elaborated with Galician olives were studied. Two commercial oils,labelled and marketed as EVOOs: 1) elaborated exclusively with Local Galician cultivars (60% Mansaand 40% Brava, named Local-MB) and 2) elaborated by blending Local Galician cultivars with Picualand Arbequina (30% Mansa, 30% Brava, 25% Picual, and 15% Arbequina; named Local-MBPA). Thethird oil that was evaluated was one experimental oil batch elaborated with 100% Mansa cultivar (Man).Olives were grown and harvested in two crop seasons (2017 and 2018) in Quiroga, an area located in thein the valley of River Sil (Lugo province, Galicia, NW Spain). Local-MB, Local-MBPA, and Man batcheswere elaborated following a cold-pressed procedure typically used by local producers and marketedby Ouro de Quiroga, S.L. (Quiroga, Spain) that is used to provide the oil samples. CommercialEVOOs elaborated with 100% Picual (Pic) and with 100% Arbequina (Arb) were purchased at a localsupermarket. Picual EVOO belongs to DOP Sierra de Segura (Jaén, Spain) and Arbequina EVOObelongs to DOP Les Garrigues (Lleida, Spain). Olive oils samples were kept under dark conditions toprotect them from light until they were analyzed.
2.2. Quality-Related Parameters and Fatty Acids Composition in Oil
Free acidity (% oleic acid) and peroxides (meq O2/kg oil) were quality-related physicochemicalparameters determined by analytical methods established in European Commission Regulation [16,17].Fatty acids composition was determined according to the method described by Barros et al. [18].Briefly, 20 milligrams of olive oil were transesterified using sodium methoxide and methanolic solution
Foods 2020, 9, 427 3 of 13
of sulfuric acid. Then, fatty acid methyl esters were separated using hexane. The separation andquantification was carried out using a gas chromatograph (GC-Agilent 7890B; Agilent TechnologiesSpain, S.L., Madrid, Spain) equipped with a flame ionization detector, following the chromatographicconditions described by Barros et al. [18]. The fatty acids amounts were calculated based on the internalstandard technique, using nonadecanoic acid as internal standard (I.S. C19:0; 300 ppm). The results offatty acid profile were expressed as % of total fatty acids, while the sums of saturated, monounsaturated,and polyunsaturated were expressed as mg/g of oil.
2.3. Lipid Oxidation Parameters
The anisidine and TOTOX values were also determined to measure the oil oxidation. Anisidinevalue (AV) was determined using iso-octane following IUPAC method [19]. TOTOX value indicate theoverall oxidation state [20] of the oil and it was calculated according to the formula [21]:
TV = AV + 2 PV (1)
2.4. Volatile Compounds
The extraction of the volatile compounds was performed using solid-phase microextraction(SPME) with an autosampler Pal RTC-120. The oil sample (1 g) was weighed in a 20-mL vial (AgilentTechnologies, Santa Clara, CA, USA) and subsequently screw-capped with a laminated Teflon-rubberdisc. Then, this vial was conditioning at 37 ◦C during 15 min and the extraction process was carriedout at the same temperature during 30 min. At that point, volatile compounds adsorbed into SPMEfiber were desorbed in gas chromatograph inlet and separated, identified, and quantified in a gaschromatograph 7890B GC-System (Agilent Technologies, Santa Clara, CA, USA) equipped witha mass selective detector 5977B MSD (Agilent Technologies), following the method described byDomínguez et al. [22]. The chromatogram integration was done with Agile2 algorithm (MassHunterQuantitative Analysis B.07.01), while peak detection was done with deconvolution. Compoundswere identified by comparing their mass spectra with those contained in the NIST14 library (NationalInstitute of Standards and Technology, Gaithersburg). The compounds were considered as correctlyidentified when their spectra presented a library match factor >85%. After integration, peak detectionand identification of each compound, the extraction ion chromatogram (EIC) from the quantifier ionwas obtained from each peak. The final results were expressed as area units of the EIC × 104 per gramof oil (AU-EIC × 104/g of oil).
2.5. Sensory Evaluation
The sensory tests for the evaluation of olive oils were conducted in the sensory laboratory of theMeat Technology Centre of Galicia (Ourense, Spain) and held in closed individual booths according toRegulation [23], under white light. Samples were analyzed in two sessions (1 per crop season 2017and other 2018) and five samples (1 per batch) were offered to the taster coded with random 3-digitnumber. Water and green apple were used to clean the palate and remove residual flavors. A totalof 70 consumers (42 females and 28 males aged from 25–40 years) took part in the study, and theywere informed about the objectives of the study and the instructions to complete tests by a trainedinterviewer before to begin. Consumers were select on the basis of their availability for the evaluation,interest to participate in the research and moderate preference towards olive oils.
To determinate how the consumers liked or dislike the olive oil samples, the acceptance test wascarried out using a hedonic scale structured in 7-points (1 = dislike very much and 7 = like very much)according to Lago et al. [24] for evaluated the overall liking of each oil. Additionally, the preferencetest [25] was conducted together with acceptance test, using a structured 5-point scale (1 = less favoriteand 5 = most favorite).
Previously at sensory analysis, consumers were asked which sensory attributes were consideredby them to evaluate overall liking of olive oils. The sensorial attributes considered were color, odor,

Foods 2020, 9, 427 4 of 13
taste, and flavor. Thus, either consumer also evaluated the intensity of these sensorial attributes,using a lineal structured scale from 0 (sensation not perceived) to 10 (maximum sensation) following arandomized complete equilibrated block design.
2.6. Statistical Analysis
The differences in quality-related physicochemical parameters, fatty acid profile, and lipidoxidation parameters among different olive oils samples were examined using a one-way ANOVA andDuncan’s test was used to determine significant differences. Statistical significance was given at P≤ 0.05after post hoc comparison. Friedman two-way ANOVA, assuming product and taster as independentfactor, was used to analyze the obtained data of preference test. When a significant effect (P ≤ 0.05) wasfound, LSD was used as a multiple comparison test. Finally, external preference mapping (PREFMAP)was created to relate consumer acceptance, sensorial attributes, physicochemical parameters, and fattyacid and volatile composition of either olive oil samples to stablish a quality-mapping of olive oilsfrom the consumer viewpoints [12,26]. XLSTAT for Windows version 2018 (Addinsoft, Paris, France)was used to analyze data.
3. Results and Discussion
3.1. Quality-Related Indices in Olive Oils: Physicochemical and Fatty Acids Composition
The results obtained for the physicochemical parameters and fatty acids considered asquality-related indices of five studied olive oils allow to classify olive oils within the different categoriesestablished by the European Commission and their values are regulated by European law [16,17].As one would expect, commercial olive oils presented values of free acidity (% oleic acid) and peroxides(meq O2/kg) content was lower that established limit (0.8% and 20 meq O2/kg, respectively) (data notshowed). The obtained values for free acidity in Local-MBPA, Local-MB and Mansa oils were similar tothose found in other oils elaborated with Mansa and Brava cultivars [9,10] and peroxide values werelower. Experimental Mansa oil showed values of 0.31% oleic acid and meq 8.41 O2/kg and thereforealso could be considered as EVOOs according to considered physicochemical parameters.
In the same way, the values of fatty acids of commercial EVOOs were lower that established limitby European law (Table 1).
Table 1. Fatty acids (expressed as % of total fatty acids) of the studied virgin olive oils.
Local-MBPA Local-MB Man Pic Arb EVOOReference *
C14:0 0.02 ± 0.00 0.01 ± 0.00 0.02 ± 0.00 0.01 ± 0.00 0.02 ± 0.00 ≤0.03C16:0 12.72 ± 0.63 b 11.74 ± 0.19 c 13.02 ± 0.02 b 11.29 ± 0.10 c 13.53 ± 0.11 a 7.50–20.00C16:1n-7 0.89 ± 0.009 c 0.74 ± 0.04 d 0.98 ± 0.01 b 0.76 ± 0.01 d 1.03 ± 0.01 a 0.30–3.50C17:0 0.14 ± 0.00 a 0.09 ± 0.00 b 0.14 ± 0.00 a 0.05 ± 0.00 c 0.14 ± 0.00 a
≤0.40C17:1n-7 0.28 ± 0.00 b 0.20 ± 0.01 d 0.36 ± 0.00 a 0.10 ± 0.00 e 0.26 ± 0.00 c
≤0.60C18:0 2.15 ± 0.008 c 2.66 ± 0.03 b 1.94 ± 0.01 d 2.77 ± 0.00 a 1.95 ± 0.00 d 0.50–5.00C18:1n-9 71.79 ± 1.74 bc 73.99 ± 1.89 b 67.07 ± 0.05 d 77.72 ± 0.06 a 69.60 ± 0.09 c 55.00–83.00C18:2n-6 7.92 ± 0.83 c 6.80 ± 1.37 c 11.75 ±0.00 a 3.74 ± 0.01 d 9.21 ± 0.00 b 2.50–21.00C18:3n-3 0.60 ± 0.01 d 0.74 ± 0.04 b 1.03 ± 0.00 a 0.68 ± 0.00 c 0.56 ± 0.00 e
≤1.00C20:0 0.43 ± 0.01 a 0.41 ± 0.03 a 0.35 ± 0.01 b 0.39 ± 0.02 a 0.41 ± 0.00 a
≤0.60C20:1n-9 0.30 ± 0.01 a 0.27 ± 0.01 b 0.25 ± 0.00 c 0.23 ± 0.00 d 0.30 ± 0.00 a
≤0.50C22:0 0.14 ± 0.00 a 0.12 ± 0.00 b 0.10 ± 0.00 c 0.11 ± 0.00 c 0.13 ± 0.00 ab ≤0.20C24:0 0.08 ± 0.02 a 0.06 ± 0.01 a 0.04 ± 0.00 b 0.06 ± 0.00 a 0.07 ± 0.00 a
≤0.20t-oleic isomers n.d. n.d. n.d. n.d. n.d. ≤0.05t-linoleic + t-linolenic n.d. n.d. n.d. n.d. n.d. ≤0.05
* Legally establish ranges (European Union Commission, [16,17]). Values are mean ± standard deviation (n = 3).n.d. = not detected (<LOD). a–d Mean values in the same row with different letters indicate significant differences(P < 0.05). Local-MBPA (60% Mansa and Brava, 25% Picual, and 15% Arbequina); Local-MB (60% Mansa and 40%Brava); Man (100% Mansa cultivar); Pic (100% Picual cultivar); Arb (100% Arbequina cultivar).

Foods 2020, 9, 427 5 of 13
The results obtained to oil elaborated with 100% Mansa cultivar exceed the limit ranked for C18:3n-3(1.03%), so experimental Mansa oil cannot be considered EVOO. The most abundant fatty acids in allolive oils have been C18:1n-9, C16:0, C18:2n-6, and C18:0, as can be observed in literature [9,10,27].According to the statistical analysis, Picual oil showed the highest values (P ≤ 0.05) for C18:1n-9 andC18:0 with values of 77.72% and 2.77%, respectively, and the lowest (P ≤ 0.05) for C16:0 and C18:2n-6with values of 11.29% and 3.74%, respectively. Arbequina oil showed the highest values (13.53%) forC16:0. The highest values for C18:2n-6 were found in Mansa oil (11.75%), which also presented thelowest values (67.07% and 1.94%) for C18:1n-9 and C18:0, respectively. The C18:1n-9 and C18:0 contentof Local-MBPA and Local-MB oils were similar to Picual oil and the C18:2n-6 and C16:0 were similar toArbequina oil, except the C14:0 content of Local-MB oil that was similar to Picual oil.
These results agreed with the others authors who observed that Picual oils have high C18:1n-9content and low C18:2n-6 contents. Arbequina oil shows an opposite composition at Picual oils [28] andLocal oils were intermediate between mentioned varieties, similar to others realized works [9]. Mansaoils presented a surprising high content of C18:3n-3, near 1%, which is characteristic of some olive oilsfrom Moroccan [29]. On the other hand, the obtained results for fatty acids in Mansa oils did not agreewith they showed by Reboredo-Rodríguez et al. [1], being more similar to presented in Brava oils.
In addition, saturated fatty acids (SFA), monounsaturated fatty acids (MUFA), polyunsaturatedfatty acids (PUFA), and four ratios between them (MUFA/PUFA, (MUFA+PUFA)/SFA, LA/LnA, andC18:1n-9/C18:2n-6) were estimated and significant differences (P ≤ 0.05) were observed (Figure 1A,B).
MUFA were the predominant fatty acid group in all olive oils and these compounds are importantdue to its nutritional value and oxidative stability [8]. Picual oils showed the highest concentration ofMUFA (713 mg/g) following Local oils (675 and 657 mg/g in Local-MB and Local-MBPA, respectively),and Mansa oils with the lowest content (602 mg/g). Significant differences (P ≤ 0.001) were observedbetween samples for MUFA. The second fatty acid group were SFA with values of 141 mg/g in Arbequinaoils and 129 mg/g in Picual oils and significant differences (P ≤ 0.01) between studied oils. SFA of Localand Mansa oils were intermediate between the above-mentioned oils. A high content of SFA produce afatty sensation effect in the mouth due to lead an increase of viscosity and persistence [10]. Finally,PUFA also presented significant differences (P ≤ 0.001) between oils; Mansa oil showed the highestvalues (111 mg/g) and Picual oils the lowest. PUFA are used as indicators of oxidation due to doublebonds in the hydrocarbon chain [21] and they are related to healthy benefits.
In this sense, there are various fatty acid indices that are good quality and stability indicatorsof olive oils. All calculated fatty acid indices showed significant differences (P≤0.001) between oils(Figure 1B). Both MUFA/PUFA and C18:1n-9/C18:2n-6 ratios are important parameters and high valuesfavor the resistance to oxidation [10]. Picual following of Local-MB and Local-MBPA samples were theoils with the highest values for MUFA/PUFA and C18:1n-9/C18:2n-6. The ratio (MUFA+PUFA)/SFAwas also higher in Picual and Local-MB oils which reduces the fatty sensation in the mouth, favoringorganoleptic characteristics [8]. Finally, LA/LnA [C18:2n-6 (LA) and C18:3n-3 (LnA) are essentialPUFAs] ratio was related with healthy benefits and a lower value is more desirable in reducing risk ofthe chronic diseases [8]; Picual and Local-MB oils were again the samples with better values. In view ofthe obtained results, Picual and Local-MB oils showed the best quality parameters.

Foods 2020, 9, 427 6 of 13Foods 2020, 9, x FOR PEER REVIEW 6 of 14
Figure 1. Fatty acid composition (A) and fatty acid ratio (B) of the virgin olive oils (VOOs). ** (P ≤
0.01); *** (P ≤ 0.001). a–d Mean values in the same row with different letters indicate significant
differences (P < 0.05). Local‐MBPA (60% Mansa and Brava, 25% Picual, and 15% Arbequina); Local‐
MB (60% Mansa and 40% Brava); Man (100% Mansa cultivar); Pic (100% Picual cultivar); Arb (100%
Arbequina cultivar).
In this sense, there are various fatty acid indices that are good quality and stability indicators of
olive oils. All calculated fatty acid indices showed significant differences (P≤0.001) between oils
(Figure 1B). Both MUFA/PUFA and C18:1n‐9/C18:2n‐6 ratios are important parameters and high
values favor the resistance to oxidation [10]. Picual following of Local‐MB and Local‐MBPA samples
were the oils with the highest values for MUFA/PUFA and C18:1n‐9/C18:2n‐6. The ratio
(MUFA+PUFA)/SFA was also higher in Picual and Local‐MB oils which reduces the fatty sensation in
the mouth, favoring organoleptic characteristics [8]. Finally, LA/LnA [C18:2n‐6 (LA) and C18:3n‐3
(LnA) are essential PUFAs] ratio was related with healthy benefits and a lower value is more desirable
in reducing risk of the chronic diseases [8]; Picual and Local‐MB oils were again the samples with
better values. In view of the obtained results, Picual and Local‐MB oils showed the best quality
parameters.
3.2. Lipid Oxidation Parameters in Olive Oils
Oxidation is a complex series of reactions that could produce rancidity and off flavors and
smells, degrading the quality of oils and a series of breakdown products are produced [30,31]. Due
Figure 1. Fatty acid composition (A) and fatty acid ratio (B) of the virgin olive oils (VOOs). ** (P ≤ 0.01);*** (P ≤ 0.001). a–d Mean values in the same row with different letters indicate significant differences(P < 0.05). Local-MBPA (60% Mansa and Brava, 25% Picual, and 15% Arbequina); Local-MB (60% Mansaand 40% Brava); Man (100% Mansa cultivar); Pic (100% Picual cultivar); Arb (100% Arbequina cultivar).
3.2. Lipid Oxidation Parameters in Olive Oils
Oxidation is a complex series of reactions that could produce rancidity and off flavors and smells,degrading the quality of oils and a series of breakdown products are produced [30,31]. Due to fact,lipid oxidation parameters are also measured in olive oils (Figure 2). The oxidation measure involvesmethods to evaluate primary and secondary breakdown products.
Peroxide values, besides allow classifying olive oils within the commercial categories establishedby the European Commission, are also a good primary oxidation indicator. In general, low peroxidevalues indicate better quality of the oils. The lowest peroxide values were found in Local-MB andLocal-MBPA oils, showed significant differences (P ≤ 0.001). The values were lower than 10 meq O2/kg,the limited values considered as acceptable for sensory attributes [30].

Foods 2020, 9, 427 7 of 13
Foods 2020, 9, x FOR PEER REVIEW 7 of 14
to fact, lipid oxidation parameters are also measured in olive oils (Figure 2). The oxidation measure
involves methods to evaluate primary and secondary breakdown products.
Figure 2. Lipid oxidation parameters of the VOOs. *** (P ≤ 0.001). a–d Mean values in the same row
with different letters indicate significant differences (P < 0.05). Local‐MBPA (60% Mansa and Brava,
25% Picual, and 15% Arbequina); Local‐MB (60% Mansa and 40% Brava); Man (100% Mansa cultivar);
Pic (100% Picual cultivar); Arb (100% Arbequina cultivar).
Peroxide values, besides allow classifying olive oils within the commercial categories established
by the European Commission, are also a good primary oxidation indicator. In general, low peroxide
values indicate better quality of the oils. The lowest peroxide values were found in Local‐MB and
Local‐MBPA oils, showed significant differences (P ≤ 0.001). The values were lower than 10 meq O2/kg,
the limited values considered as acceptable for sensory attributes [30].
p‐Anisidine value measure the formation of secondary breakdown products and in the same
way as peroxide value, low values indicate better quality. In this case, the lowest values were found
in Arbequina and Mansa oil and presented significant differences (P ≤ 0.001). TOTOX value was the
last measured quality indices and indicates an oil’s overall oxidation state, and again low values
indicate better quality. Local‐MB and Local‐MBPA were samples oils with the lowest values and also
presented significant differences (P ≤ 0.001). As can be seen from these results of lipid oxidation
parameters, both Local oils showed a good oxidative stability that involves a good quality. The
different results observed in these oxidation indices could be due to peroxide values, which is a good
way to measure primary oxidation products, and p‐anisidine values is a good to measure secondary
oxidation products.
3.3. Volatile Compounds in Olive Oils
Volatile compounds together with phenolic compounds and fatty acids are responsible of
sensory perceptions (mainly aroma and tactile mouth sensations) and influencing olive oil quality
[9]. Both aroma and mouth sensations cannot be ascribed to a single compound but rather to a
mixture and a single compound can be involved in different aromas and mouth sensations. Thirty‐
three volatile compounds (Table 2) were separated, identified, and grouped into six odorant series
(fruity, floral, grass, wood, fatty, and spicy) and three mouth sensations (sweet, bitter, and pungent).
Figure 2. Lipid oxidation parameters of the VOOs. *** (P ≤ 0.001). a–d Mean values in the same rowwith different letters indicate significant differences (P < 0.05). Local-MBPA (60% Mansa and Brava,25% Picual, and 15% Arbequina); Local-MB (60% Mansa and 40% Brava); Man (100% Mansa cultivar);Pic (100% Picual cultivar); Arb (100% Arbequina cultivar).
p-Anisidine value measure the formation of secondary breakdown products and in the same wayas peroxide value, low values indicate better quality. In this case, the lowest values were found inArbequina and Mansa oil and presented significant differences (P ≤ 0.001). TOTOX value was the lastmeasured quality indices and indicates an oil’s overall oxidation state, and again low values indicatebetter quality. Local-MB and Local-MBPA were samples oils with the lowest values and also presentedsignificant differences (P ≤ 0.001). As can be seen from these results of lipid oxidation parameters, bothLocal oils showed a good oxidative stability that involves a good quality. The different results observedin these oxidation indices could be due to peroxide values, which is a good way to measure primaryoxidation products, and p-anisidine values is a good to measure secondary oxidation products.
3.3. Volatile Compounds in Olive Oils
Volatile compounds together with phenolic compounds and fatty acids are responsible of sensoryperceptions (mainly aroma and tactile mouth sensations) and influencing olive oil quality [9]. Botharoma and mouth sensations cannot be ascribed to a single compound but rather to a mixture anda single compound can be involved in different aromas and mouth sensations. Thirty-three volatilecompounds (Table 2) were separated, identified, and grouped into six odorant series (fruity, floral,grass, wood, fatty, and spicy) and three mouth sensations (sweet, bitter, and pungent).
Table 2. Volatile compounds found in studied VOOs and their aromatic characteristics.
Volatile Compound m/z Sensory Descriptor Odorant Series MouthSensation Reference
Ethyl formate 74 ethereal, green, rose Floral [32]2-Methylpropanal 72 pungent, nutty Spicy Pungent [22]
2-Butanone 72 ethereal, fragrant, pleasant, fruity,mushroom Fruity, Spicy [33]
2-Methyl-3-Buten-2-ol 71 herbal, mushroom Grass, Spicy [32]3-Methylbutanal 58 malty, fruit, acorn-like Fruity [33]2-Methylbutanal 58 malty Fruity [33]1-Penten-3-one 55 green, bitter, pungent, mustard Grass Pungent [11]2-Pentanone 86 ethereal, butter, spiced Spicy, Fatty [32]3-Pentanone 86 olive fruit, sweet Fruity Sweet [11]Acetoin 45 buttery, sweet Fatty Sweet [32]3-Methylbutanol 70 whiskey, woody, sweet Wood Sweet [33]2-Methylbutanol 56 pungent Pungent [33]
Octane 85 Green, minty, herbaceous (rosemary),lime, lemon, woody
Grass, Wood,Spicy [32]

Foods 2020, 9, 427 8 of 13
Table 2. Cont.
Volatile Compound m/z Sensory Descriptor Odorant Series MouthSensation Reference
cis-2-Penten-1-ol 57 olive fruit, sweet, banana Fruity Sweet [11]Hexanal 56 grass, green apple Grass [11]1-Methoxyhexane 45 herbal, floral, lavender Floral [32]Ethyl 2-methylbutirate 102 fruity Fruity [33]
trans-2-Hexenal 98 grass, apple-like, bitter, bitter almond,green Grass, Fruity Bitter [11]
cis-3-Hexen-1-ol 67 leaf, apple, bitter, green grass, herbal Grass, Fruity Bitter [11]1-Hexanol 56 olive fruit, banana, green grass Grass, Fruity [11]Dimethyl sulfide 62 cabbage, garlic, onion Spicy [32]
Heptanal 70 wood, oily, green plant Wood, Fatty,Grass [33]
trans,trans-2,4-Hexadienal 81 green, sweet, fruit, citrus, waxy Grass, Fruity [32]
Methoxymethylbenzene 122 ethereal, green, hyacinth, floral Floral [32]cis-3-Hexenyl acetate 82 green, fruity, banana Grass, Fruity [11]Hexyl acetate 61 grass, olive fruit, sweet Grass, Fruity Sweet [11]b-Ocimene 93 sweet, green Grass Sweet [32]3-Carene 56 pungent odor, fir needles, mushroom Grass Pungent [32]Benzeneacetaldehyde 91 acorn, pungent Grass Pungent [22]
Nonanal 98 citrus-like, waxy, pungent Fatty, Floral,Grass Pungent [22]
Phenylethyl Alcohol 91 floral, sweet Floral Sweet [32]a-Copaene 161 woody, spicy, honey Wood, Spicy [32]
m/z: quantifier ion used in the GC-MS analysis.
Figure 3 shows the contribution of each odorant series and mouth sensation to the sensorial profileof studied olive oils.Foods 2020, 9, x FOR PEER REVIEW 9 of 14
Figure 3. Comparison of odorant series (A) and mouth sensation (B) in virgin olive oils. Local‐MBPA
(60% Mansa and Brava, 25% Picual, and 15% Arbequina); Local‐MB (60% Mansa and 40% Brava); Man
(100% Mansa cultivar); Pic (100% Picual cultivar); Arb (100% Arbequina cultivar).
As can be observed, Local‐MBPA oils could be characterized by fruity, fatty, and sweet series;
Local‐MB by floral and pungent series; Mansa oils by bitter series; Picual oils by floral and pungent
series; and Arbequina oils by fruity, floral, grass, wood, spicy, sweet, and bitter series. Local‐MBPA
oils registered higher volatile compounds content than Local‐MB oils, probably due to enrichment
given by Arbequina cultivar. Studies show that it is possible to discriminate oils according to the
growing region and the cultivar of the olives on the basis of volatile profile [15].
3.4. Sensory Attributes and Consumer Acceptance of Olive Oils
The differences in physical and chemical parameters (fatty acids and volatile compounds) found
in olive oils involve differences in their organoleptic properties which would have an effect on
consumer acceptance. Sensory analysis is very important in the oil industry due to the quality and
commercial oil categories being established by trained taste [13], but acceptance and preference
evaluations are also very important to evaluate acceptability of new olive oils by consumers. The
sensorial attributes considered to evaluate overall liking of olive oils by consumers were color, odor,
taste, and flavor, and the intensity values of these sensorial attributes are showed in Figure 4A. The
four studied attributes showed significant differences (P ≤ 0.001) between olive oils. The Local‐MB
oils presented the highest intensity values for the sensory attributes and Arbequina oils the lowest.
Local‐MBPC and Picual oils have obtained similar scores by color, taste, and flavor.
When the global acceptance was studied (Figure 4B), the consumers had a higher acceptance for
Picual (5.4) following of Local‐MBPA (5.2) and Local‐MB (5.1) oils, but there were not significant
differences (P ≥ 0.05).
0
15
30
45
60
75
90
Fruity Floral Grass Wood Fatty Spicy
Content (AU‐EIC x 104 /g)
Odorant series
Local‐MBPA Local‐MB Man Pic Arb
A)
0
50
100
150
200
250
Sweet Bitter Pungent
Content (AU‐EIC x 104/g)
Mouth sensation
Local‐MBPA Local‐MB Man Pic Arb
B)
Figure 3. Comparison of odorant series (A) and mouth sensation (B) in virgin olive oils. Local-MBPA(60% Mansa and Brava, 25% Picual, and 15% Arbequina); Local-MB (60% Mansa and 40% Brava); Man(100% Mansa cultivar); Pic (100% Picual cultivar); Arb (100% Arbequina cultivar).

Foods 2020, 9, 427 9 of 13
As can be observed, Local-MBPA oils could be characterized by fruity, fatty, and sweet series;Local-MB by floral and pungent series; Mansa oils by bitter series; Picual oils by floral and pungentseries; and Arbequina oils by fruity, floral, grass, wood, spicy, sweet, and bitter series. Local-MBPA oilsregistered higher volatile compounds content than Local-MB oils, probably due to enrichment given byArbequina cultivar. Studies show that it is possible to discriminate oils according to the growing regionand the cultivar of the olives on the basis of volatile profile [15].
3.4. Sensory Attributes and Consumer Acceptance of Olive Oils
The differences in physical and chemical parameters (fatty acids and volatile compounds) found inolive oils involve differences in their organoleptic properties which would have an effect on consumeracceptance. Sensory analysis is very important in the oil industry due to the quality and commercialoil categories being established by trained taste [13], but acceptance and preference evaluations arealso very important to evaluate acceptability of new olive oils by consumers. The sensorial attributesconsidered to evaluate overall liking of olive oils by consumers were color, odor, taste, and flavor, andthe intensity values of these sensorial attributes are showed in Figure 4A. The four studied attributesshowed significant differences (P ≤ 0.001) between olive oils. The Local-MB oils presented the highestintensity values for the sensory attributes and Arbequina oils the lowest. Local-MBPC and Picual oilshave obtained similar scores by color, taste, and flavor.
Foods 2020, 9, x FOR PEER REVIEW 10 of 14
Figure 4. Intensity values obtained to sensorial attributes (A) and global acceptance of VOOs (B). ***
(P ≤ 0.001); acceptance: 1 = dislike very much; 2 = dislike moderately; 3 = dislike slightly; 4 = neither
like nor dislike; 5 = like slightly; 6 = like moderately; 7 = like very much). Local‐MBPA (60% Mansa
and Brava, 25% Picual, and 15% Arbequina); Local‐MB (60% Mansa and 40% Brava); Man (100%
Mansa cultivar); Pic (100% Picual cultivar); Arb (100% Arbequina cultivar).
The same way, total scores of preferences obtained to ranking test (number in brackets in Table
3) showed that Picual, following Local‐MBPA and Local‐MB oils, were the more chosen for the
consumers and Friedman’s test indicated that there were significant differences (P ≤ 0.05) between
olive oils (Ftes t> F = 0.05). The results of the LSD test (Table 3) showed that the olive oils can be grouped
in two groups well differentiated: one group composed by Picual, Local‐MBPA, and Local‐MB oils,
and other group included Arbequina oils. Mansa oils presented significant differences with Picual oils.
Figure 4. Intensity values obtained to sensorial attributes (A) and global acceptance of VOOs (B).*** (P ≤ 0.001); acceptance: 1 = dislike very much; 2 = dislike moderately; 3 = dislike slightly; 4 =
neither like nor dislike; 5 = like slightly; 6 = like moderately; 7 = like very much). Local-MBPA (60%Mansa and Brava, 25% Picual, and 15% Arbequina); Local-MB (60% Mansa and 40% Brava); Man (100%Mansa cultivar); Pic (100% Picual cultivar); Arb (100% Arbequina cultivar).

Foods 2020, 9, 427 10 of 13
When the global acceptance was studied (Figure 4B), the consumers had a higher acceptancefor Picual (5.4) following of Local-MBPA (5.2) and Local-MB (5.1) oils, but there were not significantdifferences (P ≥ 0.05).
The same way, total scores of preferences obtained to ranking test (number in brackets in Table 3)showed that Picual, following Local-MBPA and Local-MB oils, were the more chosen for the consumersand Friedman’s test indicated that there were significant differences (P ≤ 0.05) between olive oils (Ftes t>
F = 0.05). The results of the LSD test (Table 3) showed that the olive oils can be grouped in two groupswell differentiated: one group composed by Picual, Local-MBPA, and Local-MB oils, and other groupincluded Arbequina oils. Mansa oils presented significant differences with Picual oils.
Table 3. Total preference values and LSD results obtained from the studied VOOs.
Sample Most Favorite Sample Least Favorite
Pic(246)
Local-MBPA(220)
Local-MB(216)
Local-MBPA(220)
Local-MB(216)
Man(190)
Man(190)
Arb(178)
Samples in the same row not have significant differences (P > 0.05) and samples in different row show significantdifferences (P ≤ 0.05). Numbers in brackets are
∑score. Local-MBPA (60% Mansa and Brava, 25% Picual, and 15%
Arbequina); Local-MB (60% Mansa and 40% Brava); Man (100% Mansa cultivar); Pic (100% Picual cultivar); Arb(100% Arbequina cultivar).
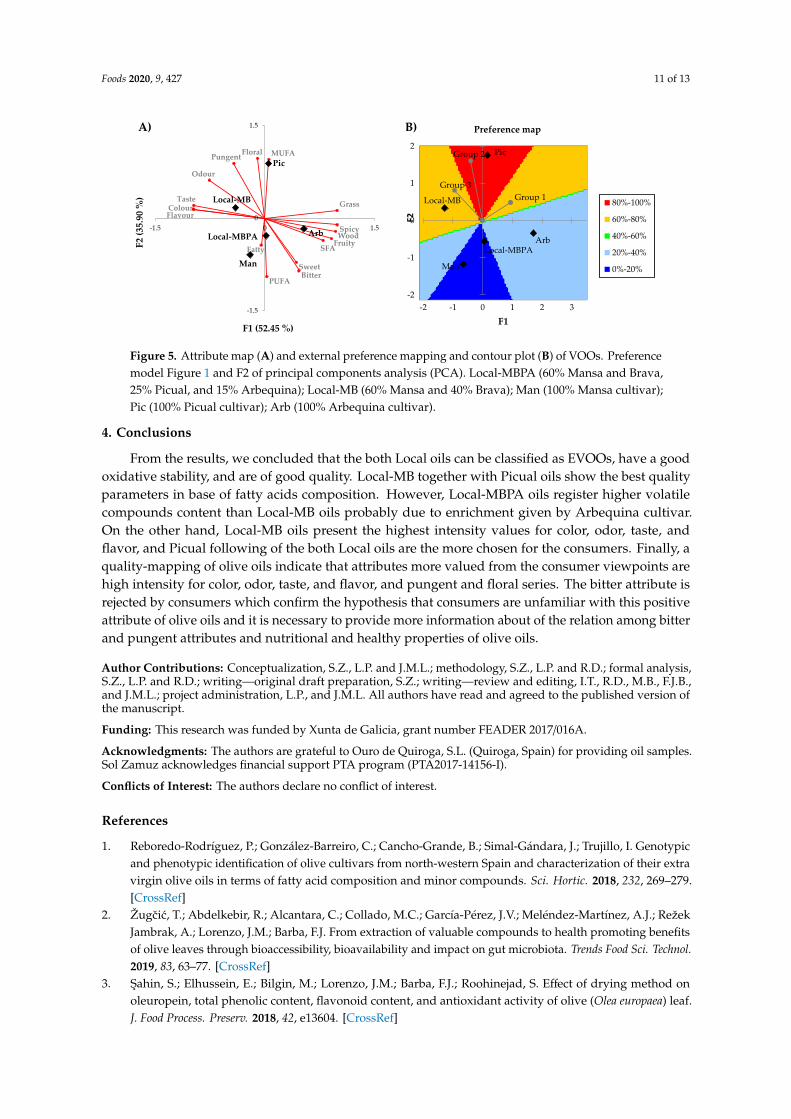
Preference mapping has been used extensively to describe the characteristics that contribute toconsumers’ liking as well as which products they like most or least [25] and internal and externalquality mapping has been applied to investigate sensory quality in EVOOs and uncover the positiveand negative drivers of sensory quality as perceived by experts [12]. In this sense, external preferencemapping (PREFMAP method [34]) was created to relate consumer acceptance, sensorial attributes,fatty acids, and volatile compounds of olive oil samples and to establish a quality-mapping of oliveoils from the consumer viewpoints. The attribute map created previously at PREFMAP using principalcomponents analysis (PCA) applied on instrumental and sensorial variables (Figure 5A) showedthat the first two components accumulated 88.35% of total variation (F1 = 52.45%; F2 = 35.90%).The differences in the first dimension are more important than the differences in the second one.Reis et al. [35] considered that for success of the PCA, F1 and F2 have to accumulate a percentageof variance equal or greater than 70%. On the “heat map” (Figure 5B) it can be observed that allconsumers (grouped in three groups with similar overall linking profiles using hierarchical clusteranalysis (HCA)) had a preference above average in warm colors (yellow and red).
The resulting preference map indicated that vector model was the best, allowing representationof the observations as vectors. The longer the vector indicated better underlying model and theconsumer’s linking increases, the further it moves away from the direction of the vector. The mostappreciated samples were Picual and Local-MB oils which were positioned in the direction of the axisassociated with high values for odor intensity and pungent and floral attributes (Picual oils) and highvalues for taste, color, and flavor intensity (Local-MB oils). As previously reported, bitter was notseen as a pleasant feature by consumers and they rejected this attribute which is considered a positivesensorial attribute of olive oil [15].
Foods 2020, 9, 427 11 of 13
Foods 2020, 9, x FOR PEER REVIEW 11 of 14
Table 3. Total preference values and LSD results obtained from the studied VOOs.
Sample Most Favorite Sample Least Favorite
Pic
(246)
Local-MBPA
(220)
Local-MB
(216)
Local-MBPA
(220)
Local-MB
(216)
Man
(190)
Man
(190)
Arb
(178)
Samples in the same raw not have significant differences (P > 0.05) and samples in different raw show
significant differences (P ≤ 0.05). Numbers in brackets are ∑ score. Local-MBPA (60% Mansa and
Brava, 25% Picual, and 15% Arbequina); Local-MB (60% Mansa and 40% Brava); Man (100% Mansa
cultivar); Pic (100% Picual cultivar); Arb (100% Arbequina cultivar).
Preference mapping has been used extensively to describe the characteristics that contribute to
consumers’ liking as well as which products they like most or least [25] and internal and external
quality mapping has been applied to investigate sensory quality in EVOOs and uncover the positive
and negative drivers of sensory quality as perceived by experts [12]. In this sense, external preference
mapping (PREFMAP method [34]) was created to relate consumer acceptance, sensorial attributes,
fatty acids, and volatile compounds of olive oil samples and to establish a quality-mapping of olive
oils from the consumer viewpoints. The attribute map created previously at PREFMAP using
principal components analysis (PCA) applied on instrumental and sensorial variables (Figure 5A)
showed that the first two components accumulated 88.35% of total variation (F1 = 52.45%; F2 =
35.90%). The differences in the first dimension are more important than the differences in the second
one. Reis et al. [35] considered that for success of the PCA, F1 and F2 have to accumulate a percentage
of variance equal or greater than 70%. On the “heat map” (Figure 5B) it can be observed that all
consumers (grouped in three groups with similar overall linking profiles using hierarchical cluster
analysis (HCA)) had a preference above average in warm colors (yellow and red).
Figure 5. Attribute map (A) and external preference mapping and contour plot (B) of VOOs.
Preference model Figure 1 and F2 of principal components analysis (PCA). Local-MBPA (60% Mansa
and Brava, 25% Picual, and 15% Arbequina); Local-MB (60% Mansa and 40% Brava); Man (100%
Mansa cultivar); Pic (100% Picual cultivar); Arb (100% Arbequina cultivar).
The resulting preference map indicated that vector model was the best, allowing representation
of the observations as vectors. The longer the vector indicated better underlying model and the
consumer’s linking increases, the further it moves away from the direction of the vector. The most
appreciated samples were Picual and Local-MB oils which were positioned in the direction of the
Colour
Odour
Taste
Flavour
SFA
MUFA
PUFA
Fruity
Floral
Grass
Wood
Fatty
Spicy
SweetBitter
Pungent
Local-MBPA
Local-MB
Man
Pic
Arb
-1.5
0
1.5
-1.5 0 1.5
F2
(35.
90 %
)
F1 (52.45 %)
A)
Series1
Series8
Series15
Series22
Series29
Series36
Series43
Series50
Series57
Series64
Series71
Series78
Series85
1 5 9 13172125293337414549535761656973778185899397
F2
F1
Preference map
80%-100%
60%-80%
40%-60%
20%-40%
0%-20%
Local-MBPA
Local-MB
Man
Pic
Arb
Group 1
Group 2
Group 3
-2
-1
0
1
2
-2 -1 0 1 2 3
B)
Figure 5. Attribute map (A) and external preference mapping and contour plot (B) of VOOs. Preferencemodel Figure 1 and F2 of principal components analysis (PCA). Local-MBPA (60% Mansa and Brava,25% Picual, and 15% Arbequina); Local-MB (60% Mansa and 40% Brava); Man (100% Mansa cultivar);Pic (100% Picual cultivar); Arb (100% Arbequina cultivar).
4. Conclusions
From the results, we concluded that the both Local oils can be classified as EVOOs, have a goodoxidative stability, and are of good quality. Local-MB together with Picual oils show the best qualityparameters in base of fatty acids composition. However, Local-MBPA oils register higher volatilecompounds content than Local-MB oils probably due to enrichment given by Arbequina cultivar.On the other hand, Local-MB oils present the highest intensity values for color, odor, taste, andflavor, and Picual following of the both Local oils are the more chosen for the consumers. Finally, aquality-mapping of olive oils indicate that attributes more valued from the consumer viewpoints arehigh intensity for color, odor, taste, and flavor, and pungent and floral series. The bitter attribute isrejected by consumers which confirm the hypothesis that consumers are unfamiliar with this positiveattribute of olive oils and it is necessary to provide more information about of the relation among bitterand pungent attributes and nutritional and healthy properties of olive oils.
Author Contributions: Conceptualization, S.Z., L.P. and J.M.L.; methodology, S.Z., L.P. and R.D.; formal analysis,S.Z., L.P. and R.D.; writing—original draft preparation, S.Z.; writing—review and editing, I.T., R.D., M.B., F.J.B.,and J.M.L.; project administration, L.P., and J.M.L. All authors have read and agreed to the published version ofthe manuscript.
Funding: This research was funded by Xunta de Galicia, grant number FEADER 2017/016A.
Acknowledgments: The authors are grateful to Ouro de Quiroga, S.L. (Quiroga, Spain) for providing oil samples.Sol Zamuz acknowledges financial support PTA program (PTA2017-14156-I).
Conflicts of Interest: The authors declare no conflict of interest.
References
1. Reboredo-Rodríguez, P.; González-Barreiro, C.; Cancho-Grande, B.; Simal-Gándara, J.; Trujillo, I. Genotypicand phenotypic identification of olive cultivars from north-western Spain and characterization of their extravirgin olive oils in terms of fatty acid composition and minor compounds. Sci. Hortic. 2018, 232, 269–279.[CrossRef]
2. Žugcic, T.; Abdelkebir, R.; Alcantara, C.; Collado, M.C.; García-Pérez, J.V.; Meléndez-Martínez, A.J.; RežekJambrak, A.; Lorenzo, J.M.; Barba, F.J. From extraction of valuable compounds to health promoting benefitsof olive leaves through bioaccessibility, bioavailability and impact on gut microbiota. Trends Food Sci. Technol.2019, 83, 63–77. [CrossRef]
3. Sahin, S.; Elhussein, E.; Bilgin, M.; Lorenzo, J.M.; Barba, F.J.; Roohinejad, S. Effect of drying method onoleuropein, total phenolic content, flavonoid content, and antioxidant activity of olive (Olea europaea) leaf.J. Food Process. Preserv. 2018, 42, e13604. [CrossRef]

Foods 2020, 9, 427 12 of 13
4. Sahin, S.; Samli, R.; Birteks, Z.; Tan, A.S.; Barba, F.J.; Chemat, F.; Cravotto, G.; Lorenzo, J.M. Solvent-freemicrowave-assisted extraction of polyphenols from olive tree leaves: Antioxidant and antimicrobial properties.Molecules 2017, 22, 1056. [CrossRef] [PubMed]
5. Espinosa-Sanchez, J. Mito y Realidad del Aceite de Quiroga, Lugo (Spain), 1st ed.; GDR Ribeira Sacra: Ourense,Spain, 2010.
6. Gavahian, M.; Mousavi Khaneghah, A.; Lorenzo, J.M.; Munekata, P.E.S.; Garcia-Mantrana, I.; Collado, M.C.;Meléndez-Martínez, A.J.; Barba, F.J. Health benefits of olive oil and its components: Impacts on gut microbiotaantioxidant activities, and prevention of noncommunicable diseases. Trends Food Sci. Technol. 2019, 88,220–227. [CrossRef]
7. Aparicio, R.; Harwood, J. Manual del Aceite de Oliva, 1st ed.; AMV Ediciones: Madrid, Spain, 2003; ISBN978-84-89922-41-1.
8. Reboredo-Rodríguez, P.; González-Barreiro, C.; Cancho-Grande, B.; Fregapane, G.; Salvador, M.D.;Simal-Gándara, J. Blending Local olive oils with Arbequina or Picual oils produces high quality, distinctiveEVOOs. Eur. J. Lipid Sci. Technol. 2015, 117, 1238–1247. [CrossRef]
9. Reboredo-Rodríguez, P.; González-Barreiro, C.; Cancho-Grande, B.; Valli, E.; Bendini, A.; Gallina Toschi, T.;Simal-Gandara, J. Characterization of virgin olive oils produced with autochthonous Galician varieties.Food Chem. 2016, 212, 162–171. [CrossRef]
10. Reboredo-Rodríguez, P.; González-Barreiro, C.; Cancho-Grande, B.; Fregapane, G.; Salvador, M.D.;Simal-Gándara, J. Characterisation of extra virgin olive oils from Galician autochthonous varieties and theirco-crushings with Arbequina and Picual cv. Food Chem. 2015, 176, 493–503. [CrossRef]
11. Reboredo-Rodríguez, P.; González-Barreiro, C.; Cancho-Grande, B.; Simal-Gándara, J. Concentrations ofaroma compounds and odor activity values of odorant series in different olive cultivars and their oils. J. Agric.Food Chem. 2013, 61, 5252–5259. [CrossRef]
12. Delgado, C.; Guinard, J.X. Internal and external quality mapping as a new approach to the evaluation ofsensory quality - a case study with olive oil. J. Sens. Stud. 2012, 27, 332–343. [CrossRef]
13. IOC/T.20/Doc. No 15/Rev. 10-2018. Method for the Organoleptic Assessment of Virgin Olive Oil.Available online: https://www.internationaloliveoil.org/wp-content/uploads/2019/11/COI-T20-Doc.-15-REV-10-2018-Eng.pdf (accessed on 31 March 2020).
14. Delgado, C.; Guinard, J.X. How do consumer hedonic ratings for extra virgin olive oil relate to quality ratingsby experts and descriptive analysis ratings? Food Qual. Prefer. 2011, 22, 213–225. [CrossRef]
15. Valli, E.; Bendini, A.; Popp, M.; Bongartz, A. Sensory analysis and consumer acceptance of 140 high-qualityextra virgin olive oils. J. Sci. Food Agric. 2014, 94, 2124–2132. [CrossRef] [PubMed]
16. EU Regulation. EU Regulation 2568/1991 Characteristics of Olive Oil and Olive-Residue Oil and on the RelevantMethods Analysis; European Commission: Brussels, Belgium, 1991.
17. European Commission. EU Regulation 2019/1604 Amending Commission Regulation (EEC) No 2568/91 on theCharacteristics of Olive Oil and Olive-Residue Oil and on the Relevant Methods Analysis; European Commission:Brussels, Belgium, 2019.
18. Barros, J.C.; Munekata, P.E.S.; de Carvalho, F.A.L.; Pateiro, M.; Barba, F.J.; Domínguez, R.; Trindade, M.A.;Lorenzo, J.M. Use of tiger nut (Cyperus esculentus L.) oil emulsion as animal fat replacement in beef burgers.Foods 2020, 9, 1–15.
19. IUPAC. Standard Methods for the Analysis of Oils, Fats and Derivatives; Paquot, C., Hutfenne, A., Eds.; BlackwellScientific: London, UK, 1987.
20. Domínguez, R.; Pateiro, M.; Gagaoua, M.; Barba, F.J.; Zhang, W.; Lorenzo, J.M. A comprehensive review onlipid oxidation in meat and meat products. Antioxidants 2019, 8, 429. [CrossRef] [PubMed]
21. Franco, D.; Pateiro, M.; Rodríguez Amado, I.; López Pedrouso, M.; Zapata, C.; Vázquez, J.A.; Lorenzo, J.M.Antioxidant ability of potato (Solanum tuberosum) peel extracts to inhibit soybean oil oxidation. Eur. J. LipidSci. Technol. 2016, 118, 1891–1902. [CrossRef]
22. Domínguez, R.; Purriños, L.; Pérez-Santaescolástica, C.; Pateiro, M.; Barba, F.J.; Tomasevic, I.;Campagnol, P.C.B.; Lorenzo, J.M. Characterization of volatile compounds of dry-cured meat productsusing HS-SPME-GC/MS technique. Food Anal. Methods 2019, 12, 1263–1284. [CrossRef]
23. AENOR. UNE-EN-ISO 8589:2010/A1:2014 Sensory Analysis. General Guidance for the Design of Test Rooms;AENOR: Madrid, Spain, 2014.
Foods 2020, 9, 427 13 of 13
24. Lago, A.M.T.T.; Vidal, A.C.C.C.; Schiassi, M.C.E.V.E.V.; Reis, T.; Pimenta, C.; Pimenta, M.E.S.G.S.G. Influenceof the addition of minced fish on the preparation of fish sausage: Effects on sensory properties. J. Food Sci.2017, 82, 492–499. [CrossRef]
25. AENOR. UNE-EN ISO 8589:2010/Amd 1:2017 Sensory Analysis. Methodology. Ranking; AENOR: Madrid,Spain, 2017.
26. Zamuz, S.; Purriños, L.; Galvez, F.; Zdolec, N.; Muchenje, V.; Barba, F.; Lorenzo, J. Influence of the additionof different origin sources of protein on meat products sensory acceptance. J. Food Process. Preserv. 2019,43, e13940. [CrossRef]
27. Laroussi-Mezghani, S.; Vanloot, P.; Molinet, J.; Dupuy, N.; Hammami, M.; Grati-Kamoun, N.; Artaud, J.Authentication of Tunisian virgin olive oils by chemometric analysis of fatty acid compositions and NIRspectra. Comparison with Maghrebian and French virgin olive oils. Food Chem. 2015, 173, 122–132. [CrossRef]
28. Uceda, M.; Beltrán, G.; Jiménez, A. Las variedades de olivo cultivadas en España, libro II: Variabilidad yselección. In Composición del Aceite; Rallo, L., Barranco, D., Caballero, J., Martín, A., Del Río, C., Tous, J., Eds.;Mundi-Prensa: Madrid, Spain, 2005; pp. 365–372.
29. Angerosa, F.; Campestre, C.; Giasente, L. Analysis and Authentication. In Olive Oil: Chemistry and Technology;Boskou, D., Ed.; American Oil Chemists’ Society: Urbana, IL, USA, 2006; pp. 113–172.
30. Roselló-Soto, E.; Barba, F.J.; Lorenzo, J.M.; Dominguez, R.; Pateiro, M.; Mañes, J.; Moltó, J.C. Evaluating theimpact of supercritical-CO 2 pressure on the recovery and quality of oil from “horchata” by-products: Fattyacid profile, α-tocopherol, phenolic compounds, and lipid oxidation parameters. Food Res. Int. 2019, 120,888–894. [CrossRef]
31. Miller, M. Oxidation of Food Grade Oils; Pant Food Research: Nelson, New Zealand, 2012; Volume 1, pp. 1–2.32. TGSC The Good Scents Company Search Page. Available online: http://www.thegoodscentscompany.com/
search2.html (accessed on 3 March 2020).33. Kalua, C.M.; Allen, M.S.; Bedgood, D.R.; Bishop, A.G.; Prenzler, P.D.; Robards, K. Olive oil volatile compounds,
flavour development and quality: A critical review. Food Chem. 2007, 100, 273–286. [CrossRef]34. Martins, Z.E.; Pinho, O.; Ferreira, I.M.P.L.V.O. Fortification of wheat bread with agroindustry by-products:
Statistical methods for sensory preference evaluation and correlation with color and crumb structure.J. Food Sci. 2017, 82, 2183–2191. [CrossRef] [PubMed]
35. Reis, R.C.; Regazzi, A.J.A.; Carneiro, J.C.S.; Minim, V.P.R. Mapa de preferência. In Análise Sensorial: EstudosCom Consumidores; VPRMinim, Ed.; Editora UFV: Viçosa, Brazil, 2010; pp. 214–257, ISBN 9788572694711.
© 2020 by the authors. Licensee MDPI, Basel, Switzerland. This article is an open accessarticle distributed under the terms and conditions of the Creative Commons Attribution(CC BY) license (http://creativecommons.org/licenses/by/4.0/).