consumer acceptance of genetically modified foods: a
TRANSCRIPT

Consumer Acceptance of Genetically Modified Foods: A Comparison between the US and China
Caiping Zhang Department of Agricultural, Food and Resource Economics, Rutgers University
E-mail: [email protected]
Junfei Bai Department of Agricultural and Resource Economics, Washington State University
E-mail: [email protected]
Jikun Huang Center for Chinese Agricultural Policy, Chinese Academy of Scenice
E-mail: [email protected]
William K. Hallman Food Policy Institute, Rutgers University
E-mail: [email protected]
Carl Pray Department of Agricultural, Food and Resource Economics, Rutgers University
E-mail: [email protected]
Helen L. Aquino Food Policy Institute, Rutgers University
E-mail: [email protected]
Selected Paper prepared for presentation at the American Agricultural Economics Association Annual Meeting, Denver, Colorado, August 1-4, 2004
Copyright 2004 by Zhang et al. All rights reserved. Readers may make verbatim copies of this document for non-commercial purposes by any means, provided that this copyright notice appears on all such copies.
1
Consumer Acceptance of Genetically Modified Foods: A Comparison
between the US and China Abstract: Consumer attitudes towards genetically modified foods (GMFs) play a crucial role in the development of the technology. Both government and food manufacturers of agricultural products in the US and China are optimistic about the potential market for these foods. This paper compares two national consumer surveys conducted in the US and China. To determine if influential factors are driving consumers’ attitudes towards GM plant and animal products in both countries a binary logic model is used. Findings suggest that for the majority of American and Chinese consumers while their overall knowledge of GM food is low, their attitudes toward the technology are generally supportive. Consumers in both countries are more accepting of GM plant products then GM animal products. Interestingly, gender, living place, and awareness of GM foods have similar significant effects for both countries. Introduction:
Consumers’ attitudes towards GM foods will ultimately be the deciding factor in
determining the development of biotechnology for many countries with vast implications
for international trade, particularly for agricultural commodities. A number of consumer
surveys have been conducted in countries around the globe who have adopted the
production of biotechnology crops such as the US, EU, and Canada. And those who have
restrictions on these crops, such as Japan and the Philippines.
Unlike the EU public, that has recently ended its moratorium on the production of
GM crops, American consumers do not exhibit any particular concern over GM foods.
And among all developed countries American consumers are the least apprehensive about
GM foods (Hallman et al., 2003; Chern and Rickertsen, 2003). The U.S. Food and Drug
Administration (FDA) does not require GM foods to be labeled because they know
consumers are not concerned with the process (Vogt and Parish, 1999). Currently
2
American policy seeks to promote the development of GM crops for its agricultural
sector in contrast to other governments such as the EU who impose a more precautionary
approach to policy.
Consumer’s attitudes towards GM foods are also playing an important role for
biotechnology development not only for the major agricultural producing exporting
countries like U.S, but also in countries such as China who are major importers of these
agricultural products.
China has played an increasingly important role as an expanding export market for
US agricultural products. With China’s entry into the WTO, import barriers currently
imposed on many US agricultural products will be dramatically cut, expanding the
potential of US farmers to access a vast market of just over one billion people. The value
of US agricultural products exported to China in fiscal year 2003 was $3.47 billion. This
number has almost doubled from fiscal year 2001 when America exported $1.88 billion
worth of agricultural products to China. The current forecast for American agricultural
exports to China for 2004 is $5.4 billion, a gain of nearly $2 billion from the previous
year (USDA, 2003a). The primary US agricultural commodities accounting for this
healthy increase in exports to China are cotton, while China’s demand for US soybeans
also remains at a record high (USDA 2003b).
It would seem then that the Chinese consumers’ response to GM products is
promising for American exporters of agricultural products. There are a number of studies
that show Chinese consumers have a positive attitude toward GM foods. They include a
3
CCAP1 study (Bai, 2003; Huang et al., 2003) in 11 urban cities in eastern China; an
IMPACT2 study (Li, et al. 2003) in Beijing, and a Nanjing Agricultural University and
University of Kentucky study (Zhong et al. 2003) in Nanjing. Although these studies all
indicate an overall lack of knowledge concerning GM foods for Chinese consumers, they
have found consumer attitudes towards GM products to be generally positive. Li et al.’s
study shows 80% and 74% of 599 respondents are willing to buy GM rice and soybean
oil at the same price as the non-GM ones while these percentages are 74% and 60% of
1,005 samples respectively in Bai study. In Zhong et al. study, although less than half of
the respondents said they were willing to buy GM foods, the percentage of consumers
who think GM foods are not safe was found to be less than 20%.
While both Chinese and American consumers are more willing to accept GM foods
than in other countries, consumer attitudes towards GM foods in China and the US do
vary. Many distinguishing differences are apparent based on particular food consumption
preferences, consumer social-economic condition, and varying cultural background. The
objective of this research is to understand the differences in consumer acceptance of GM
foods in both countries which can aid in a greater understanding of an important issue of
vast importance for trade opportunities between both countries.
Data from two national surveys regarding consumers’ acceptance of GM foods from
each country were drawn from for this study. The survey with Chinese consumers was
conducted in China by the Center for Chinese Agricultural Policy (CCAP), Chinese
Academy of Sciences. The survey of American consumers was conducted in the US by
1 CCAP: Center for Chinese Agricultural Policy, Chinese Academy of Sciences. 2 IMPACT: International Marketing Program for Agricultural Commodities and Trade, Washington State University.

4
the Food Policy Institute (FPI) at Rutgers, the State University of New Jersey in the Fall
2002 . The sample size for the Chinese study was 1,005 and for the US study was 1,101.
As far as we can tell no other studies have been conducted that actually seek to
compare Chinese and American consumers’ acceptance of GM foods. And further, most
of the previous studies with in each country focus on consumers’ acceptance of GM plant
products but ignore consumer acceptance of GM animal products. Therefore, in this
paper, we will pay compare Chinese and American consumers’ attitudes towards GM
plant as well as animal products.
This paper is organized in the following manner: following a literature review, we
carefully describe how the two surveys were conducted and what the sample
demographics differences are. In the following section, comparison and analysis of
consumer understanding and acceptances of GM foods are discussed. To check the main
finding in this section, an empirical model is developed. The main findings and their
implications for the future of biotechnology and trade in biotech products are described
and evaluated in the final section of this paper.
Literature Review:
American consumers’ acceptance of GM foods has received increasing attention over
the past decade as the production of agricultural biotechnology has increased in the US
and products with these ingredients have reached grocery store shelves. Public perception
studies indicate consistently that a majority of American consumers are not aware that
GM foods are available in supermarkets and most American consumers do not realize
that they are currently eating GM foods (Hallman et al., 2003). Nevertheless, studies

5
indicate there are a number of US consumers who are willing to purchase GM foods or
willing to try GM foods under certain conditions (Hallman et al., 2003).
As the US, most consumers in China say they are positive about this new technology
and potential of GM food products that may come to market in the not so distance future
(Bai 2003). New products with direct benefits to consumers, such as longer shelf life or
added nutritional or health benefits, are seen as having a real potential appeal with
consumers. A recent study in China found that more than 60% of Chinese consumers are
willing to consume GM foods if the price is the same as non-GM foods (Bai 2003). A
similar result was found in a study conducted by Li et al. (2003) in Beijing, China.
They found that Chinese consumers are willing to try GM food products, an encouraging
finding for an expanding US export market for these products to China.
Surveys and Samples Description
FPI has conducted the longitudinal tracking of changes in American consumer
attitudes towards food biotechnology in year 2001 and 2003 respectively. The survey
from 2003 is the dataset used for this study. Many questions were retained from FPI 2001
survey and a significant number of new questions were introduced in 2003 survey. The
questionnaire was also designed to ensure direct comparability with several areas of
inquiry incorporated into a 1993 survey of New Jersey residents (Hallman & Metcalfe,
1993) as well as with specific questions drawn from the 2002 Eurobarometer3. Special
attention was paid to both the wording and order of the questions in the survey.
3 The Eurobarometer (INR Europe, 2000) is a broad-based public opinion poll managed by the public opinion analysis unit of the European commission's Directorate-General for Education and Culture. The 1999 survey was administered to 16,082 people in 15 Member States (Belgium, Denmark, Germany, Greece, Spain, France, Ireland, Italy, Luxembourg, Netherlands, Austria, Portugal, Finland, Sweden, and United Kingdom). Of specific interest to this study is the Eurobarometer's focus on European knowledge, attitudes, and expectations of issues related to biotechnology.
6
Significant thought also went into the selection of the appropriate terminology used to
describe the technology, which is the subject of the questionnaire.
A private market research firm, Schulman, Ronca, & Bucuvalas, Inc. (SRBI) was
contracted to conduct this telephone interview. Computer Assisted Telephone Interview
(CATI) software was used to guide the interviewers and automatically prompt
appropriate follow-up questions or skip-patterns. Non-institutionalized United States
adults (18 years and older) were selected from more than 97 million telephone
households in the contiguous 48 United States, using random proportional probability
dialing. A total of 1201 interviews were completed between February 27, 2003 and April
1, 2003.
The survey questionnaire for China was largely based on the FPI 2001 questionnaire
(Hallman, et al., 2002 and 2003, Huang et al., 2003). The survey in China was conducted
face-to-face. Slight adjustments were made to reflect the current availability of GM foods
in China and sources of information that Chinese consumers normally access. CCAP’s
survey in 2002 covered 11 cities in the north and east of China, including 2 large cities, 3
medium-sized cities, and 6 county capital cities. The sample size was 1005. The CCAP
sample used in this study are a sub-set of the Urban Household Income and Expenditure
Survey (UHIE4) conducted by the National Bureau of Statistics of China (NBSC). The
number of households under NBSC’s UHIE survey in selected cities was 2,300 in 2002.
To ensure the quality of data and reduce the selection bias, 15 professional enumerators
from the Beijing branch of NBSC were trained by the researchers from CCAP. The
4 UHIE of NBSC: It covers 226 cities across China with about 250 thousand randomly selected households in 2002. The data collected from this way are the official source of information on the urban income and expenditure in China.

7
CCAP representative and the enumerators met at the scheduled location with selected
respondents. CCAP controlled the sample age ranged from 16 to 80 for more credible
information.
CCAP surveys were conducted in 2 of 6 administrative regions in China, North and
Eastern China, which account for about 40% of the national population and nearly half of
China's urban consumers (Huang et al., 2003). Within North and East China, a stratified
random sampling was used to further choose survey areas from UHIE's sample cities. The
final selected areas include two mega-size cities (Beijing and Shanghai) with nearly 10
million urban population, 3 middle and 6 small sizes of cities. Three middle size cities are
Nanjing of Jiangsu province (a total of 2.9 million population with 2.6 million urban
residents), Jinan of Shangdong province (a total of 2.6 million population with 1.8
million urban residents), and Ningbo of Zhejiang province (a total of 1.3 million
population with 0.8 million urban residents). 6 small cities are Dezhou and Weihai in
Shangdong, Yancheng and Nantong in Jiansu, and Shaoxing and Jinghua in Zhejiang.
The populations in these small cities range from 0.35 to 0.65(or 0.25-0.50 million urban
residents)
Some of the demographic variables in US and China survey have similar statistical
distribution. However, some of the variables are significantly different in both countries.
As we can see from table 1, gender distributions in both countries have very nearly the
same mean value (0.42 and 0.41), which means that both countries have more female
respondents than male respondents. Employment was similar in both countries, mean
value in US is 0.63 and China is 0.66. We can see from Table 1 that income distribution
of the sample have similar mean values although the currency unit is different, US
8
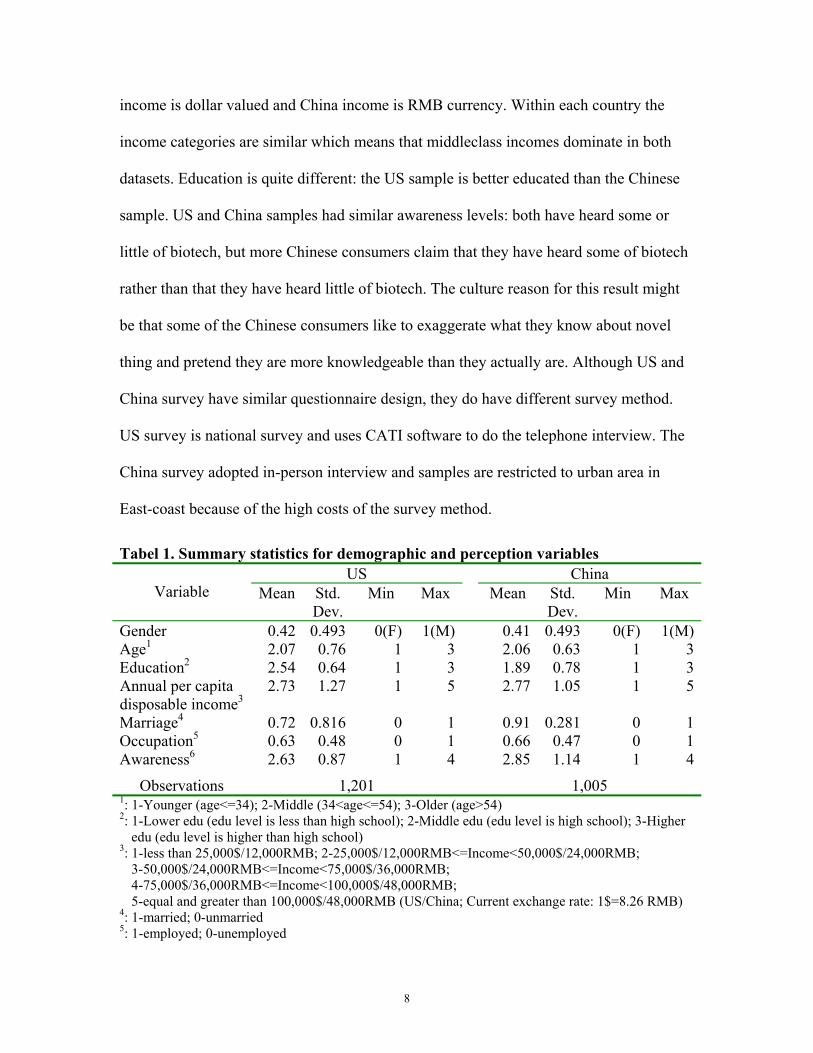
income is dollar valued and China income is RMB currency. Within each country the
income categories are similar which means that middleclass incomes dominate in both
datasets. Education is quite different: the US sample is better educated than the Chinese
sample. US and China samples had similar awareness levels: both have heard some or
little of biotech, but more Chinese consumers claim that they have heard some of biotech
rather than that they have heard little of biotech. The culture reason for this result might
be that some of the Chinese consumers like to exaggerate what they know about novel
thing and pretend they are more knowledgeable than they actually are. Although US and
China survey have similar questionnaire design, they do have different survey method.
US survey is national survey and uses CATI software to do the telephone interview. The
China survey adopted in-person interview and samples are restricted to urban area in
East-coast because of the high costs of the survey method.
Tabel 1. Summary statistics for demographic and perception variables US China
Variable Mean Std. Dev.
Min Max Mean Std. Dev.
Min Max
Gender 0.42 0.493 0(F) 1(M) 0.41 0.493 0(F) 1(M)Age1 2.07 0.76 1 3 2.06 0.63 1 3Education2 2.54 0.64 1 3 1.89 0.78 1 3Annual per capita disposable income3
2.73 1.27 1 5 2.77 1.05 1 5
Marriage4 0.72 0.816 0 1 0.91 0.281 0 1Occupation5 0.63 0.48 0 1 0.66 0.47 0 1Awareness6 2.63 0.87 1 4 2.85 1.14 1 4
Observations 1,201 1,005 1: 1-Younger (age<=34); 2-Middle (34<age<=54); 3-Older (age>54) 2: 1-Lower edu (edu level is less than high school); 2-Middle edu (edu level is high school); 3-Higher
edu (edu level is higher than high school) 3: 1-less than 25,000$/12,000RMB; 2-25,000$/12,000RMB<=Income<50,000$/24,000RMB;
3-50,000$/24,000RMB<=Income<75,000$/36,000RMB; 4-75,000$/36,000RMB<=Income<100,000$/48,000RMB; 5-equal and greater than 100,000$/48,000RMB (US/China; Current exchange rate: 1$=8.26 RMB)
4: 1-married; 0-unmarried 5: 1-employed; 0-unemployed
9
6: 1-never heard biotech; 2- heard a little; 3-heard some; 4-heard a great deal
Consumers’ awareness of biotechnology and GM foods
To measure consumers’ awareness of biotechnology and GM foods, respondents
were asked to state how much do they know about biotechnology, genetic engineering or
genetic modification in the FPI survey. CCAP survey asked same question, but they
separated biotechnology and genetically modified foods into two questions.
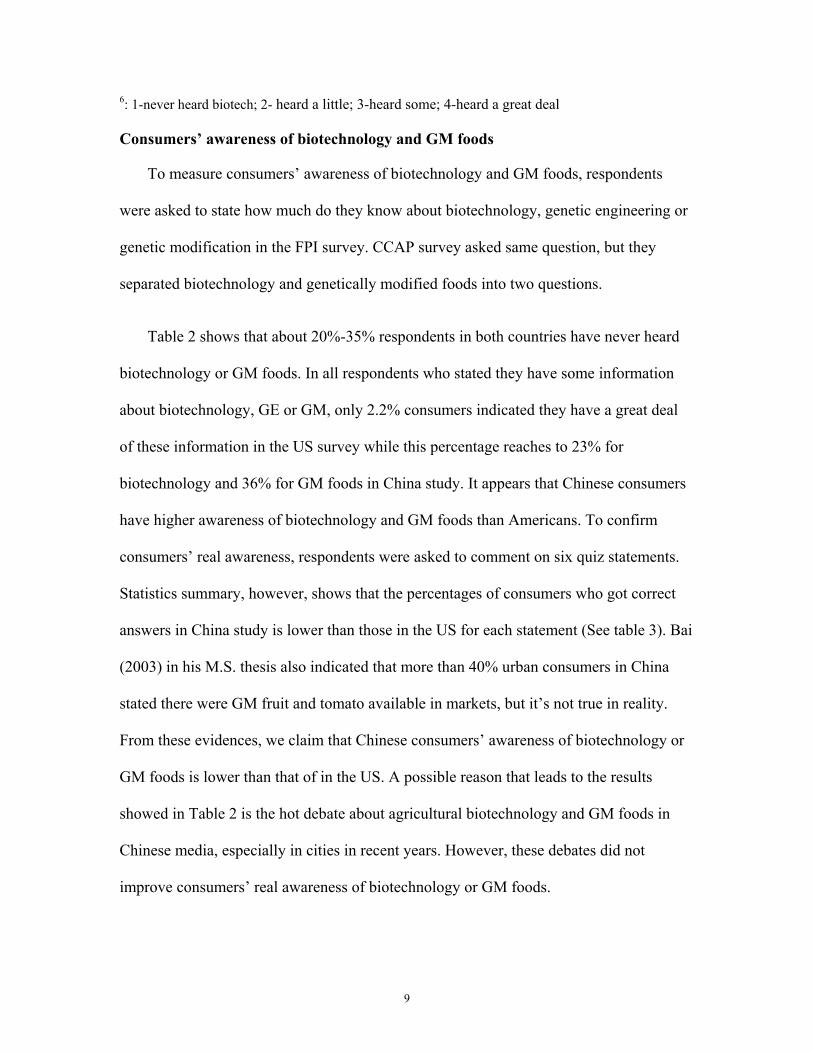
Table 2 shows that about 20%-35% respondents in both countries have never heard
biotechnology or GM foods. In all respondents who stated they have some information
about biotechnology, GE or GM, only 2.2% consumers indicated they have a great deal
of these information in the US survey while this percentage reaches to 23% for
biotechnology and 36% for GM foods in China study. It appears that Chinese consumers
have higher awareness of biotechnology and GM foods than Americans. To confirm
consumers’ real awareness, respondents were asked to comment on six quiz statements.
Statistics summary, however, shows that the percentages of consumers who got correct
answers in China study is lower than those in the US for each statement (See table 3). Bai
(2003) in his M.S. thesis also indicated that more than 40% urban consumers in China
stated there were GM fruit and tomato available in markets, but it’s not true in reality.
From these evidences, we claim that Chinese consumers’ awareness of biotechnology or
GM foods is lower than that of in the US. A possible reason that leads to the results
showed in Table 2 is the hot debate about agricultural biotechnology and GM foods in
Chinese media, especially in cities in recent years. However, these debates did not
improve consumers’ real awareness of biotechnology or GM foods.

10
Table 2. Consumers’ awareness of biotechnology and GM foods (%) Nothing at all Very little A fair amount A great deal The US1 How much do you know about________? Biotech, GE or GM 21.8 54.6 21.2 2.2 China2 How much have you heard_______? Biotech 22.8 5.0 36.5 35.8 GM foods 33.4 9.9 33.8 22.9
Data source: 1, FPI survey in 2003 in the US; 2, CCAP survey in 2002 in China. Table 3. Comparison of Quiz Results between China and the US
Statements Reference China[1] (2002)
US[2]
(2003) There are some bacteria which live on waste water True 93.1 94 The father’s genes determine whether the child is a boy True 58.5 73 Ordinary tomato do not contain genes, while GM tomato do False 43.1 57 If a man eats GM fruits, his genes could be modified as a result False 53.4 69 It is impossible to transfer animal genes to plants. False 26.4 48 Genetically modified tomatowith fish genes would taste “fishy” Fales 29.0 60
Data sources: [1] CCAP survey, 2002; [2] William et al., FPI, Rutgers University, 2003;
Consumers’ acceptance of GM foods
The previous studies indicated that consumers’ acceptance of GM foods is connected
with many factors. These factors include consumers’ personal characteristics, their
socio-economic conditions, different GM products they are facing, and so on (Hallman et
al., 2003; Chern and Rickertsen, 2003; Li et al., 2003; Bai 2003). In this section, the
difference in consumers’ attitudes between GM plant products and GM animal products
will be paid more attention. In addition to simple comparison of statistics summary
results between the US and China, in this section, a binary logistic model will be
developed to estimate the influence of consumers’ socio-economic conditions on their
acceptance of GM foods.
China survey conducted by CCAP in 2002 covers two kinds of GM animal products,

11
livestock and seafood. The statistical results show that there does not exist a difference of
consumers’ response between GM livestock and GM seafood. In Figure 1, near 40% of
1,005 Chinese urban consumers are likely to accept (strongly approve plus somewhat
approve) GM livestock and seafood and one-third of all samples do not think there is any
difference between GM animal products and non-GM ones (See Figure 1).
To measure consumers’ acceptance of GM plants, respondents were asked to state
their attitudes towards edible and inedible GM plant products in China survey. Figure 2
shows that 60% (strongly accept plus somewhat accept) of Chinese urban consumers are
willing to accept inedible GM products such as Bt-cotton. It’s slightly higher than that of
edible products (about 50%). Compared with Figure 1, it’s easy to know that Chinese
consumers are more likely to accept GM plant products than animal products. The fact
that consumers are prefer to plant products is supported another survey results reported in
Figure 3. It’s obvious that Chinese consumers don’t like GM plant products modified
by animal genes than the foods modified other plant genes. About half of 1,005
respondents are willing to accept the GM plant products with plant gene source, and
almost 30 per cent chosen neutral as their attitudes. For the GM plant products with
animal gene, only 30% of all respondents are likely to accept although slightly higher
percentage (35%) consumers chosen neutral than products with plant gene source (See
Figure 3). A possible reason is people usually have a higher risk expectation of animal
products than plant ones because of BSE happened in recent years.

12
he US results are presented in Figure 3. A little bit different from CCAP’s questions,
the optional choices in FPI questionnaire don’t include neutral.. Compared with Figure 1
and Figure 2, the American consumers have almost same attitudes towards GM plant and
animal products as Chinese counterpart, even though their distributions are slightly
different. It’s obvious that the American consumers are more likely to accept Biotech
plant foods than GM animal foods (See Figure 3).
Figure 1. Consumers' Acceptanc between GM Livestock
and GM Seafood in China
0 5
10 15 20 25 30 35 40 45
St r ong Appr ove
SomewhatAppr ove
Neut r al SomewhatDi sappr ove
St r ong Di sappr ove
Don' t know
Data From: CCAP survey,2002
(%)
Li vest ock Seaf ood
Figure 2. Consumers' Acceptance of GM Plant Products by
the Goal Gene Source in China
.
0 5
10 15 20 25 30 35 40 45
St r ongAppr ove
Somewhat Appr ove
Neut r al SomewhatDi sappor ve
St r ongDi sappr ove
Don' t know
Data From: CCAP survey,2002
( %)
Pl ant ' s Ani mal ' s Mi cor be' s

13
Empirical Model
To identify and estimate the influence of consumers’ socio-economic and value
attributes on their acceptance of GM plant and animal products, we develop a binary
logistic model in this section, and develop a profile of likely consumers of GM food
products.
The logistic model is commonly used in the situations with a binary dependent
variable because the asymptotic characteristics of the model constrain the predicted
probabilities between 0 and 1. The logistic model is estimated by the maximum
likelihood method (Gujarati, 1992) because of its consistent and asymptotic efficient
estimator (Pindyck and Rubinfeld, 1997). In this econometric model, iP is assumed as
the probability of consumers’ accepting GM foods. It depends on a matrix of independent
variables ijX , where i denotes the thi respondent, and j denotes the thj
independent variable, which is consisted of consumers’ personal characteristics such as
gender and age, his/her socio-economic variables and so forth. This model can be
formalized as follows:
Figure 3. Consumers' Approvement of Biotech Plant
Animal Foods in theS
0 5
10 15 20 25 30 35 40 45
Strongly approve
Somewhat approve
Somewhatdisapprove
Stronglydisapprove
Don’t Know Refused
Data From: FPI
(%)
Plant Animal

14
( ) ( ) ( )' 1 1 expi i i iP F Z F X Zβ= = = + − (1)
where, ( )iF Z is used to denote the value of logistic cumulative density function (CDF) associated with each possible value of the underlying index iZ , which equals to an unobserved index level or the log odds of choice for the thi observation, and which can be formalized as equation (2) because of 'iXβ is a linear combination of the independent variables in equation (1); 0 1,( , ...... )jβ β β β= is a vector of parameters we will estimate. ( )log i = 1, 2, , n1 ' , i i i i iZ P P Xβ ε= − = + K (2)
In equation (2), 0iX is assumed be equal to (1,1,......,1) ' such that 0β represents the
intercept of equation (2); iε denotes disturbance term.
In such model, the marginal effects of independent variables on iP is given by:
( ) ( ): 1 : 0i ij i ij i ijP x P y x P y x∂ ∂ = = − = (3)
In our empirical analysis, 19 independent variables are used in model. Table 4 lists these
variables and their description and definitions of coding.

15
Table 4. Descriptive statistics of independent variables used in the analysis Variable Description of Variable Mean Std. Dev
COUNTY 1= US; 0 = China 0.51 0.50
URBAN 1= urban area; 0 = otherwise 0.64 0.48
SUBURBAN 1= suburban area; 0 = otherwise 0.25 0.44
RURAL* 1=rural area; 0=otherwise 0.11 0.31
INCOME1 1 = (annual) income less than $25,000/12,000 RMB; 0 = otherwise 0.12 0.32
INCOME2 1 =(annual) income between $25,000 and $49,999/between 12,000 RMB and 23,999 RMB; 0 = otherwise
0.35 0.47
INCOME3 1=(annual) income between $50,000 and $74,999 / 24,000 RMB and35,999 RMB; 0 = otherwise
0.29 0.44
INCOME4 1=(annual) income between $75,000 and $99,999 / 36,000 RMB and47,999 RMB; 0 = otherwise
0.13 0.33
INCOME5* 1=(annual) income between $100,000 and $125,000/48,000 and108,120; 0 = otherwise
0.11 0.30
GENDER 1 = respondent is male; 0 = otherwise 0.42 0.49
YOUNG 1= age less than 34 years; 0 = otherwise 0.21 0.41
MIDDLEAGE 1= age is between 35 and 54 years; 0 = otherwise 0.51 0.50
OLDER* 1= age is 55 years or higher; 0 = otherwise 0.28 0.45
LOWERHIG 1= education less than high school; 0 = otherwise 0.22 0.41
HIGHSCH 1= high school education; 0 = otherwise 0.34 0.47
COLLEGE* 1= some or full four-year college education and above; 0 otherwise 0.44 0.50
MARRIED 1= married; 0=otherwise 0.81 0.63
EMPLOY 1= employed; 0=otherwise 0.67 0.63
HEARBIO 1= never heard of biotech; 2=heard not much; 3=heard some; 4=heard agreat deal
2.74 1.01
MARKETGM 1= Knew there are some GM food in market; 0= otherwise 0.56 0.50
CORRATE 1= correctly answered 1 (out of 6) basic question on biological science;2= correctly answered 2 (out of 6) questions; 3=3 (out of 6); 4=4 (outof 6); 5=5 (out of 6); 6= all correct;
0.54 0.23
ALLERG 1= himself/herself is allergic to some food; 0 = otherwise 0.08 0.27
ELSEALLE 1= other family members are allergic to some food; 0 = otherwise 0.11 0.30 Notes: Asterisk implies that the variable was dropped during estimation to avoid dummy variable trap.
As we know above, CCAP’s study covers three kinds of GM plant products by
different gene resource and two kinds of GM animal foods (livestock and seafood).

16
However, our model only analyzes GM plant products with plant gene source. To merge
Chinese data and the US data together for fitting to analyze by the mentioned binary logic
model, we adjust multi-options of related questions to binary independent. The detail way
we use to merge them is as follows:
The corresponding questions in the FPI study have six options, strongly approve,
somewhat approve, somewhat disapprove, strongly disapprove, don’t know and refused.
We dropped observations of answering “don’t know” and “refused”. Then, we merge
observations with strongly approve and somewhat approve as “1”, meaning these
respondents are willing to accept GM plant or animal products. The other two options
are denoted by “0”, which implies opposite attitude.
Similar with the FPI case, “1” is used to express strongly accept and somewhat
accept while “0” is used to denote strongly oppose and somewhat oppose. We also
dropped the observations with “don’t know” answer. A special problem in CCAP’s data
is how to deal with “neutral” option. The following method was used to figure it out
following related statistics knowledge. Noticed that consumers’ choices are on a scale of
1-5 after we dropped “don’t know” and “refused” observations, where “1” means the
strongest acceptance while “0” is used to express the strongest disapproval. In the first
method, we assume that consumers’ attitudes towards GM foods (or consumers choice
behavior in more general) are subjected to a normality distribution such that the
expectation of this variable should be used to represent neutral. Thus, “neutral” implies
an attitude that more close to “1” if the expectation of this variable is greater than 3. If the
expectation of this variable is less than 3, then “neutral” will be classified into “0”. The
expectations of the variable are 2.1 in plant and 2.5 in animal. Both are less than 3, so

17
“neutral” answers are viewed as “0” in our model. After the above adjustment, 1,997 and
1,873 observations for GM plant and animal foods respectively are reminded to analyze
in our model.
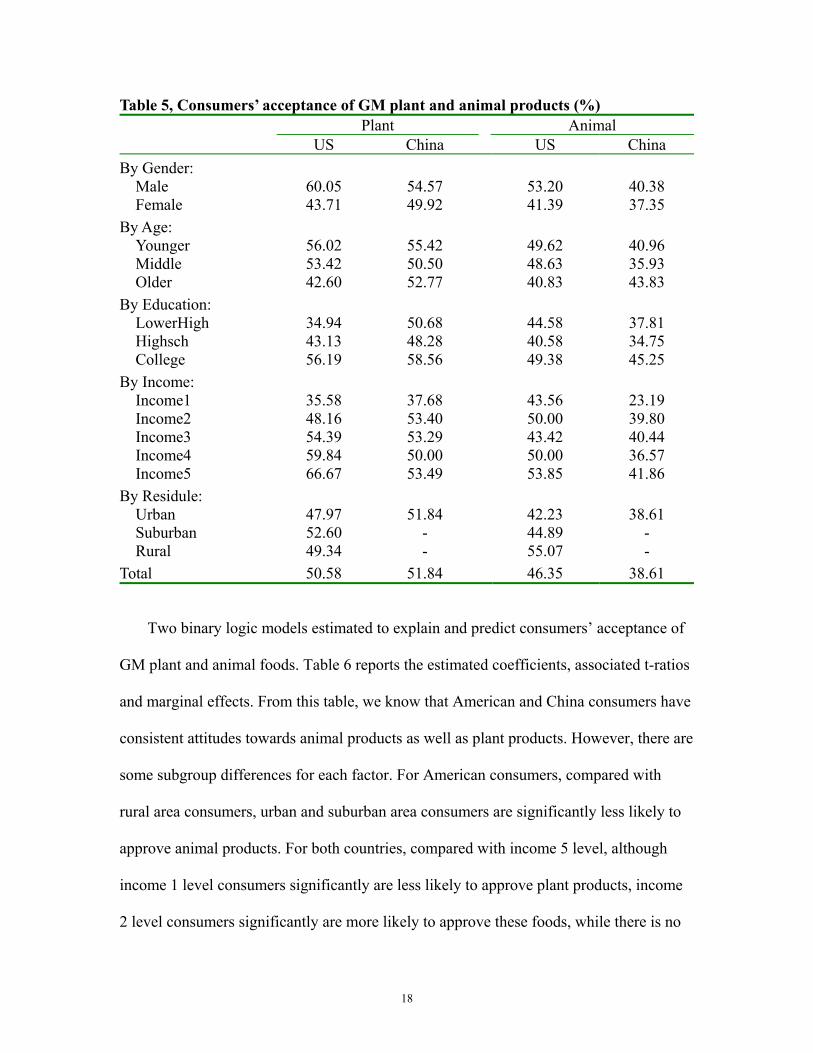
Table 5 reports the relationship between adjusted dependent variable and
respondents’ main characteristics and socio-economic factors, and all the numbers are
consumer approval percent rate for both animal and plant products, we didn’t list out the
disapprove percent. From this table, we know that both the American and Chinese
consumers are more likely to choose GM plant foods. This is consistent what we receive
before adjusted dependent variables. When we look at the approval rate by gender, both
countries male consumers are more likely approve either plant or animal products than
female counterpart; this result is consistent with the previous studies findings. Generally
speaking, American younger consumers are more likely approve both animal and plant
products, but it’s not conclusive in Chinese consumer group. Education factor doesn’t
have consistent increasing or decreasing effects on both countries consumers. For income
factor, we can see that with the income increasing consumer acceptance rate is also
increasing, which indicate that income have positive impact on both countries consumers.
Because all the China samples were located in urban cities, there is no suburban and rural
area approval rate in China. We can see from the table that American rural area
consumers have higher approval rate than urban consumers but less than suburban
consumers. Generally speaking there are no big difference between American and
Chinese consumers approval for animal and plant products, and both countries have
similar factors which have impacts on their approval like gender and income.
18
Table 5, Consumers’ acceptance of GM plant and animal products (%) Plant Animal
US China US China By Gender: Male 60.05 54.57 53.20 40.38 Female 43.71 49.92 41.39 37.35 By Age: Younger 56.02 55.42 49.62 40.96 Middle 53.42 50.50 48.63 35.93 Older 42.60 52.77 40.83 43.83 By Education: LowerHigh 34.94 50.68 44.58 37.81 Highsch 43.13 48.28 40.58 34.75 College 56.19 58.56 49.38 45.25 By Income: Income1 35.58 37.68 43.56 23.19 Income2 48.16 53.40 50.00 39.80 Income3 54.39 53.29 43.42 40.44 Income4 59.84 50.00 50.00 36.57 Income5 66.67 53.49 53.85 41.86 By Residule: Urban 47.97 51.84 42.23 38.61 Suburban 52.60 - 44.89 - Rural 49.34 - 55.07 - Total 50.58 51.84 46.35 38.61
Two binary logic models estimated to explain and predict consumers’ acceptance of
GM plant and animal foods. Table 6 reports the estimated coefficients, associated t-ratios
and marginal effects. From this table, we know that American and China consumers have
consistent attitudes towards animal products as well as plant products. However, there are
some subgroup differences for each factor. For American consumers, compared with
rural area consumers, urban and suburban area consumers are significantly less likely to
approve animal products. For both countries, compared with income 5 level, although
income 1 level consumers significantly are less likely to approve plant products, income
2 level consumers significantly are more likely to approve these foods, while there is no
19
significant impacts on animal products. So income doesn’t have consistent impact on
approval of GM products. Gender has significantly positive effect on approval. That
means male is more likely to approve both plant and animal products in both the US and
China. Age factor doesn’t has significantly impacts on approval. For both countries,
college education consumers are more likely to approve both animal and plant products
than high school education. We use MARKETGM and CORRATE to represent
consumers’ awareness of GM food and biotechnology, model results show that with
higher awareness level consumers are more likely to approve GM products.
The estimated marginal effects of the explanatory variables in our model also are
reported in Table 6. It shows that the people living in urban and suburban areas are 15 per
cent and 12 per cent respectively less likely to accept GM animal products (see the 3rd-4th
rows and last column). The marginal effects of living place are not significant in GM
plants. Consumers with “Income2” (annual disposable income per capita is between
$25,000 and $49,999 in the US and between 12,000 RMB and 23,999 RMB (or between
1,453$ and 2,905$) in China has 5 per cent more likely to accept GM foods, including
plant and animal products. The estimated results of our model also indicate that either
American or Chinese male consumers are 6 per cent more likely to consume these
modified foods. It reflects the difference of risk expected between male and female.
Individuals who have high-school education level are 7% and 8% more likely to accept
GM plant and animal products respectively (see the middle line of table 6). Our estimated
results show that consumers’ real awareness of biotechnology and GM foods has the
largest positive marginal effect (25% in plant and 24% in animal) on their acceptance.
The correct predictions of these two models are listed in the last several lines in Table 6.

20
Table 6. Estimated Results of Consumers’ Approval of GM Plant & Animal products GM Plant Products GM Animal Products
Variables Coefficient t-value Marginal
Effect Coefficient t-value Marginal Effect
CONSTANT -0.363 -1.17 -0.089 -0.134 -0.41 -0.033
COUNTY -0.187 -1.22 -0.046 0.133 0.83 0.033
URBAN -0.270 -1.48 -0.066 -0.589 -3.07*** -0.147
SUBURBAN 0.327 0.20 0.008 -0.480 -2.78*** -0.117
INCOME1 -0.370 -3.17*** -0.09 -1.271 -1.05 -0.032
INCOME2 0.202 2.47*** 0.049 0.120 2.39*** 0.049
INCOME3 0.656 0.77 0.016 -0.435 -0.57 -0.012
INCOME4 0.102 0.91 0.025 -0.220 -0.20 -0.005
GENDER 0.254 2.65*** 0.062 0.136 1.39 0.033
YOUNG 0.718 0.49 0.017 -0.122 -0.81 -0.030
MIDDLEAGE -0.466 -0.39 -0.011 -0.221 -1.77* -0.055
LOWERHIG 0.535 0.04 0.001 0.742 0.05 0.002
HIGHSCH -0.308 -2.75*** -0.072 -0.315 -2.72*** -0.078
MARRIED -0.159 -0.18 -0.004 -0.325 -0.37 -0.008
EMPLOY 0.128 0.14 0.003 0.554 0.62 0.014
HEARBIO 0.367 0.71 0.009 -0.933 -0.18 -0.002
MARKETGM 0.338 3.35*** 0.083 0.191 1.83* 0.047
CORRATE 1.01 4.56*** 0.249 0.961 4.21*** 0.238
ALLERG 0.861 0.51 0.021 -0.195 -1.27 -0.048
ELSEALLE -0.178 -1.19 -0.044 -0.333 -1.85* -0.081
LL -1317.29 -1253.44
Restricted LL -1367.11 -1293.68
Chi Square 99.64 80.49
DF 19 19
McFadden’s R2 0.04 0.03
PREDICTED
ACTUAL 0 1 TOTAL 0 1 TOTAL
0 323 545 868 720 282 1002
1 237 892 1129 480 391 871
TOTAL 560 1437 1997 1200 673 1873 ***denotes significant at 1% significant level; **denotes significant at 5% significant level; *denotes significant at 10% significant level.

21
Conclusions and discussions:
In this paper, we analyzed and compared consumers’ awareness and acceptance of
GM plant and animal products. A binary logic model is developed to identify the
influence of consumers’ personal characteristics and their socio-economic value.
Findings suggest, both the US consumers and China urban consumers have some
awareness of biotechnology and GM foods, but Chinese consumers’ true knowledge of
the topic is lower than those in the US.
Comparably to other countries such as consumers in the EU, both American and
Chinese consumers are more likely to accept these foods. For this model, consumers who
chose “neutral” are indifferent to GM products and thus their purchasing behaviors are
not influenced by their attitudes toward the technology. Instead these consumers
purchasing behaviors may be determined by other factors such as market availability,
shopping environment, or branding. Because these factors are not relative to attitudes
concerning GM products theses consumers can be included in the overall group
consisting of three-quarters of the Chinese consumers who say they are willing to
consume GM foods.
While consumer support for GM animal products are obviously lower than plant
products in both countries, consumers are less likely to accept GM plant products
modified with animal genes than they would be for plant product modified with other
plant genes. A plausible reason for this response by consumers may be due to the variety
of animal diseases epidemics in recent years, like BSE, FMD. These may very well
have altered traditonal consumption behavior because of the increased risk expectation
22
from consuming animal products.
Finally, for both the US and China, consumer attitudes towards GM foods are largely
dependent on their demographic characteristics and socio-economic conditions. Of which,
gender, living place and consumers’ knowledge have significant effects. Male consumers
are more likely to accept these foods than female ones. Individuals who live in urban and
suburban areas are less likely to support the applications of biotechnology in food
production than rural consumers. However, for the time being consumer attitudes don’t
seem to be changing too much, regardless the differences in socio-economic backgrounds
between the US and China.

23
References
Bai, J., (2003) “Consumers Awareness and Attitudes towards Genetically Modified Foods in Urban China”, Master thesis (in Chinese).
Chern W.S. and K. Rickertsen. “Consumer acceptance of GMO: survey results from Japan, Norway, Taiwan, and the United States.” Working paper: AEDE-WP-0026-02. Department of Agricultural, Environmental and Development Economics, The Ohio State University. 2002.
Gujrati, D. 1992. Essentials of Econometrics. New York, NY: McGraw Hill.
Hallman, W., & Metcalfe J. (1993). Public perceptions of agricultural biotechnology: A survey of New Jersey residents. New Brunswick, NJ: Rutgers University's Ecosystem Policy Research Center
Hallman, W.K., A. Adelaja., B. Schilling and J.T. Lang (2002), Consumer Beliefs, Attitudes and Preferences Regarding Agricultural Biotechnology, food Policy Institute Report, Rutgers University, New Brunswick, NJ, USA. http://www.foodpolicyinstitute.org/index.html
Hallman, W.K., W. Hebden, H. Aquino, C. Cuite and J. Lang (2003), Public Perceptions of Genetically Modified Foods: A National Study of American Knowledge and Opinion, Food Policy Institute Report, Rutgers University, New Brunswick, NJ, USA. http://www.foodpolicyinstitute.org/index.html
Hossain F., B. Onyango, A. Adelaja, B. Schilling, and W. Hallman. “Public Perceptions of Biotechnology and Acceptance of Genetically Modified Food.” Food Policy Institute, Rutgers, the State University of New Jersey, 2003.
Huang J., J. Bai, C. Pray and F. Tuan. “Public Awareness, Acceptance of and Willingness to Buy Genetically Modified Foods in China.” Draft version, 2003.
Li, Q., K. Curtis, J. McCluskey and T. Wahl (2002) “Consumer Attitudes Toward Genetically Modified Foods in Beijing, China.” Agbioforum, 5(4): 145-152.
Pindyck, R., and D. Rubinfeld. 1997. Econometric Models and Economic Forecasts. New York, NY: McGraw Hill.
USDA (2003a), China WTO Accession,

24
http://www.fas.usda.gov/itp/china/accession.html.
USDA (2003b), Outlook for U.S. Agricultural Trade, Strong Prices Push Forecast Fiscal 2004 U.S Agricultural Exports Near Record High, Nov. 25, http://www.fas.usda.gov/cmp/outlook/2003/Nov-03/Outlook1103.pdf.
Vogt, D. U. and M. Parish. “Food Biotechnology in the United States: Science, Regulation, and Issues.” CRS Report to Congress, June 2, 1999.
Zhong, F., M. Marchant, Y. Ding and K. Lu (2002) “GM Foods: A Nanjing Case Study of Chinese Consumers’ Awareness and Potential Attitudes.” Agbioforum, 5(4): 136-144.