consumer & retail industry update
TRANSCRIPT

Consumer & Retail Industry UpdateDecember 2020
Harris Williams Consumer Update
CONSUMER AND RETAILINDUSTRY UPDATE │DECEMBER 2020
E U R O P E A N M A R K E T O V E R V I E WHarris Williams is a leading advisor to the Consumer market. Our experience covers a broad range of end markets, industries, and business models. This particular report focuses on trends and metrics in the following areas:
Consumer Durables Consumer Services Footwear, Apparel, and Accessories Franchise Platforms Internet Retail Health & Fitness Home Furnishings Household Goods Infant and Juvenile Products Jewelry, Gifts, and Collectibles Omni / Multi-Channel Brands Outdoor and Lifestyle Personal Care Products Pet Care Specialty Retailing
Contacts
Edward ArkusManaging [email protected]+44 207 518 8905
Will BainManaging [email protected]+44 207 518 8906
Corey BenjaminManaging [email protected]+1 (804) 932-1342
Ryan BudlongManaging Director [email protected]+1 (415) 217-3409
Kelly McPhilliamyManaging Director [email protected]+1 (804) 915-0114
John NeunerManaging [email protected]+1 (804) 915-0125
Brent SpillerManaging [email protected]+1 (804) 915-0183
Zach [email protected] +1 (415) 217-3429
Andreas PothDirector [email protected]+49 69 3650638 2
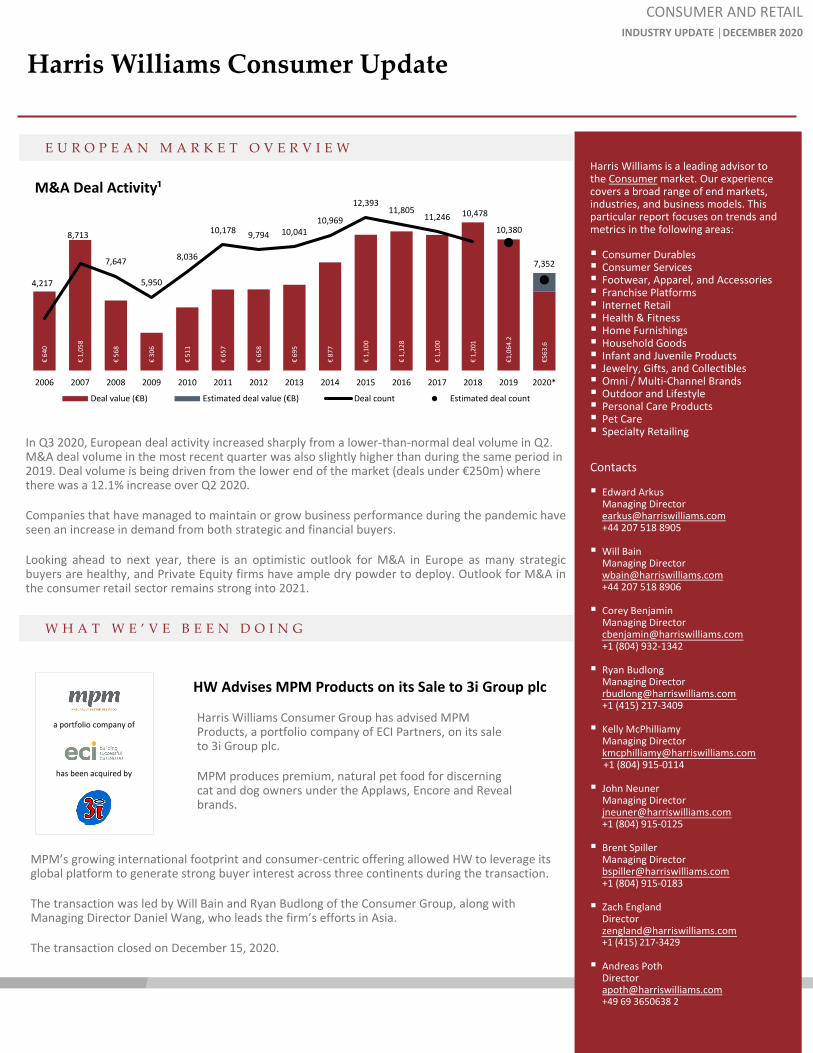
In Q3 2020, European deal activity increased sharply from a lower-than-normal deal volume in Q2. M&A deal volume in the most recent quarter was also slightly higher than during the same period in 2019. Deal volume is being driven from the lower end of the market (deals under €250m) where there was a 12.1% increase over Q2 2020.
Companies that have managed to maintain or grow business performance during the pandemic have seen an increase in demand from both strategic and financial buyers.
Looking ahead to next year, there is an optimistic outlook for M&A in Europe as many strategic buyers are healthy, and Private Equity firms have ample dry powder to deploy. Outlook for M&A in the consumer retail sector remains strong into 2021.
M&A Deal Activity¹
€ 64
0
€ 1,
058
€ 56
8
€ 30
6
€ 51
1
€ 65
7
€ 65
8
€ 69
5
€ 87
7
€ 1,
100
€ 1,
128
€ 1,
100
€ 1,
201
€1,0
64.2
€563
.6
4,217
8,713
7,647
5,950
8,036
10,178 9,794 10,04110,969
12,39311,805
11,246 10,478
10,380
7,352
2006 2007 2008 2009 2010 2011 2012 2013 2014 2015 2016 2017 2018 2019 2020*
Deal value (€B) Estimated deal value (€B) Deal count Estimated deal count
Harris Williams Consumer Group has advised MPM Products, a portfolio company of ECI Partners, on its sale to 3i Group plc.
MPM produces premium, natural pet food for discerning cat and dog owners under the Applaws, Encore and Reveal brands.
a portfolio company of
MPM’s growing international footprint and consumer-centric offering allowed HW to leverage its global platform to generate strong buyer interest across three continents during the transaction.
The transaction was led by Will Bain and Ryan Budlong of the Consumer Group, along with Managing Director Daniel Wang, who leads the firm’s efforts in Asia.
The transaction closed on December 15, 2020.
HW Advises MPM Products on its Sale to 3i Group plc
has been acquired by
W H A T W E ’ V E B E E N D O I N G
Public Markets Overview
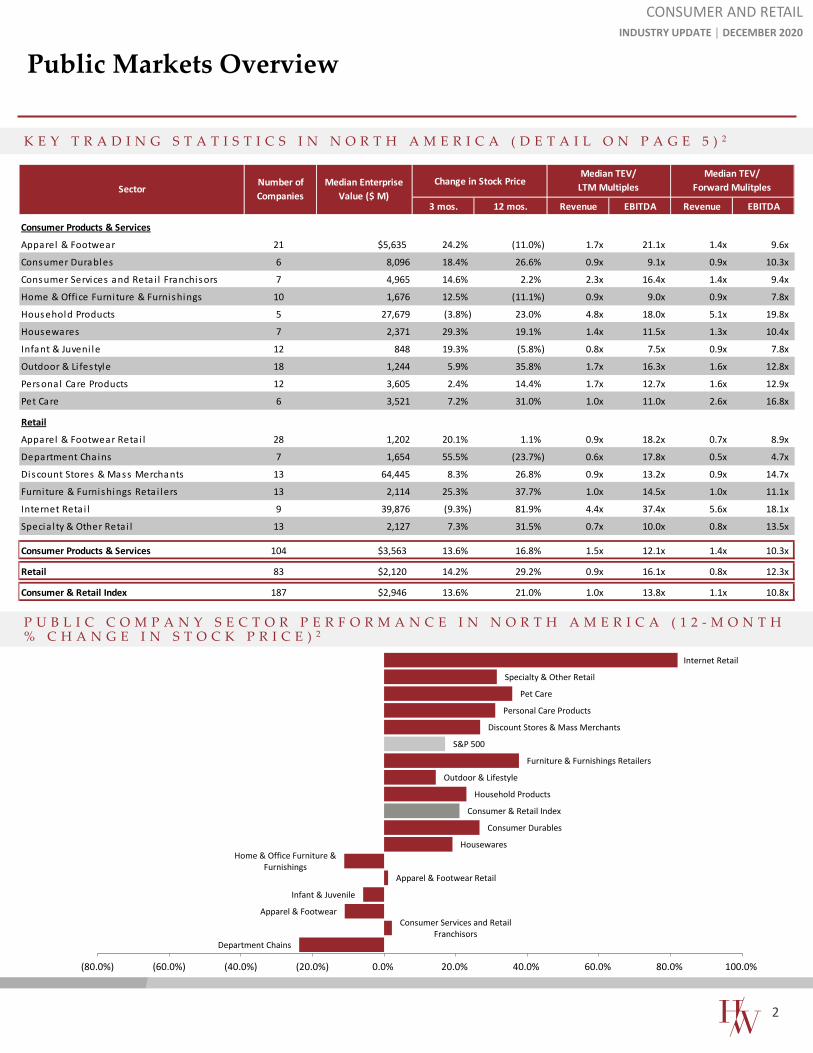
P U B L I C C O M P A N Y S E C T O R P E R F O R M A N C E I N N O R T H A M E R I C A ( 1 2 - M O N T H% C H A N G E I N S T O C K P R I C E ) 2
CONSUMER AND RETAILINDUSTRY UPDATE │ DECEMBER 2020
K E Y T R A D I N G S T A T I S T I C S I N N O R T H A M E R I C A ( D E T A I L O N P A G E 5 ) 2
Department Chains
Consumer Services and Retail Franchisors
Apparel & Footwear
Infant & Juvenile
Apparel & Footwear Retail
Home & Office Furniture & Furnishings
Housewares
Consumer Durables
Consumer & Retail Index
Household Products
Outdoor & Lifestyle
Furniture & Furnishings Retailers
S&P 500
Discount Stores & Mass Merchants
Personal Care Products
Pet Care
Specialty & Other Retail
Internet Retail
(80.0%) (60.0%) (40.0%) (20.0%) 0.0% 20.0% 40.0% 60.0% 80.0% 100.0%
Change in Stock Price
3 mos. 12 mos. Revenue EBITDA Revenue EBITDA
Consumer Products & Services
Apparel & Footwear 21 $5,635 24.2% (11.0%) 1.7x 21.1x 1.4x 9.6x
Consumer Durables 6 8,096 18.4% 26.6% 0.9x 9.1x 0.9x 10.3x
Consumer Services and Reta i l Franchisors 7 4,965 14.6% 2.2% 2.3x 16.4x 1.4x 9.4x
Home & Office Furni ture & Furnishings 10 1,676 12.5% (11.1%) 0.9x 9.0x 0.9x 7.8x
Household Products 5 27,679 (3.8%) 23.0% 4.8x 18.0x 5.1x 19.8x
Housewares 7 2,371 29.3% 19.1% 1.4x 11.5x 1.3x 10.4x
Infant & Juveni le 12 848 19.3% (5.8%) 0.8x 7.5x 0.9x 7.8x
Outdoor & Li festyle 18 1,244 5.9% 35.8% 1.7x 16.3x 1.6x 12.8x
Personal Care Products 12 3,605 2.4% 14.4% 1.7x 12.7x 1.6x 12.9x
Pet Care 6 3,521 7.2% 31.0% 1.0x 11.0x 2.6x 16.8x
Retail
Apparel & Footwear Reta i l 28 1,202 20.1% 1.1% 0.9x 18.2x 0.7x 8.9x
Department Chains 7 1,654 55.5% (23.7%) 0.6x 17.8x 0.5x 4.7x
Discount Stores & Mass Merchants 13 64,445 8.3% 26.8% 0.9x 13.2x 0.9x 14.7x
Furni ture & Furnishings Reta i lers 13 2,114 25.3% 37.7% 1.0x 14.5x 1.0x 11.1x
Internet Reta i l 9 39,876 (9.3%) 81.9% 4.4x 37.4x 5.6x 18.1x
Specia l ty & Other Reta i l 13 2,127 7.3% 31.5% 0.7x 10.0x 0.8x 13.5x
Consumer Products & Services 104 $3,563 13.6% 16.8% 1.5x 12.1x 1.4x 10.3x
Retail 83 $2,120 14.2% 29.2% 0.9x 16.1x 0.8x 12.3x
Consumer & Retail Index 187 $2,946 13.6% 21.0% 1.0x 13.8x 1.1x 10.8x
SectorNumber of Companies
Median Enterprise Value ($ M)
Median TEV/Forward Mulitples
Median TEV/LTM Multiples
2
Public Markets Overview
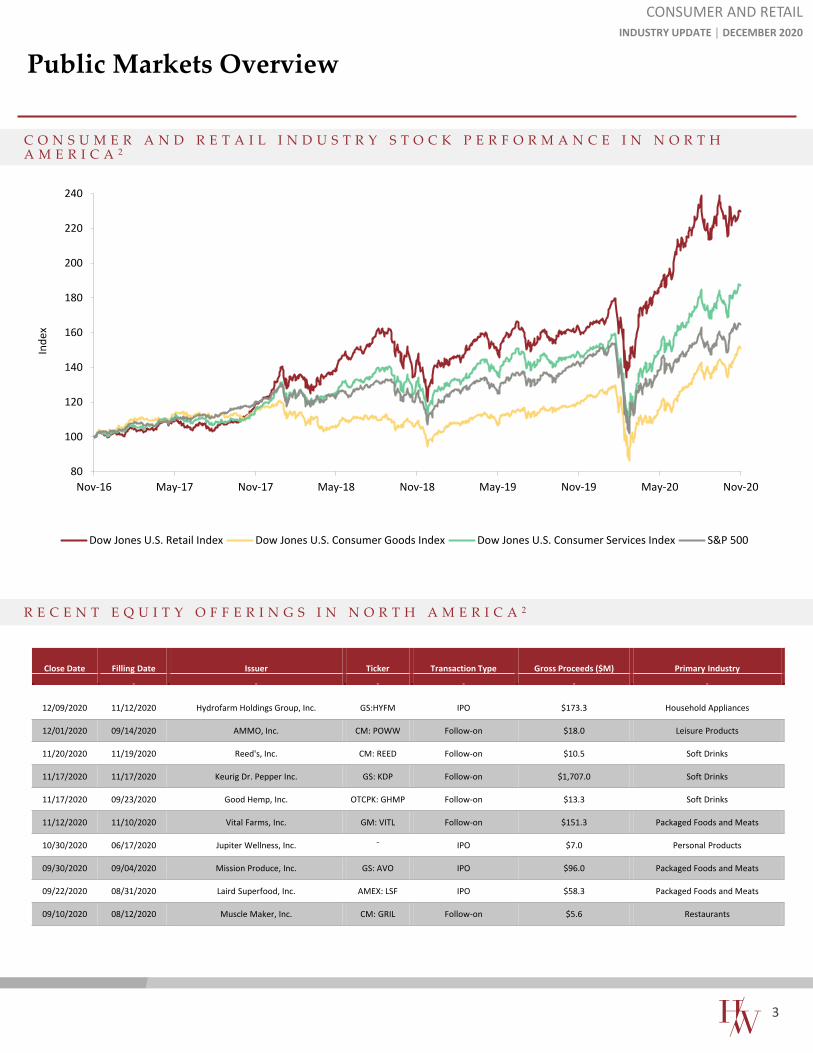
C O N S U M E R A N D R E T A I L I N D U S T R Y S T O C K P E R F O R M A N C E I N N O R T HA M E R I C A 2
R E C E N T E Q U I T Y O F F E R I N G S I N N O R T H A M E R I C A 2
CONSUMER AND RETAILINDUSTRY UPDATE │ DECEMBER 2020
80
100
120
140
160
180
200
220
240
Nov-16 May-17 Nov-17 May-18 Nov-18 May-19 Nov-19 May-20 Nov-20
Inde
x
Dow Jones U.S. Retail Index Dow Jones U.S. Consumer Goods Index Dow Jones U.S. Consumer Services Index S&P 500
Close Date Filling Date Issuer Ticker Transaction Type Gross Proceeds ($M) Primary Industry
12/09/2020 11/12/2020 Hydrofarm Holdings Group, Inc. GS:HYFM IPO $173.3 Household Appliances
12/01/2020 09/14/2020 AMMO, Inc. CM: POWW Follow-on $18.0 Leisure Products
11/20/2020 11/19/2020 Reed's, Inc. CM: REED Follow-on $10.5 Soft Drinks
11/17/2020 11/17/2020 Keurig Dr. Pepper Inc. GS: KDP Follow-on $1,707.0 Soft Drinks
11/17/2020 09/23/2020 Good Hemp, Inc. OTCPK: GHMP Follow-on $13.3 Soft Drinks
11/12/2020 11/10/2020 Vital Farms, Inc. GM: VITL Follow-on $151.3 Packaged Foods and Meats
10/30/2020 06/17/2020 Jupiter Wellness, Inc. ¯ IPO $7.0 Personal Products
09/30/2020 09/04/2020 Mission Produce, Inc. GS: AVO IPO $96.0 Packaged Foods and Meats
09/22/2020 08/31/2020 Laird Superfood, Inc. AMEX: LSF IPO $58.3 Packaged Foods and Meats
09/10/2020 08/12/2020 Muscle Maker, Inc. CM: GRIL Follow-on $5.6 Restaurants
3
M&A Overview
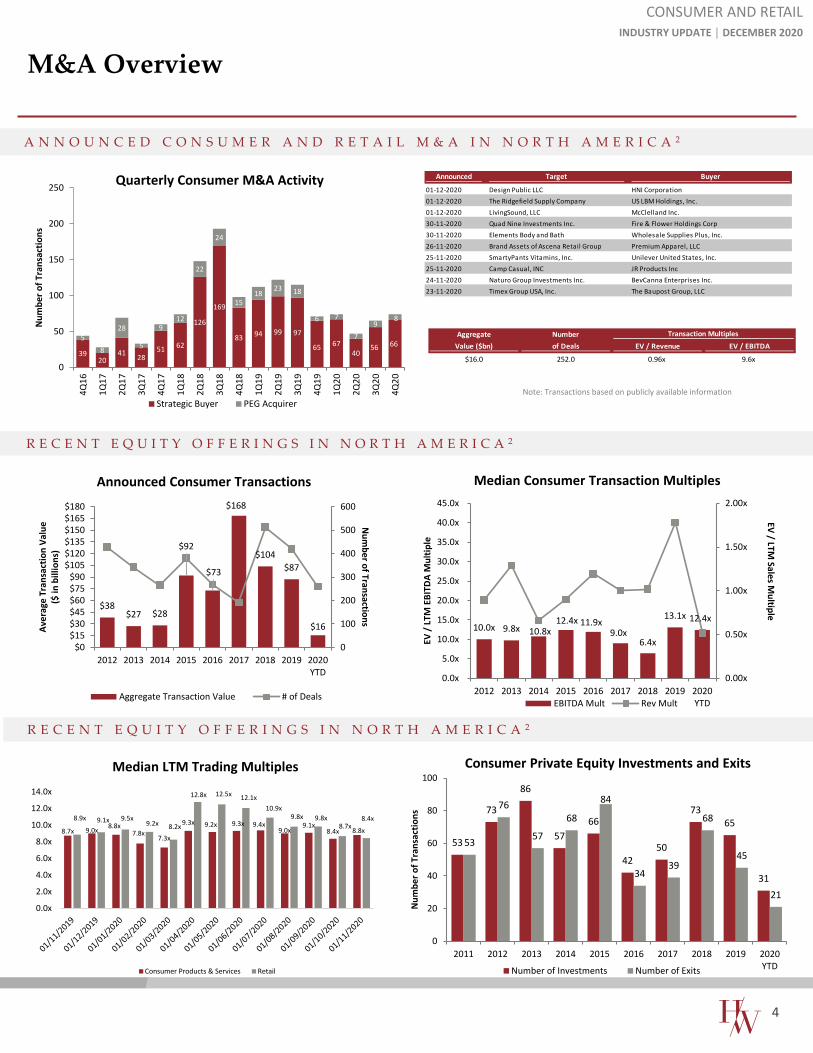
A N N O U N C E D C O N S U M E R A N D R E T A I L M & A I N N O R T H A M E R I C A 2
R E C E N T E Q U I T Y O F F E R I N G S I N N O R T H A M E R I C A 2
CONSUMER AND RETAILINDUSTRY UPDATE │ DECEMBER 2020
Note: Transactions based on publicly available information
R E C E N T E Q U I T Y O F F E R I N G S I N N O R T H A M E R I C A 2
3920
41 2851 62
126
169
83 94 99 97
65 6740
56 665
8
28
5
912
22
24
1518
23 18
6 7
79
8
0
50
100
150
200
250
4Q16
1Q17
2Q17
3Q17
4Q17
1Q18
2Q18
3Q18
4Q18
1Q19
2Q19
3Q19
4Q19
1Q20
2Q20
3Q20
4Q20
Num
ber o
f Tra
nsac
tions
Quarterly Consumer M&A Activity
Strategic Buyer PEG Acquirer
Announced Target Buyer
01-12-2020 Design Public LLC HNI Corporation01-12-2020 The Ridgefield Supply Company US LBM Holdings, Inc.01-12-2020 LivingSound, LLC McClelland Inc.30-11-2020 Quad Nine Investments Inc. Fire & Flower Holdings Corp30-11-2020 Elements Body and Bath Wholesale Supplies Plus, Inc.26-11-2020 Brand Assets of Ascena Retail Group Premium Apparel, LLC25-11-2020 SmartyPants Vitamins, Inc. Unilever United States, Inc.25-11-2020 Camp Casual, INC JR Products Inc24-11-2020 Naturo Group Investments Inc. BevCanna Enterprises Inc.23-11-2020 Timex Group USA, Inc. The Baupost Group, LLC
Aggregate Number Transaction Multiples
Value ($bn) of Deals EV / Revenue EV / EBITDA
$16.0 252.0 0.96x 9.6x
$38$27 $28
$92
$73
$168
$104$87
$16
0
100
200
300
400
500
600
$0$15$30$45$60$75$90
$105$120$135$150$165$180
2012 2013 2014 2015 2016 2017 2018 2019 2020YTD
Num
ber of Transactions
Aver
age
Tran
sact
ion
Valu
e ($
in b
illio
ns)
Announced Consumer Transactions
Aggregate Transaction Value # of Deals
10.0x 9.8x 10.8x 12.4x 11.9x
9.0x 6.4x
13.1x 12.4x
0.00x
0.50x
1.00x
1.50x
2.00x
0.0x
5.0x
10.0x
15.0x
20.0x
25.0x
30.0x
35.0x
40.0x
45.0x
2012 2013 2014 2015 2016 2017 2018 2019 2020YTD
EV / LTM Sales M
ultiple
EV /
LTM
EBI
TDA
Mul
tiple
Median Consumer Transaction Multiples
EBITDA Mult Rev Mult
53
73
86
5766
4250
7365
31
53
76
57
68
84
3439
68
45
21
0
20
40
60
80
100
2011 2012 2013 2014 2015 2016 2017 2018 2019 2020YTD
Num
ber o
f Tra
nsac
tions
Consumer Private Equity Investments and Exits
Number of Investments Number of Exits
8.7x 9.0x 8.8x7.8x
7.3x
9.3x 9.2x 9.3x 9.4x9.0x
9.1x8.4x 8.8x
8.9x 9.1x 9.5x9.2x 8.2x
12.8x 12.5x 12.1x10.9x
9.8x 9.8x8.7x
8.4x
0.0x
2.0x
4.0x
6.0x
8.0x
10.0x
12.0x
14.0x
Median LTM Trading Multiples
Consumer Products & Services Retail
4
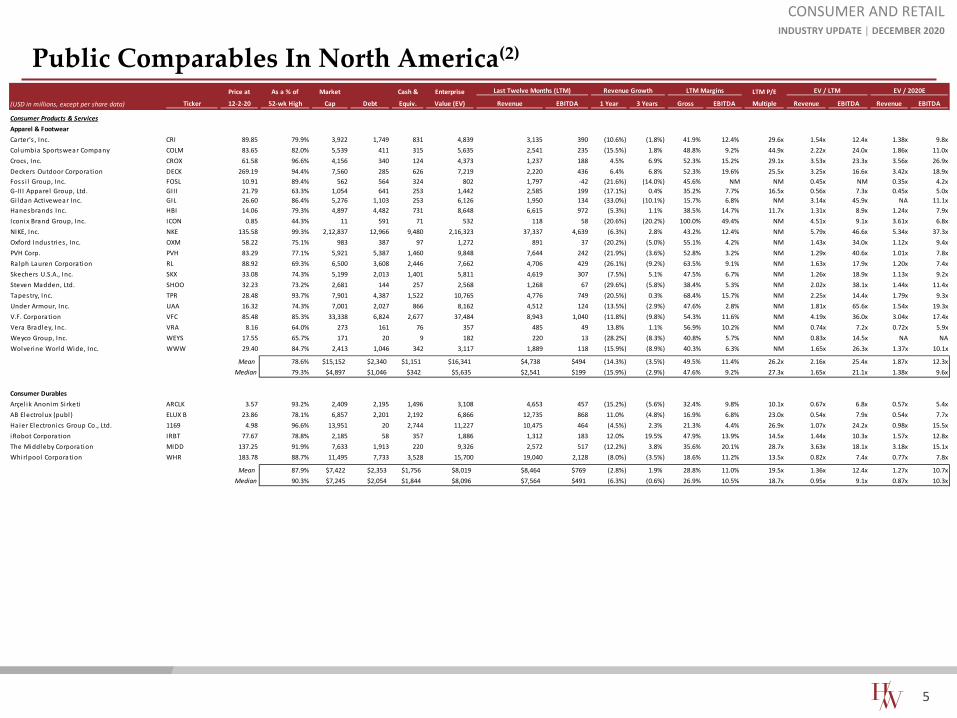
Public Comparables In North America(2)
CONSUMER AND RETAILINDUSTRY UPDATE │ DECEMBER 2020
Price at As a % of Market Cash & Enterprise LTM P/E
(USD in millions, except per share data) Ticker 12-2-20 52-wk High Cap Debt Equiv. Value (EV) Revenue EBITDA 1 Year 3 Years Gross EBITDA Multiple Revenue EBITDA Revenue EBITDA
Consumer Products & ServicesApparel & FootwearCarter's , Inc. CRI 89.85 79.9% 3,922 1,749 831 4,839 3,135 390 (10.6%) (1.8%) 41.9% 12.4% 29.6x 1.54x 12.4x 1.38x 9.8xColumbia Sportswear Company COLM 83.65 82.0% 5,539 411 315 5,635 2,541 235 (15.5%) 1.8% 48.8% 9.2% 44.9x 2.22x 24.0x 1.86x 11.0xCrocs , Inc. CROX 61.58 96.6% 4,156 340 124 4,373 1,237 188 4.5% 6.9% 52.3% 15.2% 29.1x 3.53x 23.3x 3.56x 26.9xDeckers Outdoor Corporation DECK 269.19 94.4% 7,560 285 626 7,219 2,220 436 6.4% 6.8% 52.3% 19.6% 25.5x 3.25x 16.6x 3.42x 18.9xFoss i l Group, Inc. FOSL 10.91 89.4% 562 564 324 802 1,797 -42 (21.6%) (14.0%) 45.6% NM NM 0.45x NM 0.35x 4.2xG-III Apparel Group, Ltd. GIII 21.79 63.3% 1,054 641 253 1,442 2,585 199 (17.1%) 0.4% 35.2% 7.7% 16.5x 0.56x 7.3x 0.45x 5.0xGi ldan Activewear Inc. GIL 26.60 86.4% 5,276 1,103 253 6,126 1,950 134 (33.0%) (10.1%) 15.7% 6.8% NM 3.14x 45.9x NA 11.1xHanesbrands Inc. HBI 14.06 79.3% 4,897 4,482 731 8,648 6,615 972 (5.3%) 1.1% 38.5% 14.7% 11.7x 1.31x 8.9x 1.24x 7.9xIconix Brand Group, Inc. ICON 0.85 44.3% 11 591 71 532 118 58 (20.6%) (20.2%) 100.0% 49.4% NM 4.51x 9.1x 3.61x 6.8xNIKE, Inc. NKE 135.58 99.3% 2,12,837 12,966 9,480 2,16,323 37,337 4,639 (6.3%) 2.8% 43.2% 12.4% NM 5.79x 46.6x 5.34x 37.3xOxford Industries , Inc. OXM 58.22 75.1% 983 387 97 1,272 891 37 (20.2%) (5.0%) 55.1% 4.2% NM 1.43x 34.0x 1.12x 9.4xPVH Corp. PVH 83.29 77.1% 5,921 5,387 1,460 9,848 7,644 242 (21.9%) (3.6%) 52.8% 3.2% NM 1.29x 40.6x 1.01x 7.8xRalph Lauren Corporation RL 88.92 69.3% 6,500 3,608 2,446 7,662 4,706 429 (26.1%) (9.2%) 63.5% 9.1% NM 1.63x 17.9x 1.20x 7.4xSkechers U.S.A., Inc. SKX 33.08 74.3% 5,199 2,013 1,401 5,811 4,619 307 (7.5%) 5.1% 47.5% 6.7% NM 1.26x 18.9x 1.13x 9.2xSteven Madden, Ltd. SHOO 32.23 73.2% 2,681 144 257 2,568 1,268 67 (29.6%) (5.8%) 38.4% 5.3% NM 2.02x 38.1x 1.44x 11.4xTapestry, Inc. TPR 28.48 93.7% 7,901 4,387 1,522 10,765 4,776 749 (20.5%) 0.3% 68.4% 15.7% NM 2.25x 14.4x 1.79x 9.3xUnder Armour, Inc. UAA 16.32 74.3% 7,001 2,027 866 8,162 4,512 124 (13.5%) (2.9%) 47.6% 2.8% NM 1.81x 65.6x 1.54x 19.3xV.F. Corporation VFC 85.48 85.3% 33,338 6,824 2,677 37,484 8,943 1,040 (11.8%) (9.8%) 54.3% 11.6% NM 4.19x 36.0x 3.04x 17.4xVera Bradley, Inc. VRA 8.16 64.0% 273 161 76 357 485 49 13.8% 1.1% 56.9% 10.2% NM 0.74x 7.2x 0.72x 5.9xWeyco Group, Inc. WEYS 17.55 65.7% 171 20 9 182 220 13 (28.2%) (8.3%) 40.8% 5.7% NM 0.83x 14.5x NA NAWolverine World Wide, Inc. WWW 29.40 84.7% 2,413 1,046 342 3,117 1,889 118 (15.9%) (8.9%) 40.3% 6.3% NM 1.65x 26.3x 1.37x 10.1x
Mean 78.6% $15,152 $2,340 $1,151 $16,341 $4,738 $494 (14.3%) (3.5%) 49.5% 11.4% 26.2x 2.16x 25.4x 1.87x 12.3xMedian 79.3% $4,897 $1,046 $342 $5,635 $2,541 $199 (15.9%) (2.9%) 47.6% 9.2% 27.3x 1.65x 21.1x 1.38x 9.6x
Consumer DurablesArçel ik Anonim Si rketi ARCLK 3.57 93.2% 2,409 2,195 1,496 3,108 4,653 457 (15.2%) (5.6%) 32.4% 9.8% 10.1x 0.67x 6.8x 0.57x 5.4xAB Electrolux (publ ) ELUX B 23.86 78.1% 6,857 2,201 2,192 6,866 12,735 868 11.0% (4.8%) 16.9% 6.8% 23.0x 0.54x 7.9x 0.54x 7.7xHaier Electronics Group Co., Ltd. 1169 4.98 96.6% 13,951 20 2,744 11,227 10,475 464 (4.5%) 2.3% 21.3% 4.4% 26.9x 1.07x 24.2x 0.98x 15.5xiRobot Corporation IRBT 77.67 78.8% 2,185 58 357 1,886 1,312 183 12.0% 19.5% 47.9% 13.9% 14.5x 1.44x 10.3x 1.57x 12.8xThe Middleby Corporation MIDD 137.25 91.9% 7,633 1,913 220 9,326 2,572 517 (12.2%) 3.8% 35.6% 20.1% 28.7x 3.63x 18.1x 3.18x 15.1xWhirlpool Corporation WHR 183.78 88.7% 11,495 7,733 3,528 15,700 19,040 2,128 (8.0%) (3.5%) 18.6% 11.2% 13.5x 0.82x 7.4x 0.77x 7.8x
Mean 87.9% $7,422 $2,353 $1,756 $8,019 $8,464 $769 (2.8%) 1.9% 28.8% 11.0% 19.5x 1.36x 12.4x 1.27x 10.7xMedian 90.3% $7,245 $2,054 $1,844 $8,096 $7,564 $491 (6.3%) (0.6%) 26.9% 10.5% 18.7x 0.95x 9.1x 0.87x 10.3x
Last Twelve Months (LTM) EV / LTM EV / 2020ERevenue Growth LTM Margins
5
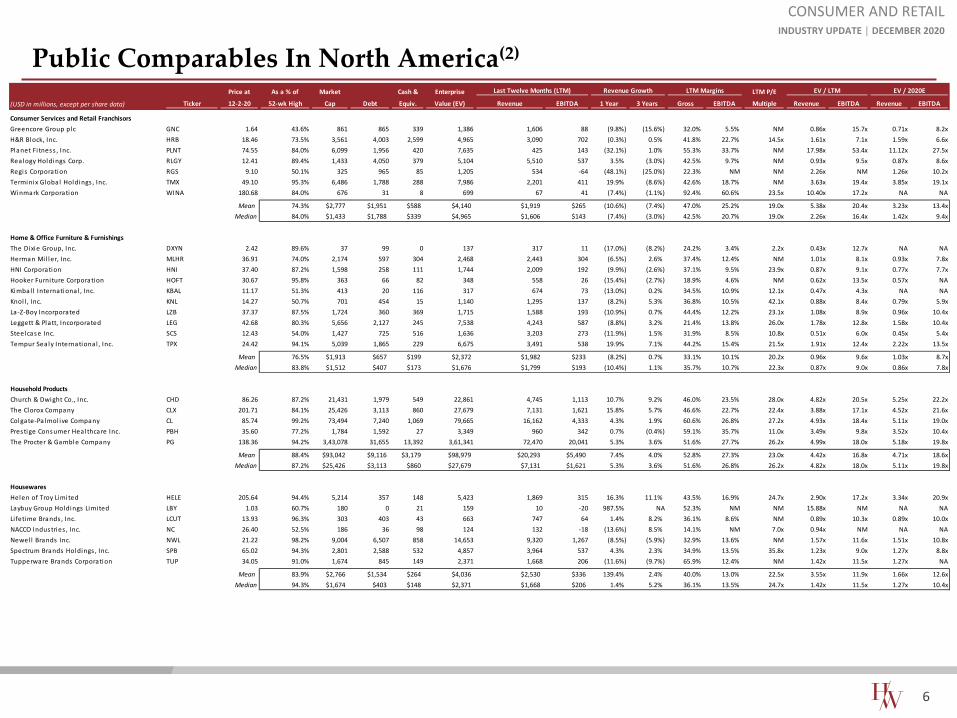
Public Comparables In North America(2)
CONSUMER AND RETAILINDUSTRY UPDATE │ DECEMBER 2020
Price at As a % of Market Cash & Enterprise LTM P/E
(USD in millions, except per share data) Ticker 12-2-20 52-wk High Cap Debt Equiv. Value (EV) Revenue EBITDA 1 Year 3 Years Gross EBITDA Multiple Revenue EBITDA Revenue EBITDA
Consumer Services and Retail FranchisorsGreencore Group plc GNC 1.64 43.6% 861 865 339 1,386 1,606 88 (9.8%) (15.6%) 32.0% 5.5% NM 0.86x 15.7x 0.71x 8.2xH&R Block, Inc. HRB 18.46 73.5% 3,561 4,003 2,599 4,965 3,090 702 (0.3%) 0.5% 41.8% 22.7% 14.5x 1.61x 7.1x 1.59x 6.6xPlanet Fi tness , Inc. PLNT 74.55 84.0% 6,099 1,956 420 7,635 425 143 (32.1%) 1.0% 55.3% 33.7% NM 17.98x 53.4x 11.12x 27.5xRealogy Holdings Corp. RLGY 12.41 89.4% 1,433 4,050 379 5,104 5,510 537 3.5% (3.0%) 42.5% 9.7% NM 0.93x 9.5x 0.87x 8.6xRegis Corporation RGS 9.10 50.1% 325 965 85 1,205 534 -64 (48.1%) (25.0%) 22.3% NM NM 2.26x NM 1.26x 10.2xTerminix Global Holdings , Inc. TMX 49.10 95.3% 6,486 1,788 288 7,986 2,201 411 19.9% (8.6%) 42.6% 18.7% NM 3.63x 19.4x 3.85x 19.1xWinmark Corporation WINA 180.68 84.0% 676 31 8 699 67 41 (7.4%) (1.1%) 92.4% 60.6% 23.5x 10.40x 17.2x NA NA
Mean 74.3% $2,777 $1,951 $588 $4,140 $1,919 $265 (10.6%) (7.4%) 47.0% 25.2% 19.0x 5.38x 20.4x 3.23x 13.4xMedian 84.0% $1,433 $1,788 $339 $4,965 $1,606 $143 (7.4%) (3.0%) 42.5% 20.7% 19.0x 2.26x 16.4x 1.42x 9.4x
Home & Office Furniture & FurnishingsThe Dixie Group, Inc. DXYN 2.42 89.6% 37 99 0 137 317 11 (17.0%) (8.2%) 24.2% 3.4% 2.2x 0.43x 12.7x NA NAHerman Mi l ler, Inc. MLHR 36.91 74.0% 2,174 597 304 2,468 2,443 304 (6.5%) 2.6% 37.4% 12.4% NM 1.01x 8.1x 0.93x 7.8xHNI Corporation HNI 37.40 87.2% 1,598 258 111 1,744 2,009 192 (9.9%) (2.6%) 37.1% 9.5% 23.9x 0.87x 9.1x 0.77x 7.7xHooker Furni ture Corporation HOFT 30.67 95.8% 363 66 82 348 558 26 (15.4%) (2.7%) 18.9% 4.6% NM 0.62x 13.5x 0.57x NAKimbal l International , Inc. KBAL 11.17 51.3% 413 20 116 317 674 73 (13.0%) 0.2% 34.5% 10.9% 12.1x 0.47x 4.3x NA NAKnol l , Inc. KNL 14.27 50.7% 701 454 15 1,140 1,295 137 (8.2%) 5.3% 36.8% 10.5% 42.1x 0.88x 8.4x 0.79x 5.9xLa-Z-Boy Incorporated LZB 37.37 87.5% 1,724 360 369 1,715 1,588 193 (10.9%) 0.7% 44.4% 12.2% 23.1x 1.08x 8.9x 0.96x 10.4xLeggett & Platt, Incorporated LEG 42.68 80.3% 5,656 2,127 245 7,538 4,243 587 (8.8%) 3.2% 21.4% 13.8% 26.0x 1.78x 12.8x 1.58x 10.4xSteelcase Inc. SCS 12.43 54.0% 1,427 725 516 1,636 3,203 273 (11.9%) 1.5% 31.9% 8.5% 10.8x 0.51x 6.0x 0.45x 5.4xTempur Sea ly International , Inc. TPX 24.42 94.1% 5,039 1,865 229 6,675 3,491 538 19.9% 7.1% 44.2% 15.4% 21.5x 1.91x 12.4x 2.22x 13.5x
Mean 76.5% $1,913 $657 $199 $2,372 $1,982 $233 (8.2%) 0.7% 33.1% 10.1% 20.2x 0.96x 9.6x 1.03x 8.7xMedian 83.8% $1,512 $407 $173 $1,676 $1,799 $193 (10.4%) 1.1% 35.7% 10.7% 22.3x 0.87x 9.0x 0.86x 7.8x
Household ProductsChurch & Dwight Co., Inc. CHD 86.26 87.2% 21,431 1,979 549 22,861 4,745 1,113 10.7% 9.2% 46.0% 23.5% 28.0x 4.82x 20.5x 5.25x 22.2xThe Clorox Company CLX 201.71 84.1% 25,426 3,113 860 27,679 7,131 1,621 15.8% 5.7% 46.6% 22.7% 22.4x 3.88x 17.1x 4.52x 21.6xColgate-Pa lmol ive Company CL 85.74 99.2% 73,494 7,240 1,069 79,665 16,162 4,333 4.3% 1.9% 60.6% 26.8% 27.2x 4.93x 18.4x 5.11x 19.0xPrestige Consumer Heal thcare Inc. PBH 35.60 77.2% 1,784 1,592 27 3,349 960 342 0.7% (0.4%) 59.1% 35.7% 11.0x 3.49x 9.8x 3.52x 10.4xThe Procter & Gamble Company PG 138.36 94.2% 3,43,078 31,655 13,392 3,61,341 72,470 20,041 5.3% 3.6% 51.6% 27.7% 26.2x 4.99x 18.0x 5.18x 19.8x
Mean 88.4% $93,042 $9,116 $3,179 $98,979 $20,293 $5,490 7.4% 4.0% 52.8% 27.3% 23.0x 4.42x 16.8x 4.71x 18.6xMedian 87.2% $25,426 $3,113 $860 $27,679 $7,131 $1,621 5.3% 3.6% 51.6% 26.8% 26.2x 4.82x 18.0x 5.11x 19.8x
HousewaresHelen of Troy Limited HELE 205.64 94.4% 5,214 357 148 5,423 1,869 315 16.3% 11.1% 43.5% 16.9% 24.7x 2.90x 17.2x 3.34x 20.9xLaybuy Group Holdings Limited LBY 1.03 60.7% 180 0 21 159 10 -20 987.5% NA 52.3% NM NM 15.88x NM NA NALi fetime Brands , Inc. LCUT 13.93 96.3% 303 403 43 663 747 64 1.4% 8.2% 36.1% 8.6% NM 0.89x 10.3x 0.89x 10.0xNACCO Industries , Inc. NC 26.40 52.5% 186 36 98 124 132 -18 (13.6%) 8.5% 14.1% NM 7.0x 0.94x NM NA NANewel l Brands Inc. NWL 21.22 98.2% 9,004 6,507 858 14,653 9,320 1,267 (8.5%) (5.9%) 32.9% 13.6% NM 1.57x 11.6x 1.51x 10.8xSpectrum Brands Holdings , Inc. SPB 65.02 94.3% 2,801 2,588 532 4,857 3,964 537 4.3% 2.3% 34.9% 13.5% 35.8x 1.23x 9.0x 1.27x 8.8xTupperware Brands Corporation TUP 34.05 91.0% 1,674 845 149 2,371 1,668 206 (11.6%) (9.7%) 65.9% 12.4% NM 1.42x 11.5x 1.27x NA
Mean 83.9% $2,766 $1,534 $264 $4,036 $2,530 $336 139.4% 2.4% 40.0% 13.0% 22.5x 3.55x 11.9x 1.66x 12.6xMedian 94.3% $1,674 $403 $148 $2,371 $1,668 $206 1.4% 5.2% 36.1% 13.5% 24.7x 1.42x 11.5x 1.27x 10.4x
Last Twelve Months (LTM) LTM Margins EV / LTM EV / 2020ERevenue Growth
6
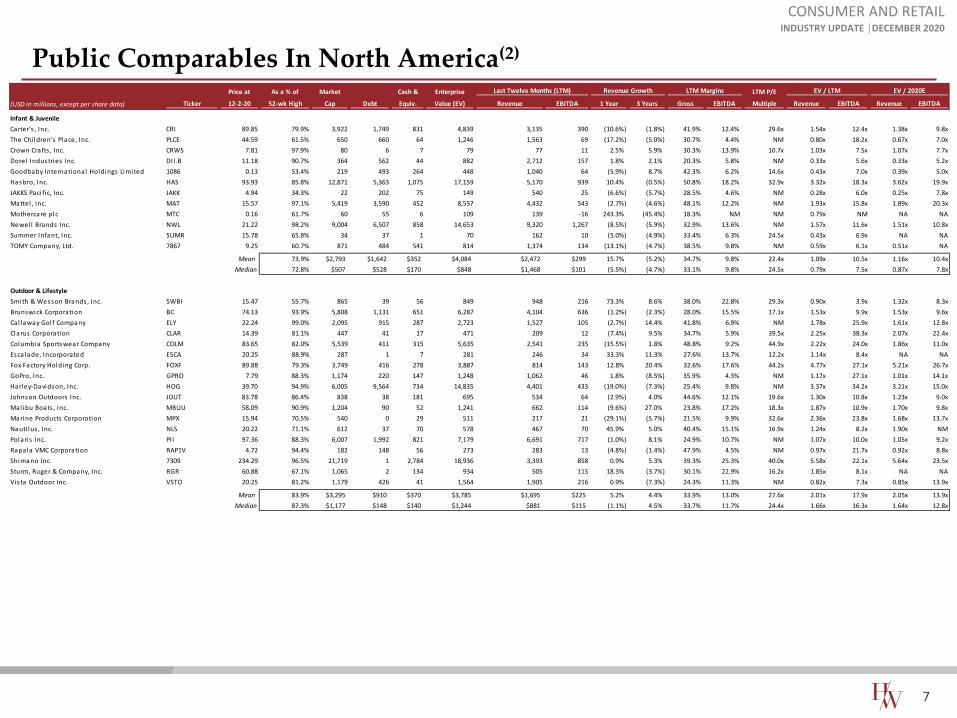
Public Comparables In North America(2)
CONSUMER AND RETAILINDUSTRY UPDATE │DECEMBER 2020
Price at As a % of Market Cash & Enterprise LTM P/E
(USD in millions, except per share data) Ticker 12-2-20 52-wk High Cap Debt Equiv. Value (EV) Revenue EBITDA 1 Year 3 Years Gross EBITDA Multiple Revenue EBITDA Revenue EBITDA
Infant & JuvenileCarter's , Inc. CRI 89.85 79.9% 3,922 1,749 831 4,839 3,135 390 (10.6%) (1.8%) 41.9% 12.4% 29.6x 1.54x 12.4x 1.38x 9.8xThe Chi ldren's Place, Inc. PLCE 44.59 61.5% 650 660 64 1,246 1,563 69 (17.2%) (5.0%) 30.7% 4.4% NM 0.80x 18.2x 0.67x 7.0xCrown Crafts , Inc. CRWS 7.81 97.9% 80 6 7 79 77 11 2.5% 5.9% 30.3% 13.9% 10.7x 1.03x 7.5x 1.07x 7.7xDorel Industries Inc. DII.B 11.18 90.7% 364 562 44 882 2,712 157 1.8% 2.1% 20.3% 5.8% NM 0.33x 5.6x 0.33x 5.2xGoodbaby International Holdings Limited 1086 0.13 53.4% 219 493 264 448 1,040 64 (5.9%) 8.7% 42.3% 6.2% 14.6x 0.43x 7.0x 0.39x 5.0xHasbro, Inc. HAS 93.93 85.8% 12,871 5,363 1,075 17,159 5,170 939 10.4% (0.5%) 50.8% 18.2% 32.9x 3.32x 18.3x 3.62x 19.9xJAKKS Paci fic, Inc. JAKK 4.94 34.3% 22 202 75 149 540 25 (6.6%) (5.7%) 28.5% 4.6% NM 0.28x 6.0x 0.25x 7.8xMattel , Inc. MAT 15.57 97.1% 5,419 3,590 452 8,557 4,432 543 (2.7%) (4.6%) 48.1% 12.2% NM 1.93x 15.8x 1.89x 20.3xMothercare plc MTC 0.16 61.7% 60 55 6 109 139 -16 243.3% (45.4%) 18.3% NM NM 0.79x NM NA NANewel l Brands Inc. NWL 21.22 98.2% 9,004 6,507 858 14,653 9,320 1,267 (8.5%) (5.9%) 32.9% 13.6% NM 1.57x 11.6x 1.51x 10.8xSummer Infant, Inc. SUMR 15.78 65.8% 34 37 1 70 162 10 (5.0%) (4.9%) 33.4% 6.3% 24.5x 0.43x 6.9x NA NATOMY Company, Ltd. 7867 9.25 60.7% 871 484 541 814 1,374 134 (13.1%) (4.7%) 38.5% 9.8% NM 0.59x 6.1x 0.51x NA
Mean 73.9% $2,793 $1,642 $352 $4,084 $2,472 $299 15.7% (5.2%) 34.7% 9.8% 22.4x 1.09x 10.5x 1.16x 10.4xMedian 72.8% $507 $528 $170 $848 $1,468 $101 (5.5%) (4.7%) 33.1% 9.8% 24.5x 0.79x 7.5x 0.87x 7.8x
Outdoor & LifestyleSmith & Wesson Brands , Inc. SWBI 15.47 55.7% 865 39 56 849 948 216 73.3% 8.6% 38.0% 22.8% 29.3x 0.90x 3.9x 1.32x 8.3xBrunswick Corporation BC 74.13 93.9% 5,808 1,131 651 6,287 4,104 636 (1.2%) (2.3%) 28.0% 15.5% 17.1x 1.53x 9.9x 1.53x 9.6xCal laway Gol f Company ELY 22.24 99.0% 2,095 915 287 2,723 1,527 105 (2.7%) 14.4% 41.8% 6.9% NM 1.78x 25.9x 1.61x 12.8xClarus Corporation CLAR 14.39 81.1% 447 41 17 471 209 12 (7.4%) 9.5% 34.7% 5.9% 39.5x 2.25x 38.3x 2.07x 22.4xColumbia Sportswear Company COLM 83.65 82.0% 5,539 411 315 5,635 2,541 235 (15.5%) 1.8% 48.8% 9.2% 44.9x 2.22x 24.0x 1.86x 11.0xEsca lade, Incorporated ESCA 20.25 88.9% 287 1 7 281 246 34 33.3% 11.3% 27.6% 13.7% 12.2x 1.14x 8.4x NA NAFox Factory Holding Corp. FOXF 89.88 79.3% 3,749 416 278 3,887 814 143 12.8% 20.4% 32.6% 17.6% 44.2x 4.77x 27.1x 5.21x 26.7xGoPro, Inc. GPRO 7.79 88.3% 1,174 220 147 1,248 1,062 46 1.8% (8.5%) 35.9% 4.3% NM 1.17x 27.1x 1.01x 14.1xHarley-Davidson, Inc. HOG 39.70 94.9% 6,005 9,564 734 14,835 4,401 433 (19.0%) (7.3%) 25.4% 9.8% NM 3.37x 34.2x 3.21x 15.0xJohnson Outdoors Inc. JOUT 83.78 86.4% 838 38 181 695 534 64 (2.9%) 4.0% 44.6% 12.1% 19.6x 1.30x 10.8x 1.23x 9.0xMal ibu Boats , Inc. MBUU 58.09 90.9% 1,204 90 52 1,241 662 114 (9.6%) 27.0% 23.8% 17.2% 18.3x 1.87x 10.9x 1.70x 9.8xMarine Products Corporation MPX 15.94 70.5% 540 0 29 511 217 21 (29.1%) (5.7%) 21.5% 9.9% 32.6x 2.36x 23.8x 1.68x 13.7xNauti lus , Inc. NLS 20.22 71.1% 612 37 70 578 467 70 45.9% 5.0% 40.4% 15.1% 16.9x 1.24x 8.2x 1.90x NMPolaris Inc. PII 97.36 88.3% 6,007 1,992 821 7,179 6,691 717 (1.0%) 8.1% 24.9% 10.7% NM 1.07x 10.0x 1.05x 9.2xRapala VMC Corporation RAP1V 4.72 94.4% 182 148 56 273 283 13 (4.8%) (1.4%) 47.9% 4.5% NM 0.97x 21.7x 0.92x 8.8xShimano Inc. 7309 234.29 96.5% 21,719 1 2,784 18,936 3,393 858 0.9% 5.3% 39.3% 25.3% 40.0x 5.58x 22.1x 5.64x 23.5xSturm, Ruger & Company, Inc. RGR 60.88 67.1% 1,065 2 134 934 505 115 18.3% (3.7%) 30.1% 22.9% 16.2x 1.85x 8.1x NA NAVista Outdoor Inc. VSTO 20.25 81.2% 1,179 426 41 1,564 1,905 216 0.9% (7.3%) 24.3% 11.3% NM 0.82x 7.3x 0.85x 13.9x
Mean 83.9% $3,295 $910 $370 $3,785 $1,695 $225 5.2% 4.4% 33.9% 13.0% 27.6x 2.01x 17.9x 2.05x 13.9xMedian 87.3% $1,177 $148 $140 $1,244 $881 $115 (1.1%) 4.5% 33.7% 11.7% 24.4x 1.66x 16.3x 1.64x 12.8x
Last Twelve Months (LTM) Revenue Growth LTM Margins EV / LTM EV / 2020E
7
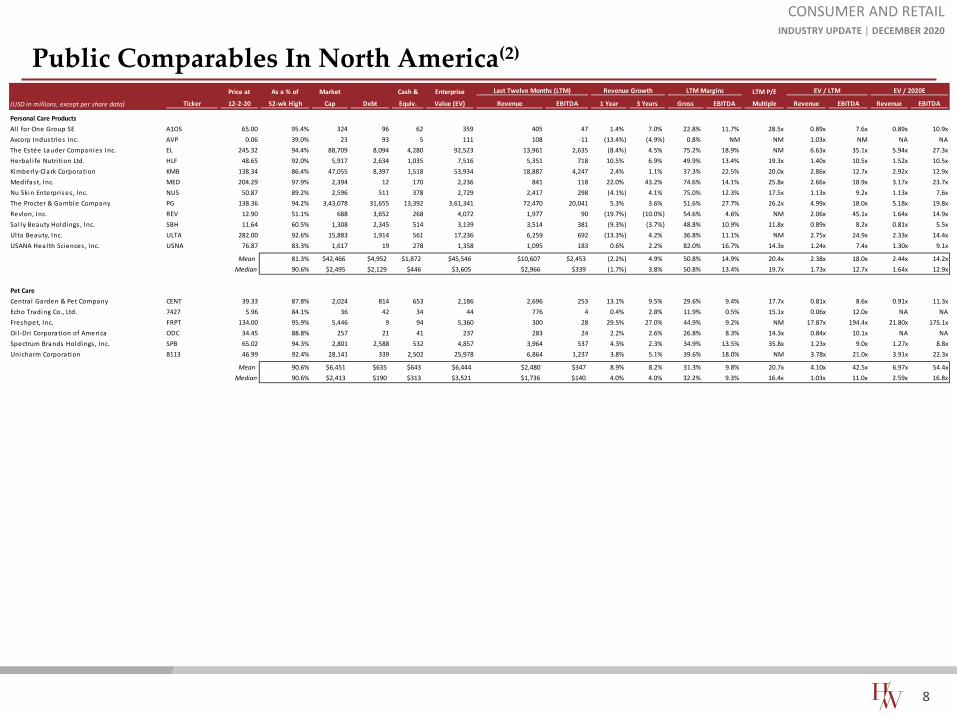
Public Comparables In North America(2)
CONSUMER AND RETAILINDUSTRY UPDATE │ DECEMBER 2020
Price at As a % of Market Cash & Enterprise LTM P/E
(USD in millions, except per share data) Ticker 12-2-20 52-wk High Cap Debt Equiv. Value (EV) Revenue EBITDA 1 Year 3 Years Gross EBITDA Multiple Revenue EBITDA Revenue EBITDA
Personal Care ProductsAl l for One Group SE A1OS 65.00 95.4% 324 96 62 359 405 47 1.4% 7.0% 22.8% 11.7% 28.5x 0.89x 7.6x 0.89x 10.9xAvcorp Industries Inc. AVP 0.06 39.0% 23 93 5 111 108 -11 (13.4%) (4.9%) 0.8% NM NM 1.03x NM NA NAThe Estée Lauder Companies Inc. EL 245.32 94.4% 88,709 8,094 4,280 92,523 13,961 2,635 (8.4%) 4.5% 75.2% 18.9% NM 6.63x 35.1x 5.94x 27.3xHerbal i fe Nutri tion Ltd. HLF 48.65 92.0% 5,917 2,634 1,035 7,516 5,351 718 10.5% 6.9% 49.9% 13.4% 19.3x 1.40x 10.5x 1.52x 10.5xKimberly-Clark Corporation KMB 138.34 86.4% 47,055 8,397 1,518 53,934 18,887 4,247 2.4% 1.1% 37.3% 22.5% 20.0x 2.86x 12.7x 2.92x 12.9xMedi fast, Inc. MED 204.29 97.9% 2,394 12 170 2,236 841 118 22.0% 43.2% 74.6% 14.1% 25.8x 2.66x 18.9x 3.17x 23.7xNu Skin Enterprises , Inc. NUS 50.87 89.2% 2,596 511 378 2,729 2,417 298 (4.1%) 4.1% 75.0% 12.3% 17.5x 1.13x 9.2x 1.13x 7.6xThe Procter & Gamble Company PG 138.36 94.2% 3,43,078 31,655 13,392 3,61,341 72,470 20,041 5.3% 3.6% 51.6% 27.7% 26.2x 4.99x 18.0x 5.18x 19.8xRevlon, Inc. REV 12.90 51.1% 688 3,652 268 4,072 1,977 90 (19.7%) (10.0%) 54.6% 4.6% NM 2.06x 45.1x 1.64x 14.9xSa l ly Beauty Holdings , Inc. SBH 11.64 60.5% 1,308 2,345 514 3,139 3,514 381 (9.3%) (3.7%) 48.8% 10.9% 11.8x 0.89x 8.2x 0.81x 5.5xUlta Beauty, Inc. ULTA 282.00 92.6% 15,883 1,914 561 17,236 6,259 692 (13.3%) 4.2% 36.8% 11.1% NM 2.75x 24.9x 2.33x 14.4xUSANA Health Sciences , Inc. USNA 76.87 83.3% 1,617 19 278 1,358 1,095 183 0.6% 2.2% 82.0% 16.7% 14.3x 1.24x 7.4x 1.30x 9.1x
Mean 81.3% $42,466 $4,952 $1,872 $45,546 $10,607 $2,453 (2.2%) 4.9% 50.8% 14.9% 20.4x 2.38x 18.0x 2.44x 14.2xMedian 90.6% $2,495 $2,129 $446 $3,605 $2,966 $339 (1.7%) 3.8% 50.8% 13.4% 19.7x 1.73x 12.7x 1.64x 12.9x
Pet CareCentra l Garden & Pet Company CENT 39.33 87.8% 2,024 814 653 2,186 2,696 253 13.1% 9.5% 29.6% 9.4% 17.7x 0.81x 8.6x 0.91x 11.3xEcho Trading Co., Ltd. 7427 5.96 84.1% 36 42 34 44 776 4 0.4% 2.8% 11.9% 0.5% 15.1x 0.06x 12.0x NA NAFreshpet, Inc. FRPT 134.00 95.9% 5,446 9 94 5,360 300 28 29.5% 27.0% 44.9% 9.2% NM 17.87x 194.4x 21.80x 175.1xOi l -Dri Corporation of America ODC 34.45 88.8% 257 21 41 237 283 24 2.2% 2.6% 26.8% 8.3% 14.3x 0.84x 10.1x NA NASpectrum Brands Holdings , Inc. SPB 65.02 94.3% 2,801 2,588 532 4,857 3,964 537 4.3% 2.3% 34.9% 13.5% 35.8x 1.23x 9.0x 1.27x 8.8xUnicharm Corporation 8113 46.99 92.4% 28,141 339 2,502 25,978 6,864 1,237 3.8% 5.1% 39.6% 18.0% NM 3.78x 21.0x 3.91x 22.3x
Mean 90.6% $6,451 $635 $643 $6,444 $2,480 $347 8.9% 8.2% 31.3% 9.8% 20.7x 4.10x 42.5x 6.97x 54.4xMedian 90.6% $2,413 $190 $313 $3,521 $1,736 $140 4.0% 4.0% 32.2% 9.3% 16.4x 1.03x 11.0x 2.59x 16.8x
LTM MarginsLast Twelve Months (LTM) EV / 2020ERevenue Growth EV / LTM
8
Public Comparables In North America(2)
CONSUMER AND RETAILINDUSTRY UPDATE │ DECEMBER 2020
Price at As a % of Market Cash & Enterprise LTM P/E
(USD in millions, except per share data) Ticker 12-2-20 52-wk High Cap Debt Equiv. Value (EV) Revenue EBITDA 1 Year 3 Years Gross EBITDA Multiple Revenue EBITDA Revenue EBITDA
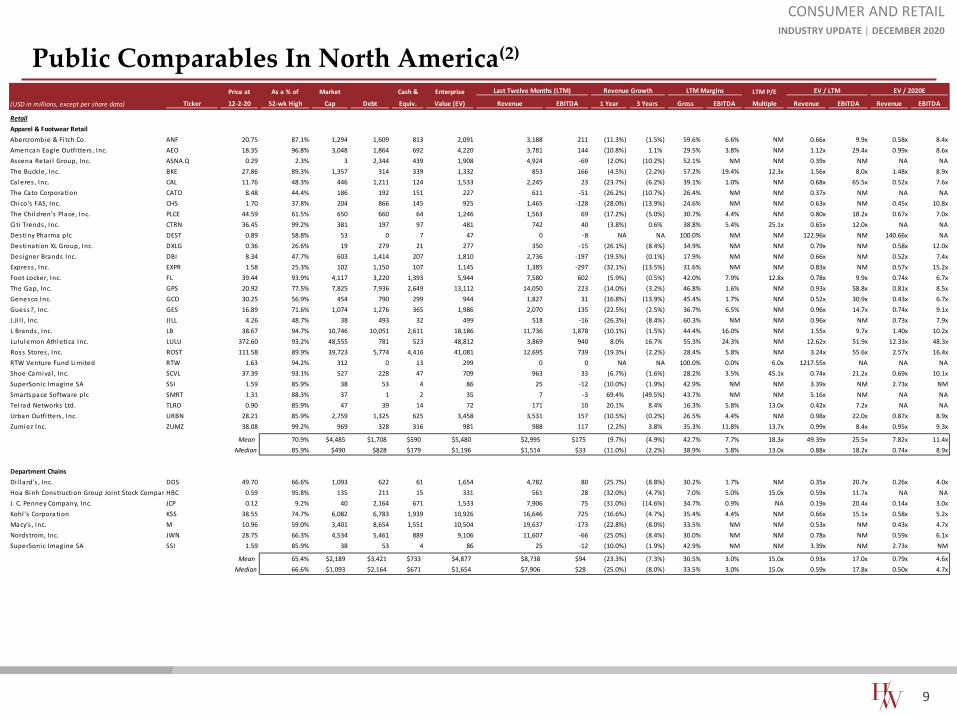
RetailApparel & Footwear RetailAbercrombie & Fi tch Co. ANF 20.75 87.1% 1,294 1,609 813 2,091 3,188 211 (11.3%) (1.5%) 59.6% 6.6% NM 0.66x 9.9x 0.58x 8.4xAmerican Eagle Outfi tters , Inc. AEO 18.35 96.8% 3,048 1,864 692 4,220 3,781 144 (10.8%) 1.1% 29.5% 3.8% NM 1.12x 29.4x 0.99x 8.6xAscena Reta i l Group, Inc. ASNA.Q 0.29 2.3% 3 2,344 439 1,908 4,924 -69 (2.0%) (10.2%) 52.1% NM NM 0.39x NM NA NAThe Buckle, Inc. BKE 27.86 89.3% 1,357 314 339 1,332 853 166 (4.5%) (2.2%) 57.2% 19.4% 12.3x 1.56x 8.0x 1.48x 8.9xCaleres , Inc. CAL 11.76 48.3% 446 1,211 124 1,533 2,245 23 (23.7%) (6.2%) 39.1% 1.0% NM 0.68x 65.5x 0.52x 7.6xThe Cato Corporation CATO 8.48 44.4% 186 192 151 227 611 -51 (26.2%) (10.7%) 26.4% NM NM 0.37x NM NA NAChico's FAS, Inc. CHS 1.70 37.8% 204 866 145 925 1,465 -128 (28.0%) (13.9%) 24.6% NM NM 0.63x NM 0.45x 10.8xThe Chi ldren's Place, Inc. PLCE 44.59 61.5% 650 660 64 1,246 1,563 69 (17.2%) (5.0%) 30.7% 4.4% NM 0.80x 18.2x 0.67x 7.0xCi ti Trends , Inc. CTRN 36.45 99.2% 381 197 97 481 742 40 (3.8%) 0.6% 38.8% 5.4% 25.1x 0.65x 12.0x NA NADestiny Pharma plc DEST 0.89 58.8% 53 0 7 47 0 -8 NA NA 100.0% NM NM 122.96x NM 140.66x NADestination XL Group, Inc. DXLG 0.36 26.6% 19 279 21 277 350 -15 (26.1%) (8.4%) 34.9% NM NM 0.79x NM 0.58x 12.0xDes igner Brands Inc. DBI 8.34 47.7% 603 1,414 207 1,810 2,736 -197 (19.5%) (0.1%) 17.9% NM NM 0.66x NM 0.52x 7.4xExpress , Inc. EXPR 1.58 25.3% 102 1,150 107 1,145 1,385 -297 (32.1%) (13.5%) 31.6% NM NM 0.83x NM 0.57x 15.2xFoot Locker, Inc. FL 39.44 93.9% 4,117 3,220 1,393 5,944 7,580 602 (5.9%) (0.5%) 42.0% 7.9% 12.8x 0.78x 9.9x 0.74x 6.7xThe Gap, Inc. GPS 20.92 77.5% 7,825 7,936 2,649 13,112 14,050 223 (14.0%) (3.2%) 46.8% 1.6% NM 0.93x 58.8x 0.81x 8.5xGenesco Inc. GCO 30.25 56.9% 454 790 299 944 1,827 31 (16.8%) (13.9%) 45.4% 1.7% NM 0.52x 30.9x 0.43x 6.7xGuess?, Inc. GES 16.89 71.6% 1,074 1,276 365 1,986 2,070 135 (22.5%) (2.5%) 36.7% 6.5% NM 0.96x 14.7x 0.74x 9.1xJ.Ji l l , Inc. JILL 4.26 48.7% 38 493 32 499 518 -16 (26.3%) (8.4%) 60.3% NM NM 0.96x NM 0.73x 7.9xL Brands , Inc. LB 38.67 94.7% 10,746 10,051 2,611 18,186 11,736 1,878 (10.1%) (1.5%) 44.4% 16.0% NM 1.55x 9.7x 1.40x 10.2xLululemon Athletica Inc. LULU 372.60 93.2% 48,555 781 523 48,812 3,869 940 8.0% 16.7% 55.3% 24.3% NM 12.62x 51.9x 12.33x 48.3xRoss Stores , Inc. ROST 111.58 89.9% 39,723 5,774 4,416 41,081 12,695 739 (19.3%) (2.2%) 28.4% 5.8% NM 3.24x 55.6x 2.57x 16.4xRTW Venture Fund Limited RTW 1.63 94.2% 312 0 13 299 0 0 NA NA 100.0% 0.0% 6.0x 1217.55x NA NA NAShoe Carniva l , Inc. SCVL 37.39 93.1% 527 228 47 709 963 33 (6.7%) (1.6%) 28.2% 3.5% 45.1x 0.74x 21.2x 0.69x 10.1xSuperSonic Imagine SA SSI 1.59 85.9% 38 53 4 86 25 -12 (10.0%) (1.9%) 42.9% NM NM 3.39x NM 2.73x NMSmartspace Software plc SMRT 1.31 88.3% 37 1 2 35 7 -3 69.4% (49.5%) 43.7% NM NM 5.16x NM NA NATelrad Networks Ltd. TLRD 0.90 85.9% 47 39 14 72 171 10 20.1% 8.4% 16.3% 5.8% 13.0x 0.42x 7.2x NA NAUrban Outfi tters , Inc. URBN 28.21 85.9% 2,759 1,325 625 3,458 3,531 157 (10.5%) (0.2%) 26.5% 4.4% NM 0.98x 22.0x 0.87x 8.9xZumiez Inc. ZUMZ 38.08 99.2% 969 328 316 981 988 117 (2.2%) 3.8% 35.3% 11.8% 13.7x 0.99x 8.4x 0.95x 9.3x
Mean 70.9% $4,485 $1,708 $590 $5,480 $2,995 $175 (9.7%) (4.9%) 42.7% 7.7% 18.3x 49.39x 25.5x 7.82x 11.4xMedian 85.9% $490 $828 $179 $1,196 $1,514 $33 (11.0%) (2.2%) 38.9% 5.8% 13.0x 0.88x 18.2x 0.74x 8.9x
Department ChainsDi l lard's , Inc. DDS 49.70 66.6% 1,093 622 61 1,654 4,782 80 (25.7%) (8.8%) 30.2% 1.7% NM 0.35x 20.7x 0.26x 4.0xHoa Binh Construction Group Joint Stock CompanHBC 0.59 95.8% 135 211 15 331 561 28 (32.0%) (4.7%) 7.0% 5.0% 15.0x 0.59x 11.7x NA NAJ. C. Penney Company, Inc. JCP 0.12 9.2% 40 2,164 671 1,533 7,906 75 (31.0%) (14.6%) 34.7% 0.9% NA 0.19x 20.4x 0.14x 3.0xKohl 's Corporation KSS 38.55 74.7% 6,082 6,783 1,939 10,926 16,646 725 (16.6%) (4.7%) 35.4% 4.4% NM 0.66x 15.1x 0.58x 5.2xMacy's , Inc. M 10.96 59.0% 3,401 8,654 1,551 10,504 19,637 -173 (22.8%) (8.0%) 33.5% NM NM 0.53x NM 0.43x 4.7xNordstrom, Inc. JWN 28.75 66.3% 4,534 5,461 889 9,106 11,607 -66 (25.0%) (8.4%) 30.0% NM NM 0.78x NM 0.59x 6.1xSuperSonic Imagine SA SSI 1.59 85.9% 38 53 4 86 25 -12 (10.0%) (1.9%) 42.9% NM NM 3.39x NM 2.73x NM
Mean 65.4% $2,189 $3,421 $733 $4,877 $8,738 $94 (23.3%) (7.3%) 30.5% 3.0% 15.0x 0.93x 17.0x 0.79x 4.6xMedian 66.6% $1,093 $2,164 $671 $1,654 $7,906 $28 (25.0%) (8.0%) 33.5% 3.0% 15.0x 0.59x 17.8x 0.50x 4.7x
Last Twelve Months (LTM) Revenue Growth LTM Margins EV / LTM EV / 2020E
9
Public Comparables In North America(2)
CONSUMER AND RETAILINDUSTRY UPDATE │ DECEMBER 2020
Price at As a % of Market Cash & Enterprise LTM P/E
(USD in millions, except per share data) Ticker 12-2-20 52-wk High Cap Debt Equiv. Value (EV) Revenue EBITDA 1 Year 3 Years Gross EBITDA Multiple Revenue EBITDA Revenue EBITDA
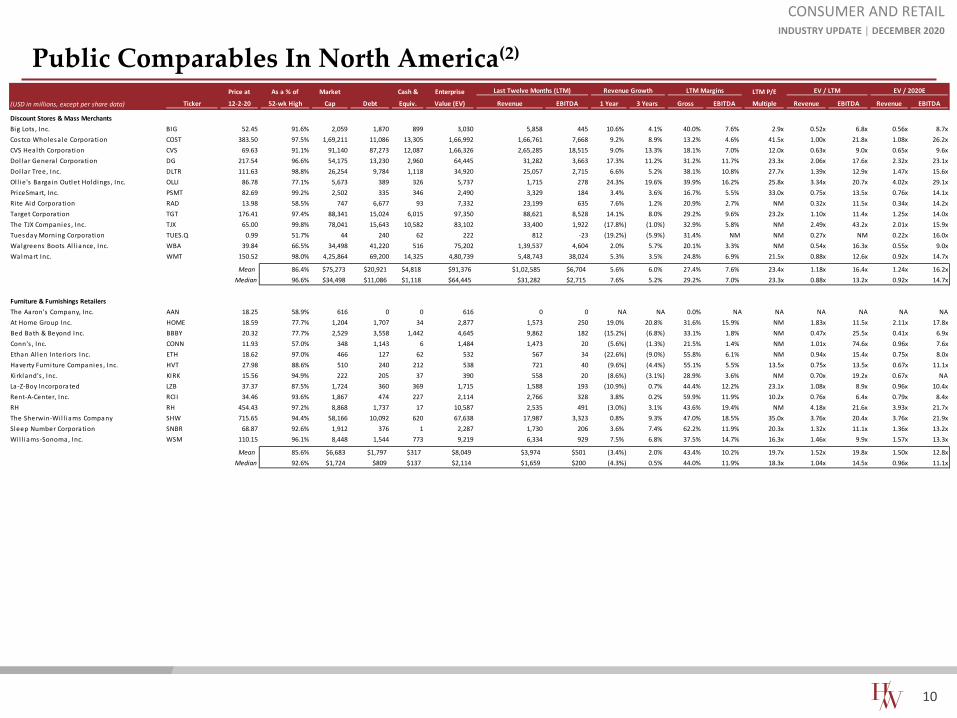
Discount Stores & Mass MerchantsBig Lots , Inc. BIG 52.45 91.6% 2,059 1,870 899 3,030 5,858 445 10.6% 4.1% 40.0% 7.6% 2.9x 0.52x 6.8x 0.56x 8.7xCostco Wholesa le Corporation COST 383.50 97.5% 1,69,211 11,086 13,305 1,66,992 1,66,761 7,668 9.2% 8.9% 13.2% 4.6% 41.5x 1.00x 21.8x 1.08x 26.2xCVS Heal th Corporation CVS 69.63 91.1% 91,140 87,273 12,087 1,66,326 2,65,285 18,515 9.0% 13.3% 18.1% 7.0% 12.0x 0.63x 9.0x 0.65x 9.6xDol lar Genera l Corporation DG 217.54 96.6% 54,175 13,230 2,960 64,445 31,282 3,663 17.3% 11.2% 31.2% 11.7% 23.3x 2.06x 17.6x 2.32x 23.1xDol lar Tree, Inc. DLTR 111.63 98.8% 26,254 9,784 1,118 34,920 25,057 2,715 6.6% 5.2% 38.1% 10.8% 27.7x 1.39x 12.9x 1.47x 15.6xOl l ie's Barga in Outlet Holdings , Inc. OLLI 86.78 77.1% 5,673 389 326 5,737 1,715 278 24.3% 19.6% 39.9% 16.2% 25.8x 3.34x 20.7x 4.02x 29.1xPriceSmart, Inc. PSMT 82.69 99.2% 2,502 335 346 2,490 3,329 184 3.4% 3.6% 16.7% 5.5% 33.0x 0.75x 13.5x 0.76x 14.1xRite Aid Corporation RAD 13.98 58.5% 747 6,677 93 7,332 23,199 635 7.6% 1.2% 20.9% 2.7% NM 0.32x 11.5x 0.34x 14.2xTarget Corporation TGT 176.41 97.4% 88,341 15,024 6,015 97,350 88,621 8,528 14.1% 8.0% 29.2% 9.6% 23.2x 1.10x 11.4x 1.25x 14.0xThe TJX Companies , Inc. TJX 65.00 99.8% 78,041 15,643 10,582 83,102 33,400 1,922 (17.8%) (1.0%) 32.9% 5.8% NM 2.49x 43.2x 2.01x 15.9xTuesday Morning Corporation TUES.Q 0.99 51.7% 44 240 62 222 812 -23 (19.2%) (5.9%) 31.4% NM NM 0.27x NM 0.22x 16.0xWalgreens Boots Al l iance, Inc. WBA 39.84 66.5% 34,498 41,220 516 75,202 1,39,537 4,604 2.0% 5.7% 20.1% 3.3% NM 0.54x 16.3x 0.55x 9.0xWalmart Inc. WMT 150.52 98.0% 4,25,864 69,200 14,325 4,80,739 5,48,743 38,024 5.3% 3.5% 24.8% 6.9% 21.5x 0.88x 12.6x 0.92x 14.7x
Mean 86.4% $75,273 $20,921 $4,818 $91,376 $1,02,585 $6,704 5.6% 6.0% 27.4% 7.6% 23.4x 1.18x 16.4x 1.24x 16.2xMedian 96.6% $34,498 $11,086 $1,118 $64,445 $31,282 $2,715 7.6% 5.2% 29.2% 7.0% 23.3x 0.88x 13.2x 0.92x 14.7x
Furniture & Furnishings RetailersThe Aaron's Company, Inc. AAN 18.25 58.9% 616 0 0 616 0 0 NA NA 0.0% NA NA NA NA NA NAAt Home Group Inc. HOME 18.59 77.7% 1,204 1,707 34 2,877 1,573 250 19.0% 20.8% 31.6% 15.9% NM 1.83x 11.5x 2.11x 17.8xBed Bath & Beyond Inc. BBBY 20.32 77.7% 2,529 3,558 1,442 4,645 9,862 182 (15.2%) (6.8%) 33.1% 1.8% NM 0.47x 25.5x 0.41x 6.9xConn's , Inc. CONN 11.93 57.0% 348 1,143 6 1,484 1,473 20 (5.6%) (1.3%) 21.5% 1.4% NM 1.01x 74.6x 0.96x 7.6xEthan Al len Interiors Inc. ETH 18.62 97.0% 466 127 62 532 567 34 (22.6%) (9.0%) 55.8% 6.1% NM 0.94x 15.4x 0.75x 8.0xHaverty Furni ture Companies , Inc. HVT 27.98 88.6% 510 240 212 538 721 40 (9.6%) (4.4%) 55.1% 5.5% 13.5x 0.75x 13.5x 0.67x 11.1xKirkland's , Inc. KIRK 15.56 94.9% 222 205 37 390 558 20 (8.6%) (3.1%) 28.9% 3.6% NM 0.70x 19.2x 0.67x NALa-Z-Boy Incorporated LZB 37.37 87.5% 1,724 360 369 1,715 1,588 193 (10.9%) 0.7% 44.4% 12.2% 23.1x 1.08x 8.9x 0.96x 10.4xRent-A-Center, Inc. RCII 34.46 93.6% 1,867 474 227 2,114 2,766 328 3.8% 0.2% 59.9% 11.9% 10.2x 0.76x 6.4x 0.79x 8.4xRH RH 454.43 97.2% 8,868 1,737 17 10,587 2,535 491 (3.0%) 3.1% 43.6% 19.4% NM 4.18x 21.6x 3.93x 21.7xThe Sherwin-Wi l l iams Company SHW 715.65 94.4% 58,166 10,092 620 67,638 17,987 3,323 0.8% 9.3% 47.0% 18.5% 35.0x 3.76x 20.4x 3.76x 21.9xSleep Number Corporation SNBR 68.87 92.6% 1,912 376 1 2,287 1,730 206 3.6% 7.4% 62.2% 11.9% 20.3x 1.32x 11.1x 1.36x 13.2xWi l l iams-Sonoma, Inc. WSM 110.15 96.1% 8,448 1,544 773 9,219 6,334 929 7.5% 6.8% 37.5% 14.7% 16.3x 1.46x 9.9x 1.57x 13.3x
Mean 85.6% $6,683 $1,797 $317 $8,049 $3,974 $501 (3.4%) 2.0% 43.4% 10.2% 19.7x 1.52x 19.8x 1.50x 12.8xMedian 92.6% $1,724 $809 $137 $2,114 $1,659 $200 (4.3%) 0.5% 44.0% 11.9% 18.3x 1.04x 14.5x 0.96x 11.1x
EV / 2020ELast Twelve Months (LTM) Revenue Growth LTM Margins EV / LTM
10
Public Comparables In North America(2)
CONSUMER AND RETAILINDUSTRY UPDATE │ DECEMBER 2020
Price at As a % of Market Cash & Enterprise LTM P/E
(USD in millions, except per share data) Ticker 12-2-20 52-wk High Cap Debt Equiv. Value (EV) Revenue EBITDA 1 Year 3 Years Gross EBITDA Multiple Revenue EBITDA Revenue EBITDA
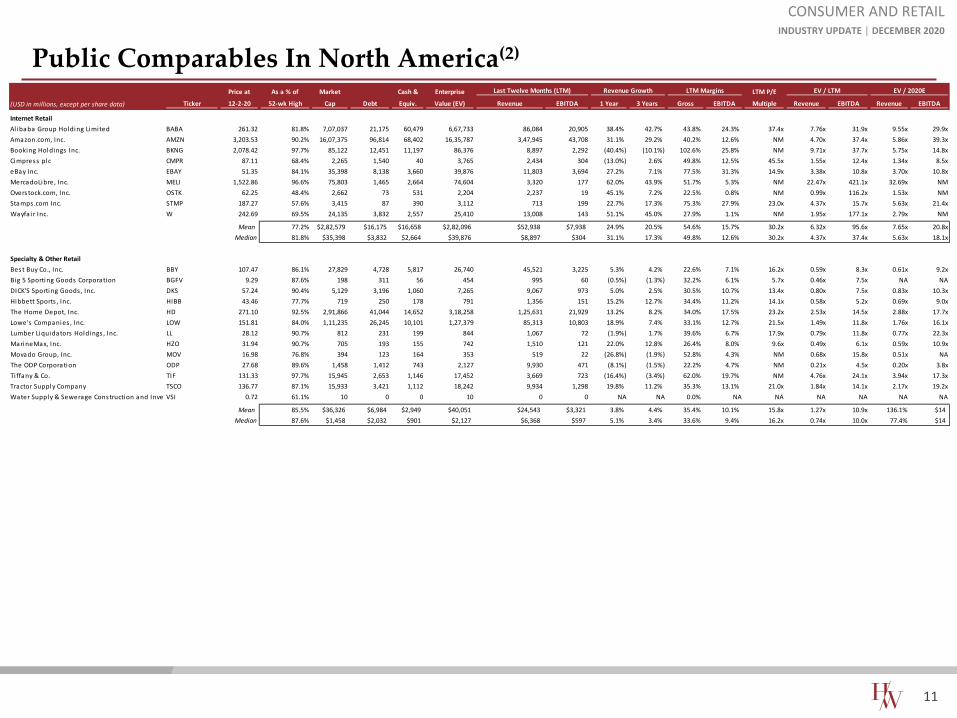
Internet RetailAl ibaba Group Holding Limited BABA 261.32 81.8% 7,07,037 21,175 60,479 6,67,733 86,084 20,905 38.4% 42.7% 43.8% 24.3% 37.4x 7.76x 31.9x 9.55x 29.9xAmazon.com, Inc. AMZN 3,203.53 90.2% 16,07,375 96,814 68,402 16,35,787 3,47,945 43,708 31.1% 29.2% 40.2% 12.6% NM 4.70x 37.4x 5.86x 39.3xBooking Holdings Inc. BKNG 2,078.42 97.7% 85,122 12,451 11,197 86,376 8,897 2,292 (40.4%) (10.1%) 102.6% 25.8% NM 9.71x 37.7x 5.75x 14.8xCimpress plc CMPR 87.11 68.4% 2,265 1,540 40 3,765 2,434 304 (13.0%) 2.6% 49.8% 12.5% 45.5x 1.55x 12.4x 1.34x 8.5xeBay Inc. EBAY 51.35 84.1% 35,398 8,138 3,660 39,876 11,803 3,694 27.2% 7.1% 77.5% 31.3% 14.9x 3.38x 10.8x 3.70x 10.8xMercadoLibre, Inc. MELI 1,522.86 96.6% 75,803 1,465 2,664 74,604 3,320 177 62.0% 43.9% 51.7% 5.3% NM 22.47x 421.1x 32.69x NMOverstock.com, Inc. OSTK 62.25 48.4% 2,662 73 531 2,204 2,237 19 45.1% 7.2% 22.5% 0.8% NM 0.99x 116.2x 1.53x NMStamps.com Inc. STMP 187.27 57.6% 3,415 87 390 3,112 713 199 22.7% 17.3% 75.3% 27.9% 23.0x 4.37x 15.7x 5.63x 21.4xWayfa i r Inc. W 242.69 69.5% 24,135 3,832 2,557 25,410 13,008 143 51.1% 45.0% 27.9% 1.1% NM 1.95x 177.1x 2.79x NM
Mean 77.2% $2,82,579 $16,175 $16,658 $2,82,096 $52,938 $7,938 24.9% 20.5% 54.6% 15.7% 30.2x 6.32x 95.6x 7.65x 20.8xMedian 81.8% $35,398 $3,832 $2,664 $39,876 $8,897 $304 31.1% 17.3% 49.8% 12.6% 30.2x 4.37x 37.4x 5.63x 18.1x
Specialty & Other RetailBest Buy Co., Inc. BBY 107.47 86.1% 27,829 4,728 5,817 26,740 45,521 3,225 5.3% 4.2% 22.6% 7.1% 16.2x 0.59x 8.3x 0.61x 9.2xBig 5 Sporting Goods Corporation BGFV 9.29 87.6% 198 311 56 454 995 60 (0.5%) (1.3%) 32.2% 6.1% 5.7x 0.46x 7.5x NA NADICK'S Sporting Goods , Inc. DKS 57.24 90.4% 5,129 3,196 1,060 7,265 9,067 973 5.0% 2.5% 30.5% 10.7% 13.4x 0.80x 7.5x 0.83x 10.3xHibbett Sports , Inc. HIBB 43.46 77.7% 719 250 178 791 1,356 151 15.2% 12.7% 34.4% 11.2% 14.1x 0.58x 5.2x 0.69x 9.0xThe Home Depot, Inc. HD 271.10 92.5% 2,91,866 41,044 14,652 3,18,258 1,25,631 21,929 13.2% 8.2% 34.0% 17.5% 23.2x 2.53x 14.5x 2.88x 17.7xLowe's Companies , Inc. LOW 151.81 84.0% 1,11,235 26,245 10,101 1,27,379 85,313 10,803 18.9% 7.4% 33.1% 12.7% 21.5x 1.49x 11.8x 1.76x 16.1xLumber Liquidators Holdings , Inc. LL 28.12 90.7% 812 231 199 844 1,067 72 (1.9%) 1.7% 39.6% 6.7% 17.9x 0.79x 11.8x 0.77x 22.3xMarineMax, Inc. HZO 31.94 90.7% 705 193 155 742 1,510 121 22.0% 12.8% 26.4% 8.0% 9.6x 0.49x 6.1x 0.59x 10.9xMovado Group, Inc. MOV 16.98 76.8% 394 123 164 353 519 22 (26.8%) (1.9%) 52.8% 4.3% NM 0.68x 15.8x 0.51x NAThe ODP Corporation ODP 27.68 89.6% 1,458 1,412 743 2,127 9,930 471 (8.1%) (1.5%) 22.2% 4.7% NM 0.21x 4.5x 0.20x 3.8xTi ffany & Co. TIF 131.33 97.7% 15,945 2,653 1,146 17,452 3,669 723 (16.4%) (3.4%) 62.0% 19.7% NM 4.76x 24.1x 3.94x 17.3xTractor Supply Company TSCO 136.77 87.1% 15,933 3,421 1,112 18,242 9,934 1,298 19.8% 11.2% 35.3% 13.1% 21.0x 1.84x 14.1x 2.17x 19.2xWater Supply & Sewerage Construction and Inves VSI 0.72 61.1% 10 0 0 10 0 0 NA NA 0.0% NA NA NA NA NA NA
Mean 85.5% $36,326 $6,984 $2,949 $40,051 $24,543 $3,321 3.8% 4.4% 35.4% 10.1% 15.8x 1.27x 10.9x 136.1% $14Median 87.6% $1,458 $2,032 $901 $2,127 $6,368 $597 5.1% 3.4% 33.6% 9.4% 16.2x 0.74x 10.0x 77.4% $14
Last Twelve Months (LTM) Revenue Growth LTM Margins EV / LTM EV / 2020E
11
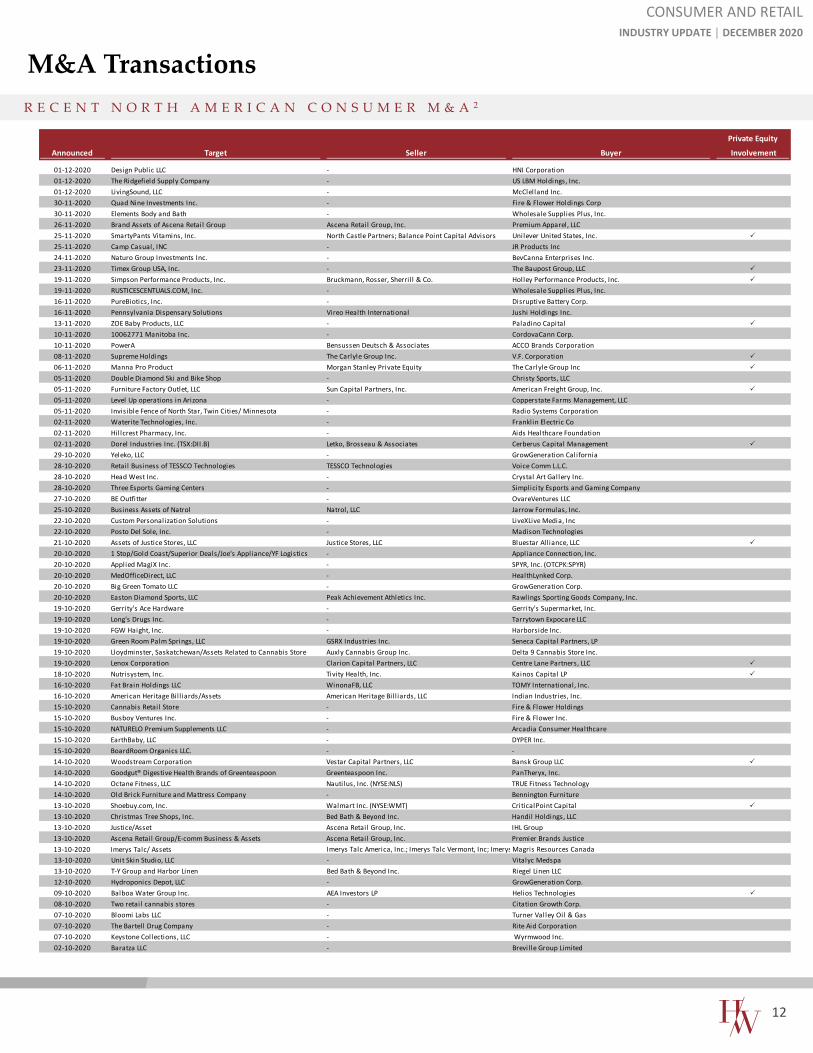
M&A TransactionsR E C E N T N O R T H A M E R I C A N C O N S U M E R M & A 2
CONSUMER AND RETAILINDUSTRY UPDATE │ DECEMBER 2020
Private Equity
Announced Target Seller Buyer Involvement
01-12-2020 Design Public LLC - HNI Corporation01-12-2020 The Ridgefield Supply Company - US LBM Holdings, Inc.01-12-2020 LivingSound, LLC - McClelland Inc.30-11-2020 Quad Nine Investments Inc. - Fire & Flower Holdings Corp30-11-2020 Elements Body and Bath - Wholesale Supplies Plus, Inc.26-11-2020 Brand Assets of Ascena Retail Group Ascena Retail Group, Inc. Premium Apparel, LLC25-11-2020 SmartyPants Vitamins, Inc. North Castle Partners; Balance Point Capital Advisors Unilever United States, Inc.
25-11-2020 Camp Casual, INC - JR Products Inc24-11-2020 Naturo Group Investments Inc. - BevCanna Enterprises Inc.23-11-2020 Timex Group USA, Inc. - The Baupost Group, LLC
19-11-2020 Simpson Performance Products, Inc. Bruckmann, Rosser, Sherril l & Co. Holley Performance Products, Inc.
19-11-2020 RUSTICESCENTUALS.COM, Inc. - Wholesale Supplies Plus, Inc.16-11-2020 PureBiotics, Inc. - Disruptive Battery Corp.16-11-2020 Pennsylvania Dispensary Solutions Vireo Health International Jushi Holdings Inc.13-11-2020 ZOE Baby Products, LLC - Paladino Capital
10-11-2020 10062771 Manitoba Inc. - CordovaCann Corp.10-11-2020 PowerA Bensussen Deutsch & Associates ACCO Brands Corporation08-11-2020 Supreme Holdings The Carlyle Group Inc. V.F. Corporation
06-11-2020 Manna Pro Product Morgan Stanley Private Equity The Carlyle Group Inc
05-11-2020 Double Diamond Ski and Bike Shop - Christy Sports, LLC05-11-2020 Furniture Factory Outlet, LLC Sun Capital Partners, Inc. American Freight Group, Inc.
05-11-2020 Level Up operations in Arizona - Copperstate Farms Management, LLC05-11-2020 Invisible Fence of North Star, Twin Cities/ Minnesota - Radio Systems Corporation02-11-2020 Waterite Technologies, Inc. - Franklin Electric Co02-11-2020 Hillcrest Pharmacy, Inc. - Aids Healthcare Foundation02-11-2020 Dorel Industries Inc. (TSX:DII.B) Letko, Brosseau & Associates Cerberus Capital Management
29-10-2020 Yeleko, LLC - GrowGeneration California28-10-2020 Retail Business of TESSCO Technologies TESSCO Technologies Voice Comm L.L.C.28-10-2020 Head West Inc. - Crystal Art Gallery Inc.28-10-2020 Three Esports Gaming Centers - Simplicity Esports and Gaming Company27-10-2020 BE Outfitter - OvareVentures LLC25-10-2020 Business Assets of Natrol Natrol, LLC Jarrow Formulas, Inc.22-10-2020 Custom Personalization Solutions - LiveXLive Media, Inc22-10-2020 Posto Del Sole, Inc. - Madison Technologies 21-10-2020 Assets of Justice Stores, LLC Justice Stores, LLC Bluestar All iance, LLC
20-10-2020 1 Stop/Gold Coast/Superior Deals/Joe's Appliance/YF Logistics - Appliance Connection, Inc.20-10-2020 Applied MagiX Inc. - SPYR, Inc. (OTCPK:SPYR)20-10-2020 MedOfficeDirect, LLC - HealthLynked Corp.20-10-2020 Big Green Tomato LLC - GrowGeneration Corp.20-10-2020 Easton Diamond Sports, LLC Peak Achievement Athletics Inc. Rawlings Sporting Goods Company, Inc.19-10-2020 Gerrity's Ace Hardware - Gerrity's Supermarket, Inc.19-10-2020 Long's Drugs Inc. - Tarrytown Expocare LLC19-10-2020 FGW Haight, Inc. - Harborside Inc.19-10-2020 Green Room Palm Springs, LLC GSRX Industries Inc. Seneca Capital Partners, LP19-10-2020 Lloydminster, Saskatchewan/Assets Related to Cannabis Store Auxly Cannabis Group Inc. Delta 9 Cannabis Store Inc.19-10-2020 Lenox Corporation Clarion Capital Partners, LLC Centre Lane Partners, LLC
18-10-2020 Nutrisystem, Inc. Tivity Health, Inc. Kainos Capital LP
16-10-2020 Fat Brain Holdings LLC WinonaFB, LLC TOMY International, Inc.16-10-2020 American Heritage Bil l iards/Assets American Heritage Bil l iards, LLC Indian Industries, Inc.15-10-2020 Cannabis Retail Store - Fire & Flower Holdings15-10-2020 Busboy Ventures Inc. - Fire & Flower Inc.15-10-2020 NATURELO Premium Supplements LLC - Arcadia Consumer Healthcare15-10-2020 EarthBaby, LLC - DYPER Inc.15-10-2020 BoardRoom Organics LLC. - -14-10-2020 Woodstream Corporation Vestar Capital Partners, LLC Bansk Group LLC
14-10-2020 Goodgut® Digestive Health Brands of Greenteaspoon Greenteaspoon Inc. PanTheryx, Inc.14-10-2020 Octane Fitness, LLC Nautilus, Inc. (NYSE:NLS) TRUE Fitness Technology14-10-2020 Old Brick Furniture and Mattress Company - Bennington Furniture13-10-2020 Shoebuy.com, Inc. Walmart Inc. (NYSE:WMT) CriticalPoint Capital
13-10-2020 Christmas Tree Shops, Inc. Bed Bath & Beyond Inc. Handil Holdings, LLC13-10-2020 Justice/Asset Ascena Retail Group, Inc. IHL Group13-10-2020 Ascena Retail Group/E-comm Business & Assets Ascena Retail Group, Inc. Premier Brands Justice13-10-2020 Imerys Talc/ Assets Imerys Talc America, Inc.; Imerys Talc Vermont, Inc; Imerys Magris Resources Canada13-10-2020 Unit Skin Studio, LLC - Vitalyc Medspa13-10-2020 T-Y Group and Harbor Linen Bed Bath & Beyond Inc. Riegel Linen LLC12-10-2020 Hydroponics Depot, LLC - GrowGeneration Corp.09-10-2020 Balboa Water Group Inc. AEA Investors LP Helios Technologies
08-10-2020 Two retail cannabis stores - Citation Growth Corp.07-10-2020 Bloomi Labs LLC - Turner Valley Oil & Gas07-10-2020 The Bartell Drug Company - Rite Aid Corporation07-10-2020 Keystone Collections, LLC - Wyrmwood Inc.02-10-2020 Baratza LLC - Brevil le Group Limited
12
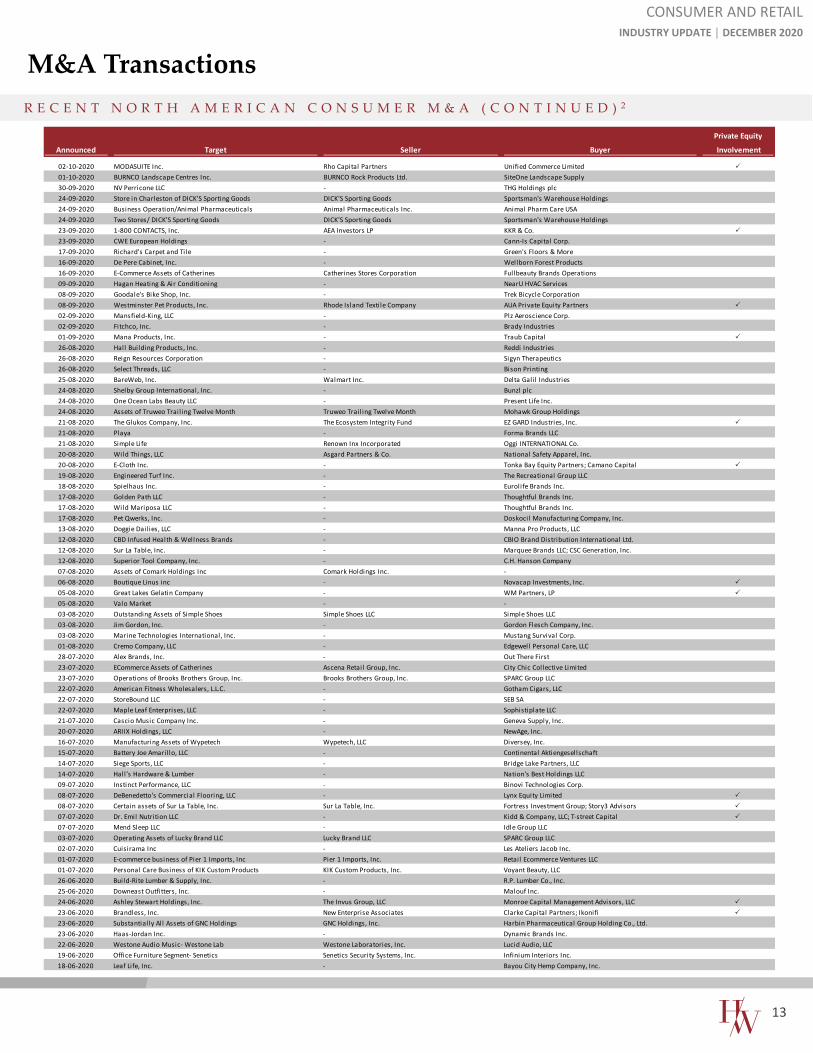
M&A TransactionsR E C E N T N O R T H A M E R I C A N C O N S U M E R M & A ( C O N T I N U E D ) 2
CONSUMER AND RETAILINDUSTRY UPDATE │ DECEMBER 2020
Private Equity
Announced Target Seller Buyer Involvement
02-10-2020 MODASUITE Inc. Rho Capital Partners Unified Commerce Limited
01-10-2020 BURNCO Landscape Centres Inc. BURNCO Rock Products Ltd. SiteOne Landscape Supply30-09-2020 NV Perricone LLC - THG Holdings plc24-09-2020 Store in Charleston of DICK'S Sporting Goods DICK'S Sporting Goods Sportsman's Warehouse Holdings24-09-2020 Business Operation/Animal Pharmaceuticals Animal Pharmaceuticals Inc. Animal Pharm Care USA24-09-2020 Two Stores/ DICK'S Sporting Goods DICK'S Sporting Goods Sportsman's Warehouse Holdings23-09-2020 1-800 CONTACTS, Inc. AEA Investors LP KKR & Co.
23-09-2020 CWE European Holdings - Cann-Is Capital Corp.17-09-2020 Richard's Carpet and Tile - Green's Floors & More16-09-2020 De Pere Cabinet, Inc. - Wellborn Forest Products16-09-2020 E-Commerce Assets of Catherines Catherines Stores Corporation Fullbeauty Brands Operations09-09-2020 Hagan Heating & Air Conditioning - NearU HVAC Services08-09-2020 Goodale's Bike Shop, Inc. - Trek Bicycle Corporation08-09-2020 Westminster Pet Products, Inc. Rhode Island Textile Company AUA Private Equity Partners
02-09-2020 Mansfield-King, LLC - Plz Aeroscience Corp.02-09-2020 Fitchco, Inc. - Brady Industries01-09-2020 Mana Products, Inc. - Traub Capital
26-08-2020 Hall Building Products, Inc. - Reddi Industries26-08-2020 Reign Resources Corporation - Sigyn Therapeutics26-08-2020 Select Threads, LLC - Bison Printing25-08-2020 BareWeb, Inc. Walmart Inc. Delta Gali l Industries24-08-2020 Shelby Group International, Inc. - Bunzl plc24-08-2020 One Ocean Labs Beauty LLC - Present Life Inc.24-08-2020 Assets of Truweo Trail ing Twelve Month Truweo Trail ing Twelve Month Mohawk Group Holdings21-08-2020 The Glukos Company, Inc. The Ecosystem Integrity Fund EZ GARD Industries, Inc.
21-08-2020 Playa - Forma Brands LLC21-08-2020 Simple Life Renown Inx Incorporated Oggi INTERNATIONAL Co.20-08-2020 Wild Things, LLC Asgard Partners & Co. National Safety Apparel, Inc.20-08-2020 E-Cloth Inc. - Tonka Bay Equity Partners; Camano Capital
19-08-2020 Engineered Turf Inc. - The Recreational Group LLC18-08-2020 Spielhaus Inc. - Eurolife Brands Inc.17-08-2020 Golden Path LLC - Thoughtful Brands Inc.17-08-2020 Wild Mariposa LLC - Thoughtful Brands Inc.17-08-2020 Pet Qwerks, Inc. - Doskocil Manufacturing Company, Inc.13-08-2020 Doggie Dail ies, LLC - Manna Pro Products, LLC12-08-2020 CBD Infused Health & Wellness Brands - CBIO Brand Distribution International Ltd.12-08-2020 Sur La Table, Inc. - Marquee Brands LLC; CSC Generation, Inc.12-08-2020 Superior Tool Company, Inc. - C.H. Hanson Company07-08-2020 Assets of Comark Holdings Inc Comark Holdings Inc. -06-08-2020 Boutique Linus inc - Novacap Investments, Inc.
05-08-2020 Great Lakes Gelatin Company - WM Partners, LP
05-08-2020 Valo Market - -03-08-2020 Outstanding Assets of Simple Shoes Simple Shoes LLC Simple Shoes LLC03-08-2020 Jim Gordon, Inc. - Gordon Flesch Company, Inc.03-08-2020 Marine Technologies International, Inc. - Mustang Survival Corp.01-08-2020 Cremo Company, LLC - Edgewell Personal Care, LLC28-07-2020 Alex Brands, Inc. - Out There First23-07-2020 ECommerce Assets of Catherines Ascena Retail Group, Inc. City Chic Collective Limited23-07-2020 Operations of Brooks Brothers Group, Inc. Brooks Brothers Group, Inc. SPARC Group LLC22-07-2020 American Fitness Wholesalers, L.L.C. - Gotham Cigars, LLC22-07-2020 StoreBound LLC - SEB SA22-07-2020 Maple Leaf Enterprises, LLC - Sophistiplate LLC21-07-2020 Cascio Music Company Inc. - Geneva Supply, Inc.20-07-2020 ARIIX Holdings, LLC - NewAge, Inc.16-07-2020 Manufacturing Assets of Wypetech Wypetech, LLC Diversey, Inc.15-07-2020 Battery Joe Amaril lo, LLC - Continental Aktiengesellschaft14-07-2020 Siege Sports, LLC - Bridge Lake Partners, LLC14-07-2020 Hall’s Hardware & Lumber - Nation's Best Holdings LLC09-07-2020 Instinct Performance, LLC - Binovi Technologies Corp.08-07-2020 DeBenedetto's Commercial Flooring, LLC - Lynx Equity Limited
08-07-2020 Certain assets of Sur La Table, Inc. Sur La Table, Inc. Fortress Investment Group; Story3 Advisors
07-07-2020 Dr. Emil Nutrition LLC - Kidd & Company, LLC; T-street Capital
07-07-2020 Mend Sleep LLC - Idle Group LLC03-07-2020 Operating Assets of Lucky Brand LLC Lucky Brand LLC SPARC Group LLC02-07-2020 Cuisirama Inc - Les Ateliers Jacob Inc.01-07-2020 E-commerce business of Pier 1 Imports, Inc Pier 1 Imports, Inc. Retail Ecommerce Ventures LLC01-07-2020 Personal Care Business of KIK Custom Products KIK Custom Products, Inc. Voyant Beauty, LLC26-06-2020 Build-Rite Lumber & Supply, Inc. - R.P. Lumber Co., Inc.25-06-2020 Downeast Outfitters, Inc. - Malouf Inc.24-06-2020 Ashley Stewart Holdings, Inc. The Invus Group, LLC Monroe Capital Management Advisors, LLC
23-06-2020 Brandless, Inc. New Enterprise Associates Clarke Capital Partners; Ikonifi
23-06-2020 Substantially All Assets of GNC Holdings GNC Holdings, Inc. Harbin Pharmaceutical Group Holding Co., Ltd.23-06-2020 Haas-Jordan Inc. - Dynamic Brands Inc.22-06-2020 Westone Audio Music- Westone Lab Westone Laboratories, Inc. Lucid Audio, LLC19-06-2020 Office Furniture Segment- Senetics Senetics Security Systems, Inc. Infinium Interiors Inc.18-06-2020 Leaf Life, Inc. - Bayou City Hemp Company, Inc.
13
H A R R I S W I L L I A M S C O N S U M E R T E A M
M&A Transactions
CONSUMER AND RETAILINDUSTRY UPDATE │ DECEMBER 2020
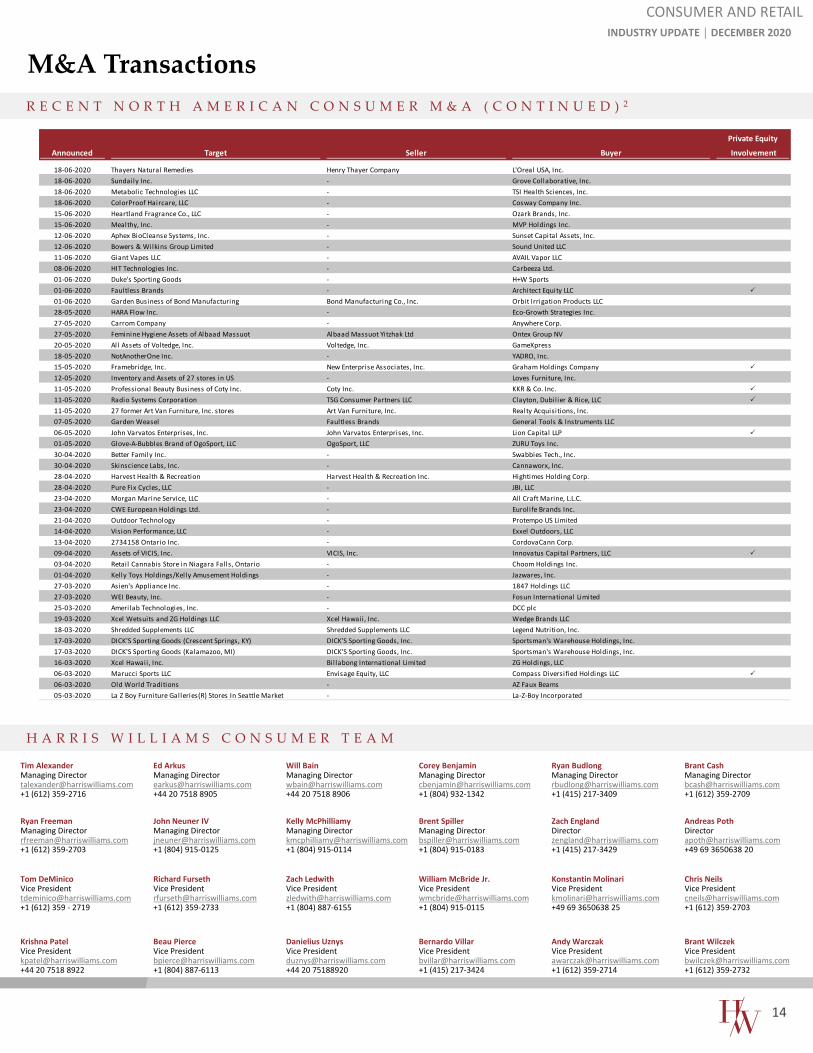
R E C E N T N O R T H A M E R I C A N C O N S U M E R M & A ( C O N T I N U E D ) 2
Private Equity
Announced Target Seller Buyer Involvement
18-06-2020 Thayers Natural Remedies Henry Thayer Company L'Oreal USA, Inc.18-06-2020 Sundaily Inc. - Grove Collaborative, Inc.18-06-2020 Metabolic Technologies LLC - TSI Health Sciences, Inc.18-06-2020 ColorProof Haircare, LLC - Cosway Company Inc.15-06-2020 Heartland Fragrance Co., LLC - Ozark Brands, Inc.15-06-2020 Mealthy, Inc. - MVP Holdings Inc.12-06-2020 Aphex BioCleanse Systems, Inc. - Sunset Capital Assets, Inc.12-06-2020 Bowers & Wilkins Group Limited - Sound United LLC11-06-2020 Giant Vapes LLC - AVAIL Vapor LLC08-06-2020 HIT Technologies Inc. - Carbeeza Ltd.01-06-2020 Duke's Sporting Goods - H+W Sports01-06-2020 Faultless Brands - Architect Equity LLC
01-06-2020 Garden Business of Bond Manufacturing Bond Manufacturing Co., Inc. Orbit Irrigation Products LLC28-05-2020 HARA Flow Inc. - Eco-Growth Strategies Inc.27-05-2020 Carrom Company - Anywhere Corp.27-05-2020 Feminine Hygiene Assets of Albaad Massuot Albaad Massuot Yitzhak Ltd Ontex Group NV20-05-2020 All Assets of Voltedge, Inc. Voltedge, Inc. GameXpress18-05-2020 NotAnotherOne Inc. - YADRO, Inc.15-05-2020 Framebridge, Inc. New Enterprise Associates, Inc. Graham Holdings Company
12-05-2020 Inventory and Assets of 27 stores in US - Loves Furniture, Inc.11-05-2020 Professional Beauty Business of Coty Inc. Coty Inc. KKR & Co. Inc.
11-05-2020 Radio Systems Corporation TSG Consumer Partners LLC Clayton, Dubilier & Rice, LLC
11-05-2020 27 former Art Van Furniture, Inc. stores Art Van Furniture, Inc. Realty Acquisitions, Inc.07-05-2020 Garden Weasel Faultless Brands General Tools & Instruments LLC06-05-2020 John Varvatos Enterprises, Inc. John Varvatos Enterprises, Inc. Lion Capital LLP
01-05-2020 Glove-A-Bubbles Brand of OgoSport, LLC OgoSport, LLC ZURU Toys Inc.30-04-2020 Better Family Inc. - Swabbies Tech., Inc.30-04-2020 Skinscience Labs, Inc. - Cannaworx, Inc.28-04-2020 Harvest Health & Recreation Harvest Health & Recreation Inc. Hightimes Holding Corp.28-04-2020 Pure Fix Cycles, LLC - JBI, LLC23-04-2020 Morgan Marine Service, LLC - All Craft Marine, L.L.C.23-04-2020 CWE European Holdings Ltd. - Eurolife Brands Inc.21-04-2020 Outdoor Technology - Protempo US Limited14-04-2020 Vision Performance, LLC - Exxel Outdoors, LLC13-04-2020 2734158 Ontario Inc. - CordovaCann Corp.09-04-2020 Assets of VICIS, Inc. VICIS, Inc. Innovatus Capital Partners, LLC
03-04-2020 Retail Cannabis Store in Niagara Falls, Ontario - Choom Holdings Inc.01-04-2020 Kelly Toys Holdings/Kelly Amusement Holdings - Jazwares, Inc.27-03-2020 Asien's Appliance Inc. - 1847 Holdings LLC27-03-2020 WEI Beauty, Inc. - Fosun International Limited25-03-2020 Amerilab Technologies, Inc. - DCC plc19-03-2020 Xcel Wetsuits and ZG Holdings LLC Xcel Hawaii, Inc. Wedge Brands LLC18-03-2020 Shredded Supplements LLC Shredded Supplements LLC Legend Nutrition, Inc.17-03-2020 DICK'S Sporting Goods (Crescent Springs, KY) DICK'S Sporting Goods, Inc. Sportsman's Warehouse Holdings, Inc.17-03-2020 DICK'S Sporting Goods (Kalamazoo, MI) DICK'S Sporting Goods, Inc. Sportsman's Warehouse Holdings, Inc.16-03-2020 Xcel Hawaii, Inc. Bil labong International Limited ZG Holdings, LLC06-03-2020 Marucci Sports LLC Envisage Equity, LLC Compass Diversified Holdings LLC
06-03-2020 Old World Traditions - AZ Faux Beams05-03-2020 La Z Boy Furniture Galleries(R) Stores In Seattle Market - La-Z-Boy Incorporated
Tim AlexanderManaging [email protected]+1 (612) 359-2716
Brant CashManaging [email protected]+1 (612) 359-2709
Ed ArkusManaging [email protected]+44 20 7518 8905
Ryan BudlongManaging [email protected]+1 (415) 217-3409
Zach LedwithVice [email protected]+1 (804) 887-6155
Andy WarczakVice [email protected]+1 (612) 359-2714
Zach [email protected]+1 (415) 217-3429
Beau PierceVice [email protected]+1 (804) 887-6113
John Neuner IVManaging [email protected]+1 (804) 915-0125
Brent SpillerManaging [email protected]+1 (804) 915-0183
Will BainManaging [email protected]+44 20 7518 8906
Corey BenjaminManaging [email protected]+1 (804) 932-1342
Ryan FreemanManaging [email protected]+1 (612) 359-2703
Chris NeilsVice President [email protected]+1 (612) 359-2703
Brant WilczekVice [email protected]+1 (612) 359-2732
Andreas [email protected]+49 69 3650638 20
Kelly McPhilliamyManaging [email protected]+1 (804) 915-0114
William McBride Jr. Vice [email protected]+1 (804) 915-0115
Konstantin MolinariVice [email protected]+49 69 3650638 25
Danielius UznysVice [email protected]+44 20 75188920
Tom DeMinicoVice [email protected]+1 (612) 359 - 2719
Krishna PatelVice [email protected]+44 20 7518 8922
Richard FursethVice [email protected]+1 (612) 359-2733
Bernardo VillarVice President [email protected]+1 (415) 217-3424
14
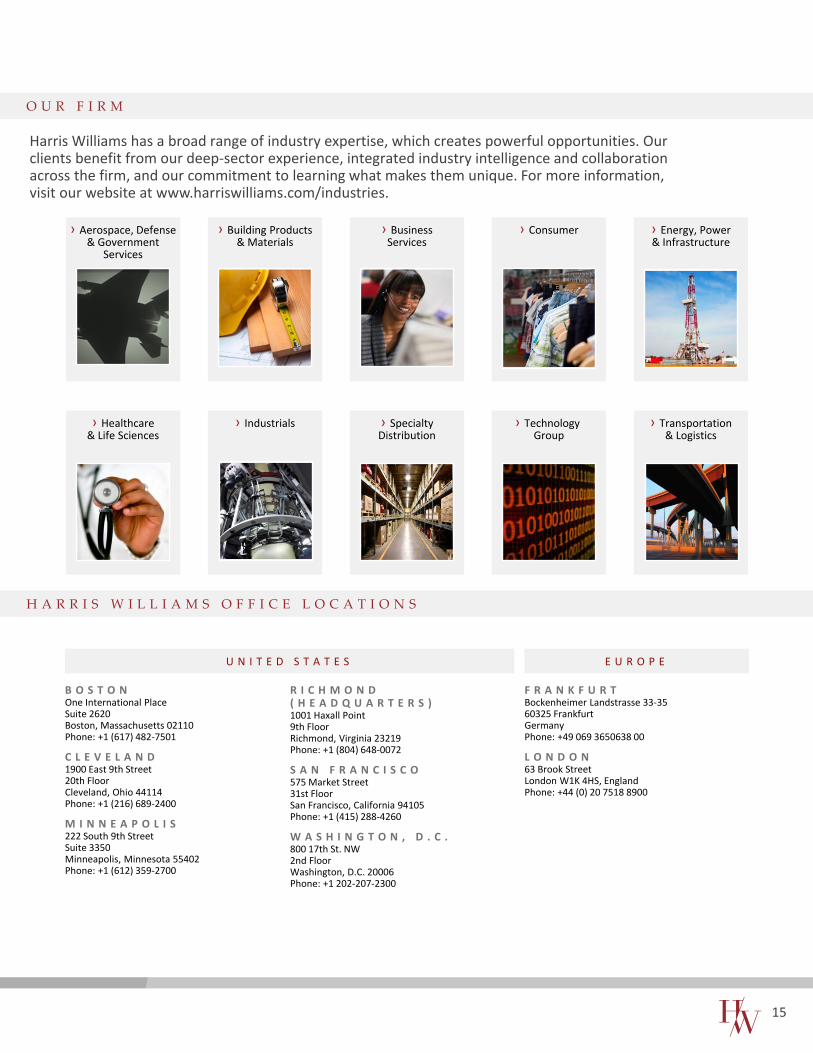
O U R F I R M
Harris Williams has a broad range of industry expertise, which creates powerful opportunities. Our clients benefit from our deep-sector experience, integrated industry intelligence and collaboration across the firm, and our commitment to learning what makes them unique. For more information, visit our website at www.harriswilliams.com/industries.
› Energy, Power& Infrastructure
› Industrials› Healthcare& Life Sciences
› Transportation& Logistics
› Aerospace, Defense & Government
Services
› BusinessServices
› Building Products& Materials
› TechnologyGroup
› SpecialtyDistribution
› Consumer
H A R R I S W I L L I A M S O F F I C E L O C A T I O N S
U N I T E D S T A T E S E U R O P E
B O S T O NOne International PlaceSuite 2620Boston, Massachusetts 02110Phone: +1 (617) 482-7501
C L E V E L A N D1900 East 9th Street20th FloorCleveland, Ohio 44114Phone: +1 (216) 689-2400
M I N N E A P O L I S222 South 9th StreetSuite 3350Minneapolis, Minnesota 55402Phone: +1 (612) 359-2700
R I C H M O N D ( H E A D Q U A R T E R S )1001 Haxall Point9th FloorRichmond, Virginia 23219Phone: +1 (804) 648-0072
S A N F R A N C I S C O575 Market Street31st FloorSan Francisco, California 94105Phone: +1 (415) 288-4260
W A S H I N G T O N , D . C .800 17th St. NW2nd FloorWashington, D.C. 20006Phone: +1 202-207-2300
F R A N K F U R TBockenheimer Landstrasse 33-3560325 FrankfurtGermanyPhone: +49 069 3650638 00
L O N D O N63 Brook StreetLondon W1K 4HS, EnglandPhone: +44 (0) 20 7518 8900
15
Harris WilliamsS O U R C E S
D I S C L O S U R E S
1. Pitchbook
2. Capital IQ
The information and views contained in this report were prepared by Harris Williams LLC (“Harris Williams”). It is not a research report, as such term is defined by applicable law and regulations, and is provided for informational purposes only. It is not to be construed as an offer to buy or sell or a solicitation of an offer to buy or sell any securities or financial instruments or to participate in any particular trading strategy. The information contained herein is believed by Harris Williams to be reliable but Harris Williams makes no representation as to the accuracy or completeness of such information. Harris Williams and/or its affiliates may be market makers or specialists in, act as advisers or lenders to, have positions in and effect transactions in securities of companies mentioned herein and also may provide, may have provided, or may seek to provide investment banking services for those companies. In addition, Harris Williams and/or its affiliates or their respective officers, directors and employees may hold long or short positions in the securities, options thereon or other related financial products of companies discussed herein. Opinions, estimates and projections in this report constitute Harris Williams’ judgment and are subject to change without notice. The securities and financial instruments discussed in this report may not be suitable for all investors and investors must make their own investment decisions using their own independent advisors as they believe necessary and based upon their specific financial situations and investment objectives. Also, past performance is not necessarily indicative of future results. No part of this material may be copied or duplicated in any form or by any means, or redistributed, without Harris Williams’ prior written consent.
Harris Williams LLC is a registered broker-dealer and member of FINRA and SIPC. Harris Williams & Co. Ltd is a private limited company incorporated under English law with its registered office at 8th Floor, 20 Farringdon Street, London EC4A 4AB, UK, registered with the Registrar of Companies for England and Wales (registration number 07078852). Harris Williams & Co. Ltd is authorized and regulated by the Financial Conduct Authority. Harris Williams & Co. Corporate Finance Advisors GmbH is registered in the commercial register of the local court of Frankfurt am Main, Germany, under HRB 107540. The registered address is Bockenheimer Landstrasse 33-35, 60325 Frankfurt am Main, Germany (email address: [email protected]). Geschäftsführer/Directors: Jeffery H. Perkins, Paul Poggi. (VAT No. DE321666994). Harris Williams is a trade name under which Harris Williams LLC, Harris Williams & Co. Ltd and Harris Williams & Co. Corporate Finance Advisors GmbH conduct business.
Copyright© 2020 Harris Williams, all rights reserved.
CONSUMER AND RETAILINDUSTRY UPDATE │ DECEMBER 2020
16