consumer behaviour in food and beverage...
TRANSCRIPT

CONSUMER BEHAVIOUR IN FOOD AND BEVERAGE
(F&B) INDUSTRY: A CASE STUDY OF FAST FOOD
INDUSTRY
THESIS
SUBMITTED TO UNIVERSITY OF JAMMU
FOR THE AWARD OF DEGREE OF
DOCTOR OF PHILOSOPHY
IN
MANAGEMENT
BY
SANDEEP SINGH CHIB
SUPERVISORS
PROFESSOR M.R RANA
The Business School, University of Jammu.
DR. VINAY CHAUHAN
Associate Professor, The Business School, University of Jammu.
FACULTY OF BUSINESS STUDIES
UNIVERSITY OF JAMMU, JAMMU.
NOVEMBER, 2012.
CERTIFICATE
Sandeep Singh Chib, who was registered for the degree of Ph.D. under our supervision,
has completed his work. The exact title of his thesis is “CONSUMER BEHAVIOUR IN
FOOD AND BEVERAGE (F&B) INDUSTRY: A CASE STUDY OF FAST FOOD
INDUSTRY”.
We certify that he has worked under our supervision and the work done by him is original
and worthy of consideration for the award of Degree of DOCTOR OF PHILOSOPHY
IN MANAGEMENT.
We further certify that:
1. The thesis embodies the work of the candidate himself;
2. The candidate worked under our supervision for the period required under
statues;
3. The candidate has put in the required attendance in the Department during
the period;
4. The candidate has fulfilled the Statutory conditions as laid down in Section
18 of Statutes Governing Doctor of Philosophy in Management; and
5. The conduct of the scholar remained satisfactory during the period of
research.
Dated:
Prof. M.R. Rana Dr. Vinay Chauhan
The Business School The Business School
University of Jammu University of Jammu
Jammu Jammu

DECLARATION
I, Sandeep Singh Chib, hereby declare that the thesis entitled “CONSUMER
BEHAVIOUR IN FOOD AND BEVERAGE (F&B) INDUSTRY: A CASE STUDY
OF FAST FOOD INDUSTRY” submitted to the University of Jammu for the award of
Degree of Doctor of Philosophy in Management, is an original research work carried
out by me in The Business School, University of Jammu during the period 2009-2012
under the supervision of Prof. M.R. Rana, The Business School, University of Jammu
and Dr. Vinay Chauhan, The Business School, University of Jammu. Any extract of
this research in part or as a whole has not been included, incorporated or added to any
other work or similar title by any scholar in any other University.
Date: Sandeep Singh Chib

DEDICATED
TO
MY FATHER, MOTHER, SISTER AND WIFE
FOR THEIR CONSTANT SUPPORT AND
ENCOURAGEMENT DURING THE WHOLE
RESEARCH PROCESS

CONTENTS
Acknowledgement
Preface …………………………………………………………………… (i-ii)
List of tables ……………………………………………………………... (iii-v)
List of abbreviations …………………………………………………….. (vi-viii)
Chapter 1 Introduction (1-32)
1.1 Fast Food and Beverage Industry in Economic Environment 1
1.2 Emerging Trends in Fast Food and Beverage Industry 4
1.3 Success Drivers of Fast Food and Beverage Industry 7
1.4 Consumer Behaviour in Fast Food and Beverage Industry 11
Chapter 2 Review of Literature and Research Gap (33-60)
2.1 Review of Literature 33
2.2 Research Gap and Rationale of the Study 54
Chapter 3 Research Design and Methodology (61-73)
3.1 Objectives of the study 61
3.2 Hypothesis of the Study 62
3.3 Scope of the Study 62

3.4 Data Source 62
3.5 Sample Design 63
3.6 Instrument Development 63
3.7 Statistical Tools and Techniques used in the Study 65
3.8 Data Purification through Factor Analysis 71
3.9 Organisation of the Study 72
3.10 Limitation of the Study 73
3.11 Future Relevance of the Study 73
Chapter 4 Organisational Profile (74-100)
4.1 McDonald’s 74
4.2 KFC (Kentucky Fried Chicken) 81
4.3 Domino’s 88
4.4 Pizza Hut 94
Chapter 5 Analysis and Interpretation (101-150)
5.1 Demographic Profile of the Respondents 101
5.2 Customer Satisfaction 103
5.3 Service Quality 122
5.4 Pricing Policy 130
5.5 Brand Loyalty 139

5.6 Effect of Brand Loyalty on Customer Satisfaction 144
5.7 Effect of Service Quality on Customer Satisfaction 147
5.8 Hypothesis Testing 149
Chapter 6 Findings and Suggestions (151-162)
6.1 Findings of the Study 151
6.2 Suggestions 161
Bibliography (163-182)
Annexure (183-186)

Acknowledgement
It is an opportunity to express my heartfelt appreciation for those who helped me in the
process of completing my doctoral research work.
I owe my sincere gratitude to my research guide Dr. M.R. Rana for being an invariable
source of motivation and inspiration who have led me through this research work
successfully.
I am extremely thankful to Dr. Vinay Chauhan for the efforts and time he has conferred
towards the successful accomplishment of this piece of research work and for being a
source of encouragement and impetus which has facilitated in the successful completion
of this arduous task. Moreover, I am obliged to both my guide and co-guide for helping
me in developing and nurturing my research acumen.
It is a privilege to express my sincere thanks to Prof. Versha Mehta Director of The
Business School University of Jammu, for being supportive whenever I approached her
for help.
I extend my gratitude and thank all the faculty members of The Business School specially
Prof. Keshav Sharma, Prof. Alka Shrma, Dr. Sameer Gupta and Dr. Komal Nagar for
extending their co-operation and help whenever seeked for.
I owe my gratitude to the library staff of The Business School for helping me with the
books and journals as and when required by me.
I express my thanks to all other non-teaching staff members of The Business School for
the support they rendered me throughout my research work.
I am also thankful to the scholars of TBS for their co-operation and help they extended
towards me.
I am thankful to the library staff of Shri. Mata Vaishnou Devi University for providing
me access to the literature concerning my research work.
I give my heartfelt thanks to my friend Associate Professor Pabtra Jenha (Shri Mata
Vaishno Devi University) and Professor B. P. Yadav (Rani Durgavati Vishwavidyalaya,
Jabalpur) who have always been inspiring and helping me in my research work.
I express my thanks to my parents Col. B.S Chib and Mrs. Raj Chib, my sister Miss.
Anupama Chib and wife Mrs. Sushma Chib for being supportive and helpful in many
ways to accomplish this tedious task.
Above all, I express my deep gratitude to the Goddess Kali who blessed me and made me
capable for accomplishing this research work.
Date: Sandeep Singh Chib

Preface
The process of understanding the consumer behaviour in fast food and beverage industry
helps those incumbent business organisations which are operational in fast food and
beverage industry to devise pristine strategies which can accommodate the organisations
in achieving their short term and long term objectives. Now days, the concept of
consumer behaviour has gained tremendous attention of the academia and the industry
simultaneously as it affects the operational efficiency and performance of every
organisation. Moreover, it has been realised that by precisely interpreting consumer
behaviour, the business organisations can elevate the customer satisfaction level by
adjusting their operations in accordance to the fluctuating needs and requirements of the
customers.
India has recently been exposed to the globalisation and the same is true for the fast food
and beverage industry. Hence, this industry is immature and dearth of research pertaining
to important issues in fast food industry related to the effect of demographics on
consumer satisfaction, relationship between service quality and the brand loyalty,
relationship between pricing strategy and customer satisfaction has engendered a need to
undertake research work associated with the above mentioned concepts. Furthermore, the
research will facilitate in bridging the gap between the theory and the practice which has
been identified in number of studies as well as has been surfaced in various forms. As a
result of which there exists a sense of dissatisfaction between academicians and industrial
populate. Additionally, the study holds importance due to its empirical nature in the area
of consumer behaviour pertaining to the fast food industry, especially in the Indian
context, as the work done is diminutive in this regard. This study is a contribution to the
literature on consumer behaviour in fast food industry. In addition, it also has favourable
implications for students, academicians and industry people.
The study has been exhibited in six chapters, where the first chapter consists of the
introduction of the topic, scope of the study, justification, objectives and hypothesis. The
second chapter covers the review of literature pertaining to the study area. The third
chapter divulges the research design and methodology. This part of the study discuses the
information regarding sample design, data source, developing instrument, statistical tools
used in the study, chapter plan, limitations of the study and the future relevance of the
study. Additionally, the fourth chapter consists of the profiles of fast food companies like
KFC, Domino’s, Pizza Hut and McDonald’s which are operating in national capital
region of India. The fifth chapter deals with the analysis and interpretation of the results
derived by applying
various relevant statistical tools and techniques to the data. Finally, the sixth chapter
reveals the summary of the research findings and highlights the conclusion and
suggestions emerging from the discussions.

List of Tables
5.1 Demographic Profile of the Respondents 101
5.2 Customers Satisfaction Index in the Fast Food Industry 103
5.2.1 Comparative Analysis of Customer Satisfaction Among the
Selected Organisations 106
5.2.2 (a) Satisfaction Level of Customers of Pizza Hut, Domino’s, KFC,
Mc Donald 108
5.2.2 (b) ANOVA Table 109
5.2.3 Customer Satisfaction on the Basis of Demographics 110
5.2.4 KMO and Bartlett’s Test 112
5.2.5 Factor Analysis of Customer Satisfaction Statements 113
5.2.7 (a) Correlation between the Factors SPA, PD, WMS, TS, CIS,
MTWS, PA, UOS and AKOW 118
5.2.7 (b) Statement Wise Customer Satisfaction Index after Factor Analysis 119
5.2.8 (a) Coefficient of Regression 121
5.2.8 (b) Multiple Correlation and Multiple Regression 122
5.3.1 Statement Wise Service Quality Index in Fast Food Industry 123
5.3.2 Statement Wise Service Quality Index in Fast Food Industry After
Factor Analysis 125
5.3.3 Comparative Analysis of Service Quality among the Selected
Organisations 126
5.3.4 Correlation between the Factors Tangibles, Responsiveness,
Assistance, Empathy and Reliability 127
5.3.5 (a) Coefficient of Regression 128
5.3.5 (b) Multiple Regression 129
5.4.1 Statement Wise Pricing Index 130
5.4.2 Comparative Analysis of Pricing among the Selected Organisations 132
5.4.3 Correlation between Statements of Pricing 134
5.4.4 (a) Coefficient of Regression 135
5.4.4 (b) Multiple Correlations and Multiple Regression 136
5.4.5 (a) Correlation between Overall Pricing and Overall Customer
Satisfaction 137
5.4.5 (b) Coefficient of Regression 138
5.4.5 (c) Regression between Overall Pricing and Overall Customer
Satisfaction 138
5.5.1 Statement Wise Branding Index 139
5.5.2 Comparative Analysis of Brand Loyalty among the Selected
Organisations 140
5.5.3 Correlation between Statements of Branding 142
5.5.4 (a) Coefficient of Regression 143

5.5.4 (b) Multiple Correlation and Multiple Regression 144
5.6.1 Correlation between Overall Brand Loyalty and Overall Customer
Satisfaction 145
5.6.2 (a) Coefficient of Regression 146
5.6.2 (b) Regression between Brand Loyalty and Customer Satisfaction 146
5.7.1 Correlation between Service Quality and Customer Satisfaction 147
5.7.2 (a) Coefficient of Regression 148
5.7.2 (b) Regression between Service Quality and Customer Satisfaction 149
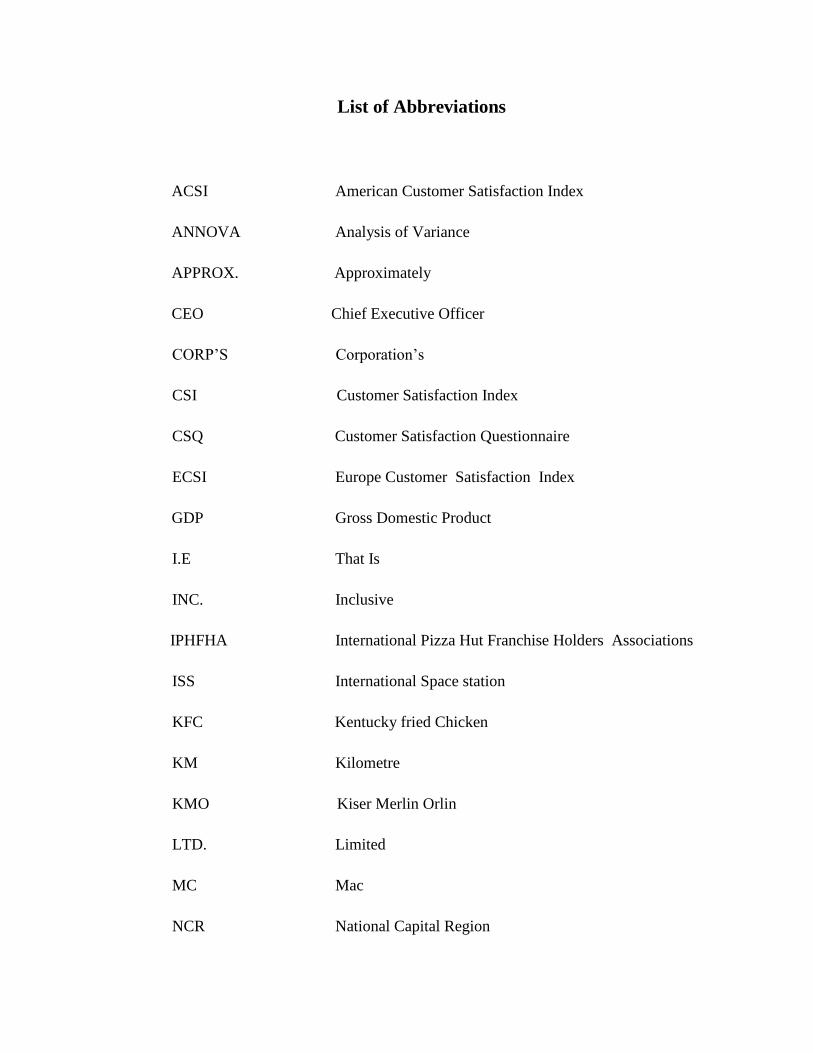
List of Abbreviations
ACSI American Customer Satisfaction Index
ANNOVA Analysis of Variance
APPROX. Approximately
CEO Chief Executive Officer
CORP’S Corporation’s
CSI Customer Satisfaction Index
CSQ Customer Satisfaction Questionnaire
ECSI Europe Customer Satisfaction Index
GDP Gross Domestic Product
I.E That Is
INC. Inclusive
IPHFHA International Pizza Hut Franchise Holders Associations
ISS International Space station
KFC Kentucky fried Chicken
KM Kilometre
KMO Kiser Merlin Orlin
LTD. Limited
MC Mac
NCR National Capital Region
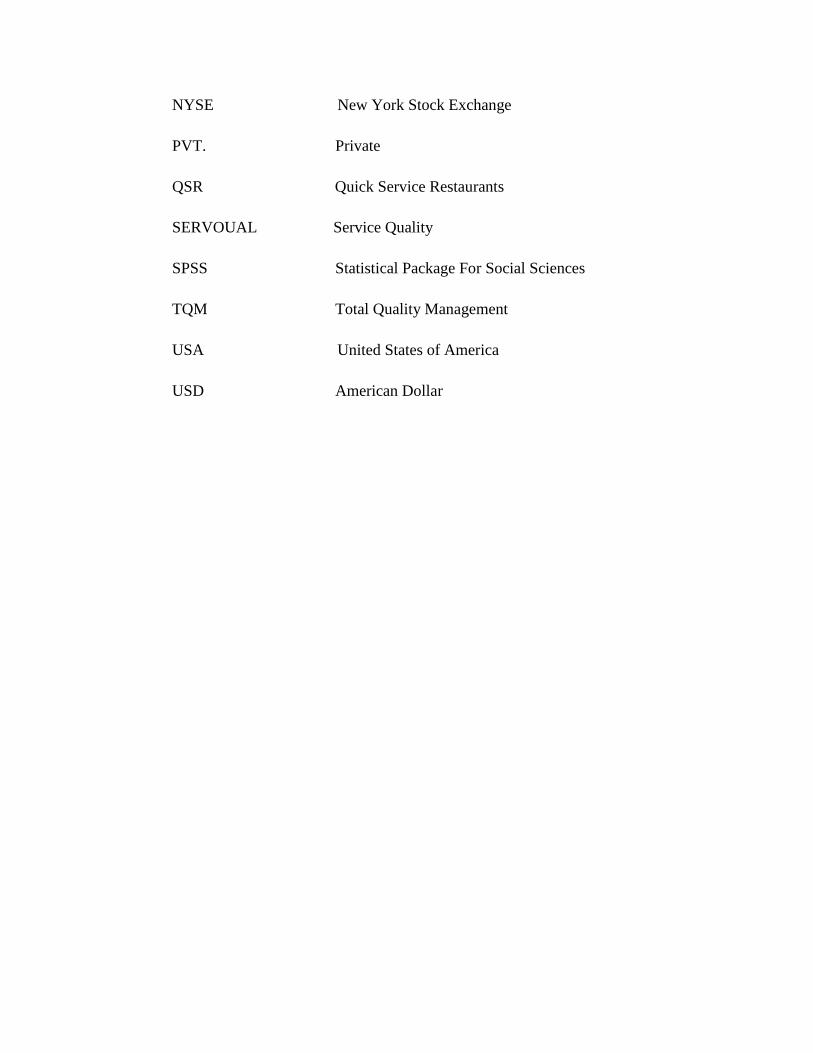
NYSE New York Stock Exchange
PVT. Private
QSR Quick Service Restaurants
SERVOUAL Service Quality
SPSS Statistical Package For Social Sciences
TQM Total Quality Management
USA United States of America
USD American Dollar

Chapter – I
Introduction

Chapter 1 Introduction (1-32)
1.1 Fast Food and Beverage Industry in Economic Environment 1
1.2 Emerging Trends in Fast Food and Beverage Industry 4
1.3 Success Drivers of Fast Food and Beverage Industry 7
1.4 Consumer Behaviour in Fast Food and Beverage Industry 11
1.4.1 Customer Satisfaction and Fast Food and Beverage Industry 15
1.4.2 Brand Loyalty in Fast Food and Beverage Industry 18
1.4.3 Pricing in Fast Food and Beverage Industry 21
1.4.4 Service Quality in Fast Food and Beverage Industry 25
1.1 FAST FOOD AND BEVERAGE INDUSTRY IN ECONOMIC
ENVIRONMENT
Fast food and beverage industry has shown phenomenal growth because of innovation,
quality control and competitive pricing. Fast food restaurants represent one of the largest
segments of the food industry. In 2006, the global fast food market grew by 4.8 percent
reaching a value of 102.4 billion Pound and a volume of 80.3 billion transactions
(Wikipedia, 2012). In 2011, estimated total revenue of the food industry was
approximately $185 billion USD. However, in 2012 this industry is estimated to account
for revenue of $706.7 billion USD (IBIS World, 2012). This colossal amount accounts
for about 36.5 percent of the total global food service sub-sector.
In order to analyze such rampant growth in fast food industry a worldwide study was
conducted to count the number of fast food restaurants per person. United Kingdom has
claimed this title with Australia at second position and the United States at third position
(QSR News, 2011). Moreover, according to Brewis and Jack as the people become
richer, they have less time for their social life and this proclamation is consistent with the
idea that, better off families may be time poor (Brewis and Jack, 2005). The consistent
fact was unearth by the study conducted by Gan and Vernon who advocates that, the
families with higher income have elevated probability to purchase take away food rather
than taking the less expensive option of preparing the food at home (Gan and Vernon’s,
2003). As colossal percentage of people in metros are not having enough time to cook
food for themselves regularly. They prefer to eat out at fast food restaurants and this
behavioural pattern of metro dwellers has lead to the employment of large numbers of
people in the Fast Food Industry.
As the employability went up, so did the demand of the fast food. Consequently, there
was an urgent need for the fast food companies to expand faster and reduce their
administrative burden. Hence, they came out with the idea of franchising and in order to
best maximize their profits, the big fast food giants created the franchise system.
Franchising was introduced by A&W Root Beer in 1921. However, the restaurant
concept was first franchised by Howard Johnson in the mid 1930s. The franchise system

allows the companies to maintain overall control of the product and give them a
guaranteed rate of return. Franchise system also allowed the local owners to create a low
wage work force best suited to local conditions. The growing business and the enormous
circulation of financial resources in the market helped the fast food and beverage industry
to gain a prominent place in the Indian economy. The Indian economy has shown
encouraging statistics in past three decades. Indian economy is growing at 9 percent per
annum the fastest after China (Nanjundaiya Ramesh, 2011). India ranks 12th among the
largest global economy and third largest in Asia Just behind China and Japan. In India,
the per capita disposable income has increased by 8 percent over last five years, which
has led to an increase in the per capita consumption expenditure on food by 20 percent.
During 2004 to 2008, there was soaring growth recorded in the Indian food industry from
141 billion USD to 181 billion USD, a compounded annual growth rate of 6.4 percent.
According to Kochi, the consumer spending on processed food has increased at an
average rate of 7.6 percent annually from 2008 to 2010 and this is expected to rise at an
average of around 8.6 percent till 2012 (Kochi, 2011). Additionally, by 2015 the Indian
food industry is expected to reach 258 billion USD. Total domestic food spending is
expected to reach 318 billion USD by 2020. This growth is expected to be sustained till
2020, where the industry size is expected to touch 318 billion USD (Ganesan Sathish,
2012).
This enormous increase in the industry size has led the Indian current per capita
expenditure on food to be 1/6th
that of China and 1/16th
that of US (Wikipedia, 2012). If
other outside foods like restaurant meals are also included with the fast food consumed
outside the house, then on an average an Indian consumer spends around 77 USD (Rs
4,389) per month on eating outside. Moreover, as the demand for food is on rise so is the
spending of the customers. Food is the biggest consumption category in India with
spending amounting to about 21 percent of India’s GDP. Along with the strong
fundamental growth of the economy which provided a push to consumption, there was an
increased market penetration by domestic and international food players which resulted
in availability of products and provided the required impetus for consumption.

Moreover, the size of the consumer base is also increasing by manifolds. It is estimated
that the middle class, upper middle class and the rich class is projected to increase at
more than 300 percent between 2005 and 2015. During the same period the youth
population (age group 15 – 25 years) in India is expected to grow by 11 percent
(http://www.twnside.org.sg). This will lead to an increasing demand for the food
products. The principal factors that drive the demand for fast food restaurants is the
increasing disposable incomes among the target groups, increase in the number of
working women, urbanization, globalization, the consequent changes in life styles and the
brand pull which will make Indian Tier one and Tier two cities a hot spot for the fast food
companies in the near future.
Recent researchers reveal that out of the total Indian consumer spending on food 26
percent is on tertiary value-added processed products, which accounts for approximately
47 billion USD. Out of these spending beverages, oils and oilseeds accounts for more
than a 50 percent share, since these products are mostly consumed in the tertiary
processed from in India there is large potential for tertiary processed food products. The
traditional habit of Indian consumer is to buy products in the basic or primary from and
then process them at home. This is largely due to the fact that Indian women or the
available domestic help have time at home to cook and freshness of food item is
considered an important element of the Indian diet. The processed food industry in India
is at an early stage with low penetration and high potential. Currently, the echelon of food
processing is low across the product categories and only 2.2 percent of the total food and
vegetable production of India is processed as compared to 65 percent in the US and 23
percent in China (Awasthi, Jaggi Raman, Padmanand V, 2006). The potential lies not
only in the processed food sector but also in the food tourism. The tourists play a pivotal
role in spreading of the fast food industry at global level. Many tourists spend a lot of
money on their tour trips, this spending and word of mouth advertisement helps fast food
industry to distend at global level. Tourist spending on food can constitute up to one-third
of the total tourist expenditure (Hall & Sharples, 2003). Furthermore, eating is a unique
from of tourist activity that gratifies all five senses that is vision, tactile, auditory, taste,
and olfaction (Kivela & Crotts, 2006). According to Rajendra, Indians would spend close

to Rs 4,449 crore in a year (approx. €767 million) at fast-food joints (Chaudhari. G.
Rajendra, 2012). The fast food market would be growing at a rate of 40 percent per year.
Even if the researcher assumes a modest growth of 30 percent per annum only, the
business potential for fast food restaurants in India may be reckoned approximately at Rs
13,580 crore by 2016. Hence it is not surprising to see that India is a hot spot for fast food
companies and they are penetrating the Indian food market with the help of franchising.
Franchising is a good strategy because it not only provides job opportunity to the local
population but also utilises the limited resources in the best possible way. Moreover, as
franchising involves mass participation, it is more inclined towards the local culture
ultimately leading to the increased number of satisfied customers. This has lead to the
expansion of the franchise market in India.
The franchise market in India is estimated to be worth 3.3 billion USD and is growing at
a rate of 30 percent per annum (Wadhawan Nisha, (2012). Yum Brands, which owns the
KFC, Taco Bell and Pizza Hut chains, runs about 108 Kentucky Fried Chicken outlets in
India. McDonald's Corporation has 211 restaurants in India with over 2,50,000 customers
visiting their franchise outlets every day. Indian fast-food operator Jubilant Food works
Ltd. runs the Domino’s Pizza chain in the country. Domino's Pizza in India has grown
into a country wide network of more than 300 franchise stores with a team of over 9,000
people. Subway Systems India Pvt. Ltd, part of the U.S. sandwich chain Subway has also
entered into the franchise competition by opening its first franchise restaurant in India in
2001. Now, Subway has grown its operations to 183 franchise outlets in 26 cities.
Another Pizza chain, Papa John's International Inc. has opened 25 franchise outlets in
India. Pizza Hut runs more franchise stores as compared to company administered stores.
This indicates that franchise business is booming in India and this inflow of western
chains does not pose a threat to the local players because the Indian market is big enough
for both, local and foreign companies to grow. India caps foreign ownership in single
brand retail at 51 percent only forcing all other foreign chains to seek partnerships to do
business in Asia's third largest economy.

1.2 EMERGING TRENDS IN FAST FOOD AND BEVERAGE
INDUSTRY
If a company wants to succeed in fast food industry, it is imperative for it to adapt a good
marketing plan. In marketing, a great emphasis is given to the changing business trends in
the industry. As the demand changes so does the supply and the habits of the customers
play a pivotal role in shaping new trends related to the changing demands. According to
Wesslen, Sepp and Fjellstrom the eating habits formed in early years become slightly
unchangeable practice of life as children learn everything from the family and society
(Wesslen, Sepp and Fjellstrom, 2002). However, society and culture goes hand in hand
and change in one causes inevitable change in the other. It is generally agreed that food
cultures do not remain static but are continually evolving and changing in response to
different internal and external stimuli (Mennell, 1985). One of the prominent external
stimuli is the experiences which the people carry with them while they move from one
place to another. Indeed, human mobility, which includes movements associated with
migration, immigration and tourism, has significant impact on globalisation of food
(Inglis & Gimlin, 2009). Hence, the movement of customers does affects the menu of
many Fast Food restaurants. However, Hall and Mitchell emphasize that despite the rapid
globalization of the food market in many destinations, homogenization of production or
consumption has less certainty in comparison to the heterogeneity for the market (Hall
and Mitchell, 2000).
Homogenization of consumption is not guaranteed because of the increasing awareness
of the cultural preferences by many multinational food corporations. For instance,
McDonald’s has introduced localised products such as Mc Kroket in the Netherlands, Mc
Kebab in India, Teriyaki Burger in Japan, and Mc Rice Burger in Hong Kong. In Israel,
Mc Donald’s has increased the size of its hamburger by 25 percent and adjusted the
preparation technique by using a combination of fire and charcoal in order to respond to
the Israeli customers’ preferences for large portion of grilled meat (Upadhya. Ram,
2004). The internationalization and globalization of the fast food have also been
explained by Calhoun, who points out that “Samosas are now English food just as pizza

is American and Indonesian curry” is Dutch. Even where the exotic food is found
prominent, customers have access to international dishes. That is why customers can eat
Mexican food in Norway and Ethiopian food in Italy (Calhoun, 2002). This pattern of
distribution reveals that due consideration has been given to the effective advertisements
to develop a positive cognitive attitude of the customers towards the cross cultural
consumption precedent and also giving consideration to the health issues.
In such environments, the customers’ reckless eating habits have surprised the fast food
companies as their initiatives to provide healthy foods are annihilated by these careless
customers. As a result of which low calorie diet foods do not work well as compared to
the traditional fried fast food items, several fast food items do have trans fats which are
considered dangerous for the heart and vital parts of the human body. That is the reason
why Mc Donald’s launched its Mc lean burger, which had very less fat content as
compared to its regular fast food products. It was surprising to know that the product
which is good for health did not work well on ground as a result of which the newly
launched Mc Lean burger did not work well in such economies. On the other hand, the
study reveals that numerous customers value taste more than nutritional content when
they are purchasing food item. Additionally, it is human nature to ask for more
especially, when it comes to paid food. Consequently, as per Harris consumers purchase
different food items for varied reasons and these reasons undoubtedly extend beyond
price to include taste, convenience and presence or absence of desired nutrient content.
The study also expounds that customers do give apposite consideration to the size of the
product they intend to consume. It was found that Mc Donald was able to attract more
customers towards its Deluxe Series of products (Arch Deluxe, Fish Filet Deluxe, Crispy
Chicken Deluxe and Grilled Chicken Deluxe) just by increasing the size of the burger by
20 percent as compared to its normal products in the same category. Although, the deluxe
products costs a little more and had the same taste as the regular food items, the sales of
the deluxe products experienced a steady rise just after its launch. Moreover, among the
various extrinsic factors pricing plays a pivotal role in influencing the purchase decision
of the customers. Value pricing is the new strategy which practiced by fast food
companies do attract customers by providing them more eatables at reduced cost. It
generally consists of combination of two or more food items which are served at low cost
as compared to purchasing the same food items individually at the same fast food
restaurant. For example combo meal, Mc meals, they consist of burger plus French fries
and medium coke. Another example is Boston Market's Chicken Carver Combo which
includes a chicken breast sandwich, a side dish and a medium soft drink for $4.00 to
$5.00. Value-priced meals at fast food restaurant also started including a sandwich,
French fries and a soft drink that resulted in the increase of the sales of French fries and
soft drinks, which are high profit margin items. The similar trend was also applied by the
Pizza hut by offering a combo of value meal for Rs 130 only. Moreover, the burger
chains did not grow as fast as the pizza and chicken chains over the last five years, but
are still approximately double the size of pizza chains and nevertheless make up almost
half of the dollar volume of the total fast food market. Hence, a good fast food restaurant
needs to focus on both Pizzas and burgers.
Another new trend which has dramatically changed the customer holding strategy in the
fast food industry is multiple branding. The use of multiple branding whereby several
restaurant chains operate at the same location is an attempt to draw more customers by
offering a large number of items and provide enormous variety to the customers. Fast
food chains that engage in multiple branding can better absorb fixed operating costs such
as rent, electricity and water bills, security costs etc. Pepsi Co owner of Taco Bell, KFC
and Pizza Hut has started co-branding where a customer can see a Taco Bell kiosk in a
KFC store. Simultaneously, Mc Donald and Pepsi have also plunged into the same pool
of co-branding marketing strategy.
These are some of the emerging trends which are now absorbed and modified by the fast
food industry according to their own individual requirements as different strategies are
effective in different environments the fast food companies are carefully selecting their
strategy. As long as the customers continue their fierce competitiveness in the workplace,
working longer hours with no time to prepare for food at home and continue its interest
for new restaurant concepts. The most creative and aggressive fast food companies will

flourish with these trends and also create new trends. Therefore, the fast food industry
cannot be annihilated from the present phenomenon of globalization. Hence, fast food
industry is the next big movement of the modern business era, which will have huge
impact on the way the society works and lives.
1.3 SUCCESS DRIVERS OF FAST FOOD AND BEVERAGE
INDUSTRY
Success is often the result of hard work, effective planning and combination of several
key elements that go into developing a successful matrix for any company. These
elements vary according to the environmental milieu and the nature of the organisation.
Interestingly, the fast food companies are conscious about the combination of these
elements to device the appropriate strategy in the light of ever changing business
environment. To grow and survive in the present competitive and dynamic market
environment over the period of time, the fast food companies have adopted different
marketing strategies to suit the global and regional economic fluctuations. Sometimes,
during recession fast food chains merge together in order to grab a bigger market share
and increase their profits. Mergers also facilitate the fast food restaurants to increase their
revenue and customer base by expanding the choices available to their customers and
also by increasing the hours of operation. For example, a restaurant chain that doesn’t
serve breakfast merged with a chain that does. A burger making food chain merged with
a Pizza making food chain to tap both kinds of customers. A classical example of the
above mentioned concept is the merger of Arby and Wendy in the year 2008. In Australia
Coke has devised a contract with Mc Donald’s and they sell Diet coke at Mc Donald’s
outlets. This strategy has helped both the companies to entice more customers to their
products and eventually the customers perceived this as a value for money bargain.
Additionally, price formulates as one of the most important inputs for strategy
formulation especially in the product category which is have service dominance like fast
food sector. Price of the food products fluctuates in accordance with the external and
internal environments. As soon as slow economies begin to recover low meal prices were

of less concern for the consumers and quality became the new imperative factor.
Although these new healthier food items were more expensive as compared to the other
items on the menu list, still they attract the educated and economically sound customers
because of their health benefits. According to the “QSR” magazine when the McDonald’s
included fruit smoothes and other new healthier but relatively more expensive food items
on its menu, the 2011 sales of the company outpaced the 2009 sales by 1.5 billion USD
(QSR, 2011).
Almost all big players in the fast food industry are implying strategies to ensure least
amount of commodity pricing. By gaining access to low prices meats, vegetables and
other commodities fast food restaurants reduce meal prices without losing profits. This is
achieved by complying with strategies like bulk buying, having contract with the farmers
who are producing vegetables, establishing variable financial relations with slaughter
houses, transport organisations etc. This strategy plays a pivotal role in outperforming the
competition especially in developing economies like India. As a result of this, there is a
price war among the fast food companies in India which are running on thin profit
margins. In this commercial environment functioning efficiently is critical for the
endurance of the restaurant. Focusing on minimizing food waste, hiring assistance at
minimum wage and accruing benefits from economies of scale.
Moreover, developing unique value proposition having distinction from the competition
is of grave importance for enticing potential customers. While applying the concept the
fast food industry has created a unique, innovative, entertaining menu cum gift item that
can differentiate them from the rest of the competition. Many fast food restaurants in
order to stand apart from the competition and allure customers started emphasizing on the
fifth P of the marketing mix i.e. physical evidence by providing some recallable
souvenirs to the customers visiting their outlets. Additionally, fast food companies have
started driving customer traffic through collectibles particularly those that are enjoyed by
the young customers. According to this strategy, a fast food company selects a movie or a
popular animated film and determines other companies who sell dolls, glasses or other
mementos that are related to the movie. Then, the company offer four to six characters
related to the movie and distributes one free item with one purchase. This fast food
marketing strategy magnetizes the people to come back until they have earned all the
collectibles. Big players in fast food industry choose a popular theme for their collectibles
which other fast food companies are not marketing.
Companies are also segmenting their market by various activities, attitudes and customer
usage patterns. For example, if majority of a fast food restaurant’s customers are between
the age group of 18 to 24 years and earn less than Rs. 10,000 per month then the
company can locate clusters of this demographic group within 10 km radius of its
restaurant. Then, they retrieve the addresses of the potential customers’ residence and
mail them the coupons. There are many more direct marketing techniques which
companies are employing now a days to magnetize the attention of the potential
customers. Understanding the relevance of distribution, accessibility and income majority
of the fast food restaurants have identified the market clusters and have opened business
outlets keeping distribution, accessibility and income in view. Another example is that of
KFC which is now targeting college students in India by launching products which are
cheap and easily accessible to Indian students.
Further, another marketing strategy practiced by leading fast food restaurants is attracting
and retaining right customers and developing long term relationships by offering loyalty
and reward programmers to retain the old customers. Frequency card programs are a
popular type of loyalty programs for fast food restaurants. These programmes help in
increasing the revisit incidence of the customers by rewarding their repeat behaviour in
conjugation to their enhanced loyalty towards the organisation. For example, many fast
food companies are offering its customers a free drink after their first four visits and free
French fries after their next four visits. Ultimately, a customer can earn a free meal after
twelve visits. Fast food companies keep on repeating this cycle for six, eight or ten weeks
according to their preferences and requirements.
Another input factor exploited for expanding services, especially pertaining to fast food
restaurant is the time factor. Time is the most valued resources which helps to elevate the

efficiency of the organisation as it is precious and every growing organisation wants to
utilize it in the best possible way. One of the most important reasons for quick service in
the fast food restaurants is to annihilate the cognition caused by the presence of excessive
customers in the restaurant at the same time. The fast food restaurants want that the
customers must come, eat and go so that the operational efficiency of the restaurant is
increased. Additionally, in restaurants operations production time, convenience and short
service time are major success drivers for fast food chains. This coinciding with the faster
pace of life in the modern world places fast food as a regular dining choice for time
conscious people. Majority of the fast food chains also offer drive thru services where a
customer while driving to work or school in a hurry can grab food item easily without
wasting much of their precious time by driving through a strip specially designed by the
restaurant where the customer can give order while sitting in their cars and instantly the
ordered food is served. However, apart from demographic considerations the knowledge
of market and consumer behaviour acts as a decisive element in the success of any fast
food company. In fact the change in consumer preferences have produced new
consumption patterns towards this food sector. Therefore, consumer behaviour is a subset
of human behaviour which is important to understand in view of the behaviour displayed
in obtaining, consuming and disposing off the fast food products.
1.4 CONSUMER BEHAVIOUR IN FAST FOOD AND BEVERAGE
INDUSTRY
Consumers exhibit varied taste and preferences for food. Therefore, it is imperative for
the fast food companies to understand the conception of consumer behaviour so that the
companies can devise appropriate strategies in response to the altering demands of the
market and stay competitive. Consumer behaviour is a process of incorporating the deeds
displayed by the consumers in searching, purchasing, using, evaluating and disposing of
products and services that they expect will satisfy their needs. In other words consumer
behaviour is about how individuals make decisions to spend their available resources,
such as time and money on consumption related items. The main objective of studying
consumer behaviour is to acquire the requisite knowledge and skills in order to carry out

detailed consumer analysis which could be used for understanding markets and
developing dexterous marketing strategies. It blends elements from
psychology, sociology, anthropology and economics which are imperative in consumer
decision-making.
The consumer’s decision-making reflects both cognitive and emotional aspects of the
consumer behaviour which marketers and managers can employ to formulate product
mix, communication and sales strategies. In fact, decision making incorporates the
procedure of choosing between two or more alternatives. Consumer decision making may
be defined as a process of gathering and processing Information, evaluating it and
selecting the best possible option so as to solve a problem or make a buying choice.
Every decision-making process results into a final choice and the output can be an action
or an opinion of alternative choices. There are five stages of consumer’s decision-making
process which are explained by the following diagram. On the basis of the available
information, the consumer’s decision-making process can be explained in five stages as
mentioned below:
Figure 1.4.1 Customer Decision Making Process
Evaluation and
comparison
III
Information
Search
II
Need Reorganisation
I
Post purchase
V
Decision making
IV
Stage – I: Need Recognition
The customer decision making process commences with the awareness of unfulfilled
need which is causing discomfort for the customer. For the customer, this unfulfilled
need is simply a difference between an existing and desired state of satisfaction. In case
of habitual decision making, the customer already knows the product or service which
will satisfy his specific need. However, in the case of extended decision making the
customer does not exactly knows which product or service can satisfy his particular need.
For this reason, the customer has to undertake in-depth detailed research and the
customer resorts to the process of Information search.
Stage- II: Information Search
After the recognisation of the problem, the customer undertakes the process of
Information search to ascertain and isolate the presumed effective solution. The
procedure of Information search may be extensive, brief or sometimes in between the two
extreme points. In order to allure the customer towards themselves, the companies
provide them relevant Information which acts as pedestal for their decision-making
process. Communicating Information needs
dexterity as it is not certain whether the company is loading the customer with too much
of Information or depriving the customer off the vital Information for consumer decision
making. Devising right communication mix is critical to persuade the consumers to take
favourable decisions. In order to fight back with this problem, the companies are
developing websites where the customers themselves will decide what and how much
Information they want. This interactive Information system allows the customers to be
appropriately selective in their own Information search.
Stage-III: Alternative Evaluation
In order to drive value from the selection of the product or service, the customer starts
analysing the alternatives pertaining to the product or service and the providers of the
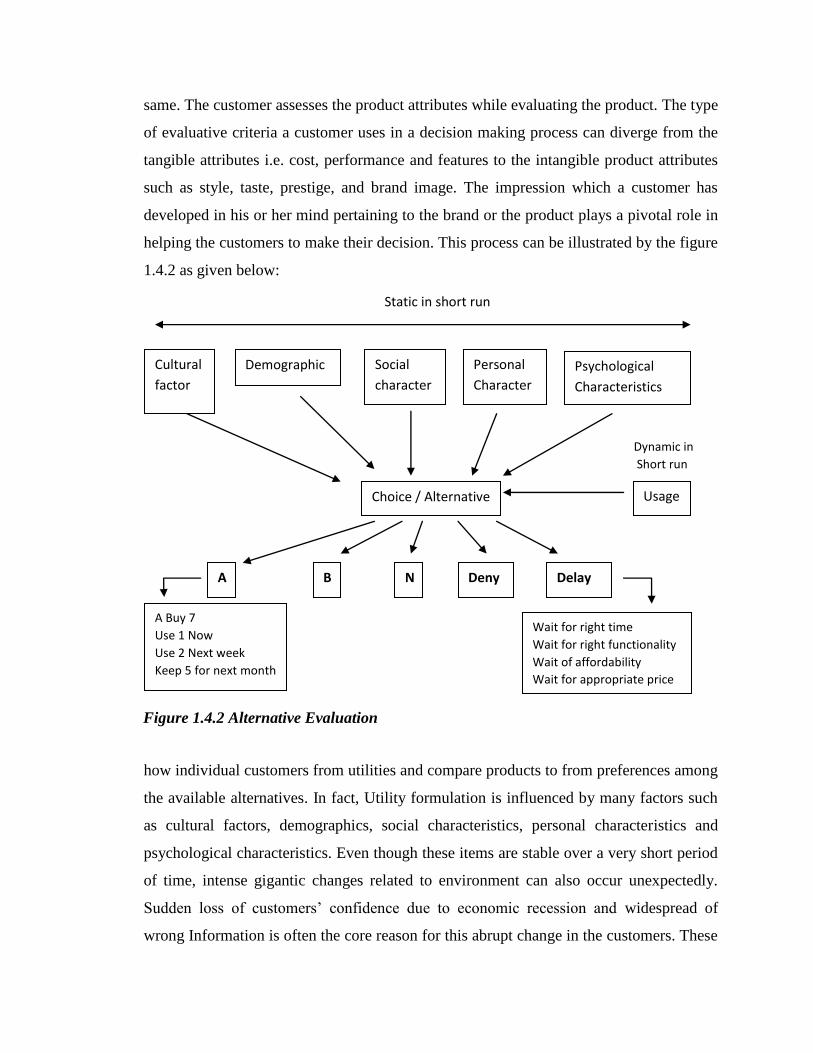
same. The customer assesses the product attributes while evaluating the product. The type
of evaluative criteria a customer uses in a decision making process can diverge from the
tangible attributes i.e. cost, performance and features to the intangible product attributes
such as style, taste, prestige, and brand image. The impression which a customer has
developed in his or her mind pertaining to the brand or the product plays a pivotal role in
helping the customers to make their decision. This process can be illustrated by the figure
1.4.2 as given below:
The above mentioned figure scrutinizes
how individual customers from utilities and compare products to from preferences among
the available alternatives. In fact, Utility formulation is influenced by many factors such
as cultural factors, demographics, social characteristics, personal characteristics and
psychological characteristics. Even though these items are stable over a very short period
of time, intense gigantic changes related to environment can also occur unexpectedly.
Sudden loss of customers’ confidence due to economic recession and widespread of
wrong Information is often the core reason for this abrupt change in the customers. These
Static in short run
Cultural
factor
Psychological
Characteristics
Personal
Character
Social
character
Demographic
Dynamic in
Short run
Usage Choice / Alternative
A B N Deny Delay
A Buy 7
Use 1 Now
Use 2 Next week
Keep 5 for next month
Wait for right time
Wait for right functionality
Wait of affordability
Wait for appropriate price
Figure 1.4.2 Alternative Evaluation

antecedents are often targeted and influenced by marketing communication efforts such
as advertising in order to influence the customer decisions in companies favour.
Additionally, the usage also plays important role in customer decision making. While
demographic and psychographic characteristics do not change in short run, the mood of a
consumer does. For example in a single week, the first day customer might eat at Pizza
Hut, the other day accompany a friend to dinner at an expensive restaurant the and next
day avail the take-away service provided by the fast food restaurants. Therefore, the
consumer behaviour is heavily influenced by the usage situation and this situation alters
continuously.
Stage-IV: Purchase decision
Purchase decision incorporates series of choices made by a consumer prior to making a
purchase that begins after the consumer has established a willingness to find the solution
to the identified need or problem. In other words at this stage of decision making process
the customer is mentally and financially prepared for the purchase. The customer contacts
the retailer and finally reviews all the statistical and relevant Information before making
the final decision. The customer must then decide where to make the purchase, what
brand, model, or size to purchase, when to make the purchase, how to purchase and the
pros and cons of the purchase, how much to spend and what method of payment to be
used, weather to buy in installments or one time whole payment. The marketer attempts
to influence each of these decisions by supplying Information that may shape the
consumers’ evaluation process. At this stage, emphasis of the retailer is on providing the
easiest possible way for the customer to carry out their orders so that the customer can be
satisfied with the purchase decision process.
Stage-V: Purchase evaluation
In the course of the post purchase phase, consumers evaluate the product they have
purchased. This post purchase evaluation of a product is based on the consumption
experiences attained while utilizing and consuming products or services. In this regards
there can be two distinguished underlying evaluative criteria namely utilitarian and

hedonic appraisal (Westbrook, Robert A. 1980). Utilitarian appraisal is associated with
the utilitarian performance of a product whereby one focus on the degree to which a
product fulfils a useful function. For utilitarian appraisal the consequence of the product
use is important as by consuming a product functional benefits are derived that removes a
particular problem (Holbrook & Hirschman, 1982). Divergent to the utilitarian appraisal,
hedonic appraisal is not based on the utility related to the consumption and attention is
paid to the extent to which the experience of the consumption of product or service is
pleasing. Hedonic products, such as entertainment, arts and leisure activities are bought
to derive hedonic experiences. The consequences of consumption appear in the
enjoyment that is offered and the resulting feelings of pleasure evoked when the product
and service are used (Klinge, E., Barta, S.G. & Maxeiner, M.E. (1980).
In the case of leisure activities, such as reading, watching, listening etc. customer do not
perform the activity primarily to spend time, or to get informed but because it is amusing
to experience it. Therefore, the post purchase evaluation of the product will mainly be
based on weather appraisal of the consumption experience is for functional or
psychological utility. Considering all types of business organisation consumer
satisfaction is the most important and considered as the most reliable feedback for the
excellence of any business organisation.
1.4.1 CUSTOMER SATISFACTION IN FAST FOOD AND
BEVERAGE INDUSTRY
In the present business scenario there is no industry which can work efficiently by
ignoring customer satisfaction. Customer’s access to a lot of variety and cutthroat
competition has turned the tables and put the customer in the dominant position. It is well
established fact that satisfied customers play crucial role in long term business success
(McColl-Kennedy and Schneider, 2000). The importance of customer satisfaction is
ostensible from the research conducted by Shoultz which advocates that out of 700 top
executives, 64 percent agreed that customer satisfaction was their number one priority
and the remaining 36 percent revealed that it was one of their top priorities (Donald.
Shoultz, 1989). Classification of the customers on the basis of satisfaction has been

studied by number of researchers. Jones and Suh have suggested two distinct categories
of customer satisfaction which are transaction specific and overall satisfaction (Jones and
Suh, 2000). Here transaction specific satisfaction is associated with a definite encounter
pertaining to the organisation, whereas overall satisfaction is a cumulative construct
figuring up satisfaction with specific products or services of the organisation by means of
various other facets of the company. The overall rating epitomizes a more broad-
spectrum attitude of the customer towards a specific product or service provided by the
organisation. Further as per Jones and Sasser, on the basis of the satisfaction customers
behave in one of the four basic ways as loyalist, defectors, missionaries and hostages.
Within the loyalist category, the individuals are so satisfied that their experience exceeds
their expectation and they share a strong positive feeling with others. Defector rank
includes those customers who are neutral or merely satisfied and not all defectors need to
be retained by the company because most dangerous defectors are also referred to as
terrorists. Another customer category is referred to as missionary, which encompasses
those customers who are completely satisfied but exhibit almost no loyalty due to their
sheer interest in the financial gains. Whereas, the hostages are such individuals who
experience the product the company has to offer largely due to monopolistic environment
and would revere to shift if competitive environment exists.
Thomas Jones and Sasser Jr. have suggested that as the market shifts towards saturation
the organisation shrinks and strives to elevate the customer satisfaction level by retaining
affirmative existing customers rather than devoting additional resources to entice
potential new customers. As a result understanding and tracking satisfaction level has
become of paramount import for sustaining business success relationships. Most
important customer satisfaction is viewed as a means rather than an end pertaining to a
cycle of continuous improvement in service delivery system (Thomas Jones and Sasser
.Jr, 1995).
One of the most popular and extensively employed methods to measure customer
satisfaction in the business world is the confirmation-disconfirmation method. This is
based on comparison of the customers’ expectations with the customers’ current

experiences (Yu ksel and Rimmington, 1998). A tool devised to be effective in this
particular note is the customer satisfaction index (CSI) which was developed by
University of Michigan's Ross School of Business in 1944. The CSI method is
predestined on predictive model that comprises of preceding customers’ expectations,
perceived quality based on the customers’ post service assessments and the customers’
perceived value which leads to the conception of customer satisfaction index (CSI) score
assorting from 0-100. This technique is widely applied in the USA (ACSI) and Europe
(ECSI). According to Eugene W, Anderson and Fornell the customer satisfaction index
scores pertaining to customers’ satisfaction operates as a intangible economic indicator
and is used to monitor the financial viability of the companies, industries and
international trade unions. They work as momentous assessments of the feasibility of
large economic federations operational in Europe and USA. The post service assessments
are completed by telephone and are comprised of the customers’ ratings on three criteria:
overall quality, reliability, and meeting the customers’ needs. The national CSI measures
the quality of goods and services knowledgeable by the consumers. An individual firm’s
CSI rating represents its served market’s overall evaluation of the total purchase and
consumption experience, both actual and anticipated (Eugene.W, Anderson and Fornell,
2000). The national index is updated each quarter. According to the latest ACSI rating,
pizza makers are riding on the top of the wave. Papa John’s leads the fast food category
by jumping to 7 percent increase as compared to the previous year ACSI ratings,
followed by Pizza Hut which increased by 5 percent. KFC is the other big gainer, by
ceasing an increment of 9 percent as compared to previous year. Despite rolling out new
ingredients and reinventing the Domino’s pizzas from the crust up, Domino’s is still
stuck at the same level. It is surprising to recognize that McDonald’s ACSI rating has
dropped by 4 percent as compared to the previous year (American Customer Satisfaction
Index, 2012).

1.4.2 BRAND LOYALTY IN FAST FOOD AND BEVERAGE
INDUSTRY
Modern marketing era witness a significant thrust on developing brand loyalty
relationship. Wherein, brand loyalty refers to consumers’ consistent preference and
purchase of the same brand in specific product or service. Within the domain of loyalty
Neal opinioned that customer loyalty is the preference of consumer’s choosing the same
product of service building loyalty in a sum total of three components of perceived
loyalty, emotional loyalty and action loyalty (Neal, 1999). Emotional loyalty approach
explores emotional, cognitive, general and transactional dimensions of customer’s
satisfaction and loyalty process in multichannel customer relations. It aims at improving
the customers experience associated with every first encounter with the company. Action
loyalty pertaining to communication with customers has three sub-dimensions which are
acquisition, selection and transmission of Information. The degree of these dimensions
enhance with the increase in the levels of loyalty. Further, different pattern of
communicative action would be observable among individuals with different levels of
behavioural and attitudinal loyalty. Perceived loyalty refers to the perceived value of the
customer associated with the loyalty programme. It takes into consideration the economic
value and special treatment provided to the customer. However, apart from the above
mentioned loyalty components, the process of developing loyalty also varies subjected to
the nature of product, brand and the industry.
Taking into consideration the fast food industry the cost of accruing a new customer is
approximately five to nine times more as compared to the cost to maintain an old
customer. Previous researchers reveals that if the customer loyalty is be increased by five
percent effectively, then the profit can be increased by 25 to 85 percent. Therefore, if the
service industry wants to reduce the cost on money and time it must focus on retaining
customers than attracting new customers. This will result into a large pool of satisfied
customers with a strong sense of trust as also building long term loyalty.
Brand loyalty, is consumer's commitment to continue using the same brand and this
phenomenon can be demonstrated by repeated buying of a product or service or other

positive behaviours, such as word of mouth advocacy. For companies in food industry it
is of great importance that the concept of brand and perception should not be ignored for
the reason that the consumers associate product categories with brands and countries
(Roth and Romeo, 1992). Therefore, fast food chains like Mc Donald's, Burger King and
Wendy's have developed extremely successful fast food branding strategies. Their signs,
logos and slogans are recognizable around the world.
Fast food companies endeavour to access high traffic shopping malls near the target
markets where brand and image plays a decisive role in attracting the customers to the
fast food restaurants. These two ingredients are the main drivers in marketing
communication. According to the website customer service zone, fans of fast food like
clear communication and predictability as they want to know exactly what they are going
to get before they go through the doors. By providing consistent, easily recognizable and
simple brand messages a fast food restaurant reassures the customers that nothing has
changed.
Simple slogans that lodge themselves into the brains of the customers are repeated
endlessly on television and radio commercials, ensuring that when customers see the fast
food outlet, they are already primed to respond positively because by now the brand is
inside them. This enables the fast food companies to acquire increased level of customer
traffic ultimately elevating the profits. Company like Mc Donald always reveals a happy
person after eating their product. Moreover, punch lines like “I am loving it”, illustrates
that the product is giving more ant required satisfaction to the consumer. Additionally,
the body language and the facial expression of the people consuming the product on
commercials are extremely positive. All their actions result in affirmative interpretation
of the message and develop an optimistic impact on the potential customers.
Many researchers have found that consumers develop associations between brands and
perceived benefits from the brands (Krishnan, 1996). This effect can be observed in fast
food industry as well, where brands like KFC and Subway has developed a perception in
the mind of the customers that the products of their brand are hygienic and tasty. As a
result these brands have been able to attract those customers who are looking for quality
and hygiene. Moreover, recent research has also found that the customers associate
quality with KFC, price value with Pizza Hut, availability with McDonalds and the
delivery service with Dominos. Additionally, when the customer develops value
associations with the brand the customer is inclined towards developing some degree of
positive attitude with the brand as well. Recent researches have revealed that customers
having long term association with the company were less sensitive to price increases in
comparison to the other customers. Brand loyalty is viewed as a multidimensional
construct which is determined by several distinct psychological processes and entails
multivariate measurements. Customer’s perceived value, brand trust,
customer’s satisfaction, repeat purchase behaviour and commitment are found to be the
key influencing factors of brand loyalty.
Philip Kotler has segmented the loyal customer into four categories which are hard core
loyal, split loyal, shifting loyal and switchers (Kotler Philip, 2002). Hard core loyal are
those customers who are very particular about the brand they are buying. These
customers will travel longer distances in order to get the product of their brand. Hard
core loyal are asset for every company because these customers will buy only from one
company and in addition to that they also spread good word of mouth and draw new
customers to the company resulting in the expansion of the customer base. Therefore,
every company wants to retain and develop large number of hard core loyal customers.
Split loyal customers are very tricky to handle because they are not loyal to any one
particular company. Their loyalty changes with the change in external factors like price
of the product, features of the product, availability of the product, after sales service of
the product and many other external factors. Split loyal customers are difficult to keep
with the company as they do not mind shifting from the company if they get a better deal.
It is a tedious task to predict the behaviour of the split loyal customers. However, the
companies try their level best to retain as much split as loyal customers as possible
because they are just like extra bonus for the company and they may or may not spread
good word of mouth in lieu of the company. Hence, the fast food companies try to keep
them happy and contented by providing unique and customised services and products.
Shifting loyal customers are to some extent similar to split loyal customers. The only
difference lies in the proportion and frequency of shifting from one company to another.

On the contrary, switchers are those customers who are not at all loyal to any company.
These types of customers are very difficult to envisage because their buying behaviour is
erratic and unpredictable. Moreover, non loyal customers constitute the majority of the
customers’ base and therefore all the companies squander a fortune to attract these non-
loyal customers. However, researchers conducted on non loyal customers have illustrated
that just like other customers they also like to revisit restaurants which are hygienic,
beautiful, calm and attractive. Additionally, the recent researchers have also revealed that
ergonomics and internal design of the restaurant has a tremendous impact on the
cognitive abilities of the customers. Keeping this in view Mc Donald's is also changing
its look and attire for re-establishing its brand with a new get up. It is projecting itself as a
brand meant for the young and happening through a Wi-Fi look. Mc Donald's has brought
change in its traditional colour composition for re-inventing its brand image. The
dominant yellow color is being replaced with golden and red with terracotta. Besides this
the colour combination would also include sage green and olive. Restructuring would
include prevalence of wood along with bricks lessening the earlier plastic texture. Mc
Donald's is attiring its restaurants with lights having mild touch for a soothing
ambience. Further, keeping in view the target audience the restaurants are specifically re-
designed into three segments. The first zone is the linger zone where the young techno
savvy generation could access technologically advanced equipments and linger around on
sofas and armchairs. The second segment is flexible zone which is meant for families,
where a person could relax with his or her family. Last but not the least is the grab and go
zone. This part of the Mc Donald joint caters to the lone diners and its characteristic
features include bar stools, tall counters and plasma televisions. All these improvisations
help in increasing the longitiviety of the relationship between the customer and the fast
food companies resulting in enhanced loyalty. Developing economies like India which
are well known for their price sensitive markets, where every rupee counts and can
dramatically alter the decision of the customers. It is imperative for the companies to
continuously audit and maintain an appropriate price for their offerings in order to sustain
and grow in this extremely competitive market.
1.4.3 PRICING IN FAST FOOD AND BEVERAGE INDUSTRY
Pricing is a fundamental aspect of financial modeling and is one of the four Ps of the
marketing mix. The other three aspects are product, promotion, and place. Price is the
only revenue generating element amongst the four Ps as the rest are cost centric. Without
appropriate money generation, no organisation can work and expand effectively because
the wealth is generated from the customers and therefore, it is imperative that the
customer should be willing and have the capacity to purchase the product or service.
Moreover, the needs of the consumer can be converted into demand only if the customers
feel that the price charged is genuine and to achieve this purpose the management looks
forward to the pricing factors. Factors affecting the price determination are known as
pricing factors which are manufacturing cost, market place, competition, market
condition, and quality of product. Due to the above mentioned reasons many fast food
companies are devising strategies to influence these factors for their own benefits. Like
McDonald has launched low priced products to reduce the manufacturing costs, KFC has
started to offer both halal and jhatka meat to the customers, Domino’s has started free
home delivery services in order to entice the customers of even those areas which are far
from Domino’s restaurant and other food options are available to them in their nearby
vicinity. The price of the Pizza Hut food products vary according to the quality associated
with them. This helps them to provide options for customers bellowing to different
economic strata hence, increasing their overall customer base.
Unfortunately, the pricing factors and the associated pricing strategy differs depending
upon the product, brand and nature of the market plus economy. Unorganised markets in
less developed economies have shown the evidence of unfair and unhealthy pricing
practices which not only deteriorates the image of the organisations but also motivates
the customers to look for other options. That is why price fairness is very important for
any company. According to researchers Price fairness refers to consumer’s assessments
of whether a seller’s price is reasonable, acceptable or justifiable (Xia et al., 2004). The
history of the business world has proved that only those companies have been successful
who have provided products and services at fair prices. In order to gain repeat customers,
it is essential for the business organisations to satisfy the customers from monetary point

of view. In another study conducted by Herrmann, it was concluded that customer
satisfaction is directly influenced by price perceptions while indirectly through the
perception of price fairness. The researcher accepts the fact that the price does plays a
pivotal role in the overall revenue generation process of the company (Herrmann et al.,
2007). The relevance of the statement further increases by the fact that there is a strong
consensus within the literature, supporting the fact that price promotions do have a
significant impact on short term sales (Hawkes, 2009).
Many fast food and beverage companies have taken into consideration the laws that
influence a consumer’s perceives at a given price and how price sensitivity influences
their purchase decisions. These laws also referred to as “effects” are reference pricing
effect, switching cost effect, price quality effect, expenditure effect and shared cost
effect. The reference price effect advocates that buyer’s price sensitivity for a given
product increases in proportion to the product’s price relative to perceived alternatives.
Switching costs effect puts light on the fact that the higher the product specific
investment, a buyer must make to switch suppliers, the less price sensitive that buyer is
when choosing between alternatives. Price quality effect advocates that the buyers are
less sensitive to price if higher prices signal higher quality. Products on which this effect
is applicable includes image products, exclusive products and products with minimal cues
for quality. Further, according to the expenditure effect, the buyers are more price
sensitive when the expense accounts for a large percentage of buyer’s budget. According
to Shared cost effect, the smaller the portion of the purchase price the buyers must pay
the fewer prices sensitive he/she will be.
Keeping in view the above information, the fast food companies utilize different pricing
strategies but the most common strategies includes skimming pricing, limit pricing, value
pricing, penetration pricing, customary pricing and bundle pricing strategies. Skimming
Pricing strategy is very popular pricing strategy in which business organisations sell a
product at a high price, sacrificing high sales to gain a high profit. This pricing strategy is
usually employed to reimburse the cost of investment of the original research into the
product. In other words, extract from the buyer as much as much possible. Many times
when the fast food companies launch a new food item or a beverage company a new
drink, they usually price it employing the skimming pricing strategy and cater depending
upon the customers’ response, they change the pricing strategy to best suit the scenario.
Further, Value pricing strategy is a process of offering products and services to the
customers at a fair and reasonable price with the assumption that the customers observe
price as a primary indicator of a service value. According to this strategy, the company
decreases the prices of the products without reducing the size or maintains the present
cost of the product and reasonably increase the size of the product. An example of the
value pricing is the value meal known as medium meal combo offered by Mc Donald
which consists of burger, fries and Coke priced much lower than the sum of
individualized product costing. Whereas penetration pricing is most commonly associated
with a marketing objective of increasing market share or sales volume rather than to
make profit in the short run. Penetration pricing is the act of setting a relatively low initial
entry price, often lower than the present market price, to attract new customers. The
strategy works on the expectation that customers will switch to the new brand because of
lower brand. Fast-food restaurants often utilize penetration pricing when introducing a
new menu item. On the other hand, customary pricing is a practice of determining the
price based on the customers’ perceived expectations. Customary pricing is established
by tradition or competition and fast-food restaurants employ customary pricing on a
regular basis. For example, if the majority of fast-food restaurants are selling
cheeseburgers for Rs. 50 then mainstream fast-food restaurants will be selling its
cheeseburgers Rs. 50 as well for the reason that, they do not want to bear the risk of
losing sales to the competition. Bundle Pricing as a strategic pricing practice in the fast
food sector, is a act of marketing and selling two or more products as a single package
with the intention of saving the customer money. Fast-food restaurants engage in bundle
pricing quite frequently as they may call it a value meal or a meal deal. A customer can
purchase a sandwich, fries and a drink as a value meal for far less than the price of
purchasing each item separately. On the other hand the limit pricing strategy is a tool in
the hands of a monopolist to discourage economic entry of the other business
organisations into the market. The limit price is often lower than the average cost of
production or just low enough to make entering into the market not profitable. This

strategy discourages new entrants in the business because they will not be able to achieve
the breakeven point in near future. This strategy is declared illegal in many countries.
Another pricing strategy known as premium pricing approach is the practice of keeping
the price of a product or service artificially high in order to encourage favorable
perceptions among the buyers based solely on the price. Food items in seven star hotels
are priced keeping in mind the same pricing strategy. Target pricing strategy, is a pricing
method whereby the selling price of a product is calculated to produce a particular rate of
return on investment for a specific volume of production. As the market trends and
scenario change so does the pricing strategy of the fast food companies. They many times
execute permutation and combination of these strategies pertaining to their preferences in
response to changing business environment. However, customers persistently associate
price with quality. Therefore, it is imperative for the fast food and beverage companies to
provide high service quality and charge appropriate price in order to attain desired
customer traffic and higher stratum of customer satisfaction.
1.4.4 SERVICE QUALITY IN FAST FOOD AND BEVERAGE
INDUSTRY
In today’s competitive business environment, it has become imperative for successful
enterprise to focus on creating, maintain and replicating service quality. Service quality is
inarguably one of the core concepts that is at the crux of the marketing theory and
practice (Richard Spreng A and Mackoy D Robert, 1995). Bitner, Booms and Mohr have
defined service quality as the consumers overall impression of the relative inferiority of
superiority of the organisation and its service (Bitner, Booms and Mohr, 1994). While
Cronin and Taylor view service quality as a form of attitude representing a long fun
overall evaluation (Cronin and Taylor, 1992). Parasuraman, Zeithaml and Berry defined
service quality as a function of the difference between expectation and performance along
the quality dimensions (Zeithaml,V.A., Berry, L. L., & Parasuraman, A., 1996). Infact,
the key to sustainable competitive advantage lies in delivering high quality service that
will in turn result in satisfied customers. Therefore, there is no doubt that providing
immaculate service quality and customer satisfaction is the ultimate goals of all service

providers. According to Bitner, satisfaction leads to higher perceptions of quality wherein
the customer’s overall satisfaction with the service of the organisation is based on all the
direct encounters and experiences of the customers with the employees of the serving
organisation (Bitner, 1990).
Having understood the service dimensions namely assurance, empathy and
responsiveness as a significance output of human factor all virtuous companies allocate
enormous resources towards training and development of their employees. As a result of
which, appropriate behaviour of the staff annihilates the impediments of the customers
and encourages the customers to develop a positive cognition towards the company
ultimately influencing consumer behaviour.
Substantial empirical and theoretical evidence in the literature suggests that there is a
positive relationship between service quality and behavioural intentions of the customers
(Bolton and Drew, 1991). Among the various behavioural intentions considerable
emphasis has been placed on the impact of service quality in determining repeat purchase
and customer loyalty (Jones and Farquhar, 2003). Moreover, Boston points out that the
service quality influences preferences, loyalty and patronage. Furthermore, Cronin and
Taylor have supported the fact that service quality has a significant effect on trust and
repurchase intentions.
The importance of service quality is substantially addressed in the fast-food management
literature. Ajzen & Fishbein defined quality in fast food chain not just as product quality
itself but also the franchiser’s operating instructions in order to deliver a standardized
high quality product (Ajzen, I. & Fishbein, M,. 1980). Caves and Murphy further
explained that in the franchise chain, due to all units are working under the same
trademarks the service and product quality provided by one food franchise outlet will be
the similar to the others (Caves and Murphy, 1976). Furthermore, it was found that it is
important for the success of the franchise system that it provides immaculate standardized
service across all its locations. Under the chain builder franchise strategy, the franchisee
of the franchise chain attempts to devise and maintain a superior brand reputation by
providing and delivering the same high quality of service in all locations. Therefore, it is

crucial for fast food service managers to understand how customers perceive the service
they provide and what components might determine the nature of the perceived service
quality in fast food restaurants.
In the literature associated with the quality, there are four different perspectives defining
quality. These are indentified as transcendental, user-based, manufacturing and value
based perspectives. Transcendental prospective throws light on the five senses of human
beings. These five senses include touch, smell, seeing, hearing and tasting. The customer
makes the final impression about the company product or service by interpreting the
information the customer has derived from these sensory organs. Once this process is
complete, the customer interprets the feelings and compares the interpreted feelings with
the feelings the customer perceived or expected before the experience. Every industry,
every business organisation nowadays understands the importance of transcendental
process. This process helps the business organisations to get repeat customers and good
mouth to mouth publicity. In order to perfectionise transcendental process many
companies ask their customers to fill up feedback forms. The Information retrieved from
these forms plays a pivotal role in decision making while devising new strategies. Hence,
the main focus is on features, reliability, durability, service ability and the perceived
quality of the product. This again is differently interpreted by different customers based
on discrete personal perception and diverse external factors.
User based is the other perspective defining quality, where the customer judges the
product based on the fitness for use in preview of the requirements of the customer and
requirements can vary from rarely use to heavily used. The third perspective defining
quality is the Manufacturing base perspective which advocates that the producer also
plays a vital role in manufacturing based quality control. There are some well tested
criteria like density, tensile strength, thickness to name a few which the company has
established over a period of regular tests and research work. If the product matches with
the laid down criteria then the producer will approve the product and the consumer will
receive a generalized and highly predictable product. The guarantee and warrantee of a
product further fosters the concept that, the producer is putting its level best in order to
achieve the deliverance of the promised product or service to the customer. This not only

kindles confidence in the customers but also help the manufacturer to maintain high
degree of product quality. Value based perspectives defining quality focuses and tries to
maintain balance between conformance and performance with respect to the price
charged from the consumer. Continuous effort and research has resulted in revealing
reliable and accurate statements which help the researchers to measure the perception of
the quality of customers, allied with the fast food and beverage industry. The dimensional
matrix of the consumer behaviour in terms of customer satisfaction, branding, service
quality and pricing cannot be applied in Indian context without examining the
socioeconomic environment affecting the food business in India. Hence, any attempt to
study and apply consumer behaviour concept will not fetch much significance and
relevance with our looking into the environmental factors in both micro and macro
context. Thus, the present study examines the consumer behaviour applications for
designing strategic implications for fast food and beverage industry in India.
REFERENCES
ACSI, (2012). American Customer Satisfaction Index, retrieved from. www.ASCI.com
Ajzen, I. & Fishbein, M. (1980). Understanding attitudes and predicting social
behavior. Englewood Cliffs, NJ: Prentice-Hall.
Awasthi, Jaggi Raman, Padmanand V, (2006) A Manual for Entrepreneurs for Food
Processing Industry, New Delhi, Tata McGraw-Hill.
Bitner, M.J. (1990). Evaluating service encounters: the effects of physical surroundings
and employee response. Journal of Marketing, 54 (2), 69-81.
Bitner, M.J., B.H. Booms, and L.A. Mohr. (1994), Critical Service Encounters: The
Employees Viewpoint. Journal of Marketing, 58 (4), 95-106.
Bolton, R. N., & Drew, J. H. (1991). A longitudinal analysis of the impact of service
changes on customer attitudes. Journal of Marketing, 55 (1), 1-9.

Brewis, J, Jack, G ( 2005). Pushing speed: The marketing of fast and convenience food.
Journal of Consumption, Markets and Culture 8 (1), 49–67.
Calhoun, C. (2002). The class consciousness of frequent travelers: Toward a critique of
actually existing cosmopolitanism
Caves Richard E and William F. Murphy (1976). Franchising, Firms, Markets, and
Intangible Assets. Southern Economic Journal, 42, 572-586.
Chaudhari. G. Rajendra (2012), Indian fast food industry, Retrieved from.
http://www.scribd.com/doc/101852209/indian-fast-food-industry
Cronin, J.J. and Taylor, S.A (1992). Measuring Service Quality: A Reexamination and
Extension. Journal of Marketing, 56 (3), 55-68.
Donald, Shoultz (1989). Service Firms Are Customer Driven: Study. American Banker,
17–18.
Eugene W, Anderson, and Claes Fornell (2000). Foundations of the American
Customer Satisfaction Index, Total Quality Management, 11 (6), 869-
82.
Farquhar, J. D and Jones, H, (2003). Contact Management and Customer Loyalty.
Journal of Financial Services Marketing, 8 (1), 71-78.
Gan, L., Vernon, V., (2003). Testing the Barten model of economies of scale in
household consumption: toward resolving a paradox of Deaton
Paxson. Journal of Political Economy 111, 1361–1377.
Ganesan Sathish (2012). Flavors of Incredible India opportunity in the food industry,
Retrieved from http://www.scribd.com/doc/. 97186556/Flavors-of-
Incredible-India-09.
H.S. Krishnan (1996). Characteristics of memory associations: a consumer based brand
equity perspective. International Journal of Research in Marketing, 13
(4), 389-405.

Hall, C. M., & Mitchell, R. D. (2000). We are what we eat: Tourism, culture and the
globalisation and localisation of cuisine. Journal of Tourism Culture
and Communication, 2(1), 29–37.
Hall, C. M., & Sharples, L. (2003). The consumption of experiences or the experiences
of consumption: An introduction to the tourism of taste, Food tourism
around the world, Development management and markets (pp 1–24).
Hawkes, C. (2009). Sales promotions and food consumption. Nutrition Reviews, 67(6),
333–342.
Herrmann, A., Xia, L., Monroe, K.B., and Huber. F., (2007). The Influence of Price
Fairness on Consumer Satisfaction: An Empirical Test in the Context
of Automobile Purchases. Journal of Product & Brand Management,
16 (1), 49-58.
Holbrook and Hirschman (1982). The Experiential Aspects of Consumption: Consumer
Fantasies, Feelings, and Fun. Journal of Consumer Research, 9, 132-
140.
IBIS world (2012). Global Fast Food Restaurants: Market Research Report, retrieved
from http://www.ibisworld.com/industry/global, /global-fast-food-
restaurants.html
Inglis, D. and D. Gimlin. (2009). Food Globalizations: Ironies and ambivalences of food
cuisine and globality. In The Globalization of Food, 3-42.
Jones Thomas and Sasser .Jr, (1995).Why satisfied customers defect, Harvard business
review.
Kivela, J., & Crotts, J. C. (2006). Tourism and gastronomy: Gastronomy’s influence on
how tourists experience a destination. Journal of Hospitality and
Tourism Research, 30(3), 354–377.

Klinger, E., Barta, S.G. & Maxeiner, M.E. (1980). Motivational correlates of thought
content freguency and commitment. Journal of Personality and Social
Psychology, 39 (6), 1222-1237.
Kochi (2011) Survey finds a rising palate for the instant variety, Retrieved from.
http://www.thehindu.com/todays-paper/tpinternational/article -
1123097.ece
Kotler Philip (2002). Marketing Management, Prentice Hall: Press .
M.A. Jones, & J. Suh (2000). Transaction-Specific Satisfaction and Overall Satisfaction:
An Empirical Analysis. The Journal of Services Marketing, 14 (2),
147-159.
MacInnis Deborah J, Jaworski Bernard J ( 1989). Information processing from
advertisements: towards an integrative framework, 53, 1 – 23.
McColl-Kennedy, J., & Schneider, U. (2000). Measuring customer satisfaction: why,
what and how. Total Quality Management, 11 (7), 1-14.
Mennell, S. (1985). All Manners of Food: Eating and Taste in England and France from
the Middle Ages. Oxford: Blackwell.
Nanjundaiya, Remesh (2011). Coming out swinging. Retrieved from,
http://www.economist.com/ users
Neal,W. D. (1999). Satisfaction is nice, but value drives loyalty. Marketing Research,
21–23.
QSR News (2011). Top growing markets for restaurants, Retrieved from,
http://www.QSR.com
Raphael, T.E. (1995). Diverse learners participating in regular education “book
clubs.” Reading Research Quarterly, 30,352-380 Retrieved from.
.http://www.scribd.com/doc/101852209/indian-fast-food-industry

Richard, Spreng A. and Mackoy D. Robert (1995). An Empirical Examination of a
Model of Perceived Service Quality and Satisfaction in Marketing
Theory and Applications, 216-217.
Roth, M. and Romeo, J.B. (1992). Matching product category and country image
perceptions: a framework for managing country-of-origin effects.
Journal of International Business Studies, 23 (3), 477-98.
Upadhya. Ram, (2004). Glocom modification: How the global consumes the local
McDonald’s in Israel. Current Sociology, 52(1), 11–31.
Wadhawan Nisha (2012). Doing Business in India 2012 Country Commercial Guide for
U.S. Companies, retrieved from http://export,gov/india/build/. groups/
public/@eg_in/documents/webcontent /eg_in_049379.pdf
Wesslen, A, Sepp, H & Fjellstrom, C (2002). Swedish Preschool Children’s Experience
of Food. International Journal of Consumer Studies, 26 (4), 264-272.
Westbrook, Robert A. (1980). Intrapersonal Affective Influences on Consumer
Satisfaction with Products. Journal of Consumer Research. 7, 49-
54.
Wikipedia (2012). Economy of India. Retrieved from http://en.wikipedia.org/wiki/
Economy_of_India.
Xia, L., Monroe, K. , & Cox, J. (2004). The Price Is Unfair: A Conceptual Framework
of Price Fairness Perceptions. Journal of Marketing, 68 (4), 1-15.
Yu ksel and Rimmington, (1998). Customer satisfaction measurement, Cornell hotel
and restaurant administration quarterly, 39 (6), 60-70.
Zeithaml,V.A., Berry, L. L., & Parasuraman,A. (1996).The behavioural consequences
of service quality. Journal of Marketing, 60, 31–46.

Chapter – II
Review of Literature and
Research Gap

Chapter 2 Review of Literature and Research Gap (33-60)
2.1 Review of Literature 33
2.2 Research Gap and Rationale of the Study 54
References 55
2.1 REVIEW OF LITERATURE
During the past two decades, growing number of fast food companies in an increased
competitive scenario have undertaken a number of methodical endeavours to reshape the
consumers’ behaviour for influencing favourable decision towards themselves. Therefore,
high customer satisfaction is of pivotal importance for the success of the whole fast food
and beverage industry, especially for the financial and economic sustenance of these fast
food restaurants. However, existing literature and research indicates that there is
inadequacy of the delivery of the required customer satisfaction level in this industry.
Due to the vast scope of the relationship matrix between customer satisfaction, brand
loyalty, pricing policy and service quality, it is an arduous task for the researcher to
address all the related research work. However, through this chapter an effort has been
endeavored to provide a comprehensive account of the findings of the various studies
related to the subject matter of the present study, so as to provide a basis for the
formation of an outline of the research design to be adopted for the study.
Jooyeon Ha and Soo Cheong Jang (2010) have empirically examined the relationship
among perceived service quality, satisfaction and loyalty in the Korean ethnic restaurant
segment. The researchers have used hierarchical regression analysis to investigate the
direct effects of service and food quality on customer satisfaction and loyalty. The study
also highlights the significance of the customer perception of atmosphere on the success
of the ethnic restaurants. The study points out that the service and food quality has
positive and significant effect on customer satisfaction and loyalty. The study suggests
that employees service and food quality are of immense importance for ethnic
restaurants. Additionally, this study found that employee service together with ideal
restaurant atmosphere effectively increases the satisfaction and loyalty of customers. The
study makes important contribution towards understanding the formation of satisfaction
and loyalty. From a practical prospective, the quality of physical environment is a critical
tool for overall success of the organisation.
Victor P. Lau, Thamis Wing-chun Lo, Zhenquan Sha and He Yun (2007) in the
research on “Service quality in restaurant operations” have proposed and tested a
conceptual model of service quality with the help of structural equation modelling. Using

data from two large full service restaurants in southern China, the researchers have
investigated the relationship among the service quality, customer satisfaction, and
frequency of patronage. The results of the study supported significant relationship
between service quality and customer satisfaction, service quality and repeat patronage.
However, the relationship between customer satisfaction and repeat patronage was found
insignificant and could not be supported. For the model under study, the researchers also
provided important insights into some of the additional dimensions of service quality that
are significant in the field of restaurant operations. The researchers have also
necessitated the development of strategies which have the fusion of the elements of
service quality, customer satisfaction and repeat patronage in order to elevate the overall
sales turnover of the restaurants.
Cuma Akbay, Gulgun Yildiz Tiryaki and Aykut Gul (2007) have investigated the
relationship among consumers’ attitudes, socio-economic characteristics and fast
food consumption frequency. The researchers have used Chi-square test of independence
to compare the consumers’ fast food consumption frequencies. The researchers have
developed an empirical model that signifies on the basis of consumer, the consumption
frequency of fast food products using the random utility framework. The empirical model
was estimated by using an ordered probit approach to obtain the coefficients that are
applied to the calculation of marginal effects and probabilities. The sign and significance
of coefficients and marginal effects were used to ascertain consumer characteristics,
which are important to study the frequency of fast food consumption. The results of the
study indicate that demographics such as age, income, education, household size,
presence of children along with other behavioural factors such as consumer attitude
towards the price of fast food, health concerns and children preference, significantly
influence the frequency of fast food consumption.
M.Omer Azabagaoglua and Yasemin Oramana (2011) have analysed customer
expectations in food sector in the province of Istanbul, Ankara and Izmir after 2008
world economic crisis. The researcher has applied theory of reasoned behaviour. The
measurement of customer attitude towards food products have taken into consideration
the product features, effect of preference group, past behaviour and behavioural intention

variables. The Variables which influencing consumers’ purchase intention have been
tested with the help of GLM model. The research model for the study indicates that
respondents’ attitude towards the particular food product has influence on their purchase
intention. With other variables in the model, price was not statistically significant as a
determinant of purchase intention. After the 2008 global economic crisis, surveys on food
shopping behaviour indicates that the consumer intend to decrease food expenditure,
prefers cheaper brands and cheaper retailers.
Wen-Bao Lin (2007) has presented an innovative model for understanding customer
satisfaction and used the nonlinear fuzzy neutral network for testing the model. The result
of the empirical research illustrates that in functional quality, the interpersonal based
service encounter is better than the technology based service encounter. Moreover, when
it comes to technical quality, the technology based service encounter is better than the
interpersonal based service encounter. The study reveals that the functional quality has a
positive and significant effect on customer satisfaction, the service quality has a positive
and significant effect on service value, the service value has a positive and significant
effect on customer satisfaction. The service encounter has a positive and significant effect
on relationship involvement and the relationship involvement has a positive and
significant effect on customer satisfaction.
Ying-Feng Kuo, Chi-Ming Wu and Wei-Jaw Deng (2009) have analysed the
relationships among the service quality, perceived value, customer satisfaction, and post
purchase intentions in the fast food industry. The researchers have used structural
equation modelling and multiple regression to analyze the data collected from students of
15 major universities in Taiwan. The study reveals that service quality positively
influences both perceived value and customer satisfaction whereas, perceived value
positively influences both customer satisfaction and post purchase intention. However,
the study depicts that the service quality has a negative influence on post purchase
intentions. The study suggests that in order to increase the customer satisfaction, the
business organisation must focus on increasing the perceived value and service quality.

Farhana Nadia and Islam Shohana (2011) while conducting the study “Exploring
Consumer Behaviour in the Context of Fast Food Industry in Dhaka City” have examined
the relationship between customers’ attributes, quality, value and convenience related
perception with income. The study reveals that quality and value related perception is
strongly and positively influenced by income. The study highlights that there is a strong
and positive relationship between overall customer service and attributes related to the
quality and value. Moreover, the study reveals that the customers are interested to travel
distances for their favourite restaurants. In order to increase the customers’ satisfaction
with regards to customer service, the fast food restaurants must focus their strategies to
increase the attributes related to the quality. Additionally, the study suggests that the
people are loyal to their favourite fast food restaurants without having any effect of price
variance.
Verbeke Wim (2005) has evaluated the factors which are affecting the acceptance of the
concept of functional foods. According to the researcher, the acceptance of functional
foods is determined by having a score of minimum 3 on a 5 point Likert scale measuring
likes or dislikes of the food. If the food tastes good, the consumer will give a score of 3 or
above. The study shows that among the sample, approximately 50 percent have the
acceptability of the concept of functional foods. A multivariate probit model is used by
the researcher to test the simultaneous impact of demographic, cognitive and attitudinal
factors on acceptance of functional foods. The study highlights that the belief in the
health benefits of functional foods is the main determinant for the acceptance of
functional foods. Moreover, the likelihood of accepting functional food increases with the
presence of an illness in the house. The study exhibits that the likelihood of rejecting
functional foods decreases with the increase in the level of awareness of the concept
pertaining to the health benefits delivered by functional foods. The study reveals that this
adverse impact of low awareness decreases with increased consumer age, belief,
knowledge and presence of an unhealthy family member.
Yinghua Liu and Soo Cheong Jang (2009) have analysed the effect of food quality,
service reliability and environmental cleanliness on the satisfaction level of the
American customers visiting Chinese fast food restaurants. This study also identifies the

attributes of the Chinese restaurants which mostly influence the satisfaction and
behavioural intentions of the customers. In this study, the researchers have used
Importance Performance Analysis approach to find the quality gaps. The study points out
that food quality, service reliability and environmental cleanliness have strong and
positive influence on the satisfaction level of American customers. Moreover, the study
shows that these three attributes are pivotal to create positive post dining behavioural
intentions. Additionally, food taste and service reliability appear to be the next most
important attributes for the success of the Chinese restaurants. The Importance
Performance Analysis shows that the waiting time after giving order and considerate staff
service are the two important areas where Chinese restaurateurs need to make
improvements. The study also suggests that the managers of the Chinese restaurants
should rationally allocate their resources for enhancing the customers’ satisfaction and
desired behavioural intentions.
Joon David and Wuk Kwun (2011) have examined the relationships among campus
food service dimensions, perceived value and the satisfaction level of the patrons of the
fast food industry. The study also analysis the effects of perceived value and campus food
service attributes on consumers’ attitude. The study also evaluates the roles of gender
differences in the process of attitude fromation. The researchers have used general linear
model, multiple regression and descriptive statistics in order to find the answers to the
research questions. The results of the study point out that the campus food service
attributes and perceived value positively influence the satisfaction level of the customers.
Moreover, perceived value and campus food service attributes have direct and positive
effect on the consumers’ attitude. The study also reveals that the attitude fromation
process differ notably between male and female consumers. The study suggests that in
order to increase the customers’ satisfaction level, management should direct their
resources towards the strategies which can elevate the campus food service attributes and
perceived value of the customers.
Groth Markus and Gilliland W Stephen (2001) have conducted research on the basis
of two field studies which examined the role of procedural justice in the delivery of
services in fast food restaurants. In the study, waiting time and waiting procedures are

considered as two dimensions of the procedural justice. The study analysis the customers’
reaction towards these identified two dimensions of procedural justice. The first field
study examines the service experience and perceptions of justice of the customers of the
two fast food restaurants. Under the experiment, the restaurants used two different types
of waiting procedures single-line systems and multiple-line systems which were switched
systematically between each other in such a way that there was no difference in the
specified waiting time and consequently its effect was measured towards customers’
opinion. The second study consisted of a field survey in which customers of a fast food
restaurant were asked regarding their service experiences towards waiting time to service
delivery. The results of both the studies showed that customers in single line system
perceived waiting time to be shorter as compared to customers in multiple line system.
Furthermore, perceived waiting time and perceptions related to the waiting procedures
had direct effect on the customers waiting experience. Moreover, the study suggests that
the customers’ reaction to the waiting period is more positive when perceived wait time is
short and the waiting procedures were perceived as adequate.
Seung-Hee Baek, Sunny Ham and Il-Sun Yang (2006) have empirically examined the
perception of college students visiting the fast food restaurants in Philippines. The study
identifies the dimensions which the students feel important while selecting a fast food
restaurant. The researchers have used conjoint analysis and descriptive statistics to find
the answers to the research questions. The study reveals that menu price is the most
important dimension followed by quality of the food served, restaurant brand, staff
service and hygiene related factors. The study suggests that in order to increase the
frequency of the college students, the management of the fast food restaurants need to
concentrate on menu pricing and improve upon the staff service, food quality and
restaurants cleanliness. Moreover, this study is imperative for fast food companies which
are planning to enter Philippines market as the study helps in understanding the different
components of the Philippines food service industry and developing effective marketing
and operational strategies.
Lefa Teng (2009) has investigated the consumers’ response towards the price discount
associated with or without minimum purchase requirements. The researcher has used
brand categorization model and mixed logit statistical technique on the data collected
from customers of fast food restaurants in China. The study illustrates that when the
discount is given to the customers in exchange of minimum purchase, the customers are
less inclined towards buying whereas, when the customers are given discount without a
minimum purchase, they are more inclined towards acquiring the product. The effect of
the discounts reveal that they change consumers’ attitude and purchase intentions
regarding a particular brand by moving it from consumers hold set to consideration set.
The result of the study provides new insight regarding the use of brand categorization
model to predict the effects of different types of price discounts
on consumers’ purchase behaviour. Moreover, the study shows that when a price discount
without a minimum purchase requirement is applied to a brand, it moves to consideration
set. Additionally, the study reveals that the effects of the two types of price discounts
on consumers' attitudes and purchase intentions are significantly different.
Riadh Ladhari, Isabelle Brun and Miguel Morales (2008) have analysed the effect of
restaurants services on dining satisfaction of customers in the fast food industry. The data
was collected from the students of University of Moncton and University Saint Mary's
situated in Canada. The study reveals that positive emotions, perceived service quality
and negative emotions are the three sources of customer’s satisfaction vis-a-vis restaurant
services. Moreover, the study shows that emotions mediate the impact of perceived
service quality on dining satisfaction wherein positive emotions have more impact on
customers’ satisfaction than negative emotions. Dining satisfaction has a significant
impact on recommendation, customer loyalty and willingness to pay more. Furthermore,
the study suggests that fast food restaurants in Canada need to enhance the positive
perception of the customers related to the restaurants’ service in order to increase the
overall dining satisfaction.
Cheol Park (2004) has explored the relationship between consumer values and the
importance of fast food restaurants’ attributes. The researcher has used structural
equation modelling and multiple regression to analyse the customers of fast food
restaurants in Korea. The consumer values can be divided into Hedonic and Utilitarian
factors. The study reveals that Hedonic value of eating out had positive correlation with
mood, quick service, cleanliness, food taste, employee kindness, and facilities whereas,
the Utilitarian value is centred on reasonable price, and promotional incentives. The study
highlights that when it comes to buying frequency of the customers, the Hedonic value is
more influential than Utilitarian value. This study proves that Korean consumers choose
fast food restaurants more by hedonic values of eating out rather than the utilitarian
value. The study suggests that fast food restaurants in Korea must consider Hedonic
aspects while devising strategies for attracting customers.
Heung C.S. Vincent and Gu Tianming (2012) have empirically investigated the
influence of the restaurants’ atmosphere on the dining satisfaction and behavioural
intentions of the customers of fast food restaurants. In the study, the data is collected
from 10 full service restaurants in Hong Kong. The researchers have identified five
dimensions of restaurant atmosphere, which are facility aesthetics, ambience, spatial
layout, employee factors, and the view from the restaurants window. The researchers
have used factor analysis and multiple regression analysis to answer the research
questions. The results of the study reveal that the restaurants’ atmosphere has a positive
and significant influence on customers’ dining satisfaction and their behavioural
intentions. Moreover, the study identifies that the restaurant’s atmosphere positively
influence the customers’ willingness to pay more and their intentions to spread positive
word of mouth. Additionally, the dining satisfaction was found to have a positive and
significant influence on behavioural intentions, specially recommending the restaurant to
their acquaintances.
Young Hoon Kim, MinCheol Kim and Ben K. Goh (2011) have analysed the effects of
perceived value on customers’ intentions to revisit and their satisfaction level. The study
also observes the effect of satisfaction on customers’ intention to revisit. In this study, the
researchers have used modified theory of reasoned action. The study unveils that
perceived value has a strong and positive effect on the customers’ satisfaction and
intentions to revisit. Moreover, the study shows that customer satisfaction and intention
to revisit are directly proportional to each other. The study reveals that patrons’ intention

to revisit is predicted by their level of satisfaction and perceived value. The study
suggests that in order to increase the customer frequency, the management of the business
organisations must focus their resources towards elevating the present condition of
perceived value and customers’ satisfaction.
Ungku Zainal (2011) has found that unlike health inspectors, fast food consumers can
only rely on the visible cues to judge the level of food safety in eating establishments.
Therefore, the researcher has conducted this study in order to know the effect of
constructs of food safety cues on the customers dining decisions. The researcher has used
confirmatory factor analysis and descriptive statistics to answer the research questions.
The findings of the study indicate that food service hygiene is one of the top
considerations for the customers while selecting a dining place. The researcher suggests
that for effective functioning of the restaurant, the management needs to incorporate the
food service hygiene as one of their most important priorities.
Nam Jang-Hyeon and Timothy Lee (2011) have analysed the relationship among
foreign travellers’ satisfaction, intentions to recommend and revisit the traditional Korean
restaurants. In the study, the researchers have used dimensions of SERVQUAL and
applied co-relation, multiple regression and structural equation modelling on the
customers of conservative Korean restaurants. The study reveals that the dimensions of
service quality like reliability, assurance, tangibility, empathy and responsiveness had a
positively influence on the foreign travellers’ satisfaction via-a-via the traditional Korean
restaurants. The study also illustrates that the foreign travellers’ satisfaction has a positive
influence on their intentions to revisit and recommend the name of the restaurant to their
acquaintances. The study suggests that the restaurants need to direct more attention
towards reliability, assurance, tangibility, empathy and responsiveness of the staff to
increase the satisfaction level of the foreign travellers. Moreover, the results of the study
can help the management of the restaurants to develop strategies which may strengthen
the foreign travellers’ satisfaction towards the traditional Korean restaurants.
Burton Scot, Howlett Elizabeth and Heintz Andrea Tangari (2009) have examined
how objective nutritional information influences purchase intentions. The study also
analyse how accurately consumers of fast food restaurants are able to estimate the sodium
contents, calories and fats in their food. The researchers have applied ANOVA and
descriptive statistics on the data collected from the customers of fast food restaurants in
the city of North Carolina USA. The study points out that many consumers have little or
no understanding of the calorie, fat, and sodium levels of many fast food meals which
they consume. Moreover, the study reveals that objective nutritional information has
strong and positive influence on the purchase intentions of the customers. The study also
shows that as the customers became more aware of the nutritional information in the
meals, they inclined more towards healthy meals as compared to less healthy but more
tastier meals. The study suggests that the fast food restaurants need to provide more
nutritious food items and present more nutritional information about them in order to
increase the purchase intention of the customers.
Young Namkung, SooCheong Jang and Soo Keun Choi (2011) have investigated how
the consumers of the quick service restaurants respond to the service failure at different
service stages and loyalty levels. The data was collected by distributing a self
administered questionnaire to the customers of fast food restaurants in USA. The study
reveals that when a service failure occurred during the greeting or seating, which is stage
one and order taking or delivery, which is stage two, the customers were likely to
complain at any service stage. Moreover, the study illustrates that highly
loyal customers showed a significantly higher willingness to complain as compared to the
less loyal customers. The study recommends that the managers of the fast food
restaurants need to consider the complaints of dissatisfied customers seriously and take
immediate appropriate corrective actions to ensure that mistakes are not repeated and the
customers remain loyal to the restaurants.
Dohee Kim, Vincent P. Magnini and Singal Manisha (2011) have analysed the
relationship among brand personality perceptions, brand preference, attitudinal loyalty,
and positive word of mouth behaviour for the Olive Garden and Chili's restaurant chains.
The researchers have used structural equation modelling, co-relation and descriptive
statistics to achieve the objectives of the research. The study reveals that for both the
restaurant chains, brand personality perceptions have a strong and positive effect on
brand preference and attitudinal loyalty. Moreover, the brand preference has a positive

impact on attitudinal loyalty wherein attitudinal loyalty has a positive influence on word
of mouth communication among the customers. The study advocates that in order to
increase brand preference and attitudinal loyalty the management of Olive Garden and
Chili's restaurant chains need to concentrate more resources towards enhancing the brand
personality perceptions of their customers.
Hyun Sean Sunghyup, Kim Wansoo and Lee Jae Myong (2011) have analysed the
effect of advertising, perceived value and behavioural intentions on patrons’ emotional
responses in the restaurant industry. Moreover, the study aims to investigate that which
attributes of the advertising bears the strongest impact on behavioural intentions of the
patrons. The researchers have employed factor analysis, multiple regression and
descriptive statistics to achieve the objective of the research. The study reveals that
perceived value, behavioural intentions and advertising has strong and positive effect on
patrons’ emotional responses. Additionally, out of four attributes of the advertising,
stimulation was found to plonk the strongest impact on patrons’ behavioural intentions.
Furthermore, the study illustrates that the level of arousal induced by advertising plays a
moderating role in the relationship between patrons’ emotional responses and hedonic
values. The study suggests that in order to acquire better emotional responses from the
customers, the management of the restaurants must focus their resources towards
elevating the present condition of customers’ perceived value and simulation.
Kim Wansoo, Ok Chihyung and Canter D. Deborah (2010) have empirically
investigated the effect of social switching costs, intrinsic inertia and intrinsic variety
seeking on the frequency of revisit of the customers of fast food restaurants in the United
States of America. The researchers have used series of moderated hierarchical regression
analysis on the data collected from the customers of the fast food restaurants to answer
the research questions. The study reveals that social switching costs and intrinsic inertia
have strong and positive effect on the frequency of revisit of the customers, whereas
intrinsic variety seeking has negative effect on the frequency of revisit of the customers.
Moreover, the study highlights that the customers’ involvement with the restaurant and
perceived brand heterogeneity enhanced the frequency of revisits.
Glanz Karen, Hewitt M. Anne and Rudd Joel (1992) have examined the influence of
nutrition labelling, customer shopping behaviour and point of purchase on the purchase
decision of the customers of quick service restaurants. The data has been collected from
the customers of restaurants in Philadelphia, Scottsdale and Arizona. The study shows
that many customers want nutritional information, but they often do not employ it
because it is difficult to use and not readily available. The customers have been found to
consider nutrition as one of the several factors influencing purchase decision. The study
shows that nutrition labelling, point of purchase and customers’ shopping behaviour has a
positive influence on the purchase decision of the customers. The study also reveals that
nutrition is not the only criteria which will influence the purchase decision of the
customers. Ergonomics of the food store, cleanliness, good behaviour of staff and local
touch plays a pivotal role in the overall satisfaction of the customers.
Lazzarin Uggioni Paula and Elisabete Salay (2012) have found that the accurate
measurement of consumers’ attitude could be an important tool for
understanding consumer behaviour in food sector. Therefore, the researchers have
developed a scale to measure consumer attitude regarding food safety. To achieve the
above mentioned research objective, the researchers developed interview items followed
by complete pilot testing, item analysis which includes influence of social desirability
and total item correlation, reliability test which consists of internal consistency and test
retest and finally the validity assessment consisting of discriminative validity and
exploratory and confirmatory factor analysis. The data for the research was taken from
Campinas, a city of Brazil. The final scale included 24 items and had a Cronbach’s alpha
coefficient of 0.79 and a content validation coefficient of 0.99. The confirmatory factor
analysis validated a model with five factors and the final instrument distinguished
reasonably well between the groups and showed satisfactory reproducibility (r = 0.955).
The study concludes that the scale validity and reliability were satisfactory.
Kisang Ryu, Heesup Han and Kim Tae-Hee (2008) in the research “The relationships
among overall quick-casual restaurants’ image, perceived value, customer satisfaction,
and behavioural intentions” the researchers have analysed the relationship among
customer satisfaction, overall quick-casual restaurants’ image, perceived value and

customers’ behavioural intentions. The study revealed that perceived value significantly
influenced the customer satisfaction and overall quick casual restaurant’s image.
Moreover, the study shoes that perceived value and customer satisfaction are significant
predictors of customers’ behavioural intentions. The study suggests that overall quick-
casual restaurants image produces a significant impact on the perceived value of the
customers. Additionally, customer satisfaction can act as a partial mediator in the
relationship between overall quick casual restaurant image and behavioural intentions.
Woo Kim Gon, Christy Yen Nee Ng and Kim Yen-soon (2009) have investigated the
relative importance of institutional dine serve dimensions which includes food quality,
atmosphere, service quality, convenience, value and price that affects customers
satisfaction in the university dining facilities. The study examines the influence of
customers’ satisfaction on return intentions and word of mouth endorsements. The
researchers have used a web based survey questionnaire which was distributed to the
students of Midwest public University. The researchers have used factor analysis,
ANOVA, co-relation and multiple regression to analyze the data. The study highlights
that all institutional dine serve dimensions had a significant and positive effect on overall
customer satisfaction and intentions to revisit. The researchers have concluded that this
will not only strengthen customers’ loyalty but also improve the reputation of the dining
facilities and generate greater revenue.
Kynda R. Curtis, Jill J. Mccluskey and Thomas I. Wahl (2007) have examined the
effect of gender, higher income levels, age, and opinions concerning the taste of
western foods on fast food consumption in China. In the study, the researchers have used
ordered logit model on the data collected from the fast food consumers dwelling in
Beijing city of China. the study reveals that the female gender, higher income levels,
younger adults, existence of children in the house, and positive opinions concerning the
taste of the western food have a positive and significant influence on the consumption of
fast food in China. Moreover, the study suggests that proper targeting of consumers who
exhibit preferences for western foods will be essential for companies wishing to
successfully enter into the Chinese food market.
Kristin L. Morse and Judy A. Driskell (2009) have analysed the influence of gender
on consumption of fast food and nutritional self assessments of students. A 12 item
structured questionnaire was filled by male and female students aged between19 to 24
years of Midwestern University. The study revealed that five to seven percent of the
students ate lunch and dinner at a fast food restaurant. The predominant reasons given for
eating at fast food restaurants were limited time, good taste, eating with family or friends
and economical services. The study found that larger number of male students as
compared to female students ate at fast food restaurants because male students thought
that these restaurants were inexpensive and economical. Moreover, the study reveals that
the frequency of eating at the fast food restaurants was significantly different for male
students as compared to female students because male students gave more attention to the
energy content of the food items while making their selection decision. Additionally, the
study shows that the body mass indices of male students were significantly higher than
that of female students. Furthermore, the study illustrates that higher percentage of
female students strongly agreed with the statement “the nutrition content of food is
important to me.” The study concludes that several gender differences were observed in
the fast food consumption and nutritional beliefs of these college students.
Kirsten I. Dunn, Mohr Philip, Wilson J. Carlene and Wittert A. Gary (2011) have
analysed how successfully the theory of planned behaviour predictes fast
food consumption patterns in Australia. The researchers have used structural equation
modelling to answer the research questions. The study indicated that the theory of
planned behaviour successfully predicted fast food consumption patterns. The study also
reveals that consideration of future consequences, self evaluation and fear of negative
evaluation has direct effect on the fast food consumption in Australia. Moreover, the
study suggests that the fast food consumption is influenced by general demand for meals
which are tasty, satisfying, and convenient to purchase. These factors
reflect immediate need and over rule the customers’ concerns about longer term health
risks associated with the intake of fast food.
Dag Bennett (2004) has examined the influence of retail environment on the loyalty of
Australian and Taiwanese fast food customers. The researcher has used ANOVA post

hoc tests, factor analysis and descriptive statistics to achieve the research objective. The
study reveals that retail environment has strong and positive effect on the loyalty of
Australian and Taiwanese fast food customers. The study illustrates that in both the
countries, there is one third purchase from the same branded outlet twice in a week,
whereas during the same time period, two third of the customers buy from a different
branded outlet. This was true for all the brands irrespective of the type of food on offer
and whether the brand was local or global. Moreover, the study found that despite big
differences in Australian and Taiwanese culture, type of food and retail environment, the
loyalty of the fast food customers towards the fast food outlets is nearly identical. The
study suggests that business organisations need to attract customers rather than focusing
their resources on encouraging the loyalty of the customers.
Mueller R.D, Mack R. and McMullan R. (2003) have evaluated the effect of service
failure and compensation methods on the repeat patronage intentions of the customers.
The data for the study has been collected from the customers of American restaurants.
The study shows that the customers expect the compensation, once the service failure has
occurred. Moreover, the study reveals that service failure has a negative effect whereas
compensation methods have a positive effect on the repeat patronage intentions of the
customers. The study suggests that restaurants need to use less expensive compensation
methods in order to bear minimum financial damage to the organisation. Additionally, as
a large number of service firms continue to seek opportunities in foreign markets, more
efforts need to be directed at assessing cross national similarities and differences so that
appropriate strategies can be devised.
Carmen Berne, Jose M Mugica and M Jesus Yague (2001) have analysed the effect of
variety seeking on the customers’ retention for food services. The researchers have used
structural equation modeling and descriptive statistics on the data collected from the
University of Zaragoza, University of Navarra and University of Madrid situated in Spain
to answer the research question. The study shows that variety seeking has strong and
negative effect on the customers’ retention for food services i.e. the more is the variety
seeking behaviour in the customers, the less they will come to the same restaurant leading
to the reduced retention of the customers. The study suggests that in order to elevate
customer retention, the management of the business organizations must focus their
resources towards improving the condition of service quality, customer satisfaction and
staffs’ involvement in the relationship with the customer.
Kenneth L. Bernhardt, Donthu Naveen and Kennett A. Pamela (2000) have
examined the relationship between customer satisfaction, employee satisfaction and
performance of the employee. In the study, the researchers have used time series data to
accomplish the objective of the research. The study reveals that employee satisfaction has
strong and positive relationship with customer satisfaction. Moreover, the study
illustrates that employee satisfaction has strong and positive relationship with
performance of the employees. The study advocates that in order to increase the customer
satisfaction, the management of the organisations must improve the employees’
performance which is directly related to the employees satisfaction.
Chen Mei-Fang (2007) have analysed the factors affecting the food purchasing
behaviour of the customers of fast food restaurants in Taiwan. The researcher has used
Moderated regression analysis and Ajzen’s Theory of Planned Behaviour to explain the
consumers’ food purchasing behaviour on the data. The findings of the study reveal that
the food related personality traits, price of the food item, place of purchase, nutritional
value of the food and brand associated with it exerted maximum influence on the food
purchasing behaviour of the customers. Moreover, good furniture, lightings and music
also played a pivotal role in the decision making process of the customers. The study
recommends that personality traits, place of purchase, price of the food item, nutritional
value, brands associated with the food, furniture of the restaurant, lightings and music
must be improved by the fast food restaurants in order to attract the customers to their
favourite food serving locations and ultimately increasing the profits of the organisation.
Goyal Anita, Singh N.P (2007) have analysed the effect of hygiene and nutritional
values on the level of satisfaction of young Indian consumers of fast food restaurants.
The researchers have used multivariate statistical tools to answer the research questions.
The study reveals that that hygiene and nutritional values have positive effect on the
satisfaction level of the Indian consumers. Moreover, the study shows that the young

Indian consumers have passion for visiting fast food outlets for fun and change but their
first choice is homemade food. They feel homemade food is much better than food served
at fast food outlets. They have the highest value for taste and quality followed by
nutritional value and hygiene. The study suggests that fast food providers need to focus
on hygiene and nutritional values to increase the customer satisfaction. There is need to
communicate the information about hygiene and nutritional value of fast food to the
customers which will help in building the trust in the food providers.
Hong Qin and Prybutok Victor R. (2009) have examined the relationship among
service quality, perceived value and customer satisfaction in fast food restaurants. In the
study, the researchers have used exploratory factor analysis and confirmatory factor
analysis for assessing construct reliability and validity. Moreover, Structural equation
modelling was employed to estimate the relationship among service quality, customer
satisfaction, and behavioural intentions. The study reveals that service quality, perceived
value and food quality positively influenced customer satisfaction. The study also reveals
that service quality and perceived value are not the only criteria which will influence the
satisfaction of the customers but ergonomics of the food store, cleanliness, good
behaviour of the staff, food quality and local touch also plays a pivotal role in the overall
satisfaction of the customers.
Paravantis John, Bouranta Nancy and Chitiris Leonidas (2009) have evaluated the
effect of internal service quality on external service quality. The data was collected from
the restaurants of Piraeus city located in Greece. The researchers have used canonical
correlation analysis and factor analysis on the customer data. Factor analysis of external
service quality revealed six factors including product, organizational image, safety and
choice, empathy, reliability and responsiveness whereas, internal service quality factors
included professionalism and internet. Canonical correlation revealed that the internal
service quality dimensions of safety, reliability and internet exert a direct positive
influence on the external service quality dimensions of organizational image, empathy
and responsiveness. The study suggests that restaurants should focus on internal service
quality in order to improve external service quality.

Lockie Stewart, Lyons Kristen, Lawrence Geoffrey and Grice Janet (2004) have
analysed the effect of attitudinal, behavioural and motivational factors on the
consumption of organic food by the Australian customers. The researchers have used
path analysis and Structural equation modelling on the data collected from the Australian
restaurants. The study reveals that behavioural, motivational and attitudinal factors have
positive influence on the consumption of organic food by the Australian consumers.
Moreover, the study shows that behaviour of the customers related to recycling and to
lower pollution levels in addition to convenience in the purchase and preparation of food
has positive influence on the customers purchase decision and motivates them to
purchase organic food more frequently. Gender, education and the level of responsibility
taken by respondents for food provisioning within their households also had a positive
effect on the organic food purchase intentions. The study suggests that the restaurants
need to incorporate more food items bellowing to the category of organic foods.
Brady Michael K., J Christopher. Robertson and Cronin J.Joseph (2001) have
evaluated the effect of service quality and service value on consumers' behavioural
intentions. The data collected from North American and Latin American fast-
food consumers was subjected to multiple regression and descriptive statistics in order to
achieve the research objective. The study illustrates that when it comes to North
American consumers, their consumers' behavioural intentions is influenced more by
service quality. Whereas, when it comes to Latin American customers, their consumers'
behavioural intentions are influenced more by service value. Additionally, the
American consumers tend to place more emphasis on the tradeoff between what they
receive in the service encounter and what they have to give up to receive the benefits.
Ahmad Jamal, Peattie Sue and Peattie Ken (2012) have examined the consumers'
response to different sales promotions for packaged food products. The primary data for
the research was collected by in depth interviews with the customers who visit markets
regularly. The researchers have applied cluster analysis and descriptive statistics to
answer the research questions. The results of the study show that sales promotion
techniques like loyalty programmes, trade off up to 40 percent and point of sale displays
had positive and strong effect on the purchase decision of the customers whereas, price
pack deals, check out coupons and online interactive promotional games had very less
effect on the customers’ purchase decision. Furthermore, the study recommends that
packaged food retailers need to focus more on loyalty programmes, trade off up to 40
percent and displays at point of sales to increase the sale volume of their products.
Bell Robert A., Cassady Diana, Culp Jennifer and Alcalay Rina (2009) have
evaluated the food items advertised on television channels serving children and youth,
and have also compared the advertisements on English language channels with
advertisements on Spanish language channels. The researchers have observed
television food advertisements appearing on Saturday mornings and weekday afternoons.
A random sample of 1,130 advertisements appearing on 12 channels catering to children,
youth, black youth, and general audiences were analyzed. Moreover, each advertisement
was coded for the nature of the item promoted, the selling propositions used and any
nutritional claims made. The researchers have used Cross-tabulations using Fisher's exact
test to answer the research questions. The study illustrates that one-fifth of commercials
were for food and food advertisements were particularly prevalent on children's channels
on Saturday. Furthermore, 70 percent of food advertisements were for items high in sugar
or fat. More than one fourth of food advertisements were for fast-food restaurants, which
were common on MTV and Spanish-language channels. Advertisements for fruits and
vegetables were rare constituting only 1.7 percent of the total advertisements. One
nutrition-related public service announcement was found for every 63 food ads. The
study shows that food advertisements continue to promote less healthy items. The study
suggests that education and media literacy are the best strategies for mitigating the
adverse effects of advertising.
Yoon Jang Jung, Kim Woo Gon and Bonn A. Mark (2011) have observed Generation
Y consumers’ behavioural intentions towards green restaurants. The researchers have
used cluster analysis and descriptive statistics on the data collected from the University
students of South Eastern United states. The students were between 17 years to 30 years.
The result of the study reveals that Generation Y consumers’ liked green restaurants and
they preferred to visit green restaurants again as they considered it nature friendly,
beautiful, enticing and a unique place to be with friends. The study advocates that green

restaurants need to provide organic food as there is huge demand of organic food in the
Generation Y customers. Moreover, alternative energy sources like solar lights, solar
powered automatic movement sensor doors, solar beer dispensers and recycled furniture
need to be installed as these things allure the Generation .Y. Moreover, they are nature
friendly and economical to used and maintain in long run.
Lyndal Wellard, Colleen Glasson and Kathy Chapman (2012) have inspected the
nutritional composition of children’s meals from six fast food chains in Australia. The
researchers have compared the calorie, saturated fat, sugar and sodium content of all
meals against the fast food industry defined nutrient criteria for healthy meals and
children’s recommended daily nutritional requirements. The study found that the overall
children’s fast food meals are high in saturated fat, sugar and sodium. Only 16 percent
and 22 percent of meals met the industries nutrient criteria for children aged between 4 to
8 years and 9 to 13 years respectively. Additionally, the study reveals that 90 percent of
the meals exceeded 30 percent from the recommended upper limit for sodium
consumption for children aged between 4 to 8 years. Moreover, 72 percent of the fast
food meals exceeded 30 percent from the daily recommended energy level for 4 year old
children. Some meals also exceeded the recommended upper limit for daily saturated fats
for children aged between 4 to 8 years. The study advocates that there is an urgent need
for reformulation of children’s meals to improve their nutritional composition and
revision of the industries nutrient criteria to align with children’s dietary requirements.
Voon Boo Ho (2012) have analysed the influence of services cape, food quality and price
on the youths’ satisfaction related to the fast food restaurants. The researcher has
used multi attribute compositional model on the data collected from the young customers
visiting fast food restaurants. The results of the study reveal that price, food quality and
services capes are directly related to the youths’ satisfaction of fast food restaurants.
Moreover, the study shows that human service and price were the key determinants of the
satisfaction of customers. Additionally services cape plays a pivotal role in enticing the
young customers as they want exiting and contemporary ergonomics to satisfy their
social needs. The study also illustrates that taking friends out to a unique and exhilarating
place is considered virtuous among young customers. Therefore, the study suggests that
the fast food restaurants need to change their ergonomics every 2 to 3 years to maintain
the interest of the young customers and keep them attracted to the service unit.
Furthermore, the fast food restaurants need to provide better staff service and appropriate
price of the food items in order to increase the young customers’ satisfaction level.
Fischer Eileen, Gainer Brenda and Bristor Julia (1997) have evaluated whether the
gender of the service provider should be regarded as an element of the services cape.
Does the gender of the service provider influence the perception of the service quality in
the contexts of fast food restaurants? The researchers have used stated preference analysis
and descriptive statistics to answer the research questions. The researchers first thought
that the men might believe male service provider of higher quality and women may
believe female service provider of higher quality due to in group bias or homophile based
perceptions. However, the study exhibits that the customers do not associate gender with
the services cape as they are more inclined towards the service output. Hence, gender of
the service provider should not be regarded as an element of the services cape.
Lee Soojin, Kim Woo Gon and Kim Hyun Jeong (2006), have analysed the effect of
co-branding on loyalty and purchase pattern of the customers of fast food and family
restaurants. The data was collected from the customers of fast food and family restaurants
in Korea. Researchers have employed multiple regression, co-relation and descriptive
statistics on the data to achieve the objectives of the study. The study shows that co-
branding is an effective marketing tool which helps fast food and family restaurants to
build favourable behavioural and attitudinal customer loyalty. Moreover, the study
reveals that co-branding persuades the customers to purchase more frequently and
explicitly. The study found that although co-branding may be a successful strategy to
encourage more frequent visits by the customers but the strategy may not always lead to a
higher per customer profit margin.
Emma J. Boyland and Jason G. Halford (2011) have evaluated the effect of television
advertisements of food products on the food choices in children. The researchers have
used primary data from in-depth interviews conducted with the children and secondary
data from the medical establishments situated in the vicinity of the research area in

United Kingdom. The study reveals that despite government regulations, the children in
United Kingdom are exposed to considerable numbers of food advertisements on
television. Moreover, these advertisements are predominantly for foods high in fats, salt
and sugar which are marketed to children using promotional characters and fun themes.
Such advertisements have caused significant increase in the intake of food items which
are far beyond the permissible limit of healthy foods, particularly in overweight and
obese children. The study advocates that the government needs to take prompt action to
curb the exposure of children to these misleading advertisements on the television and
ensure that the laid down norms and rules are strictly complied with.
Culp Jennifer, Bell. A. Robert and Cassady Diana (2010) have observed the food
industries web sites which are targeting children to assess the strategies used by the food
companies in order to prolong children’s visits and foster their brand loyalty towards
their food products. The researchers have conducted a content analysis of the web sites
advertised on 2 children's networks that is, Cartoon Network and Nickelodeon. The study
examined a total of 290 web pages and 247 unique games on 19 internet sites. The study
reveals that games found on 81% of the web sites were supporting the most predominant
promotional strategy used by the companies. Moreover, all the games had at least 1 brand
identifier with logo being frequently used. Usually the web sites contained 1 healthful
message for every 45 exposures to brand identifiers. Additionally, the study found that
the companies are using the web sites to extend their television advertising to promote
brand loyalty among children. These sites almost exclusively promoted food items high
in sugar and fat. The study suggests that health professionals need to monitor food
industry marketing practices used in new media.
Ebster Claus, Wagner Udo and Valis Sabine (2006) have evaluated the effect of
suggestive selling on the purchase decision of fast food customers. The researchers have
used logistic regression and descriptive statistics on the data collected from the customers
of fast food restaurants. The study shows that in all the conditions suggestive selling lead
to the increase in sales turnover. Moreover, the study reveals that the demand for side
dish increased when used in conjunction with the main dish. The study suggests that in
order to increase the revenue and sales turnover, the restaurants need to train their staff to
provide suggestions to the customers when they are in the process of deciding the food
items from the menu list.
2.2 RESEARCH GAP AND RATIONALE OF THE STUDY
The literature review is an examination of the past researches that helps in identifying the
gap in the research which the proposed study attempts to address. The effective
evaluation of the related research work also provides valid rationale for conducting the
study. The above discussion on the literature review points out that consumer behaviour
in service encounters especially in context of the fast food and beverage industry is one
of the most important phenomenon that necessitates its relevance and greater attention
while incorporating a right mixture of success drivers. The discussed literature within the
domain of the scope of the study as well as the conceptualisations and understanding of
the analytical models signifies the relationship between brand loyalty, customer
satisfaction, service quality and pricing. Therefore, it can be assumed that customer
satisfaction, pricing, service quality and brand loyalty are mutually interrelated in context
to fast food service encounters. Hence, there is a need for careful investigation of these
dimensions within the preview of the fast food industry in India. Furthermore, the study
holds importance due to its empirical nature in the area of consumer behaviour pertaining
to the fast food industry, as a little has been done in this regards. This study is also a
contribution to the literature on consumer behaviour in service environments.
Additionally, it also has favourable implications for academicians, industry people and
students.

REFERENCES
Ahmad Jamal, Peattie Sue and Peattie Ken (2012). Ethnic minority consumers'
responses to sales promotions in the packaged food market. Journal of
Retailing and Consumer Services, 19 (1), 98-108.
Bell Robert A., Cassady Diana, Culp Jennifer and Alcalay Rina (2009), Frequency
and Types of Foods Advertised on Saturday Morning and Weekday
Afternoon English and Spanish Language American Television Programs.
Journal of Nutrition Education and Behavior, 41(6), 406-413.
Brady Michael K., J Christopher. Robertson and Cronin J.Joseph (2001) Managing
behavioral intentions in diverse cultural environments: an investigation of
service quality, service value, and satisfaction for American and
Ecuadorian fast-food customers. Journal of International Management, 7
(2), 129-149.
Burton Scot, Howlett Elizabeth, Andrea Heintz Tangari (2009). Food for Thought:
How Will the Nutrition Labeling of Quick Service Restaurant Menu Items
Influence Consumers’ Product Evaluations, Purchase Intentions, and
Choices. Journal of Retailing, 85 (3), 258-273.
Carmen Berné, José M Múgica, M Jesús Yagüe (2001). The effect of variety-seeking
on customer retention in services. Journal of Retailing and Consumer
Services, 8 (6), 335-345.
Chen Mei-Fang (2007). Consumer attitudes and purchase intentions in relation to
organic foods in Taiwan: Moderating effects of food related personality
traits. Food Quality and Preference, 18 (7), 1008-1021.
Cheol Park (2004). Efficient or enjoyable: Consumer values of eating-out and
fast food restaurant consumption in Korea. International Journal of
Hospitality Management, 23 (1), 87-94.
Culp Jennifer, Bell. A. Robert and Cassady Diana (2010). Characteristics of Food
Industry Web Sites and Advertisement Games Targeting Children.
Journal of Nutrition Education and Behavior, 42(3), 197-201.
Cuma Akbay, Gulgun Yildiz Tiryaki, Aykut Gul (2007). Perceptions of Chinese
restaurants in the U.S.: What affects customer satisfaction and behavioural
intentions International Journal of Hospitality Management, 28 (3), 338-
348
Dag Bennett (2004). The Taiwanese are Just like Australians in Their Loyalty to
wards Fast Food Outlets. Australasian Marketing Journal, 12 (3), 97-103
Dohee Kim, Vincent P. Magnini, Manisha Singal (2011). The effects of customers’
perceptions of brand personality in casual theme restaurants. International
Journal of Hospitality Management, 30 (2), 448-458
Ebster Claus, Wagner Udo and Valis Sabine (2006). The effectiveness of verbal
prompts on sales, Journal of Retailing and Consumer Services, 13 (3),
169-176
Emma J. Boyland, Jason C.G. Halford (2011). Television advertising and branding:
Effects on eating behaviour and food preferences in children. Appetite. 56,
440-44
Farhana Nadia and Islam (Shohana 2011). Exploring Consumer Behavior in the
Context of Fast Food Industry in Dhaka City. World Journal of Social
Sciences 1(1), 107-124
Fischer Eileen, Gainer Brenda and Bristor Julia (1997). The gender of the service
providers: Does it influence perceptions of service quality. Journal of
Retailingz, 73 (3), 361-382.
Glanz Karen, Hewitt M. Anne, Rudd Joel (1992). Consumer behaviour and nutrition
education: An integrative review. Journal of Nutrition Education, 24 (5),
267-277.
Groth Markus, Gilliland W Stephen (2001). The role of procedural justice in the
delivery of services: A study of customers' reactions to waiting. Journal of
Quality Management, 6 (1), 77-97.
Goyal Anita, Singh N.P (2007). Consumer perception about fast food in India: an
exploratory study. British Food Journal, 109 (2), 182 – 195.
Heung Vincent C.S., Gu Tianming (2012). Influence of restaurant atmospherics on
patron satisfaction and behavioral intentions. International Journal of
Hospitality Management, 22 (2), 126-137.
Hong Qin, Prybutok R. Victor (2009). Service quality, customer satisfaction, and
behavioral intentions in fast-food restaurants. International Journal of
Quality and Service Sciences, 1(1), 78 – 95.
Hyun Sunghyup Sean, Kim Wansoo, Lee Myong Jae (2011). The impact of
advertising on patrons’ emotional responses, perceived value, and
behavioral intentions in the chain restaurant industry: The moderating role
of advertising-induced arousal. International Journal of Hospitality
Management, 30 (3), 689-700.
Jang Jung Yoon, Kim Gon Woo, Bonn A. Mark (2011). Generation Y consumers’
selection attributes and behavioural intentions concerning green
restaurants. International Journal of Hospitality Management, 30 (4), 803-
811.
Joon David, Kwun Wuk (2011). Effects of campus foodservice attributes on perceived
value, satisfaction, and consumer attitude: A gender-difference approach.
International Journal of Hospitality Management, 30 (2), 252-261.
Nam Jang-Hyeon and Lee Jeonglyeol Timothy (2011). Foreign travelers’
. satisfaction with traditional Korean restaurants. International Journal of
Hospitality Management, 30 (4), 982-989.

Jooyeon Ha, SooCheong (Shawn) Jang (2010). Effects of service quality
and food quality: The moderating role of atmospherics in an ethnic
restaurant segment. International Journal of Hospitality Management, 29
(3), 520-529.
Kenneth L. Bernhardt, Naveen Donthu, Pamela A. Kennett (2000). A Longitudinal
Analysis of Satisfaction and Profitability. Journal of Business Research,
47, 161–171.
Kim Wansoo, Ok Chihyung, Canter D. Deborah (2010). Contingency variables
for customer share of visits to full-service restaurant. International
Journal of Hospitality Management, 29 (1), 136-147.
Kirsten I. Dunn, Mohr Philip, Wilson J. Carlene, Wittert A. Gary (2011).
Determinants of fast food consumption: An application of the Theory of
Planned Behaviour. Appetite, 57 (2), 349-357.
Kristin L. Morse, Judy A. Driskell (2009). Observed sex differences in fast
food consumption and nutrition self assessments and beliefs of college
students. Nutrition Research, 29 (3), 173-179.
Kynda R. Curtis, Jill J. Mccluskey, Thomas I. Wahl (2007). Consumer preferences for
western-style convenience foods in China, China Economic Review, 18
(1), 1-14.
Lee Soojin, Kim Woo Gon and Kim Hyun Jeong (2006). The impact of co-branding on
post-purchase behaviors in family restaurants. International Journal of
Hospitality Management, 25 (2), 245-261.
Lefa Teng (2009). A comparison of two types of price discounts in shifting consumers'
attitudes and purchase intentions. Journal of Business Research, 62 (1),
14-21.
Lockie Stewart, Lyons Kristen, Lawrence Geoffrey, Grice Janet (2004) Choosing
organics: a path analysis of factors underlying the selection of
organic food among Australian consumers. Appetite, 43 (2), 135-146.

Lyndal Wellard, Colleen Glasson, Kathy Chapman (2012). Fries or a fruit bag.
Investigating the nutritional composition of fast food children’s meals.
Appetite, 58 (1), 105-110.
M.Omer Azabagaoglua, Oramana Yasemin (2011). Analysis of Customer
Expectations after the Recession: Case of Food Sector. International
Strategic Management Conference, 24, 229–236.
Mueller R.D, Palmer A., Mack R., McMullan R. (2003). Service in the
restaurant industry: an American and Irish comparison of service failures
and recovery strategies. International Journal of Hospitality Management,
22 (4), 395-418.
Paravantis John, Bouranta Nancy and Chitiris Leonidas (2009). The relationship
between internal and external service quality, Contemporary Hospitality
Management, 2 (3), 275-293.
Riadh Ladhari, Isabelle Brun, Miguel Morales (2008). Determinants of
dining satisfaction and post-dining behavioural intentions. International
Journal of Hospitality Management, 2 (4), 563-573.
Ryu Kisang, Han Heesup, Kim Tae-Hee (2008). The relationships among overall
quick-casual restaurant image, perceived value, customer satisfaction, and
behavioural intentions. International Journal of Hospitality Management,
27 (3), 459-469.
Seung-Hee Baek, Sunny Ham, Il-Sun Yang (2006). A cross-cultural comparison of fast
food restaurant selection criteria between Korean and Filipino college
students. International Journal of Hospitality Management, 25 (4), 683-
698.
Uggioni Paula Lazzarin, Elisabete Salay (2012). Reliability and validity of a scale to
measure consumer attitudes regarding the private food safety certification
of restaurants. Appetite, 58 (2), 470-477.

Ungku Zainal (2011). Food service hygiene factors: The consumer perspective.
International Journal of Hospitality Management, 30 (1), 38-45.
Verbeke Wim (2005). Consumer acceptance of functional foods: socio-demographic,
cognitive and attitudinal determinants. Food Quality and Preference 16,
45–57.
Victor P. Lau, Thamis Wing-chun Lo, Zhenquan Sha, He Yun (2007). Service quality
in restaurant operations in China: Decision and experiential-oriented
perspectives. International Journal of Hospitality Management, 26 (3),
698-710.
Voon Boo Ho (2012). Role of Service Environment for Restaurants: The Youth
Customers’ Perspective. Procedia - Social and Behavioural Sciences, 38,
388-395.
Wen-Bao Lin(2007). The exploration of customer satisfaction model from a
comprehensive perspective. Expert Systems with Applications, 33 (1),
110–121.
Woo Kim Gon, Christy Yen Nee Ng, Kim Yen-soon (2009). Influence of institutional
DINESERV on customer satisfaction, return intention, and word-of-
mouth. International Journal of Hospitality Management, 28 (1), 10–17.
Ying-Feng Kuo, Chi-Ming Wu, Wei-Jaw Deng (2009). The relationships among
service quality, perceived value, customer satisfaction and post-purchase
intention in mobile value-added services. Computers in Human Behaviour,
25, 887–896.
Ying hua Liu and Soo Cheong Jang (2009). Perceptions of Chinese Restaurants in the
US. International Journal of Hospitality Management 28, 338-348.
Young Kim Hoon, Kim MinCheol, Ben K. Goh (2011). An examination
of food tourists’ behaviour: Using the modified theory of reasoned action.
Tourism Management, 32 (5), 1159-1165.

Young Namkung, SooCheong (Shawn) Jang, Soo Keun Choi (2011).
Customer complaints in restaurants: Do they differ by service stages and
loyalty levels. International Journal of Hospitality Management, 30 (3),
495-502.
Chapter – III
Research Design and Methodology
Chapter 3 Research Design and Methodology (61-73)
3.1 Objectives of the Study 61
3.2 Hypothesis of the Study 62
3.3 Scope of the Study 62
3.4 Data Sources 62
3.5 Sample Design 63
3.6 Instrument Development 63
3.6.1 Reliability and Validity 65
3.7 Statistical Tools and Techniques Used in the Study 65
3.7.1 Arithmetic Mean 65
3.7.2 Coefficient of Correlation 66
3.7.3 Regression Analysis 67
3.7.4 ANOVA 68
3.7.5 t-Test 69
3.8 Data Purification through Factor Analysis 71
3.8.1 Scree Test 71
3.9 Organisation of the Study 72
3.10 Limitations of the Study 73
3.11 Future Relevance of the Study 73

RESEARCH DESIGN AND METHODOLOGY
Research is a diligent, active and systematic process of inquiring in order to discover,
interpret and revive facts, events, behaviour or theories to make practical applications
intended for the benefit of the human society as a whole. Research methodology
encompasses the procedures undertaken by the researcher to complete the research in
order to attain the specified objectives laid down by the study. The research methodology
is of pivotal importance because it assists the researcher to identify the ways in which the
research can be conducted. Some important factors in research methodology include
validity of research data, research ethics and the reliability of the measured information.
Research design refers to the planning and organising of the activities which will enable
the researcher to obtain the relevant data, evidence and information as part of the research
project. Research design is of immense importance as it helps the researcher in smooth
and efficient sailing through the research project. Moreover, it facilitates in yielding
maximum information by putting in minimum efforts and also confers maximum
reliability of the results. Research design not only averts misleading conclusions through
the strenuous exercise but also helps the researcher to define precisely his aims and
objectives, population to be studied, the nature of the measurements and the way of
interpreting the results.
On the basis of review of literature and identified research gap as discussed in the
previous chapters an attempt through this study is made to study consumer behaviour in
fast food and beverage industry in terms of the following objectives.
3.1 OBJECTIVES OF THE STUDY
1. To examine the effect of service quality on customer satisfaction.
2. To study the effect of brand loyalty on customer satisfaction.
3. To study the satisfaction level of customers of KFC, Dominos, Pizza Hut
and Mc Donald.

4. To understand the relationship between pricing and customer satisfaction.
5. To study the effect of demographics on customer satisfaction.
3.2 HYPOTHESIS OF THE STUDY
H1: The more is the brand loyalty, the more is the customer satisfaction.
H2: Perceived service quality is directly proportional to customer satisfaction.
3.3 SCOPE OF THE STUDY
In terms of research the scope of the study refers to the parameters of the study within
which the study will be operating. In other words scope defines specific boundaries
where the objectives, knowledge, instructions or outcome of activities are found. This
also determines the accepted range of the study around which the method of investigation
should be centered. In the present context to understand the consumer behaviour in fast
food industry, the fast food companies like KFC, Mc Donald, Pizza Hut and Dominos
were studied. The area of the study comprises of National Capital Region (NCR) which is
the capital of India. The study focus on the effect of branding, pricing and service quality
on the customer satisfaction of the customers of the above mentioned fast food
companies. The scope also includes the effect of demographics on the customer
satisfaction. This work will help in understanding the behaviour of the customers of the
fast food restaurants to predict about their specific choices.
3.4 DATA SOURCES
The intention of the study is to observe consumer behaviour pertaining to the fast food
industry in National Capital Region. The study is based on the following dimensions;
customer satisfaction, service quality, brand loyalty, Pricing policy and demographics of
the customers. For the above mentioned reasons, the study is based on both primary data
as well as secondary data.
Primary Data:
The primary data was amassed by personally distributing the questionnaire to the
customers of the fast food restaurants i.e. McDonalds, KFC, Dominos and Pizza Hut
which are positioned in Delhi region. From each of the fast food restaurant chains
approximately 125 respondents were requested to fill the questionnaire by selecting the
alternate choices available in the questionnaire.
Secondary Data:
The secondary data has been taken in the form of various websites, doctoral thesis,
research papers, books and research articles related to the topic.
3.5 SAMPLE DESIGN
The sampling method used by the researcher in this study is stratified random sampling.
Where the data was collected from the customers of the fast food restaurant chains like
McDonalds, KFC, Dominos and Pizza Hut situated in Delhi region. From each of the fast
food restaurant chains approximately 125 respondents participated in the survey process.
After preliminary examinations it was revealed that out of 560 filled questionnaires, only
500 questionnaires were complete and valid for the analysis, which constituted 89.28
percent response rate for the study.
3.6 INSTRUMENT DEVELOPMENT
The questionnaire comprises of 5 sections wherein section 3 is structured whereas the
other sections 1, 2, 4 and 5 are self administered. The first part of questionnaire
addresses customer satisfaction. In order to study the satisfaction level of customers in
fast food industry, a 30 statement questionnaire was developed by the researcher, keeping
in view Customer Satisfaction Questionnaire (CSQ-8 and CSQ-30, C. Clifford Attkisson
1979), American Customer Satisfaction Index (ACSI, University of Michigan 1994),
along with the other factors considering scope of research in the study area. Apart from
the 30 identified items, one additional statement has been inducted as a measure of
overall customer satisfaction. Before factor analysis, there were 31 items. However, after
factor analysis 9 factors emerged which explained 79.84 percent of cumulative variance.
Second part of the questionnaire consists of the statements pertaining to the service
quality. To study the Perception of Service Quality of customers in relation to fast food
industry, a 5 statement SERVQUAL (A. Parasuraman, 1985) questionnaire was
implemented by the researcher. In addition to the statements of the questionnaire, an
additional last statement studies the satisfaction score of overall service quality.
Third part of the questionnaire addresses of the statements of pricing policy of fast food
restaurants. In order to study the effect of pricing policy of the restaurants on the
customers in fast food industry, a 7 statement questionnaire was developed by the
researcher keeping in mind previous researches such as Keller (2003) and Bucklin (1998)
and considerations in context to fast food industry. The last statement in the questionnaire
studies the overall score pertaining to the pricing policy. Fourth part contains brand
loyalty of customers towards the fast food restaurants. In order to study the brand loyalty
of customers in relation to fast food industry, a 5 statement questionnaire was developed
by the researcher keeping in view the previous researches such as Reichheld and Sasser
(1990), Lau (2006) and Bloemer and Kasper (1995) and factors in context to the fast food
industry. Moreover, in addition to the statements of the questionnaire, the last parameter
studies the overall brand loyalty of the customers towards their preferred restaurants’
brand. Fifth part is the last part of the questionnaire which contains the demographic
information pertaining to the respondents. The study aims to investigate the behaviour of
customers of fast food restaurants on five point Likert scale. Where for each item, 1
represents strongly disagree, 2 as disagree, 3 represents neither agree nor disagree, 4 for
agree and 5 represents strongly agree.

3.6.1 RELIABILITY AND VALIDITY
The data collected during survey has been tested for reliability and validity of its
construct. The overall as well as internal consistency of the instrument has been tested by
measuring the value of Cronbach’s Alpha. The reliability estimates (Cronbach’s Alpha)
for customer satisfaction was found to be .858 before factor analysis and .864 after factor
analysis. Moreover, the reliability estimates for the service quality is .904, for pricing
policy is .819 and for brand loyalty is .840. The results of the Cronbach’s alpha exceed
the lower limit of acceptability which is 0.60 (Hair et al., 1998). The required adequacy
of the data during factor analysis is revealed by high KMO value (0.826). Factor analysis
has also been executed to ascertain the construct validity of the data. The resultant nine
factors of customer satisfaction have high factor loading values that is, more than 0.5 and
explains about 79.84 percent of cumulative variance justifying its factorial validity. The
nine factors having higher Eigen values, which are more than 1 further validates the
construct.
3.7 STATISTICAL TOOLS AND TECHNIQUES USED IN THE
STUDY
The data collected was rationally ordered and subjected to Statistical Package for Social
Sciences (SPSS, version-17.0). The data was consequently subjected to various statistical
tests with the help of SPSS software. The statistical data has been presented in the form
of tables and graphs. The statistical techniques used are Arithmetic mean, standard
deviation, t-test, ANOVA, Regression, Correlation, Factor Analysis and Screen test.
3.7.1 ARITHMETIC MEAN
Arithmetic mean is derived by dividing the sum total of all observations by the total
number of observations. If the mean score value of the statements is high, it indicates
that the existence of the corresponding dimension is highly prevalent. On the contrary,
lower mean value indicates that the existence of corresponding dimensions is merely
influencing the decision-making process of the customers. Standard deviation helps the
researcher to evaluate the significance of the mean value. As the mean describes the
central location of the data, the standard deviation describes the spread of the same data
from the central location. The more is the spread, the less accurate is the value of mean.
Therefore, the more is the value of standard deviation, the less is the significance of the
mean value or vice-versa.
3.7.2 COEFFICIENT OF CORRELATION
Correlation is a statistical technique which helps the researcher to understand the
proximity between two variables in order to comprehend the relationship between them.
In other words, correlation is directed towards measuring the degree of association
between two variables and it refers to any broad class of statistical relationships involving
dependence between two variables. The higher is the value of correlation between the
variables, the more is the probability of one variable explaining the changes in the other
variable provided the significance value is less than 0.5. There are several correlation
coefficients, often denoted by ρ or r, measuring the degree of correlation. The most
common of these is the Pearson coefficient of correlation, which is sensitive only to a
linear relationship between two variables. Other correlation coefficients have been
developed to be more robust than the Pearson coefficient of correlation. Usually, in
simple correlation between two variables the researchers are looking for a linear
relationship. Correlation is always between -1.0 and +1.0. If the correlation is positive,
the variables are directly related to each other whereas if the correlation is negative, the
variables are inversely related to each other. In the present study, correlation has been
used to examine the relationship between customer satisfaction, brand loyalty, service
quality, demographics and pricing policy of the fast food restaurant chains. The
following formula has been used to calculate coefficient of correlation.

Where,
r = Coefficient of correlation.
dx = Deviation of x series from an assumed mean.
dy = Deviation of y series from an assumed mean.
= Sum of the product of the deviation of x and y series from their
assumed mean.
= Sum of squares of x series from an assumed mean.
= Sum of squares of y series from an assumed mean.
3.7.3 REGRESSION ANALYSIS
The term "regression" was coined by Francis Galton in the nineteenth century to describe
a biological phenomenon. The earliest form of regression was the method of least
squares which was published by Legendre in 1805 and by Gauss in 1809. A regression is
a statistical analysis assessing the association between two variables. Regression analysis
is widely used for prediction and forecasting. Moreover, it is also used to understand
which among the independent variables are related to the dependent variable and it
explores the forms of these relationships. In restricted circumstances, regression analysis
can be used to infer causal relationships between the independent and dependent
variables. The formula for regression is as under;
y = a + bx
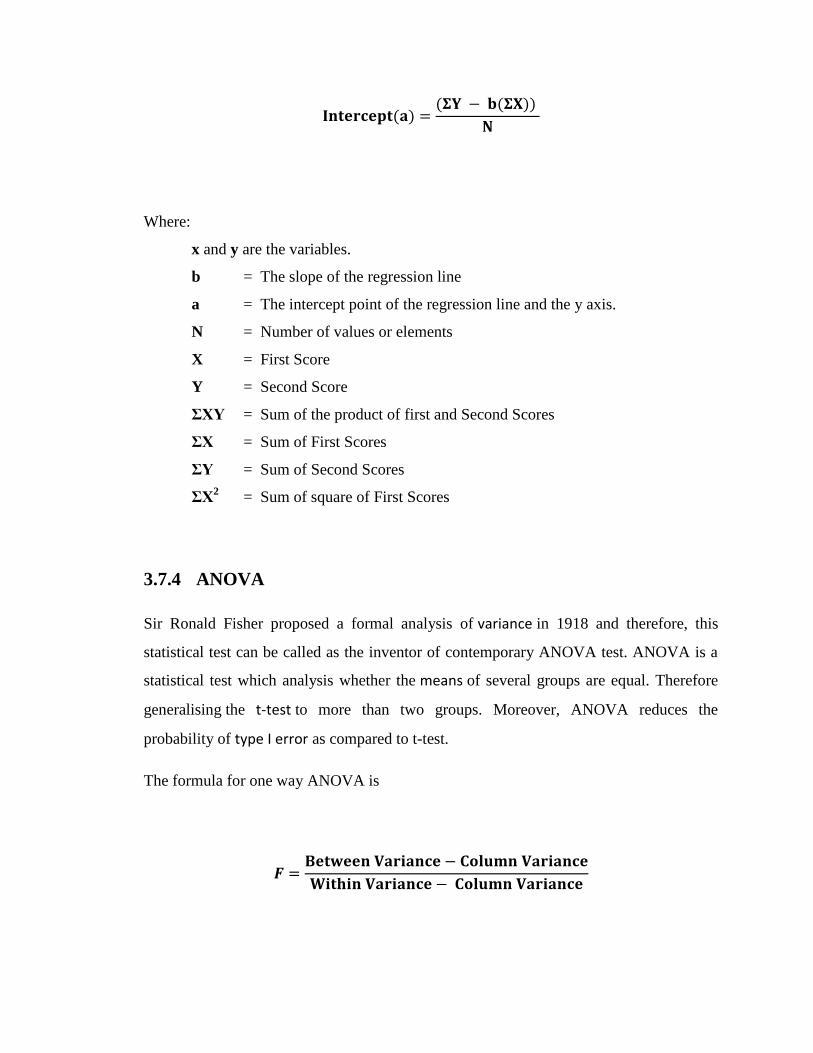
Where:
x and y are the variables.
b = The slope of the regression line
a = The intercept point of the regression line and the y axis.
N = Number of values or elements
X = First Score
Y = Second Score
ΣXY = Sum of the product of first and Second Scores
ΣX = Sum of First Scores
ΣY = Sum of Second Scores
ΣX2
= Sum of square of First Scores
3.7.4 ANOVA
Sir Ronald Fisher proposed a formal analysis of variance in 1918 and therefore, this
statistical test can be called as the inventor of contemporary ANOVA test. ANOVA is a
statistical test which analysis whether the means of several groups are equal. Therefore
generalising the t-test to more than two groups. Moreover, ANOVA reduces the
probability of type I error as compared to t-test.
The formula for one way ANOVA is

Formula for two way ANOVA is
F (for column)
F (for rows)
Where:
MSC = Mean sum of squares between columns.
MSE = Mean sum of squares of error.
MSR = Mean sum of squares between rows.
3.7.5 t- Test
The t-statistic was introduced by William Sealy Gosset in 1908, he was a chemist
working for a brewery company in Dublin known as the Guinness. Gosset devised the t-
test as an economical way to monitor the quality of stout being produced in the factory.
In 1908, he published his work associated with the t-test in Biometrika after which his
work was deeply appreciated and accepted by many other scientists. T-test is a test of the
null hypothesis which facilitates to know whether the means of two normally
distributed populations are equal or not.
Formula for One-sample t-test
In testing the null hypothesis that the population mean is equal to a specified value μ0, the
statistic used is:
Where:
= The sample mean
S = Sample standard deviation of the sample
n = Sample size.
The degrees of freedom used in this test is n − 1
Independent two-sample t-test
This test is also known as equal sample sizes or equal variance test. This test is only used
when both the two sample sizes (that is, the number, n, of participants of each group) are
equal and it can be assumed that the two distributions have the same variance.
The t statistic to test whether the means are different can be calculated as follows:
Where:
= Grand standard deviation
1 = Group one
2 = Group two.
n = The number of participants in each group.
Degrees of freedom for this test is 2n – 2
Dependent t-test for paired samples
This test is used when the samples are dependent that is, when there is only one sample
that has been tested twice (repeated measures) or when there are two samples that have
been matched or paired.
Where:
(XD) = The average
(sD) = Standard deviation
μ0 = Constant
n = Sample size
Degree of freedom used is n − 1.
3.8 DATA PURIFICATION THROUGH FACTOR ANALYSIS
Factor analysis is a statistical method used to describe variability among observed
correlated variables in terms of lower number of unobserved variables called factors. In
other words, Factor analysis is a method for investigating whether a number of variables
of interest are linearly related to a smaller number of unobservable factors or not.
Additionally, factor analysis is a technique in which the whole set of independent
relationships among all variables are examined and represented in terms of a few
underlining factors. This multivariate technique has been applied in the present study
with the help of SPSS (version-17). The study uses principal component analysis with a
varimax rotation. The sampling adequacy of factor analysis is determined by KMO. If
the KMO value is between 0.5 and 1.00, this indicates that the data is having enough
relationships among itself and the researcher can carry on with the factor analysis in order
to reveal these relationships in the form of factors.
3.8.1 SCREE TEST
The scree test was developed by Cattell. Scree is a term from geology meaning rubble at
the bottom of a cliff. In the scree test, if a factor is important it will have a large variance
and vice-versa. The scree test is a test for determining the number of factors to retain in a
factor analysis, the test involves the factors to be ordered according to their variance and
plotted against the respective factor numbers. Moreover, these are the important factors
which account for the bulk of the correlations in the matrix. It's called a scree test because
the graph looks a bit like where a cliff meets the plain. In the scree test, the researcher
observes where the important factors stop and the unimportant ones starts. The scree test
involves plotting the Eigen values in descending order of their magnitude against their
factor numbers and determining where they level off. The break between the steep slope
and a levelling off indicates the number of meaningful factors differentiated from the
random error.
3.9 ORGANISATION OF THE STUDY
The study has been completed in six chapters
Chapter - I
This chapter covers the introductory part of the study.
Chapter - II
This chapter consists of the review of literature pertaining to the study area.
Chapter - III
This chapter deals with the research design and methodology. This part of the
study discuses information regarding sample design, data source, developing
instrument, statistical tools used in the study, chapter plan, limitations of the study
and the future relevance of the study.

Chapter - IV
This chapter deals with the profiles of fast food companies like KFC, Dominos,
Pizza Hut and Mc Donald which are operating in India.
Chapter - V
This chapter is about analysis and interpretation of the results derived from
applying various relevant statistical tools and techniques to the data.
Chapter - VI
This is the last chapter of the study. It gives the summary of the research findings
and highlights the conclusion and suggestions emerging from the discussion.
3.10 LIMITATIONS OF THE STUDY
1. Low awareness level of customers regarding the various products and services
offered by other fast food companies might have influenced their responses.
2. The study is limited to KFC, Mc Donald, Pizza Hut and Dominos of Delhi
region only, but before generalizing the recommendations of the study,
various socio economical, cultural and geo political aspects of the other
regions have to be considered as well.
3. Sample size, cost and time limitations and the particularized nature of the
study has lead the researcher to restrict the scope of the study.

3.11 FUTURE RELEVANCE OF THE STUDY
The study is equally useful for students, academicians and the people related to the food
industry. Moreover, the scope of the study is open for the future research. The researcher
has made the following proposals for the same.
1. A separate study can be conducted to know the effect of pricing policy on
perceive service quality, demographics and brand loyalty in the fast food
industry.
2. A separate study can be conducted to know the effect of restaurant’s
ergonomics on the customer satisfaction of the patrons.
3. A study can be conducted to evaluate the effect of demographics on brand
loyalty of the patrons of the fast food industry.

Chapter – IV
Organisational Profile

Chapter 4: Organisational Profile (74-100)
4.1 Mc Donald 74
4.1.1 Introduction 74
4.1.2 Growth Patterns 75
4.1.3 Product Mix 77
4.1.4 Marketing Strategies 79
4.2 KFC (Kentucky Fried Chicken) 81
4.2.1 Introduction 81
4.2.2 Growth patterns 83
4.2.3 Product Mix 84
4.2.4 Marketing Strategies 86
4.3 Domino’s Pizza 88
4.3.1 Introduction 88
4.3.2 Growth Patterns 89
4.3.3 Product Mix 91
4.3.4 Marketing Strategies 92
4.4 Pizza Hut 94
4.4.1 Introduction 94
4.4.2 Growth Patterns 95
4.4.3 Product Mix 97
4.4.4 Marketing Strategies 98
ORGANISATIONAL PROFILE
This chapter reveals the central, indispensable information pertaining to the four
companies that is Mc Donald’s, KFC, Domino’s and Pizza Hut which are covered in the
scope of the study. The chapter enlightens the reader with a few interesting facts and
figures concerning the introduction, growth pattern, product mix and finally the
marketing mix of these business organisations. This chapter endeavors to facilitate the
acquaintance of the reader with the history, marketing approach, innovations and
management subterfuge pertaining to these four companies.
4.1.1 INTRODUCTION
In 1937, Patrick McDonald opened a fast food restaurant with the name "The Airdrome
restaurant" which was located besides the vicinity of the Monrovia Airport in the state of
California, USA. One of the enticing bargains of this fast food restaurant was the
availability of hamburgers at ten cents, and orange juice at five cents. Later, in 1940
Patrick McDonald’s two sons Maurice and Richard who are also known as Mac and Dick
not only moved the entire restaurant building from Monrovia to San Bernardino,
California, but also changed the name from the Airdrome to McDonald. Right from the
inception of new name tremendous efforts were made to maintain the quality of their
products coupled with delivery of excellent customer service. In the beginning, the
restaurant had large variety of food products but soon Maurice and Richard realized that
most of their profits are generated by the expeditious consumption of the hamburgers.
Consequently, the two brothers took tremendous heed in setting up their kitchens like an
4.1 MC DONALD’S

assembly line and to ensure maximum efficiency. This streamlined system encompassed
simple menus consisting of hamburgers, cheeseburgers, French fries, shakes, soft drinks,
and apple pies etc.
Later on, Ray Kroc who was a milkshake mixer salesman was left awestruck during a
sales visit in 1954 where he realized McDonald's extraordinary capacity and popularity.
After seeing the restaurant in operation, Kroc approached the McDonald brothers with a
proposition to franchise McDonald's restaurants outside California and Arizona with
himself as the first franchisee. With full excitement and enthusiasm, he returned to his
home outside of Chicago with legal rights to set up McDonald's restaurants throughout
the country except in the selective territories of California and Arizona where McDonald
brothers had already licensed a few restaurants. Kroc's first McDonald's restaurant was
opened in Des Plaines, Illinois near Chicago on April 15, 1955 and the same day Kroc
incorporated his company as McDonald's Systems Inc.
He was able to expand his business to great eminence because of a few successful
marketing strategies implied by him in pertinent manner. During 1963 Kroc's marketing
decision to advertise McDonald's hamburgers to families and children was a turning point
in the history of the company. After a long continuous research into this matter, Kroc was
still searching for a success driver which could entice the children. This conquest came to
an end when he met John Gibson and Oscar Goldstein in Washington DC who were
sponsoring children show on WRC-TV called Bozo the Clown which was a character
played by Willard Scott from 1959 till 1962. Later on, once the show was elegantly
completed Scott was hired to portray McDonald's new mascot named Ronald McDonald.
4.1.2 GROWTH PATTERNS
The management of McDonalds discerned from the inception of the business that
visibility of the product is of immense import especially, when it comes to purchase
behaviour of the customers. Advertising has always played a key role in the development
of the McDonald's Corporation. Moreover, Kroc aptly believed that advertising was a
laudable investment that would come back with higher futuristic returns. Keeping this in
preview in 1962, the McDonald's advertising campaign namely “Look for the Golden
Arches” gave a big boost to the sales of the company. One year later after the launch of
this world famous Golden Arches logo, the company sold its first billionth hamburger.
Indeed, McDonald's advertisements have been some of the most identifiable
advertisements ever observed in the fast food market.
The growth in automobile industry and suburbanization in the United States of America
in the early 1960s contributed heavily towards the McDonald's swift successful growth.
Astonished by the encouraging market trend Kroc bought out the McDonald brothers in
1961 for $2.7 million USD, aiming at making McDonald's the number one fast food
chain in the country. Additionally, in order to generate money from the stock exchange,
the McDonald's Corporation went public in 1965. Common shares were offered at $22.50
USD per share and by the end of the first day’s trading, the price of the McDonald share
had augmented by $30.00 USD per share. The momentous growth rate of the company
can be judged from the fact that 100 shares purchased for $2,250 USD in 1965 were
worth $1.8 million USD by the end of 2003. Moreover, in 1985 McDonald's Corporation
became one of the 30 companies that make up the Dow Jones Industrial Average.
McDonald's success in the 1960s was in consequence of the company's skillful marketing
and flexible response to customer’s anecdotal demands. The year1968 brought nucleus
change in the core management of McDonald's when Fred L. Turner became the
company's new president and chief administrative officer while Kroc became chairman
and remained CEO until 1973. In the mean time, Turner was constantly looking for new
ways to perfect the McDonald's systems; he often spent a lot of time experimenting with
the different dimensions pertaining to the business. He subsequently determined the
maximum number of hamburgers and patties that could be stacked in a box without
squashing them.
This innovative thinking and determination to outperform the competition helped
McDonald’s top management to device and implement strategies which helped
McDonalds to emerge as market leader in spreading its outlets throughout the globe.

With McDonald's opening its first restaurant in the United Kingdom at Woolwich in the
year 1974, although, it was the company's first restaurant in UK but it was also three
thousandth restaurant outlet worldwide. Following its expansion in 1975 the first
McDonald's outlet was opened in Hong Kong at Paterson Street, in Causeway Bay
situated in Hong Kong Island. By the year 1978, McDonald's opened its five thousandth
restaurant outlet in Kanagawa, Japan. Further in the year 1993, McDonald's for the first
time had the privilege of opening restaurants with their legendary golden arches in Saudi
Arabia. Later in the year 1979 after a long legal battle McDonald's managed to open its
first restaurant in Singapore and soon by 1980 the company claimed to have opened their
six thousandth restaurant outlet at Munich in Germany.
In order to mark its presence even more promptly, the company decided to sponsor the
1984 Summer Olympics. This not only made their presence felt stridently but also had a
positive impact on the company’s share prices. However, it came as a jolt for the share
holders of the company when in 2002 McDonald's posted its first quarterly losses which
was approximately $344 Million USD. In order to respond to the principal reason
responsible for this tremendous loss which was stiff competition emerging from other
fast-food restaurants, McDonald’s started offering higher quality of food items and
broadened their menu list by inculcating Real Fruit smoothies and the Angus Snack Wrap
in 2010 and Fruit & Maple Oatmeal in 2011. All these collective efforts assisted Mc
Donald’s to come out of its losses and once again reclaim its position as a market leader
in the fast food industry.
4.1.3 PRODUCT MIX
Product mix or product assortment refers to the total number of product lines a company
is offering to its valued customers. In order to stay ahead of the competition, Mc
Donald’s continuously keeps on innovating new products and simultaneously modifies
old products with the intention of harmonizing with the changing needs and requirements
of the customers. Few of the Mc Donald’s product line which is internationally accepted
are burgers, quarter pounders and snack wraps, chicken products, Mc Pizzas and

beverages. In burgers, all beef patties are seasoned and consist primarily of salt and black
pepper. Big Mac hamburger was introduced in 1967 as McDonald's signature menu
items. Later came Quarter Pounder as McDonald's next signature menu items. Quarter
Pounder was inverted by Al Bernardin who was a franchise owner and former
McDonald's Vice President of the product development department, at Fremont,
California, in 1971. Snack Wrap was officially launched in 2006 and just after their
launch it became an instant hit among the customers. A few products in the non
hamburger and fries category which were successfully launched by Mc Donald’s are,
Chicken Mc Nuggets and the Egg Mc Muffin which became instantly popular among the
customers. In order to combat the ferocious competition given by Pizza manufacturing
units, Mc Donald’s also launched its own Pizza Known as Mc Pizza and to identify it as
part of the McDonald’s product mix, the pizza was branded with the “Mc” prefix.
Moreover, the product research facilitated in devising new technologies to enable quick
pizza manufacturing and maintain elevated stringent quality standards to match with the
McDonald’s image. This led to the development of new pizza ovens and recipes for the
product. Additionally, the consumer research provided positive reactions to the taste of
Mc Pizza. However, the Mc Pizza did not come out with flying colours in the initial
stages of its launch. The very fact that the brand was called Mc Pizza instigated a
problem associated with the company’s identity. Most consumers associated McDonald
with hamburgers and felt that pizza was a poor fit in the menu. Moreover, the packaging
of the product was a standard pizza box which protected the pizza, established the pizza
look for the consumer and fitted in the product mix of the company, but it could not
compete with other pizza chains as effectively as expected.
In order to concord with the taste and behaviour of the customers in addition to the
external environments Mc Donald’s have tailored Indian specific products, which can
further be bifurcated into vegetarian and non vegetarian categories. Some of the products
attuned by the company in vegetarian category to suit the Indian customers are Mc
Veggie, Mc Aloo Tikki, Paneer Salsa Wrap, Crispy Chinese, McCurry Pan and Pizza Mc
Puff. However, in non-vegetarian category Mc Donald’s have launched Chicken
Maharaja Mac, McChicken Burger, Shahi Chicken Mc Curry, Wrap Chicken Mexican
and Fillet-O-Fish.
In order to further entice the customers and to wheedle out some more profits from them,
the company also offers beverages to the demanding customers. Some of the popular
beverage products offered by the company are Coke, S&D Coffee, Hot and iced tea,
Milkshakes, Beer of different brands are available at McDonald's situated in France,
Belgium, Germany, Spain, Portugal, Romania, Lithuania, Czech Republic, Italy and
Slovenia. McDonald's also offers milk, chocolate milk and apple juice most often as
replacements for fountain drinks in Happy Meals. Moreover, from 2009 McDonald's
outlets situated in New Zealand and Australia have begun to offer Frozen Coke as part of
their menu. All these superlative efforts have resulted in the escalation of the customer’s
satisfaction level and have eventually assisted in the rapid growth of the company.
4.1.4 MARKETING STRATEGIES
McDonald is well recognized for its innovative market positioning strategies and
certainly McDonald rapid growth is augmented due to its intelligent and smart business
ideas based on the dynamics of business environment and societal changes. The
restaurant which started in 1948 with just one outlet now has its footprints across the
globe and currently the chain operates over 31,000 restaurants worldwide, employing
more than 1.5 million people. McDonald’s expansion started in late 60’s with the focus to
appeal customers by presenting a nice clean place where they can enjoy family meals that
offer good value for money. The company eventually comprehended that it is difficult to
feed the typical American taste for a long time therefore, to simultaneously attract a large
number of customers, it must leave scope for inclusion of new flavours and incorporation
of vivid menu choices. As a result, one of the most innovative and enticing ideas which
was introduced by McDonald’s was the concept of Happy Meals. It is a combo meal
consisting of one food item coupled with a beverage and a free toy for the children,
which made McDonald’s restaurants the most demanding place for kids across the globe.
The concept of drive-thru service introduced by Mc Donald’s in 1975 was the second
most interesting concept which marketed a brand new feel of comfort for travelling
customers. This concept gained so much of popularity that now it accounts for more than
half of the restaurant’s worldwide sales.
Taking into consideration the influx of different religious and ethnic groups in the market
McDonald’s concentrated on the customers’ tastes bellowing to Asian, European,
Hispanics and African backgrounds. The survey was conducted by McDonald, which
revealed that in order to satisfy the nutritional aspect of the food item offered to health
conscious customers, McDonald’s must introduce and market diverse fruit combinations
to suit the taste and health preferences of the customers. Another successful strategy
incorporated by the company was directed towards money generation from the sale of
beverages. The company started heavily advertising coffee drinks and free or subsidized
sweetened beverages. These advertisements emphasized the indulgent aspects of sweeter
drinks like mochas, to entice customers with certain specific likings.
McDonald's encouraged and maintained a munificent advertising campaign in order to
make an attempt to penetrate into the mind of the customers in a constructive way. The
company’s dexterity in utilizing the available media resource goes beyond the usual
media sort which includes television, radio and newspaper advertisements. Additionally,
the company made significant use of billboards, sculptures and slogans. The company
also sponsored sporting events right from small foot ball amusement matches to
Olympics and simultaneously corroborate its presence in the stadium by putting banners,
logos, and selling food items coupled with the distribution of use and throws glasses and
plates with their logo imprinted on it.
There have been many McDonald's advertising campaigns and slogans over the past few
years. At present McDonald's is using 23 different slogans to advertise its products in the
United States alone. One of the well known slogan of Mc Donald’s was “I am loving it”.
This slogan became part of an international branding campaign initiated by McDonald's
Corporation in 2003. This world renowned advertisement campaign was pioneered by
Heye & Partner who were working in McDonald's based in Unterhaching, near Munich
in Germany. In 2008, McDonald's underwent the first phase of their new image and
slogan which was “What we are made off.” This was to promote McDonald's products
that are made of hygienic and nutritious value. In order to further foster a positive image
in the minds of the customers Mc Donald’s came up with new packaging procedures. In
November 2008, McDonald's introduced new packaging, eliminating the previous design
with new inspirational messages. McDonald's also updated their menu boards with darker
yet warmer color combinations, more realistic photos of the products and the drinks in
glasses.
Further, price as an important constituent of marketing mix plays a pivotal role in
customer decision making process. Its influence is further significant when it comes to
price sensitive economies like India. Taking into account the above mentioned
phenomenon Mc Donald’s underwent major changes in their menu, logistics and the
preparation techniques with the intention of reducing the cost without compromising with
the quality of the product. Mc Donald’s has launched many products at affordable prices
in India and some of the products and their prices are: Happy Meal for Rs 50, Combo
meal for Rs 30 to Rs 70, Mc Maharaja for Rs 50 and soft drinks for Rs 20. Some products
are priced keeping in mind lower middle class customers as well like Veg. Pizza Mc Puff
for just Rs 19 and famous Mc Aloo Tikki Burger with cheese for just Rs 29. This
exceptionally good pricing has made Mc Donald’s a favourite food spot not only for rich
and upper middle class customers but also for the lower middle class customers. Thus, it
can be concluded that Mc Donald’s has been successful in incorporating and practicing
strategic mix of marketing components which have resulted in making Mc Donald’s
strong brand equity.
4.2.1 INTRODUCTION
Kentucky Fried Chicken (KFC) was established by Colonel Harland Sanders in 1952 by
opening his first fast food restaurant in Louisville Kentucky, in United States. Sanders
initially served his fried chicken in the midst of the great depression at a petrol pump
which was owned by him and situated in North Corbin, Kentucky. The dining area of the
fast food restaurant was named Sanders Court & Café and it became instant hit among
the customers. It was so successful that in 1936 Kentucky Governor Ruby Laffoon,
granted Sanders the title of honorary Kentucky Colonel in recognition of his contribution
to the state's cuisine and creating employment for the local population. Observing such
marvelous response from the customers Sanders expanded his restaurant to 142 seats and
bought another motel across the street. Now Kentucky Fried Chicken (KFC) is the
world's largest fried chicken fast food restaurant chain with over 17,000 outlets in 105
countries and territories, their headquarter is situated in Louisville, Kentucky in the
United States.
Colonel Sanders sturdily believed that restaurant franchising will bring in new dexterous
minds and eventually increase the growth rate of the company in long run. Therefore, he
espoused the concept of franchising his restaurant outlets throughout the world. His first
"Kentucky Fried Chicken" franchise opened in Utah in 1950. As expected by colonel
Sanders, intelligent people started associating themselves with the company and one of
them who left a momentous mark on the history of the company was Dave Thomas. He
was a franchisee owner of KFC and in 1962 he created the rotating bucket sign that was
extensively used at almost all KFC locations. Thomas encouraged Sanders to appear in
4.2 KENTUCKY FRIED CHICKEN
(KFC)

all of the KFC television commercials and also assisted him to simplify the company’s
menu from over 100 items to just a few, which concentrated on the fried chicken and
salads. Meanwhile, by the end of 1967 KFC had become the sixth largest restaurant chain
by volume in the United States of America and in 1968 it was listed on the New York
Stock Exchange. Thomas was observing these developments very closely. He had an eye
on the stock value of KFC shares. Instantaneously, he realized the direction of the stock
trend and sold his shares in 1969, becoming a millionaire in this process. With this huge
financial resource, he set out to conquer his dream of establishing his own fast food
restaurant chain and very soon he opened the Wendy's fast food restaurant chain. Another
person who left his mark on the KFC was Harman, who devised the company's first
training manual and product guide. He also played a pivotal role in conceiving the phrase
that became the company's slogan "It is finger licking good" and trademarked it.
Subsequently, it was in 1957 when he came up with the concept of 14 bundled pieces of
chicken, five rolls and a pint of gravy in a paper bucket to offer families for $3.50 USD.
This strategy enticed huge number of customers and helped the company to combat the
competition engendered by other non-vegetarian fast food restaurants. Throughout the
1970s and 1980s, KFC had mixed success in the US market as the company went through
a series of corporate owners who had little experience in the restaurant business.
Ironically, the following period after 1980s the core strategies and policies repeatedly
fluctuated resulting in inappropriate management of resources and dwindling the overall
efficiency of the company. However, once the company was taken up by the jubilant
foods, it witnessed healthy growth throughout the globe.
4.2.2 GROWTH PATTERNS
The world’s most popular chicken restaurant chain, Kentucky Fried Chicken widely
known as KFC, has modest origin. What started out as a small cooking operation at a gas
station in Corbin, Kentucky, is now a part of the Yum brand corporation which is the
world’s largest restaurant system consisting of more than 11,000 KFC outlets over 80
countries around the world. The inceptor of KFC, Harland Sanders was born in 1890 near

Henryville, Indiana. He left his parental residence at the age of 12 years to work on the
farms. He went through diverse variety of professions including the job of painter,
streetcar conductor, insurance salesman and service station operator. He managed to open
his own gas station in Corbin, Kentucky in 1929, where he occasionally prepared meals
for his family and a few fortunate customers who happen to pass by at eating time. His
specialties were southern style dishes his mother had taught him country ham, homemade
biscuits, and of course, pan-fried chicken. He devised a secret recipe for his chicken and
that secret formula proved to be the key for the success of his restaurant business. In
1939, Sanders Court and Café won a designation by Duncan Hine’s adventures in good
eating, which eventually highlighted the Sanders restaurant on the map for travellers.
Sanders was convinced that his chicken recipe will be a winner and he took the initiative
to sell his chicken to other restaurant owners. He intend to sign up franchisees which
would pay him five cents for each piece of chicken sold which was prepared with his
secret recipe. This idea clicked numerous restaurant owners and the first Kentucky Fried
Chicken franchise was opened in 1952 by Sanders and Pete Harman in South Salt Lake,
Utah.
By the early 1960s, the Colonel’s chicken was sold in over 600 restaurants throughout the
US and Canada. England was the first country where Kentucky Fried Chicken opened
their maiden international restaurant in 1964. The same year under the constraints of
getting out of debt Sanders sold his company to a group of investors for $2 million USD.
He also signed on for an annual salary of $40,000 to act as the company spokesman.
Soon the company went public in 1966 and was listed on the New York Stock Exchange
(NYSE) in 1969. By 1970, KFC grew its operations to 3,400 fast food outlets. In 1971, it
merged with Heublein Inc., which was a specialty food and alcohol beverage company.
Heublein made substantial investments to upgrade and modernize the standards of the
KFC including the buildings ergonomics as red and white.
Preceding the Colonel’s death in 1980, the company underwent several mergers and
acquisitions. In 1982, Heublein was acquired by R.J. Reynolds and in 1986, the company
was bought by the Pepsi Company. Realizing the importance of franchise in expansion of
the business a lot of efforts coupled with resources were channelized to elevate the

efficient working of the company. The corporation also established National Franchise
Advisory Council with the objective of improving the franchising contract system.
Additionally, to ensure better deal to franchises pertaining to company equipment and
supplies National Purchasing co-operation was incepted in 1979. These advisory councils
made KFC a more democratic organisation that valued input from its franchisees and
helped to maintain consistent operations as the company went through various ups and
downs in the business.
Although, the competition in the US was challenging, the international growth rate was
explosive for KFC, in the late 1980s and early 1990s. Asian countries where chicken was
popular and widely consumed proved immensely profitable market with sales growing at
30 percent per annum. In 1987, KFC was the first American fast-food chain that opened
in the People Republic of China and by 2007, there were more than 1,800 KFC outlets
operating in over 400 cities throughout the China. The similar encouraging growth
pattern was evident in India and other Asian countries as well. One of the driving
elements for this abrupt growth is the precise combination of the product mix coupled
with appropriate marketing strategies.
4.2.3 PRODUCT MIX
KFC Corporation primarily sells chicken in form of pieces, wraps, salads and
sandwiches. The company’s specialty is the fried chicken products which are served in
various forms and with vivid complementary gravies. Simultaneously, KFC also offers a
line of roasted chicken products, side dishes and desserts. KFC’s primary products are
pressure-fried pieces of chicken made with the original sanders recipe, the other chicken
offerings were extra crispy, cooked using a garlic marinade and the chicken is double
dipped in the flour before deep frying in a standard industrial type kitchen cooking
machine. Taking into account the exclusivity of the competition prevailing in the non-
vegetarian fast food sector, KFC channelized huge resources towards developing new
products which could harmonize with the market dynamics. Considering the awareness

among the customer pertaining to their own health, the company modified the preparation
technique and also devised products which cater this nutritional need of the customers.
Since the inception of the company Sanders and KFC used cotton seeds or corn oil for
frying their products. It was later on realized that this oil contains relatively high levels of
trans-fats, which increases the risk of heart disease. Therefore in 1980s, the company
began to switch to palm or soybean oil and by 2006, KFC announced that it would fry its
chicken only in trans-fat free oil.
KFC has many product lines like snacks, burgers, box meals, buckets, chicken and
crushers. The company uses different permutations and combinations of these products in
order to entice and retain the customers. A few popular products of the company are
snack box, Hot Wings (3 pieces), Boneless Chicken Strip (3 pieces), Chicken Zinger
Fries Meal worth, Zing Kong Box costing Rs. 179 and Large Bucket (12 pieces) worth.
The company also caters vegetarian customers by offering them products like vegetarian
snack and Vegetarian Zinger Meals. This vibrant combination of products enables the
restaurants to have high customer turnover. Additionally, sanders sturdily believed that
taste is the main driving force that motivates the customer to consume their products and
it is the unique taste of their products which leaves a positive long lasting experience in
the mind of the customers. Therefore, colonel sanders never shared his secret recipe with
anyone and treated it as a precious resource of the company. Sander’s original recipe of
11 herbs and spices remains a valuable trade secret of the company and one of the
benchmarks by which KFC differentiates its product from those of the competitors. The
spice mix used in the products is made at three different locations in the United States
and none of these segregate locations has the complete recipe. A copy of the recipe
signed by Sanders is kept in a vault in corporate headquarters along with 11 vials
containing the sample of the recipe's herbs and spices. This has helped the organisation
to maintain its uniqueness and market share to a great extent.

4.2.4 MARKETING STRATEGIES
KFC primarily serves non-vegetarian food items around the world and in order to
augment sales volume KFC is implementing vivid dexterous strategies. One of the
strategies implemented by KFC is the demographic segmentation coupled with
geographic segmentation. KFC has its outlets in many countries and sells its products
according to the geographic needs of the customers to ensure that the customers’ demand
of different products emerging from the heterogeneity of geographic needs is
appropriately satisfied. For example, in north India chicken related products of KFC
generate maximum revenue for the company where as on the other hand in south India
Vegetarian food items sell more than the chicken.
Another marketing strategy which KFC has implemented successfully is the selection of
the location while opening its outlets. In a market there are certain areas where the
customer traffic is more as compared to other locations. This provides an opportunity to
the business organisation to allure more customers and boost their overall sales. Keeping
in view the above mentioned strategy, KFC places itself close to schools, colleges,
cinemas and markets which have high density of potential customers, as a result of which
KFC outlets are visited by young customers who are in hurry and as a result every day
KFC enjoys a large number of footfall. Furthermore, the company also established its
outlets close to the vicinity of vegetarian and non-vegetarian population. For example
Muslim populated areas or near the Vicinity of Hindu temples.
However, the company cannot abscond from those market locations which do not enjoy
the privilege of high customer traffic because if these locations are not covered, they will
provide a safe ground for the competitors that can prove derogatory for KFC. Hence, the
company devised the strategy of home delivery services in order to exhibit their presence
and simultaneously cover these market areas as well. Depending upon the vicinity of the
business, the company offers free delivery service and occasionally charges minimal
amount for this excellent service. The company has implemented 30 minutes delivery
policy where if the product does not reach the customer in the specified time, the

customer will be financially compensated by the specific KFC branch. However, the
company pronounces that the customers can enjoy this service only if the delivery order
is more than minimum specified amount. Additionally, the company also provides
immaculate services to celebrate the birthdays, anniversary or other important occasion
associated with the customers at their residence or in KFC restaurants.
The core management of the KFC always cherished the importance of advertisement
activities and took it seriously right from the inception of the organisation. Early
television advertisements of KFC regularly portrayed Sanders licking his fingers and
communicating to the viewer about the marvelous taste his secret recipes add to the
products. The advertisement saw a good response from the customers and by the 1960s,
both the Colonel and the chain's striped bucket were well-known among the customers.
Despite the death of Colonel Sanders in 1980, he remained a key symbol in the
advertising and branding strategies of the company. Moreover, throughout the mid 1980s,
KFC was outsourcing its advertisement and sales promotion services to Will Vinton
Studios which was producing humorous and acclamatory advertisements in order to
entice the customers towards the KFC brand.
These advertisements most often featured a cartoon like chicken which illustrated the
poor quality of food provided by the competing food chains as a result of prolonged
freezing and in appropriate handling of the raw material and other negative aspects. In
1997, KFC entered the NASCAR Winston Cup Series which is a well acknowledged
and cherished motor sport in USA as a sponsor of the Chevrolet Brickyard 400.
Moreover, by the late 1990s the KFC advertisements began featuring an animated version
of the Colonel with a lively and enthusiastic attitude. He would often appear on TV and
start out saying "The Colonel here" and moved across the screen with a cane in hand. The
Colonel was often shown dancing, singing, and knocking on the TV screen as he spoke to
the viewer about the product. All these strategies added up to enhanced growth of the
organisation and helped the company to grow faster in this tremendously competitive
business environment.
4.3.1 INTRODUCTION
Today Domino’s Pizza is the second largest franchised pizza chain in the world.
Approximately, 8,500 corporate and franchised stores are owned by the Domino’s which
are operational in 55 countries. However, surprisingly the inception of this renowned fast
food restaurant was very humble. In 1960, two brothers started Domino’s Pizza with
borrowed equity. Soon, Tom Monaghan the owner of the company comprehended the
potential of franchising and started franchising the Domino’s Pizza to other business
organisations in the USA. The operational locations of Domino’s Pizza grew quickly
from Ypsilanti, Michigan, USA where it was initially incepted to all sorts of diverse
places, countries and continents. Despite Domino's Pizza springing up at diverse
locations, the company was still sticking to its traditional working pattern. The companies
menu was been kept very simple and streamlined, the organisation sold only one type of
pizza crust which was named the regular pizza. Domino's Pizza base which is also known
as dough was bowed by tossing and pulling it into shape physically by the cook. No
specific technology was available to measure or standardize the circular base and the
density of the toppings sprung on the Pizza. Earlier the pizza menu included just two
sizes of dough that is small and big. However, under tremendous competition Domino’s
had to induct medium and extra large sized dough as well. Previously the company was
not offering side order that is some complimentary eatables with the main course. But
when it came to beverages the customer had the only option to order Coke. However,
confronted with competition and with the passage of time, Domino’s has adapted and
incorporated many virtuous changes in itself to improve the overall competitiveness of
the organisation. One of the prominent changes incorporated by the company was in
4.3 DOMINO’S PIZZA
1992, when company introduced its first non-pizza item that is bread sticks to their menu
list and also offered some side dishes or eatables coupled with a variety of beverages.
Domino's Pizza entered the Indian food market in 1996 and by now there are nearly 274
outlets spread out in 55 cities of India. It is estimated that nearly 70 percent of the
company’s revenue is generated from home delivery service and around 30 percent is
generated over the counter sales. Additionally, the procurement of the raw materials like
wheat, baby corn, tomatoes and spices are bought in from Jalandhar and then sent to the
commissaries in refrigerated trucks. 4 commissaries of the company are located in Delhi,
Bangalore, Kolkata and Mumbai. Thus, successfully implementing a right mix of product
and its distribution strategies, Domino’s has been able to remain a cut above the
competition.
4.3.2 GROWTH PATTERNS
In 1960, Tom Monaghan and his brother James purchased a small pizza store
in Ypsilanti, Michigan, USA. The deal was struck at $975 USD and eight months later
James traded his part of the business to Tom in exchange of a used Volkswagen Beetle.
In 1965, after the deal was officially registered in the court, Monaghan became the sole
owner of the company and renamed the business to Domino's Pizza Inc. Soon he realized
that franchising can escalate the business growth rate by manifolds and initiated the
process of franchising which was rewarded in 1967 when the first Domino's Pizza
franchise store opened in Ypsilanti. The company logo was initially incepted to add a
new dot with the addition of every new store, but this idea quickly withered away as the
company experienced rapid growth and the space for putting dots in the logo was scarce.
However, the three dots represent those stores which were opened during the era of 1969.
As a result of the swift growth of the company by 1978, Domino’s was able to open its
two hundredth store.
In 1983, Domino's opened its first international store in Winnipeg, Manitoba, Canada and
the same year Domino's embarked its one thousandth outlet. Adding to this immaculate

growth pattern in 1985, the company had the privilege to inaugurate their first restaurant
outlet in Luton, United Kingdom and after twelve years of hard work coupled with adroit
management enabled the company to open its one thousand and five hundredth restaurant
outlet globally in 1997. When the organisation mounted to such extent, Tom Monaghan
found it difficult to manage the business appropriately as he was confronted with family,
health and legal problems simultaneously. He realized that due to his inability to devote
the required time and energy towards the organisation the growth rate of the company
was suffering and this was the right time to withdraw and strike a good deal before the
company mislays its pace of development and its goodwill in the stock market is reduced.
In 1998, after 38 years of ownership, Domino's Pizza founder Tom Monaghan announced
his retirement and sold 93 percent of the company to Bain Capital Inc. for approximately
$1 billion USD and ceased being involved in the day-to-day operations of the
company. In 2003,
the industry trade publication “Pizza Today Magazine” reported that
Domino's Pizza was the most efficient pizza chain and gave it the title "Chain of the
Year". In 2006, Domino's opened its five thousandth restaurant outlet in Huntley, Illinois,
USA and simultaneously three thousandth international restaurant outlet in Panama City,
making a total of eight thousand restaurant outlets for the company. Additionally, the
same year the companies store situated in Tallaght, Dublin, Ireland, achieved a annual
turnover of $3 million USD and becoming the first outlet in Domino's history to touch
such a elevated amount. Moreover, by September 2006, the organisation was able to
successfully commence its eight thousand two hundred and thirty eighth stores which
resulted in the augmentation of the annual gross income by $1.4 billion USD.
In 2007, the core management of the company realized that by inducting internet based
services, the organisation could provide better individualized services to the customers
and therefore Domino's rolled out its first online and mobile ordering websites.
Furthermore, in 2008, Domino's introduced the Pizza tracker service which is an online
application that allows the customers to view the status of their order in a simulated real
time progress bar. This enabled the company to access customer related valuable data
quickly and proved as an effective tool in the hands of the lower management.

4.3.3 PRODUCT MIX
The ability to provide satisfactory products and services to the customers plays a pivotal
role in the success of any fast food restaurant. Therefore, the business organisations are
attentive to the changes in the vicinity of the business environment. Current Domino's
menu incorporates a variety of Italian American dishes where Pizza is the primary
product combined with traditional, specialty custom pizzas which are available in a
variety of crust styles and toppings. The other popular products offered by Domino’s
include pasta, bread bowls, oven baked sandwiches etc. Taking into consideration the
popularity of the non-vegetarian food, items the company has also included chicken side
dishes, breadsticks and salads coupled with beverages and desserts. However, Domino’s
has gone through a long way to enjoy such a vivid and effective menu which not only
entices the customers but also differentiates the company from the competition.
In the beginning, right from the Domino’s inception till early 1990s, the menu was kept
very simple in comparison to other fast food restaurants to ensure quick and efficient
delivery of the products. During this specified time period, Domino's menu consisted
solely of one pizza in two sizes that is 12-inch and 16-inch comprising of 11 different
options of toppings and Coke as the option for sweetened beverage. Brazen out by the
antagonistic competition which sprung out with the passage of time in the market
Domino’s was left with no other option except to make drastic changes in their product
mix.
The first menu expansion occurred in 1989 with the debut of Domino’s pan pizza and the
expenditure of launching this new product was approximately estimated at $25 million
USD, out of which $15 million USD was spent on new sheet metal pans with perforated
bottoms. Domino's started testing extra-large sized pizzas in early 1993, which were one
yard long and named "The Dominator Pizza". In an attempt to entice the non vegetarian
customers in 2002, Domino's launched spicy Buffalo and Chicken Kickers. This included
breaded, baked, white-meat fillets packaged in a custom designed box with two different
types of sauces.

The primary product line as Pizza, the company introduced its specialty pizzas which
were also known as the American legend line in 2009. These Pizzas were fostered with
40 percent superfluous cheese in comparison to the company's regular pizzas along with a
greater variety and combination of toppings. In 2009, Domino's commenced the selling
of bread bowl Pasta which is a lightly seasoned bread bowl baked with pasta inside and
Lava Crunch Cake dessert which comprises of a crunchy chocolate shell filled with warm
fudge. Subsequently in 2010, to differentiate its Pizza product line from the competition
and small business copying its products, Domino’s changed its pizza recipe from the
crust up and also assimilated significant changes in the dough, sauce and cheese used in
their pizzas in Indian subcontinent. Domino’s vibrant variety of products offering are
tailored to specific taste and appropriately priced. A few of these consumed products are:
regular pizza for Rs. 60, medium pizza costs Rs. 120, large pizza for Rs. 230 and popular
cheese burst pizza available at Rs. 190. In non-vegetarian category the company is
offering simple non vegetarian pizza priced at Rs. 95, medium non-vegetarian pizza for
Rs. 190, large pizza costing Rs. 330 and Cheese burst non vegetarian pizza for Rs. 260.
However, the prices of the product are very acceptable, but still in order to be frontward
of the competition the company has adapted immaculate integrated marketing
communication (IMC) strategies to achieve their business objectives.
4.3.4 MARKETING STRATEGIES
The core management of the company comprehended that it needs to cover all the market
place in order to enhance their overall competence. The areas which were far away from
the restaurant outlets were covered by home delivery service. For the same reason, the
company projected a message through advertisements that if the delivery of their
products took longer than thirty minutes, the product would be discounted by $3 which
was nearly 50 percent of the total cost of the product. In order to further foster this
concept in the cognition of the young customers, the company projected a game based on
super hit cartoon movie known as “Teenage Mutant Ninja Turtles”. In this game, the
pizza delivery man has 30 seconds in which he has to overcome the obstacles in his path

to complete the delivery on time. If the pizza man is late, then the player looses the game
and if he wins he is promoted to the next level. This was an instant hit among the young
players and they were encouraged to increase their frequency of visit to their nearby
Domino’s restaurant. However, in 1993 Domino’s Pizza discontinued their policy of
providing discount of $3 if the Pizza was not delivered in 30 minutes and assimilated a
new policy of giving free product if not delivered in specific time. Additionally, the
company also stated a new policy advocating that if a customer is unhappy with the pizza
he or she can have a new pizza or a 100 percent refund.
By 1995, the company came to know that more than 70 percent of the young customers
bellowing to the age group of 15 years to 26 years are spending more than 10 hours per
week surfing on the internet and by 1996, the company realized the power of internet and
decided to use it as a powerful tool to navigate young customer traffic to their outlets. In
the same year, Domino’s Pizza website was launched the purpose of this website was not
just to educate the customers about the products, prices, locations of the restaurants,
discounts available of specific time but also to encourage the customers to energetically
participate in the promotional activities initiated by the company. One such highly
appreciated and popular promotional activity was the delivery of free pizza if the
customer is able to cut the token number given in the newspaper and bring it to the
company outlet with two more acquaintances who are willing to provide their emails to
the company. This innovative strategy was pretty successful in attracting huge number of
customers and provided the company with accurate and immensely useful data. Domino’s
has left a strong inexpugnable mark on the history of the fast food industry especially, the
pizza industry. The company has acquainted the pizza industry with many marvelous and
dexterous innovations which have not only played an imperative role in building up the
Pizza industry but also setting up new standards. The belt driven pizza oven and the
corrugated cardboard delivery boxes which are very effective in holding the heat inside
the pizza during the delivery time are a few of the inventions that are identified as success
driver for the Domino’s Pizza. Ever mindful of the fact that a cold pizza could give nasty
dining experience, the Domino’s pizza devised a new gadget known as the "Heat Wave"
which is a portable electrical bag system that works on lithium batteries to keep the pizza
hot during delivery making. Thus, as also pointed out by marketing experts, Domino’s is
well known for its innovative marketing strategies that have played a pivotal role in
making Domino’s a success story.
4.4.1 INTRODUCTION
The Pizza Hut was embarked in 1958 by two brothers Dan Carney and Frank Carney who
borrowed $600 USD to start the business in their hometown of Wichita, Kansas, USA.
They rented a small building at 503 South Bluff in downtown Wichita and purchased
second hand equipments to make pizzas. By observing and analyzing the fast food
business environment, the brothers realized that franchising is the hot formula which was
then been used by all successful business. So, they also decided to incorporate the same
strategy and a year later in 1959, Pizza Hut successfully opened its first franchise outlet
in Topeka, USA. In 1966, when the number of Pizza Hut franchisee grew to 145, a home
office or headquarters was established to coordinate the businesses from Wichita.
The maiden international Pizza Hut franchisee was instigated in Canada during 1988 and
soon after this development the organisation established International Pizza Hut
Franchise Holders Association (IPHFHA). The aim of this organisation was acquiring 40
percent of the company's franchise operations or 120 stores and merging them to the
outlets which were exclusively owned and run by Pizza Hut. This was a wrong decision
taken by the core management of the Pizza Hut and the attempt of acquiring the
franchises brought turmoil to the organisation’s chain structure. Varied accounting
systems used by the previous franchise owners had to be merged into one operating
system and this was a tedious process that took approximately eight months to complete.
In the meantime sales flattened and profits tumbled.
4.4 PIZZA HUT

In early 1970, Frank Carney realized that the company’s practice of relying on statistics
from its annual report to cultivate its business strategy was inadequate and a more
developed long-term business plan was necessary. In 1970, Pizza Hut inaugurated its first
outlets in Munich and Sydney located in Germany and Australia respectively.
Simultaneously, the same year republic of China witnessed the inaugural of five
hundredth Pizza Hut restaurant outlet in Nashville, Tennessee. Furthermore, in order to
expand the operations of the company in Italy, the Pizza Hut acquired large number of
business and observed an abrupt increase of 80 percent in the acquisition process.
In 1971, Pizza Hut became the world's largest pizza chain in concurrence to sales and
number of restaurants which were approximately one thousand at that time. Eventually,
in 1972, the Pizza Hut was listed in the New York Stock Exchange and by the end of the
same year, Pizza Hut instigated 4,10,000 shares in the stock exchange for the public.
Additionally, the company further proliferated by purchasing three restaurant divisions
that is Taco Kid, Next Door, and Flaming Steer. In addition, Pizza Hut acquired
Franchise Services Inc., which was earlier a restaurant supply company and J & G Food
Company, Inc., which was a distribution company concerning food. Pizza Hut
simultaneously added a second distribution center in Peoria, Illinois, USA and the same
year the company was able to generate 1 million USD in a week. Soon the Pizza Hut
expanded further by opening outlets in Japan and Great Britain. Three years later, the
chain had more than 100 restaurants outside the United States and a strong franchise
network consisting of two thousand units. The arduous collective efforts of the
employees and the management of the company were able to steer the organisation
through the ups and downs of the business successfully. However, in order to maintain
supremacy in the business, the company has channelized tremendous efforts and
resources to devise new strategies to continuously expand and grow in this competitive
global market.

4.4.2 GROWTH PATTERNS
This world rewound international fast food restaurant was established by two brothers
Dan Carney and Frank Carney in 1958 at their hometown of Wichita, Kansas, USA. Soon
after its inception they initiated the process of franchising in order to engender maximum
sales turnover. Moving on with the legacy in 1959, Pizza Hut successfully opened its first
franchise outlet in Topeka, USA. The franchise business did brilliantly well and by 1966,
the number of Pizza Hut franchisee exploded to 145 as a result of which the company
was compelled to establish headquarters to co-ordinate the businesses from Wichita. In
continuation with this exploratory growth pattern, Pizza Hut inaugurated its first outlet in
Germany and Australia in 1970 and successively the company observed the opening of
five hundredth Pizza store in the republic of China.
Under the proficient guidance of Steven Reinemund who was appointed as the president
and chief executive officer of Pizza Hut in 1984, the company experienced an
unprecedented growth rate for the pizza chain. Further, in 1986 Pizza Hut had the
privilege to inaugurate its five thousandth franchise unit in Dallas, Texas. In the same
year the company commenced a successful home delivery service in order to allure the
customers and encompass even those marketing territories which are not covered by the
restaurant outlets. Additionally, in 1987, Pizza Hut was able to successfully assimilate
Straw Hat Pizza Parlour which was one of its strongest competitors. By 1990s, the
frequency of delivery and carryout business of the Pizza Hut grew to such an extent that
it accounted for approximately 25 percent of the company's total sales turnover.
Concurrently, in 1990 Pizza Hut opened its first outlet in Moscow, USSR and this
Russian location quickly established itself as the Pizza Hut's highest customer volume
generation unit in the world.
In 1991, when McDonald's, introduced Mc Pizza on its menu list and concurrently
offered home delivery service to the customers. This invasion in the pizza industry
coupled with economic recession tested the marketing strategies of the Pizza Hut to the
limit and astoundingly Pizza Hut emerged as a victorious business organisation. In the
same year the company’s sales went up to ten percent worldwide making $5.3 billion
USD in sales turnover and the growing health awareness and the popularity of vegetarian
lifestyles had prompted many people to reconsider pizza as a nutritious alternative in
comparison to greasy fast food. The company deemed the changes in the thinking pattern
of the customers and responded to this transformation swiftly by devising new ways to
elevate the nutritious content in the food items associated with Pizza Hut. This prompt
response to the change in the market trend rewarded the company handsomely by
generating $1.2 billion USD in sales. Carrying on with the same strategy in 1995, Pizza
Hut was able to achieve an escalated income of $414 million USD which was 40 percent
more than the previous year. By 2001, the company was able to embark five hundredth
restaurant outlets employing over 20,000 employees in the United Kingdom and
consequently in 2006, White bread sold their share of the joint venture to Yum Brands
Inc. as a result of which Pizza Hut UK Ltd. was 100 percent owned by Yum Brands.
Additionally, in 2009, the company launched kids eat free offer in which a free two-
course kid’s meal was offered as a complimentary with every purchase of adult main
course. However, the company has realized that product mix plays a pivotal role in
enticing the customers and elevating the overall customer satisfaction level.
4.4.3 PRODUCT MIX
Pizza Hut comprehends the significance of right product mix in alluring the customers
towards its restaurants and simultaneously brazening out the competition prevailing in the
market place. As a result of which Pizza Hut frequently conducts experiments concerning
new products and discontinues less successful products. A few of these products include
the initially two foot by one foot square cut pizza which was known as Bigfoot in UK and
the 16 inch Big New Yorker in USA. This product acquired huge popularity because of
its unique size, Bigfoot was made with a sweet sauce and the combination of the Chicago
Dish Pizza and Sicilian pizza. Taking into account the escalating popularity of Sicilian
pizza, the company started offering Sicilian pizza to its customers separately from the
Bigfoot and in 2006, Sicilian pizza was launched with a different name which was
Lasagna Pizza. Other popular products offered by Pizza Hut are: the Cheesy Bites pizza
which is similar to the Stuffed Crust pizza except the crust has been divided into 28 bite
sized pieces that can be pulled apart. Another admired and thriving product of the
company is the Insider pizza which consists of a layer of cheese in between two layers
of dough. One more product which proved it worth was Double Deep pizza with double
the toppings and 50 percent more cheese coupled with the crust wrapped over the top to
hold in all the toppings from falling. This was a good innovation because frequently the
toppings of the pizza fall or slip away while it is being consumed by the customer which
is not only embracing for the customers but also forces them to use fork and knife which
many customers are not comfortable with. In 1985, Pizza Hut introduced the Priazzo
which was a two crusted Italian pie that resembled a deep-dish pizza. This product adage
swift popularity in the initial days of its launch and it had may other verities like Priazzo
Milano which consisted of a blend of Italian sausage, pepperoni, beef, pork fillings, a hint
of bacon, mozzarella and cheddar cheese. Priazzo Florentine made up of a light blend of
five cheeses with ham and a touch of spinach and last but not the least the Priazzo Roma
Pizza prepared with stuffed pepperoni, mushrooms, Italian sausage, pork filling, onions,
mozzarella and cheddar cheese, adding to the taste was the double crusted pie which was
topped with a layer of tomato sauce and melted cheese.
A few of the successfully launched products in the London are: Stuffed crust pizza, with
incorporates outermost edge wrapped around a cylinder of mozzarella cheese, Hand
Tossed Pizza known for its traditional pizzeria crusts Thin 'N Crispy pizza made up of a
thin crisp dough which was Pizza Hut's original style, Dippin Strips pizza a pizza cut into
small strips that can be dipped into a number of sauces and The Edge pizza where the
toppings nearly reach to the edge of the pizza. Taking into consideration the geographical
differences, the company has tailored their products to best suit the regional
requirements. A new, upscale concept was unveiled by the company in 2004, which was
known as the Pizza Hut Italian Bistro. Unveiled at fifty locations nationwide, the Bistro
was similar to a traditional Pizza Hut restaurant except the inclusion of new Italian
themed dishes such as penne pasta, chicken pomodoro, toasted sandwiches and other
foods. Additionally, Pizza Hut Bistros also serves the companies traditional pizzas and
sides dishes. All these stupendous efforts have resulted in the escalation of customer’s
satisfaction level and have eventually assisted in the rapid growth of the company.

However, the company understands the pivotal role of marketing in the sales generation
process and pays the required attention to it.
4.4.4 MARKETING STRATEGIES
Dan Carney who incepted the Pizza Hut had firm belief that in the present cut throat
competition just by making good products will not do. Right marketing and promotion
strategies have to be coupled with the planned effort in order to achieve the
organisation’s financial objectives. Advertising played an increasingly influential role for
Pizza Hut to broaden the chain's public profile. Many unique advertisement campaigns
were run at both national and international level. One of the most successful
advertisements launched by Pizza Hut was concerning two celebrities Donald Trump and
his ex-wife Ivana Trump who were shown eating Pizza. In the end of this commercial
advertisement, Ivana Trump asks for the last slice of the pizza from Donald, to which
Donald replied, "Actually dear, you're only entitled to half", this advertisement was based
on the couple's recent divorce.
The advertising slogans imprint an image of the product in the mind of the customers.
That is why these slogans are carefully selected and amalgamated with the concerned
advertisement campaigns. Consequently, Pizza Hut is very ardent concerning the slogans
projected by their company hence the company keeps on changing the slogans in
accordance with the market conditions. Till 2007, Pizza Hut's main advertising
slogan was "Gather around the good stuff", and from 2008 to 2009 it was substituted by
"Now You Are Eating". Futher, from 2009 to 2012 the advertising slogan was changed to
"Your Favorites Your Pizza Hut." The current advertising slogan is "Make it great". Pizza
Hut does not have an official international mascot. However, the company had different
mascots at distinct times in diverse countries. The commercials in the United States
called 'The Pizza Head Show' sustained from 1993 to 1997 and were based loosely on
the Mr. Bill Shorts. The advertisements featured a slice of pizza with a face made out of
toppings called 'Pizza Head'. In the 1970s, Pizza Hut used the signature red roof with a
jolly man named "Pizza Hut Pete". Pete was on the bags, cups, balloons and hand puppets

for the kids. In Australia during the Mid 1990s, the advertising mascot was a delivery boy
named Dougie, with boyish good looks who upon delivering pizza to his father would
hear the catchphrase "Here's a tip be good to your mother". Subsequently, adding to the
impact of these advertisements the role of Dougie was played by a famous Australian
soap opera and police drama actor Diarmid Heidenreich.
In order to entice the customers who are running short of time and ache for quality
products, Pizza Hut introduced the Personal Pan Pizza, offering customers a guarantee
that their single serving pizzas would arrive steaming hot within five minutes. The aim
was to make a quick, affordable pizza which could replace meal at ideal lunchtime.
Further, to augment its profits, Pizza Hut introduced Pan Pizza throughout its network of
restaurant outlets. This pizza consists of a thicker crust made in deep pans and soon it
became popular among the customers. The success of new additions to Pizza Hut's menu
was facilitated by the marketing resources provided by Pepsi Co. as well. Pizza Hut and
Pepsi Co. entered into a contract which advocated that Pizza Hut will be selling Pepsi
products in their restaurant outlets for life time. This marketing strategy was very
successful and turned out to be a win-win situation for both the business organisations.
Additionally, to prove the technical supremacy in fast food production and research
activities, the Pizza Hut sponsored the first space pizza delivery to the International Space
Station (ISS) and imprinted their logo on the Russian Proton rocket which launched the
Russian Zvezda module in 2000. All these strategies added up to elevate the sales
turnover of the business organisation and helped Pizza Hut to grow expeditiously in this
incalculably competitive business environment. In this chapter the above mentioned
companies have almost similar product lines and operational principles. Therefore, these
companies have been incorporated in this study.

Chapter – V
Analysis and Interpretation

Chapter 5: Analysis and Interpretation
5.1 Demographic Profile of the Respondents
5.2 Customer Satisfaction
5.2.1 Customer Satisfaction among the Selected
Organisations
5.2.2 Comparison of Customer Satisfaction Level of
Dominos, KFC, McDonalds and Pizza Hut.
5.2.3 Customer Satisfaction on the Basis of Demographics
5.2.4 Adequacy and Scale Purification
5.2.5 Factor Analysis of Customer Satisfaction
5.2.6 Scree Plot
5.2.7 Correlation Matrix between the Factors of Customer
Satisfaction
5.2.7.1 Statement Wise Customer Satisfaction Index
after Factor Analysis
5.2.8 Regression Analysis between Factors of Customers
Satisfaction and Overall Customers satisfaction
5.3 Service Quality
5.3.1 Statement Wise Service Quality Index
5.3.2 Statement Wise Service Quality Index after Factor
Analysis

5.3.3 Competitive Analysis of Service Quality among the
Selected Organisations
5.3.4 Correlation Matrix between the Dimensions of Service
Quality
5.3.5 Regression and Correlation Analysis between
Dimensions of Service Quality and Overall Satisfaction
with Service Quality
5.4 Pricing Policy
5.4.1 Statement wise Pricing Index
5.4.2 Competitive Analysis of Pricing among the Selected
Organisations
5.4.3 Correlation between Statements of Pricing
5.4.4 Regression Analysis between Statements of Pricing and
the Overall Pricing
5.4.5 Effect of Pricing on Customer Satisfaction
5.4.5.1 Correlation between Overall Pricing and Overall
Customer Satisfaction
5.4.5.2 Regression Equation between Overall Pricing
and Overall Customer Satisfaction
5.5 Brand Loyalty
5.5.1 Statement Wise Branding Index
5.5.2 Comparative Analysis of Brand Loyalty among the
Selected Organisations
5.5.3 Correlation between Statements of Branding

5.5.4 Regression and Correlation Analysis between Statements
of Branding and over all Brand Loyalty
5.6 Effect of brand loyalty on customer satisfaction
5.6.1 Correlation between Overall Brand Loyalty and Overall
Customer Satisfaction
5.6.2 Regression between Overall Brand Loyalty and Overall
Customer Satisfaction
5.7 Effect of Service Quality on Customer Satisfaction
5.7.1 Correlation between Overall Service Quality and Overall
Customer Satisfaction
5.7.2 Regression Equation between Overall Service Quality and
Overall Customer Satisfaction
5.8 Hypothesis Testing
5.8.1 Hypothesis Testing - 1
5.8.2 Hypothesis Testing - 2

ANALYSIS AND INTERPRETATION
In this chapter, the researcher has analysed and interpreted the relevant information
collected with the help of appropriate statistical tests. In order to understand the
demographics of the respondent mix, the researcher has used descriptive statistics namely
percentage, mean and standard deviation. To study the satisfaction level of customers of
Pizza Hut, Dominos, KFC and Mc Donald statistical tests applied includes mean,
standard deviation, t-test, ANOVA etc. Moreover, exploratory factor analysis has also
been used on the statements of the customer satisfaction for data reduction as well as to
explore the underlying factors involved while examining the customer satisfaction in fast
food industry. To understand the effect of pricing on customer satisfaction correlation
and regression tests has been used. Further, to study the effect of brand loyalty on
customer satisfaction descriptive statistics, correlation, and regression have been applied
on the relevant data. Moreover, in order to evaluate the effect of service quality on
customer satisfaction regression, correlation, and descriptive statistics have been used by
the researcher.
5.1 DEMOGRAPHIC PROFILE OF THE RESPONDENTS
Demographics play a pivotal role in understanding the mix of selected sample from the
universe. The demographic profile of the respondents is explained in the table 5.1, which
shows that out of 500 respondents, 325 are males and 175 are females, representing 65
and 35 percent respectively.
Table 5.1 Demographic Profile of the Respondents
S.No VARIABLES No. of Respondents Percentage (N = 500)
1
GENDER
Male 325 65
Female 175 35
2
MARITAL STATUS
Married 123 24.6
Unmarried 377 75.4

With respect to marital status 123 respondents are married whereas 377 respondents are
unmarried which represents 24.6 and 75.4 percent respectively. Majority of the
respondents belong to 22 - 27 years of age group which constitutes of 44.6 percent
followed by 16 - 21 age group constituting 38.4 percent of the total population. 41 years
and above constitutes 8 number of respondents which is the lowest, representing only 1.6
percent out of total sample size. As far as the house hold income is concerned maximum
respondent fall in the category of Rs 31,000 to Rs 40,000 per month income bracket
constituting 23.4 percent followed by 23 percent from Rs 51,000 to Rs 60,000 per month.
The least number of respondents were found in Rs 10,000 to Rs 20,000 per month
income bracket making only 9.0 percent of the total respondents. Descriptive statistics
reveals that out of 500 respondents, 266 are students making it as highest number of
occupational category representation from the variables of the total respondents followed
by corporate job which is 139 (27.8%), Government Job 79 (15.8%) and finally self
employed 56 (11.2%). Selected sample includes equal number of 125 respondents from
four selected fast food companies i.e. KFC, Mc Donald, Pizza Hut and Dominos.
S.No. VARIABLES No. of Respondents Percentage (N = 500)
3
AGE GOROUP
16 to 21 192 38.4
22 to 27 223 44.6
28 to 33 61 12.2
34 to 40 16 3.2
41 and above 8 1.6
4
HOUSE HOLD INCOME PER MONTH
10K to 20K 45 9
21K to 30K 79 15.8
31K to 40K 117 23.4
41K to 50K 77 15.4
51K to 60K 115 23
61k and above 67 13.4
5
OCCUPATION
Self employed 56 11.2
Student 226 45.2
Corporate Job 139 27.8
Government Job 79 15.8
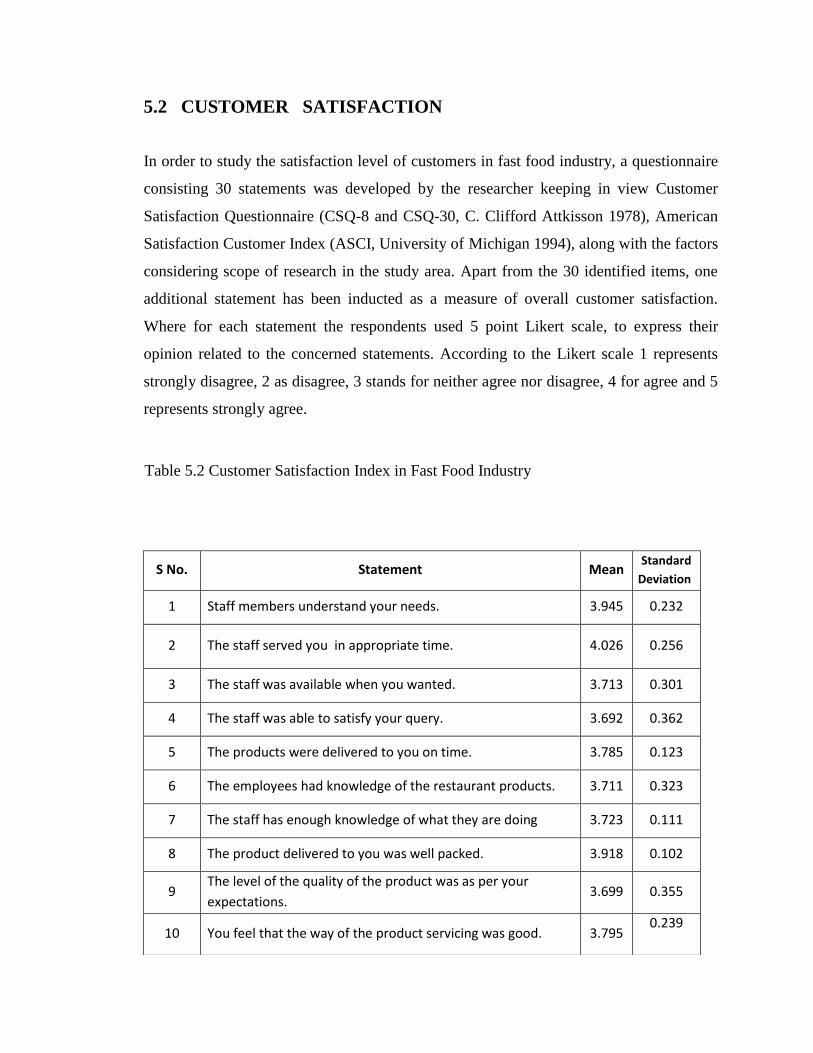
5.2 CUSTOMER SATISFACTION
In order to study the satisfaction level of customers in fast food industry, a questionnaire
consisting 30 statements was developed by the researcher keeping in view Customer
Satisfaction Questionnaire (CSQ-8 and CSQ-30, C. Clifford Attkisson 1978), American
Satisfaction Customer Index (ASCI, University of Michigan 1994), along with the factors
considering scope of research in the study area. Apart from the 30 identified items, one
additional statement has been inducted as a measure of overall customer satisfaction.
Where for each statement the respondents used 5 point Likert scale, to express their
opinion related to the concerned statements. According to the Likert scale 1 represents
strongly disagree, 2 as disagree, 3 stands for neither agree nor disagree, 4 for agree and 5
represents strongly agree.
S No. Statement Mean Standard
Deviation
1 Staff members understand your needs. 3.945 0.232
2 The staff served you in appropriate time. 4.026 0.256
3 The staff was available when you wanted. 3.713 0.301
4 The staff was able to satisfy your query. 3.692 0.362
5 The products were delivered to you on time. 3.785 0.123
6 The employees had knowledge of the restaurant products. 3.711 0.323
7 The staff has enough knowledge of what they are doing 3.723 0.111
8 The product delivered to you was well packed. 3.918 0.102
9 The level of the quality of the product was as per your
expectations. 3.699 0.355
10 You feel that the way of the product servicing was good. 3.795 0.239
Table 5.2 Customer Satisfaction Index in Fast Food Industry
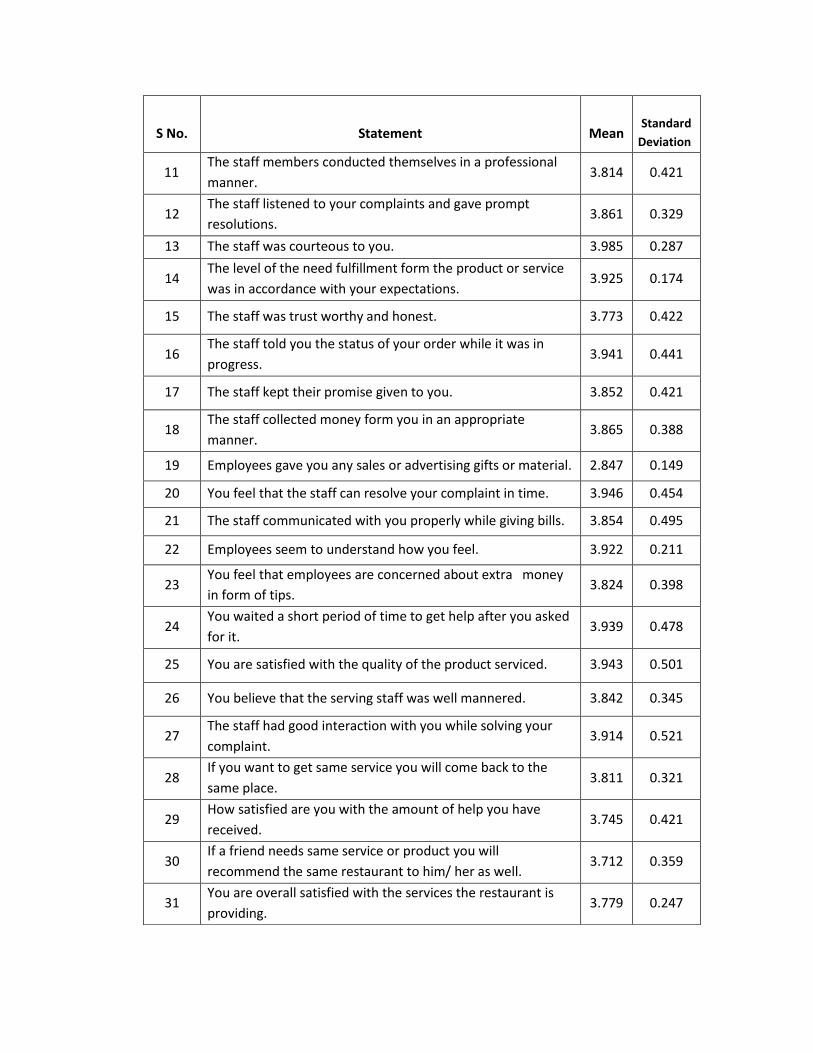
S No.
Statement
Mean
Standard
Deviation
11 The staff members conducted themselves in a professional
manner. 3.814 0.421
12 The staff listened to your complaints and gave prompt
resolutions. 3.861 0.329
13 The staff was courteous to you. 3.985 0.287
14 The level of the need fulfillment form the product or service
was in accordance with your expectations. 3.925 0.174
15 The staff was trust worthy and honest. 3.773 0.422
16 The staff told you the status of your order while it was in
progress. 3.941 0.441
17 The staff kept their promise given to you. 3.852 0.421
18 The staff collected money form you in an appropriate
manner. 3.865 0.388
19 Employees gave you any sales or advertising gifts or material. 2.847 0.149
20 You feel that the staff can resolve your complaint in time. 3.946 0.454
21 The staff communicated with you properly while giving bills. 3.854 0.495
22 Employees seem to understand how you feel. 3.922 0.211
23 You feel that employees are concerned about extra money
in form of tips. 3.824 0.398
24 You waited a short period of time to get help after you asked
for it. 3.939 0.478
25 You are satisfied with the quality of the product serviced. 3.943 0.501
26 You believe that the serving staff was well mannered. 3.842 0.345
27 The staff had good interaction with you while solving your
complaint. 3.914 0.521
28 If you want to get same service you will come back to the
same place. 3.811 0.321
29 How satisfied are you with the amount of help you have
received. 3.745 0.421
30 If a friend needs same service or product you will
recommend the same restaurant to him/ her as well. 3.712 0.359
31 You are overall satisfied with the services the restaurant is
providing. 3.779 0.247

Table 5.2 reveals the output of the information relate to the customer satisfaction level in
fast food industry. It is clear from the table that the satisfaction is found to be highest (
=4.026) with respect to servicing in appropriate time, hence the researcher can interpret
that the customers are highly satisfied with regards to this factor since, this is the only
variable which has recorded customer satisfaction more than 4 on 5 point scale.
Whereas, the second highest factor is Courteous staff ( =3.985), followed by Resolving
complaint in time ( =3.946), Understanding needs ( =3.945), Quality product serviced
( =3.943), Informing order status ( =3.941), Less waiting for help ( =3.939), Need
fulfillment and expectations ( =3.925), Employees understand you feelings ( =3.922),
Well packed delivery, ( =3.918), Interaction and solving complaint ( =3.914), The
statement with the least mean was Distribution of advertising material ( =2.847) which
is less than 3 on 5 point scale, as a result of which it can be interpreted that the selected
organisation under study does not have appropriate provision for distribution of
advertising material among the customers. The overall customer satisfaction stood at (
=3.779) with 0.247 standard deviation. The mean value of all other variables was
observed above the mid value (d=3) and less than 4 on 5 point scale which indicates that
customers are satisfied with respect to fast food industry.
5.2.1 CUSTOMER SATISFACTION AMONG THE SELECTED
ORGANISATIONS.
The table reveals that according to the customers of KFC, packed product delivery has
the highest value ( =4.214) where as employees’ concern in form of tips has the least
value ( =2.297). The overall customer satisfaction stood at ( =3.947). The mean value
of all other variables was observed above mid value (d=3) and less than 5 on 5 point
scale.
Table 5.2.1 Comparative Analysis of Customer Satisfaction among the Selected
Organisations
1= Strongly disagree, 2= Disagree, 3=Neither Agree nor Disagree, 4=Agree and 5=Strongly
Agree.

S No. Statement
MEAN
KFC Mc
Donald
Pizza
Hut
Domi
nos
1 Staff members understand your needs. 3.547 4.128 4.021 4.021
2 The staff served you in appropriate time. 3.126 4.593 4.321 4.358
3 The staff was available when you wanted. 3.654 4.098 4.395 4.235
4 The staff was able to satisfy your query. 3.647 3.654 3.654 3.987
5 The products were delivered to you on
time. 3.654 4.321 4.671 3.648
6 The employees had knowledge of the
restaurant products. 3.478 4.253 2.985 4.021
7 The staff has enough knowledge of what
they are doing 3.614 3.951 3.156 3.987
8 The product delivered to you was well
packed. 4.214 4.098 2.754 4.369
9 The level of the quality of the product was
as per your expectation. 3.741 4.214 4.328 4.597
10 You feel that the way of the product
servicing was good. 3.014 3.987 4.514 3.061
11 The staff members conducted themselves in
a professional manner. 3.951 4.321 4.231 3.852
12 The staff listened to your complaints and
gave prompt resolutions. 3.753 3.789 4.205 3.951
13 The staff was courteous to you. 3.652 3.694 4.328 4.159
14
The level of the need fulfillment form the
product or service was in accordance with
your expectations.
3.329 4.197 4.321 4.321
15 The staff was trust worthy and honest. 3.214 3.963 4.328 4.147
16 The staff told you the status of your order
while it was in progress. 3.458 3.017 4.578 4.369
17 The staff kept their promise given to you. 3.064 4.478 4.321 4.285
18 The staff collected money form you in an
appropriate manner. 3.078 3.988 3.654 3.645
19 Employees gave you any sales or advertising
gifts or material. 3.980 4.009 3.984 3.023

S No. Statement
MEAN
KFC Mc
Donald
Pizza
Hut
Domi
nos
20 You feel that the staff can resolve your
complaint in time. 3.078 4.170 4.325 3.985
21 The staff communicated with you properly
while giving bills. 4.098 3.904 4.021 4.253
22 Employees seem to understand how you
feel. 4.097 4.116 4.694 4.014
23 You feel that employees are concerned
about extra money in form of tips. 2.297 3.648 2.647 3.852
24 You waited a short period of time to get
help after you asked for it. 3.645 3.907 3.654 4.366
25 You are satisfied with the quality of the
product serviced. 3.547 4.049 3.987 4.324
26 You believe that the serving staff was well
mannered. 3.789 4.339 4.458 4.345
27 The staff had good interaction with you
while solving your complaint. 3.154 4.214 3.545 4.098
28 If you want to get same service you will
come back to the same place. 3.425 4.264 4.214 4.501
29 How satisfied are you with the amount of
help you have received. 3.678 3.910 4.369 4.330
30
If a friend needs same service or product
you will recommend the same restaurant to
him/ her as well.
3.987 4.077 4.210 3.648
31 You are overall satisfied with the services
the restaurant is providing. 3.947 4.312 4.037 4.298
1= Strongly disagree, 2= Disagree, 3=Neither Agree nor Disagree, 4=Agree
and 5=Strongly Agree.
This implies that customers of KFC are satisfied with its products and services. The
customers of Mc Donald have rated service time, with the highest value ( =4.593) and
informing the order status with the lowest value ( =3.071). The overall customer
satisfaction is ( =4.312) and all other variables mean value was observed above the mid
value (d=3) and less than 5 on 5 point scale, implying that customers are satisfied with
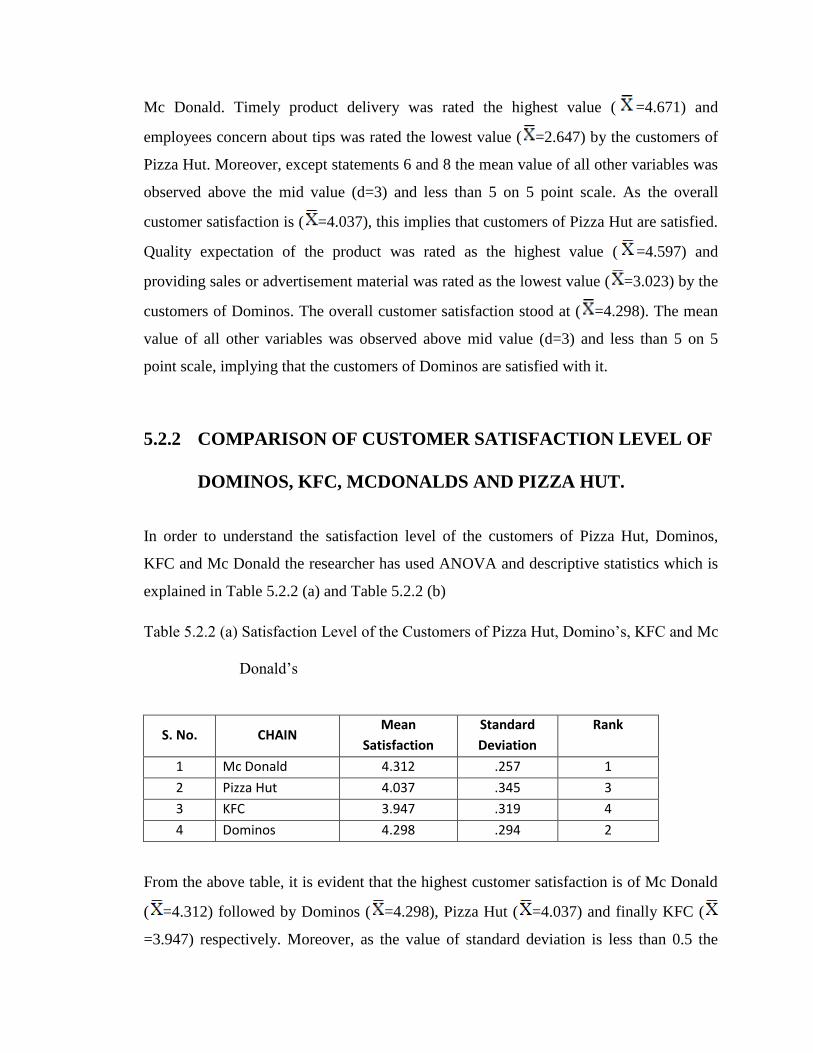
Mc Donald. Timely product delivery was rated the highest value ( =4.671) and
employees concern about tips was rated the lowest value ( =2.647) by the customers of
Pizza Hut. Moreover, except statements 6 and 8 the mean value of all other variables was
observed above the mid value (d=3) and less than 5 on 5 point scale. As the overall
customer satisfaction is ( =4.037), this implies that customers of Pizza Hut are satisfied.
Quality expectation of the product was rated as the highest value ( =4.597) and
providing sales or advertisement material was rated as the lowest value ( =3.023) by the
customers of Dominos. The overall customer satisfaction stood at ( =4.298). The mean
value of all other variables was observed above mid value (d=3) and less than 5 on 5
point scale, implying that the customers of Dominos are satisfied with it.
5.2.2 COMPARISON OF CUSTOMER SATISFACTION LEVEL OF
DOMINOS, KFC, MCDONALDS AND PIZZA HUT.
In order to understand the satisfaction level of the customers of Pizza Hut, Dominos,
KFC and Mc Donald the researcher has used ANOVA and descriptive statistics which is
explained in Table 5.2.2 (a) and Table 5.2.2 (b)
Table 5.2.2 (a) Satisfaction Level of the Customers of Pizza Hut, Domino’s, KFC and Mc
Donald’s
From the above table, it is evident that the highest customer satisfaction is of Mc Donald
( =4.312) followed by Dominos ( =4.298), Pizza Hut ( =4.037) and finally KFC (
=3.947) respectively. Moreover, as the value of standard deviation is less than 0.5 the
S. No. CHAIN Mean
Satisfaction
Standard
Deviation
Rank
1 Mc Donald 4.312 .257 1
2 Pizza Hut 4.037 .345 3
3 KFC 3.947 .319 4
4 Dominos 4.298 .294 2

researcher concludes that the values of the mean satisfaction have less dispersion
and are accurate.
Table 5.2.2 (b) explains that the significance value is less than 0.05 and the F value is
164.381 which is more than 1.
Table 5.2.2 (b) ANOVA Table
This implies that the calculated value of F is more than the tabulated value of F statistic.
Therefore, the researcher can assume that there is significant difference in variances of
groups and this difference is not caused by chance.
5.2.3 CUSTOMER SATISFACTION ON THE BASIS OF
DEMOGRAPHICS.
Table 5.2.3 reveals that male respondents are more surveyed than the female respondents
and the mean satisfaction score of male respondents ( = 4.121) is less than that of
female respondents ( = 4.347). Moreover, as the standard deviation of male and female
respondents are .241 and .306 respectively, which is less than 0.5, indicates that the mean
satisfaction value is accurate and has less dispersion. Furthermore, the accuracy of mean
satisfaction score is increased as the t-value of 1.981 is found significant at 5 percent
level.
ANOVA
Sum of Squares df Mean Square F Sig.
Between Groups 108.347 12 117.852 164.381 .000
Within Groups 37.521 45 78.657
Total 145.868 57

1= Strongly disagree, 2= Disagree, 3=Neither Agree nor Disagree, 4=Agree and 5=Strongly
Agree.
* P ≤ 0.05, ** P ≤ 0.01
Considering marital status, the unmarried respondents are more as compared to married
respondents and the mean customer satisfaction value of unmarried customers
( = 4.473) is more than the value of married customers ( =4.211). Therefore, the
researcher concludes that the married customers are less satisfied as compared to
unmarried customers. Moreover, the standard deviation of married and unmarried
respondents are .385 and .210 respectively, because the standard deviation is less than 0.5
the mean satisfaction value is accurate. Additionally, as the t-value of 2.294 is significant
at 5 percent level, the accuracy of mean satisfaction score is enhanced. As far as the age
group is concerned, the average age of the respondents was found to be 27 years. Hence,
S. No VARIABLES N Mean
Satisfaction
Standard
Deviation
t- Test
Value
1
GENDER
Male 325 4.121 .241 1.981*
Female 175 4.347 .306
2
MARITAL STATUS
Married 123 4.211 .385 -2.294*
Unmarried 377 4.473 .210
3
AGE GOROUP
16 to 27 415 4.317 .318 2.683**
28 to 41 and above 58 4.184 .274
4
HOUSE HOLD INCOME PER MONTH
0 to 40K 241 4.215 .107 3.451**
41K and above 259 4.332 .302
5
OCCUPATION
Employed 274 4.321 .205 -2.495*
Unemployed 226 4.254 .197
Table 5.2.3 Customer Satisfaction on the Basis of Demographics
the researcher has formed two groups i.e. 16 years to 27 years as first group and 28 years
to 41 and above as the second group. The table illustrates that the first group has higher
number of respondents as compared to group two. Furthermore, the customers bellowing
to16 years to 27 years of age group are more satisfied ( = 4.317) in comparison to
customers bellowing to 28 years to 41 and above ( = 4.184). Moreover, the standard
deviation of group one and group two respondents are .318 and .274 respectively
indicating high accuracy of mean satisfaction score. Additionally, the t-value of 2.683 is
also significant at 1 percent level. The researcher found that the average household
income of the respondents was Rs 40,000 per month. Hence, the researcher has divided
the respondents into two groups. The first group consists of respondents having monthly
household income between Rs 0 to Rs 40,000. The other group is made up of respondents
having monthly household income between Rs 41,000 and above. The table reveals that
the customers bellowing to the second group are more satisfied ( =4.332) and are higher
in number as compared to the customers bellowing to the first group ( = 4.215).
Furthermore, the standard deviation of group one and group two respondents are .107 and
.302 respectively, which shows that the degree of dispersion is less and mean satisfaction
value has high accuracy at t-value of 3.451 which is significant at 1 percent level. The
above table reveals that the employed respondents are more as compared to unemployed
respondents and the mean customer satisfaction value of employed customers ( =4.321)
is more than the unemployed customers ( =4.254). Therefore, the researcher concludes
that the unemployed customers are less satisfied as compared to employed customers.
Moreover, the standard deviation of employed and unemployed respondents are .2.05 and
.197 respectively. Additionally, the accuracy level of mean satisfaction value is further
enhanced as the standard deviation value is less than 0.5. Furthermore, the accuracy of
mean satisfaction score is improved as the t-value of 2.495 is significant at 5 percent
level.
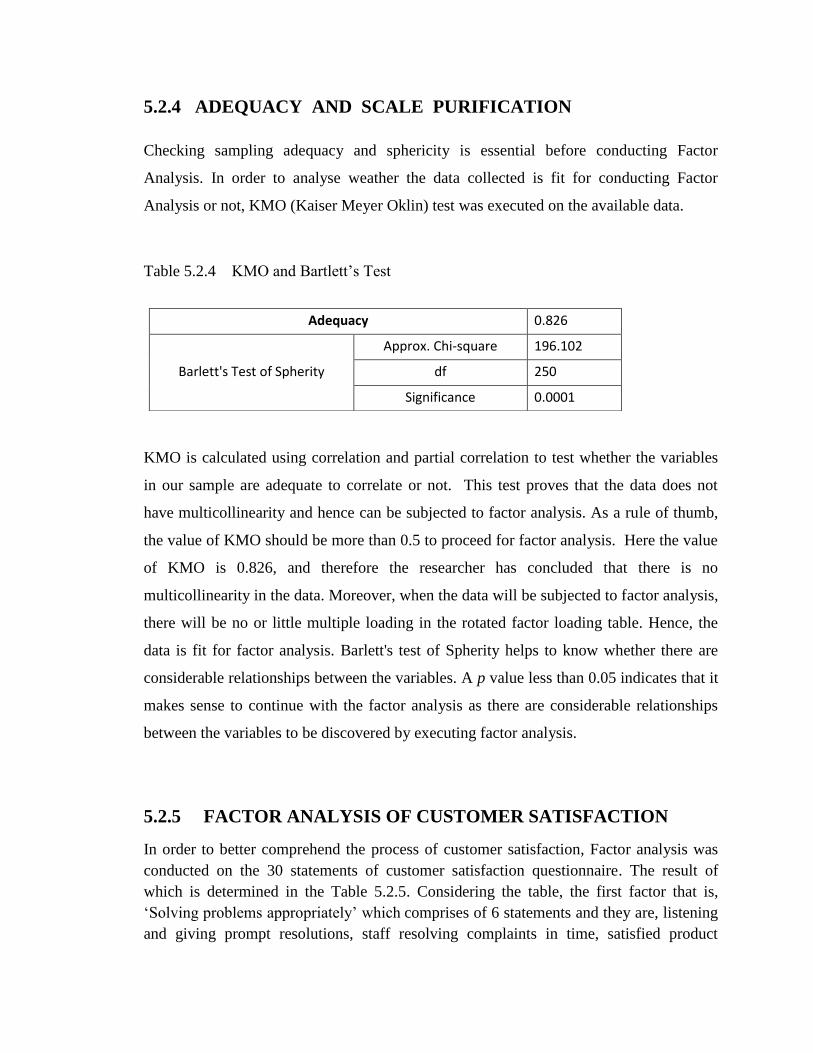
5.2.4 ADEQUACY AND SCALE PURIFICATION
Checking sampling adequacy and sphericity is essential before conducting Factor
Analysis. In order to analyse weather the data collected is fit for conducting Factor
Analysis or not, KMO (Kaiser Meyer Oklin) test was executed on the available data.
Table 5.2.4 KMO and Bartlett’s Test
KMO is calculated using correlation and partial correlation to test whether the variables
in our sample are adequate to correlate or not. This test proves that the data does not
have multicollinearity and hence can be subjected to factor analysis. As a rule of thumb,
the value of KMO should be more than 0.5 to proceed for factor analysis. Here the value
of KMO is 0.826, and therefore the researcher has concluded that there is no
multicollinearity in the data. Moreover, when the data will be subjected to factor analysis,
there will be no or little multiple loading in the rotated factor loading table. Hence, the
data is fit for factor analysis. Barlett's test of Spherity helps to know whether there are
considerable relationships between the variables. A p value less than 0.05 indicates that it
makes sense to continue with the factor analysis as there are considerable relationships
between the variables to be discovered by executing factor analysis.
5.2.5 FACTOR ANALYSIS OF CUSTOMER SATISFACTION
In order to better comprehend the process of customer satisfaction, Factor analysis was
conducted on the 30 statements of customer satisfaction questionnaire. The result of
which is determined in the Table 5.2.5. Considering the table, the first factor that is,
‘Solving problems appropriately’ which comprises of 6 statements and they are, listening
and giving prompt resolutions, staff resolving complaints in time, satisfied product
Adequacy 0.826
Barlett's Test of Spherity
Approx. Chi-square 196.102
df 250
Significance 0.0001

service quality, satisfied with help received, query satisfaction and good interaction while
solving complaints with factor loading values of .873, .668, .745, .685, .701 and .667
respectively. This factor explains 26.774% of 79.840% of cumulative variance.
Table 5.2.5 Factor Analysis of Customer Satisfaction Statements.
Name of the
factor Factor wise Dimensions
Mean
Satisfaction
Factor
loadin
g
Comm
unaliti
es
Eigens % of
Variance
Solving
problems
appropriately
(SPA)
The staff listened to your complaints
and gave prompt resolutions. 3.861 .873 .780
8.032
26.774
You feel that the staff can resolve
your complaint in time. 3.943 .668 .602
The staff had good interaction with
you while solving your complaint. 3.914 .667 .684
How satisfied are you with the
amount of help you have received. 3.745 .685 .580
The staff was able to satisfy your
query. 3.692 .701 .635
You are satisfied with the quality of
the product serviced. 3.946 .745 .617
Appropriate
Product
delivery
(APD)
The products were delivered to you
on time. 3.785 .844 .754
3.390
11.300
You feel that the way of the product
servicing was good. 3.795 .781 .655
The product delivered to you was
well packed. 3.918 .602 .721
The level of the need fulfilment form
the product or service was in
accordance with your expectations.
3.925 .655 .547
Well
mannered
staff
(WMS)
You believe that the serving staff
was well mannered. 3.842 .841 .685
2.599
8.662
The staff members conducted
themselves in a professional
manner.
3.814 .734 .629
Employees seem to understand how
you feel. 3.922 .629 .598
The staff was courteous to you.
3.985 .691 .604
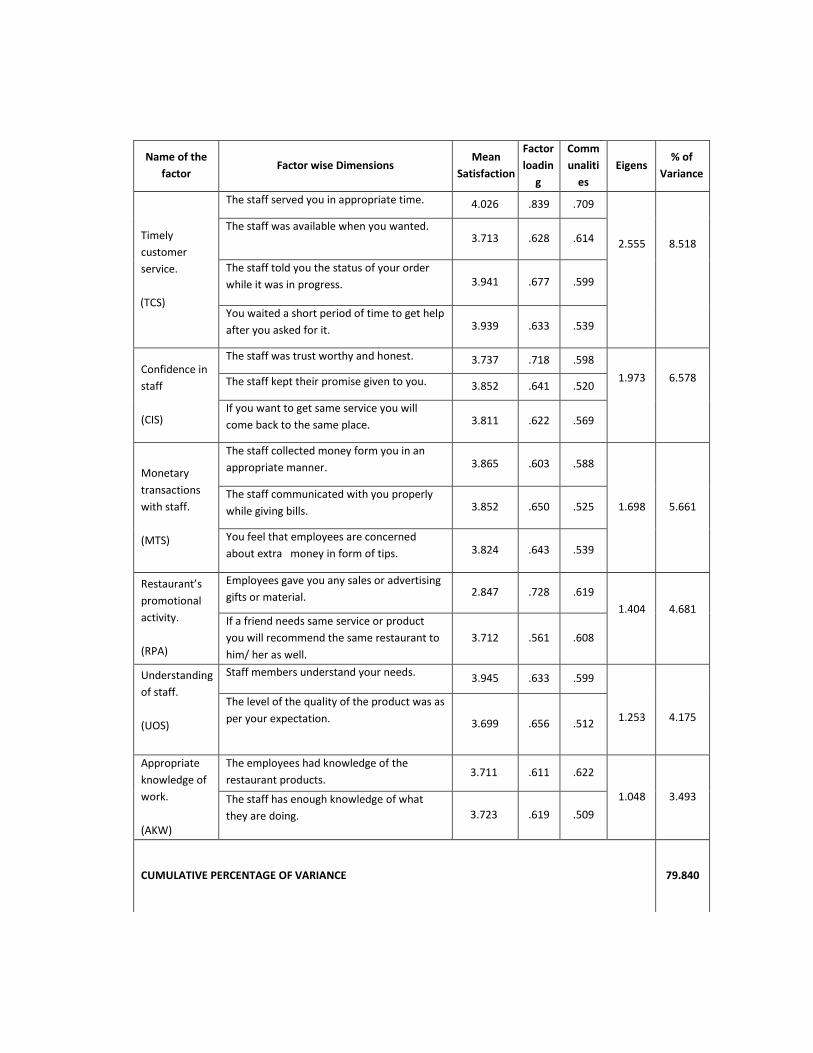
Name of the
factor Factor wise Dimensions
Mean
Satisfaction
Factor
loadin
g
Comm
unaliti
es
Eigens % of
Variance
Timely
customer
service.
(TCS)
The staff served you in appropriate time. 4.026 .839 .709
2.555
8.518
The staff was available when you wanted. 3.713 .628 .614
The staff told you the status of your order
while it was in progress. 3.941 .677 .599
You waited a short period of time to get help
after you asked for it. 3.939 .633 .539
Confidence in
staff
(CIS)
The staff was trust worthy and honest. 3.737 .718 .598
1.973
6.578
The staff kept their promise given to you. 3.852 .641 .520
If you want to get same service you will
come back to the same place. 3.811 .622 .569
Monetary
transactions
with staff.
(MTS)
The staff collected money form you in an
appropriate manner. 3.865 .603 .588
1.698
5.661
The staff communicated with you properly
while giving bills. 3.852 .650 .525
You feel that employees are concerned
about extra money in form of tips. 3.824 .643 .539
Restaurant’s
promotional
activity.
(RPA)
Employees gave you any sales or advertising
gifts or material. 2.847 .728 .619
1.404
4.681
If a friend needs same service or product
you will recommend the same restaurant to
him/ her as well.
3.712 .561 .608
Understanding
of staff.
(UOS)
Staff members understand your needs. 3.945 .633 .599
1.253
4.175
The level of the quality of the product was as
per your expectation. 3.699 .656 .512
Appropriate
knowledge of
work.
(AKW)
The employees had knowledge of the
restaurant products. 3.711 .611 .622
1.048
3.493 The staff has enough knowledge of what
they are doing. 3.723 .619 .509
CUMULATIVE PERCENTAGE OF VARIANCE
79.840

The second factor which is, “Appropriate Product Delivery” comprising of 4 statements
which are, products delivered on time, good product servicing, need fulfilment form
product or service meeting your expectations and well packed product delivered. The
above mentioned statements has the factor loading values of .844, .781, .655 and .602
respectively. This factor explains 11.300% of 79.840% of cumulative variance.
The third factor is, “Well Mannered Staff” comprising of 4 statements which are, well
mannered serving staff, professional conduct, understanding customers feelings and
courteous, having factor loading values of .841, .734, .629 and .691 respectively. This
factor explains 8.662% of 79.840% of cumulative variance.
Fourth factor is, “Timely Customer Service” comprising of 4 statements and they are,
servicing in appropriate time, availability of staff, informing order status and quick help
available. The above mentioned statements have the factor loading values of .839, .628,
.677 and .633 respectively and 8.518% of 79.840% of cumulative variance is explains by
this factor.
“Confidence in the Staff” is the fifth factor comprising of 3 statements which are, trust
worthy and honest staff, keeping promise and same service same place representing
factor loading values of .718, .641 and .622 respectively. This factor explains 6.578% of
79.840% of cumulative variance.
The sixth factor is, “Monetary Transactions With the Staff” comprising of 3 statements
and they are, collecting money in correct manner, proper communicated while giving
bills and employees wants tips. The above mentioned statements have factor loading
values of .603, .650 and .643 respectively. This factor explains 5.661% of 79.840% of
cumulative variance.
Seventh factor is, “Restaurant’s Promotional Activity”. This factor comprises of 2
statements which are, giving advertising material and recommend same restaurant to
friend with .728 and .561 as the factor loading values respectively.
The eighth factor is, “Understands of Staff”. This factor comprises of 2 statements which
are, staff understanding your needs and product quality of met your expectation with

factor loading values of .633 and .656 respectively. This factor explains 4.175% of
79.840% of cumulative variance.
Finally, the last factor is, “Appropriate Knowledge of Work” Comprising of 2 statements
namely, knowledge of products and knowledge of what they are doing, having factor
loading value of .611 and .619 respectively. This factor explains 3.493% of 79.840% of
cumulative variance.
5.2.6 SCREE PLOT
The determination of the number of factors has additionally been done on the basis of
screen test. It is an alternative method which helps in determining how many factors
should be retained after factor analysis.
Figure 5.1 Scree Plot

Scree plot is a simple line plot which depicts Eigen values in descending order for
successive factors. Scree plot can be used to graphically determine the optimal number of
factors to be retained. When the data was systematically evaluated, SPSS was used to
simplify the data by reducing a large number of variables to smaller manageable figures
through a scree test plot. This test examines the graph of Eigen values which stops
factoring at the point where the values start making a straight line with the horizontal axis
of the graph. The findings are on the basis of data gathered from 30 variables within the
domain of customer satisfaction. In the scree plot test, the X axis represents the Eigen
values and Y axis represents the component numbers. The scree plot of customer
satisfaction shows clearly 9 factors before the beginning of the scree. Thus, further
conforming 9 factors.

5.2.7 CORRELATION MATRIX BETWEEN THE FACTORS OF
CUSTOMER SATISFACTION
The correlation matrix between the factors of customer satisfaction reveals that correlation
between AKW and TS is maximum (.361) and correlation between UOS and SPA is
minimum (.014).
Table 5.2.7 (a) Correlation between the Factors SPA, PD, WMS, TS, CIS, MTWS, PA,
UOS and AKOW
The above table shows that there is a positive but less degree of correlation between
selected variables and thus, these factors make a good questionnaire for accessing the
customer satisfaction in the fast food industry. Additionally, the table 5.3.7 (b) explains
the new questionnaire which was developed after implementing factor analysis, where for
each statement the respondents used 5 point Likert scale to express their opinion related
to the concerned statements. According to the Likert scale, 1 represents strongly disagree,
SPA APD WMS TCS CIS MTS RPA UOS AKW
SPA 1
APD .254 1
WMS .235 .347 1
TCS .340 .293 .189 1
CIS .021 .301 .265 .045 1
MTS .224 .254 .291 .314 .097 1
RPA .341 .325 .366 .087 .149 .290 1
UOS .014 .271 .196 .178 .245 .322 .087 1
AKW .145 .254 .355 .361 .054 .219 .149 .284 1

2 represents disagree, 3 represents neither agree nor disagree, 4 represents agree and 5
represents strongly agree.
5.2.7.1 STATEMENT WISE CUSTOMER SATISFACTION INDEX
AFTER FACTOR ANALYSIS.
Table 5.2.7 (b) elaborates the information related to the customer satisfaction of fast food
restaurants. The satisfaction was found highest with the problem solving ability of the
staff ( =4.615) having standard deviation of .145.
Table 5.2.7 (b) Statement Wise Customer Satisfaction Index after Factor Analysis
S No Statement Mean Standard
Deviation
1 You feel that the staff can solve your problems appropriately. 4.615 .145
2 You are satisfied with the product delivery by the staff. 4.244 .214
3 The staff was well mannered. 3.428 .365
4 The staff gave you timely service. 3.813 .412
5 You have confidence in the staff. 4.152 .256
6 You are satisfied with the monetary transactions with the staff. 4.137 .342
7 Promotional activity of the restaurant was good. 4.335 .355
8 You feel that the staff understands you well. 3.661 .384
9 The staff has appropriate knowledge of their work. 3.892 .447
10 Over all you are satisfied with the restaurant services. 4.363 .258
1= Strongly disagree, 2= Disagree, 3=Neither Agree nor Disagree, 4=Agree and 5=Strongly Agree.
This statement was followed by Confidence in the staff ( =4.335). Product delivery
( = 4.244), Promotional activity of the restaurants ( =4.152), Satisfaction with the
momentary transactions ( =4.137), Knowledge the staff had about their work
( =3.892). The timely service by the staff ( =3.813), followed by staff understanding

them well ( =3.661) and finally the behaviour of the staff towards the customer
( =3.428). The overall customer satisfaction was ( =4.363). The mean value of all
variables was found above mid value (d=3) and less than 4 on 5 point scale, which
indicates that customers are satisfied with respect to fast food industry.
5.2.8 REGRESSION ANALYSIS BETWEEN FACTORS OF
CUSTOMER SATISFACTION AND OVERALL CUSTOMERS
SATISFACTION
In this study, multiple correlation and multiple regression have been applied to the 9
factors of customer satisfaction and overall customer satisfaction in order to better
understand the influences they execute on each other. All the customer satisfaction
variables form V1 to V30 have been grouped into 9 major factors which are SPA, APD,
WMS, TCS, CIS, MTS, RPA, UOS and AKW. The regression model used in the analysis
is
OCS = α + β1 SPA + β2 APD + β3 WMS + β4 TCS + β5 CIS + β6 MTS+ β7 RPA.
+ β8 UOS + β9 AKW
Where OCS stands for overall customer satisfaction, α is intercept or constant, β
represents the slope of the line and SPA, APD, WMS, TCS, CIS, MTS, RPA, UOS and
AKW are the factors. In the study SPA, APD, WMS, TCS, CIS, MTS, RPA, UOS and
AKW have been taken as independent variables and overall customer satisfaction has
been taken as dependent variable.

Table 5.2.8 (a) Coefficient of Regression
The above table shows that all the variables have a positive value of coefficient of
regression. RPA executes maximum influence on OCS as the value of standardised
coefficient Beta is .495. WMS executes maximum influence on OCS as the value of
standardised coefficient Beta is .007. Moreover t-test shows that all the variables are
significant and hence can be used in the final regression equation.
OCS = 1.031 + .280 SPA + .080 APD + .007 WMS + .169 TCS + .200 CIS + .133 MTS +
.569 RPA + .040 UOS + .209 AKW
Coefficientsa
Model
Unstandardised Coefficients
Standardised
Coefficients
t Sig. B Std. Error Beta
1 (Constant) 1.031 .141 7.290 .000
SPA .280 .040 .250 6.956 .000
APD .080 .029 .089 2.755 .006
WMS .007 .047 .007 2.158 .024
TCS .169 .046 .161 3.678 .000
CIS .200 .023 .222 8.822 .000
MTS .133 .031 .133 4.329 .000
RPA .569 .049 .495 11.631 .000
UOS .040 .043 .033 2.930 .003
AKW .209 .051 .182 4.124 .000
a. Dependent Variable: OCS
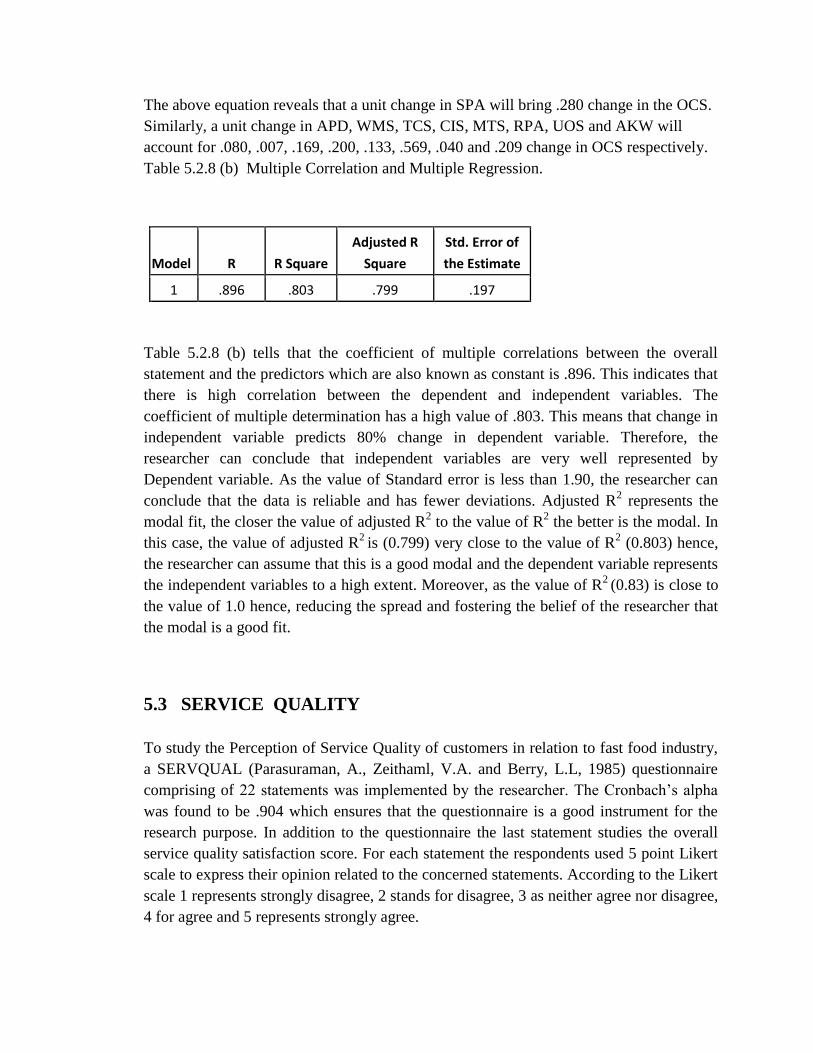
The above equation reveals that a unit change in SPA will bring .280 change in the OCS.
Similarly, a unit change in APD, WMS, TCS, CIS, MTS, RPA, UOS and AKW will
account for .080, .007, .169, .200, .133, .569, .040 and .209 change in OCS respectively.
Table 5.2.8 (b) Multiple Correlation and Multiple Regression.
Model R R Square
Adjusted R
Square
Std. Error of
the Estimate
1 .896 .803 .799 .197
Table 5.2.8 (b) tells that the coefficient of multiple correlations between the overall
statement and the predictors which are also known as constant is .896. This indicates that
there is high correlation between the dependent and independent variables. The
coefficient of multiple determination has a high value of .803. This means that change in
independent variable predicts 80% change in dependent variable. Therefore, the
researcher can conclude that independent variables are very well represented by
Dependent variable. As the value of Standard error is less than 1.90, the researcher can
conclude that the data is reliable and has fewer deviations. Adjusted R2 represents the
modal fit, the closer the value of adjusted R2 to the value of R
2 the better is the modal. In
this case, the value of adjusted R2
is (0.799) very close to the value of R2 (0.803) hence,
the researcher can assume that this is a good modal and the dependent variable represents
the independent variables to a high extent. Moreover, as the value of R2 (0.83) is close to
the value of 1.0 hence, reducing the spread and fostering the belief of the researcher that
the modal is a good fit.
5.3 SERVICE QUALITY
To study the Perception of Service Quality of customers in relation to fast food industry,
a SERVQUAL (Parasuraman, A., Zeithaml, V.A. and Berry, L.L, 1985) questionnaire
comprising of 22 statements was implemented by the researcher. The Cronbach’s alpha
was found to be .904 which ensures that the questionnaire is a good instrument for the
research purpose. In addition to the questionnaire the last statement studies the overall
service quality satisfaction score. For each statement the respondents used 5 point Likert
scale to express their opinion related to the concerned statements. According to the Likert
scale 1 represents strongly disagree, 2 stands for disagree, 3 as neither agree nor disagree,
4 for agree and 5 represents strongly agree.

5.3.1 STATEMENT WISE SERVICE QUALITY INDEX
Table 5.3.1 depicts the information on the service quality of the customers in fast food
industry. This table helps to reveal the perception of the customer towards the service
quality. The table consists of 23 statements.
Table 5.3.1 Statement Wise Service Quality Index in Fast Food Industry
S. No Statement Mean Standard
Deviation
1 Employees of the company are professionally dressed. 4.112 .135
2 You are satisfied with the communication between you and
the company. 3.894 .054
3 The material associated with the service (promotion, service
tracking, documents, invoice etc) are visually appealing. 3.691 .347
4 You feel that when a company promises to do something by a
certain time, they will do it by that time. 3.584 .369
5 The physical facilities of the company are visually appealing. 3.858 .451
6 The furniture in the company is neat and clean. 4.297 .281
7 When you have a problem the company employees will show
Sincere interest in solving it. 4.515 .094
8 The company provides you right service the first time. 4.087 .478
9 The food items and the beverages provided to you are of
good Quality and tasty. 3.572 .265
10 The food items and beverages provided to you are fresh 3.873 .098
11 You are allowed to fill your beverage at least one time free. 3.451 .104
12 The employees of the restaurant instill confidence in you. 3.993 .621
13 You feel safe to have transactions with the restaurant. 3.854 .421
14 The employees of the restaurant give prompt service to you. 3.748 .298
15 The employees of the company give you individual attention. 3.629 .095
16 The restaurant has modern cooking machinery. 3.838 .159
17 The employees of the company are co-operative. 4.317 .357
18 The employees of the company are always willing to help you
with a smile. 4.273 .397
19 The employees of the restaurant will tell you exactly how
long it will Take to process your order. 3.227 .149

S. No. Statement Mean Standard
Deviation
20 The employees have knowledge to answer your questions. 3.524 .123
21 The restaurant has operation hours convenient to you. 4.145 .124
22 The employees are never too busy to respond to your
request. 3.772 .292
23 You are satisfied with the overall service quality of the
restaurant. 3.794 .312
The table illustrated that service quality was found highest with the employees sincere
interest in solving customers problems (X=4.515) followed by co-operation of the
employees towards the customers (X=4.317), neat and clean furniture (X=4.297),
willingness of the employees to help with a smile (X=4.273), convenient operations
hours (X=4.145), professional outfit of the employees (X=4.112), providing the right
service first time (X=4.087), instilling confidence (X=3.993), communication between
customers and staff (X=3.894), fresh food and beverages (X=3.873), visually appealing
physical facilities (X=3.858), safety of transaction (X=3.854), modern cooking
machinery (X=3.838), employees not busy to respond to customers request (X=3.772),
prompt service (X=3.748), the material associated with the service is visually appealing
(X=3.691), individual attention (X=3.629), keeping promise by the company (X=3.584),
good quality of food items (X=3.572), knowledge to answer questions of the customers
(X=3.524) and refilling beverage at least one time (X=3.451). The statement with the
least mean was the knowledge of order processing time (X=3.227). The overall
satisfaction with service quality stood at (X=3.7947) with .312 standard deviation, as the
value of standard deviation is small than .50, the researcher assumes that the weightage
given to the mean values is very high and ultimately this increasing the accuracy of the
interpretation.

5.3.2 STATEMENT WISE SERVICE QUALITY INDEX AFTER
FACTOR ANALYSIS.
Table 5.3.2 Statement Wise Service Quality Index after Factor Analysis
1= Strongly disagree, 2= Disagree, 3=Neither Agree nor Disagree, 4=Agree and 5=Strongly Agree.
Table 5.3.2 illustrates the output of the service quality of the customers in fast food
industry. According to the table, the service quality was found highest with the
appearance of the infrastructure (tangibles) ( =4.325), followed by delivered promised
service (reliability) ( =4.29), prompt customer service (responsiveness) ( =4.102),
confidence in the service provided (assistance) ( =4.073) and lastly individual customer
attention (empathy) ( =3.985). The mean value of overall satisfaction with the service
quality of the restaurant was 4.381 and the standard deviation was .268, because the value
of standard deviation is smaller than 0.5, the researcher has concluded that the values of
mean carry high accuracy. The mean value of all variables was found above mid value
(d=3) and less than 5 on 5 point scale, which indicates that customers are satisfied with
respect to quality in fast food industry.
S No. Statement Mean Standard
Deviation
1 The infrastructure of the restaurant had good physical
appearance. 4.325 .285
2 Employees gave you prompt service. 4.102 .310
3 Service provided by employees instills confidence in you. 4.073 .347
4 Employees gave you individual attention. 3.985 .158
5 Employees delivered exactly same service as they promised you. 4.291 .251
6 You are satisfied with the overall service quality of the
restaurant. 4.381 .268

5.3.3 COMPARATIVE ANALYSIS OF SERVICE QUALITY
AMONG THE SELECTED ORGANISATIONS
The above table reveals that the physical appearance of infrastructure has been rated the
highest value ( =4.321) where as the delivery of promised service have been rated the
least value ( =3.654) by the customers of KFC.
Table 5.3.3 Comparative Analysis of Service Quality among the Selected Organisations
1= Strongly disagree, 2= Disagree, 3=Neither Agree nor Disagree, 4=Agree and 5=Strongly Agree.
The overall satisfaction with regards to service quality stood at ( =4.341). The mean
value of all other variables was observed above mid value (d=3) and less than 5 on 5
point scale. This implies that customers of KFC are satisfied with its service quality. The
customers of Mc Donald have rated prompt service the highest value ( =4.682) and
individual employee attention with the lowest value ( =3.015). The overall satisfaction
with regards to service quality is rated at ( =4.254) and all other variables’ mean value
was observed above mid value (d=3) and less than 5 on 5 point scale, implying that
S No. Statement
MEAN
KFC Mc
Donald
Pizza
Hut Dominos
1 The infrastructure of the restaurant had
good physical appearance. 4.321 4.274 3.064 4.652
2 Employees gave you prompt service. 4.125 4.682 4.285 4.028
3 Service provided by employees instills
confidence in you. 4.322 4.312 4.754 4.377
4 Employees gave you individual attention. 4.074 3.015 4.190 4.250
5 Employees delivered exactly same
service as they promised you. 3.654 3.987 4.021 3.124
6 You are satisfied with the overall service
quality of the restaurant. 4.341 4.254 4.421 4.301

customers are satisfied with Mc Donald’s service quality. Service instils confidence, was
rated highest value ( =4.754) and appearance of infrastructure has been rated the lowest
value ( =3.064) by the customers of Pizza Hut. Moreover, the mean value of all other
variables was observed above mid value (d=3) and less than 5 on 5 point scale. As the
overall satisfaction with regards to service quality is ( =4.421), it implies that when it
comes to service quality, the customers of Pizza Hut are satisfied with it. The customers
of Dominos have rated the physical appearance of infrastructure the highest value (
=4.652) and delivery of promised service the lowest value ( =3.124). The overall
satisfaction with regards to service quality stood at ( =4.301). The mean value of all
other variables was observed above mid value (d=3) and less than 5 on 5 point scale
implying that the customers of Dominos are satisfied with its service quality.
5.3.4 CORRELATION MATRIX BETWEEN THE DIMENSIONS OF
SERVICE QUALITY
From table 5.3.4 it is evident that correlation between tangibles and reliability is
minimum (.086) and the correlation between empathy and reliability is maximum
(0.357).
Table 5.3.4 Correlation between the Factors Tangibles, Responsiveness, Assistance,
Empathy and Reliability
Tangibles Responsiveness Assistance Empathy Reliability
Tangibles 1
Responsiveness .352 1
Assistance .094 .315 1
Empathy .184 .261 .141 1
Reliability .086 .312 .209 .357 1

The above table shows that there is a positive but less degree of correlation between
selected variables. Thus, these factors make a good questionnaire for accessing the
service quality in fast food industry.
5.3.5 REGRESSION AND CORRELATION ANALYSIS BETWEEN
FACTORS OF SERVICE QUALITY AND OVERALL
SATISFACTION WITH SERVICE QUALITY
This study involves the application of multiple correlation and multiple regressions to the
5 factors of service quality with the overall service quality in order to better understand
the influences these factors execute on each other. The results are shown in the tables
5.3.5 (a). The regression model used in the analysis is:
OSQ = α + β1 tangibles + β2 responsiveness + β3 assistance + β4 empathy + β5
reliability
Where OSQ stands for overall service quality, α is intercept or constant, β represents the
slope of the line and tangibles, responsiveness, assistance, empathy and reliability are the
factors. In the study tangibles, responsiveness, assistance, empathy and reliability have
been taken as independent variables and overall service quality has been taken as
dependent variable.

Table 5.3.5 (a) Coefficient of Regression
The above table shows that all the variables have a positive value of coefficient of
regression. The maximum influence on OSQ is executed by tangibles as the value of
standardised coefficient Beta is .350. The minimum influence on OSQ is executed by
assistance as the value of standardised coefficient Beta is .097. Moreover t-test shows
that all the variables are significant at 5 percent level.
OSQ = 1.124 + .354 tangibles + .124 responsiveness + .097 assistance + .240 empathy +
.136 reliability
The above equation illustrates that a unit change in tangibles will bring .345 change in the
OSQ. Similarly, a unit change in responsiveness, assistance, empathy and reliability will
bring .124, .097, .240 and .136 change in OSQ respectively.
Coefficientsa
Model
Unstandardised Coefficients
Standardized
Coefficients
t Sig. B Std. Error Beta
1 (Constant) 1.124 .236 8.324 .000
Tangibles .354 .325 .350 5.826 .000
Responsiveness .124 .452 .129 5.398 .000
Assistance .097 .219 .097 2.148 .031
Empathy .240 .021 .235 5.219 .000
Reliability .136 .258 .130 6.325 .000
a. Dependent Variable: OSQ

Table 5.3.5 (b) Multiple Regression.
Model R R Square Adjusted R Square
Std. Error of the
Estimate
1 .913a .833 .827 .197
a. Predictors: (Constant), Q5, Q3, Q1, Q4, Q2
Table 5.3.5 (b) reveals that the coefficient of multiple correlations between the overall
service quality and the predictors which are also known as constant is .913. This indicates
that there is high correlation between the dependent and independent variables. Hence,
change in independent variables will bring considerable change in dependent variable.
The value of coefficient of multiple determination is .833. This means that the change in
independent variable predicts 83.30% change in dependent variable. Therefore, the
researcher has concluded that independent variables bring considerable change in the
dependent variable. The value of standard error is less than 1.90 hence, the researcher can
conclude that the data is reliable and has fewer deviations. As the value of R2
(0.833) is
close to 1.0 the researcher believes that the spread is less and the modal is a good fit.
5.4 PRICING POLICY
In order to study the effect of pricing policy of the restaurants on the customers in fast
food industry, a 7 statement questionnaire was developed by the researcher keeping in
mind the previous researches such as Keller (2003) and Bucklin (1998) and also keeping
in view the factors and considerations in context to fast food industry. The last statement
studies the overall score and in this questionnaire, for each statement the respondents
used 5 point Likert scale to express their opinion related to the concerned statements.
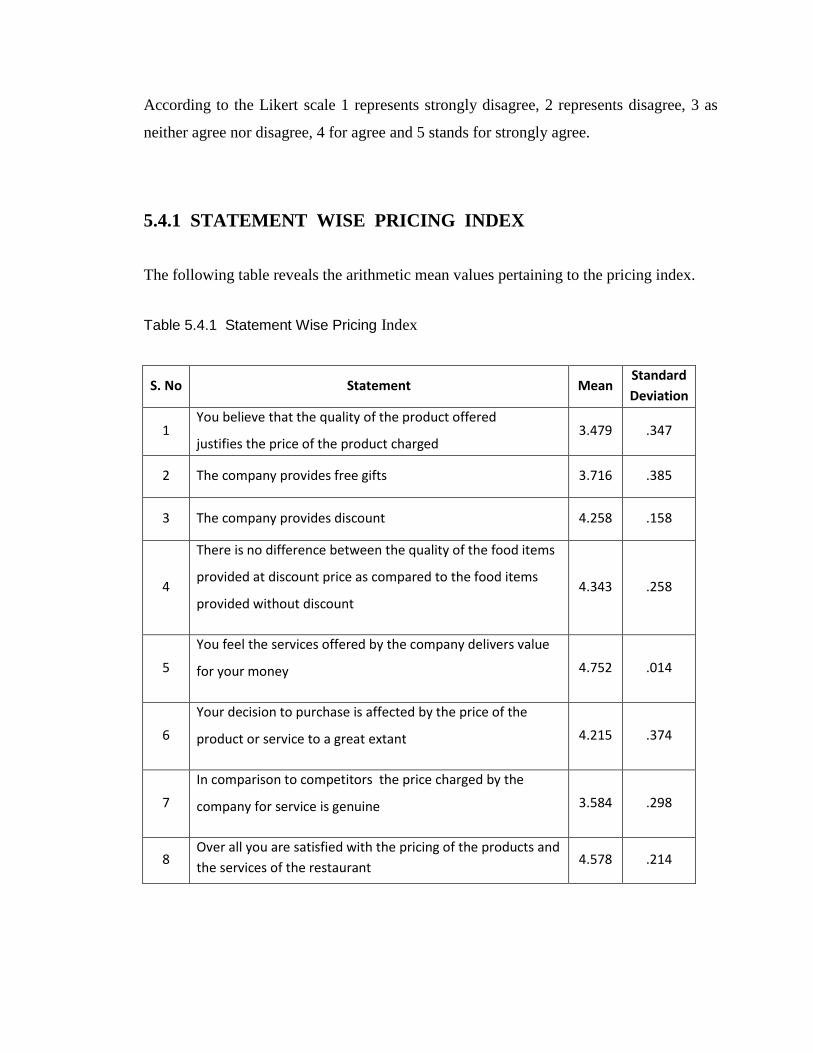
According to the Likert scale 1 represents strongly disagree, 2 represents disagree, 3 as
neither agree nor disagree, 4 for agree and 5 stands for strongly agree.
5.4.1 STATEMENT WISE PRICING INDEX
The following table reveals the arithmetic mean values pertaining to the pricing index.
Table 5.4.1 Statement Wise Pricing Index
S. No Statement Mean Standard
Deviation
1 You believe that the quality of the product offered
justifies the price of the product charged 3.479 .347
2 The company provides free gifts 3.716 .385
3 The company provides discount 4.258 .158
4
There is no difference between the quality of the food items
provided at discount price as compared to the food items
provided without discount 4.343 .258
5
You feel the services offered by the company delivers value
for your money 4.752 .014
6
Your decision to purchase is affected by the price of the
product or service to a great extant 4.215 .374
7
In comparison to competitors the price charged by the
company for service is genuine 3.584 .298
8 Over all you are satisfied with the pricing of the products and
the services of the restaurant 4.578 .214
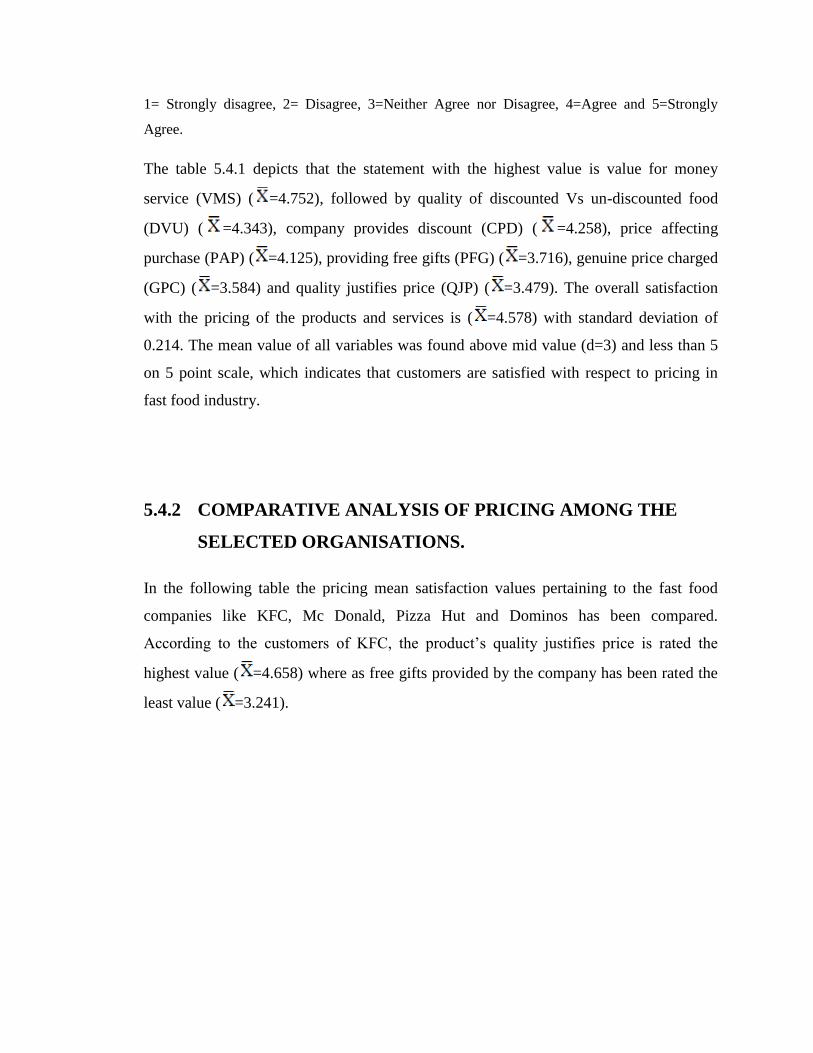
1= Strongly disagree, 2= Disagree, 3=Neither Agree nor Disagree, 4=Agree and 5=Strongly
Agree.
The table 5.4.1 depicts that the statement with the highest value is value for money
service (VMS) ( =4.752), followed by quality of discounted Vs un-discounted food
(DVU) ( =4.343), company provides discount (CPD) ( =4.258), price affecting
purchase (PAP) ( =4.125), providing free gifts (PFG) ( =3.716), genuine price charged
(GPC) ( =3.584) and quality justifies price (QJP) ( =3.479). The overall satisfaction
with the pricing of the products and services is ( =4.578) with standard deviation of
0.214. The mean value of all variables was found above mid value (d=3) and less than 5
on 5 point scale, which indicates that customers are satisfied with respect to pricing in
fast food industry.
5.4.2 COMPARATIVE ANALYSIS OF PRICING AMONG THE
SELECTED ORGANISATIONS.
In the following table the pricing mean satisfaction values pertaining to the fast food
companies like KFC, Mc Donald, Pizza Hut and Dominos has been compared.
According to the customers of KFC, the product’s quality justifies price is rated the
highest value ( =4.658) where as free gifts provided by the company has been rated the
least value ( =3.241).
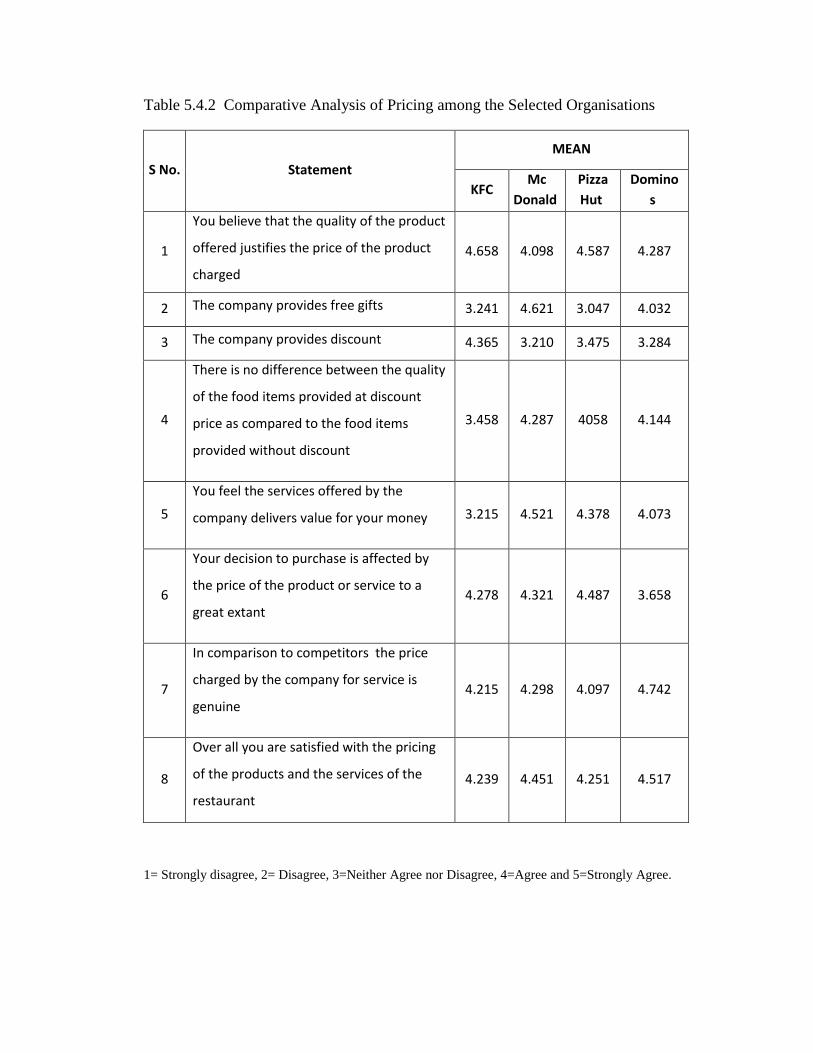
Table 5.4.2 Comparative Analysis of Pricing among the Selected Organisations
S No. Statement
MEAN
KFC Mc
Donald
Pizza
Hut
Domino
s
1
You believe that the quality of the product
offered justifies the price of the product
charged
4.658 4.098 4.587 4.287
2 The company provides free gifts 3.241 4.621 3.047 4.032
3 The company provides discount 4.365 3.210 3.475 3.284
4
There is no difference between the quality
of the food items provided at discount
price as compared to the food items
provided without discount
3.458 4.287 4058 4.144
5
You feel the services offered by the
company delivers value for your money 3.215 4.521 4.378 4.073
6
Your decision to purchase is affected by
the price of the product or service to a
great extant 4.278 4.321 4.487 3.658
7
In comparison to competitors the price
charged by the company for service is
genuine 4.215 4.298 4.097 4.742
8
Over all you are satisfied with the pricing
of the products and the services of the
restaurant
4.239 4.451 4.251 4.517
1= Strongly disagree, 2= Disagree, 3=Neither Agree nor Disagree, 4=Agree and 5=Strongly Agree.

The overall satisfaction related to price stood at ( =4.239). The mean value of all other
variables was observed above mid value (d=3) and less than 5 on 5 point scale, this
implies that customers are satisfied with the pricing policy of KFC. The customers of Mc
Donald have rated free gifts provided by the company the highest value ( =4.621) and
discounts provided by the company the lowest value ( =3.210). The overall satisfaction
with regards to the pricing stood at ( =4.451) and all other variables’ mean value was
observed above mid value (d=3) and less than 5 on 5 point scale, implying that customers
are satisfied with Mc Donald pricing policy. The product’s quality justifies price is rated
the highest value ( =4.587) where as providing free gifts has been rated the least value
( =3.047). Moreover, the mean value of all other variables was observed above mid
value (d=3) and less than 5 on 5 point scale.
As the overall satisfaction with regards to the pricing is ( =4.251) it implies that the
customers are satisfied with the pricing policy of Pizza Hut. Genuine price charged is
rated as the highest value ( =4.742) and discounts provided by the company was rated
as the lowest value ( =3.248) by the customers of Dominos. The overall customer
satisfaction with regards to pricing policy stood at ( =4.517). The mean value of all
other variables was observed above mid value (d=3) and less than 5 on 5 point scale,
entailing that as far as the pricing policy of Dominos is concerned the customers are
satisfied with it.

5.4.3 CORRELATION BETWEEN STATEMENTS OF PRICING.
From the table 5.4.3, it is evident that the correlation between the statements is less than
0.5 and therefore the researcher believes that the statements are representing data which
has less co-linearity and the statements constitute a good questionnaire.
Table 5.4.3 Correlation between Statements of Pricing
QJP PFG CPD DVU VMS PAP GPC
QJP 1
PFG .341 1
CPD .312 .094 1
DVU .254 .147 .207 1
VMS .231 .238 .064 .079 1
PAP .058 .342 .347 .218 .284 1
GPC .184 .285 .294 .364 .329 .259 1
The table shows that the correlation between PAP and statement QJP is the lowest (.058)
and the correlation between statement GPC and statement DVU is maximum (.364).
5.4.4 REGRESSION ANALYSIS BETWEEN STATEMENTS OF
PRICING AND THE OVERALL PRICING
In order to better understand the influences between the statements of pricing and the
overall pricing, the researcher has applied multiple regression and multiple correlation.

SPSS version 17 software has been used by the researcher to achieve this aim. The
researcher has subjected 7 statements and over all pricing to the above mentioned tests,
the results of which are explained in table 5.4.4 (a) and 5.4.4 (b)
The regression model used in the analysis is:
OPS = α + β1 QJP + β2 PFG + β3 CPD + β4 DVU + β5 VMS+ β6 PAP+ β7 GPC
Where, OPS stands for overall price satisfaction, α is intercept or constant, β represents
the slope of the line and QJP, PFG, CPD, DVU, VMS, PAP and GPC are the statements
of the pricing questionnaire. In the study QJP, PFG, CPD, DVU, VMS, PAP and GPC
have been taken as independent variables and overall price satisfaction has been taken as
dependent.
Table 5.4.4 (a) Coefficient of Regression
Table 5.4.4 (a) shows that all the variables have a positive value of coefficient of
regression. The maximum influence on OPS is executed by QJP because the value of
Coefficientsa
Model
Unstandardised Coefficients
Standardized
Coefficients
t Sig. B Std. Error Beta
1 (Constant) 1.469 .250 9.325 .000
QJP .458 .124 .455 4.366 .000
PFG .136 .231 .135 8.845 .000
CPD .389 .274 .389 2.467 .009
DVU .074 .025 .075 6.218 .000
VMS .300 .239 .280 7.215 .000
PAP .147 .341 .142 2.390 .014
GPC .151 014 .150 4.852 .000
a. Dependent Variable: OPS

standardised coefficient Beta is 455. The minimum influence on OPS is executed by
DVU as the value of standardised coefficient Beta is .075. However, the t-test shows that
all the variables are significant.
OPS = 1.469 + .458 QJP + .136 PFG + .389 CPD + .074 DVU + .300 VMS + .147 PAP+
.151 GPC
The above equation reveals that a unit change in QJP will bring .458 change in the OPS.
Additionally, a unit change in PFG, CPD, DVU, VMS, PAP and GPC will produce .136,
.389, .074, .300, .147 and .151 change in OPS respectively.
Table 5.4.4 (b) Multiple Correlation and Multiple Regression
Model R R Square
Adjusted R
Square
Std. Error of
the Estimate
1 .946a .896 .891 .132
a. Predictors: (Constant), P5, P3, P7, P4, P2, P6, P1
Table 5.4.4 (b) reveals that the coefficient of multiple correlation between the overall
price satisfaction and the predictors which are also known as constant is .946. This proves
that there is high correlation between the independent and dependent variables. Hence,
change in independent variables will bring considerable change in dependent variable.
The value of coefficient of multiple determination is .896. This means that change in
independent variable predicts 89.60% change in dependent variable. Therefore, the
researcher has concluded that independent variables bring considerable change in the
dependent variable. As the value of standard error is less than 1.90, the researcher
believes that the data is reliable and the deviations are very few. As the value of R2
(0.896) is close to 1.0, the researcher concludes that the spread of the data is less and the
modal is a good fit.

5.4.5 EFFECT OF PRICING ON CUSTOMER SATISFACTION
To know the relationship between pricing and customer satisfaction, the researcher has
subjected over all pricing and overall customer satisfaction to correlation and regression
analysis. The results of which are mentioned in tables 5.4.5 (a) and 5.4.5 (b) respectively.
5.4.5 (a) CORRELATION BETWEEN OVERALL PRICING AND
OVERALL CUSTOMER SATISFACTION.
Table 5.4.5 (a) elaborates the correlation between overall pricing and overall customer
satisfaction
Table 5.4.5 (a) Correlation between Overall Pricing and Overall Customer Satisfaction
The coefficient of multiple correlation is 0.813 which implies that there is a high
correlation between the overall customer satisfaction and overall pricing. Moreover, the
correlation between overall pricing and overall customer satisfaction is negative and
inversely proportional.
Correlations
C10 P8
C10 Pearson Correlation -1 .813**
Sig. (1-tailed) .000
N 500 500
P8 Pearson Correlation .813** -1
Sig. (1-tailed) .000
N 500 500
** Correlation is significant at the 0.05 level (1-tailed).
*C10= Overall customer satisfaction, P8= Over all pricing.

5.4.5.2 REGRESSION EQUATION BETWEEN OVERALL
PRICING AND OVERALL CUSTOMER SATISFACTION.
The regression model used in the analysis is:
OCS = α + β1 OP
OCS = 1.364 + .811 OP, where OCS stands for overall customer satisfaction, α is
intercept or constant, β represents the slope of the line and OP represents overall pricing.
Here overall pricing has been taken as independent variables and overall customer
satisfaction has been taken as dependent variable.
Table 5.4.5 (b) Coefficient of Regression
From the table 5.4.5 (b) it is evident that when overall price is increased by one unit, the
customer satisfaction increases by 0.811 which is statically significant at t- value of
4.287.
Coefficientsa
Model
Unstandardized Coefficients
Standardized
Coefficients
t Sig. B Std. Error Beta
1 (Constant) 1.364 .187 8.197 .000
OP .811 .324 .811 4.287 .000
a. Dependent Variable: OCS

Table 5.4.5 (c) Regression between Overall Pricing and Overall Customer Satisfaction
Table 5.4.5 (c) shows that the coefficient of multiple correlation is 0.813 which points out
high correlation between the variables, the value of coefficient of multiple determination
is 0.822 implying that, the change in independent variable will bring 82.2% change in the
dependent variable. As the value of R2 is very close to 1 the degree of dispersion is less
and hence the modal is a good fit.
5.5 BRAND LOYALTY
To study the brand loyalty of customers in relation to fast food industry, a 5 statement
questionnaire was developed by the researcher keeping in mind the previous researches
such as Reichheld (1993) and Bloemer and Kasper (1995) keeping in view factors and
considerations in context of fast food industry. In addition to the questionnaire, the last
parameter studies the overall brand loyalty of the customers towards the restaurant. 5
point Likert scale was used to express the opinion related to the concerned statements by
the respondents. According to the Likert scale 1 represents strongly disagree, 2 represents
disagree, 3 as neither agree nor disagree, 4 represents agree and 5 for strongly agree.
5.5.1 STATEMENT WISE BRANDING INDEX.
The following table illustrates the mean score value pertaining to branding. The table also
illustrates the value associated with each branding statement of the questionnaire.
Model R R Square Adjusted R Square
Std. Error of the
Estimate
1 .813 .822 .819 .207
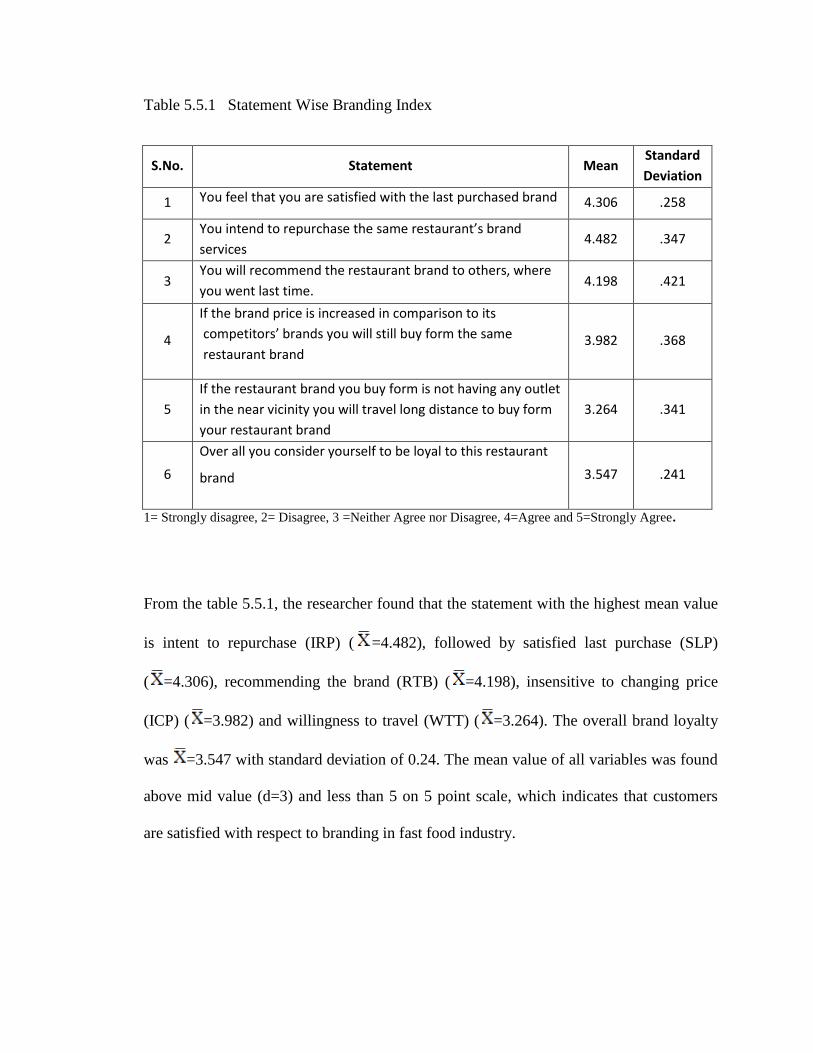
Table 5.5.1 Statement Wise Branding Index
S.No. Statement Mean Standard
Deviation
1 You feel that you are satisfied with the last purchased brand 4.306 .258
2 You intend to repurchase the same restaurant’s brand
services 4.482 .347
3 You will recommend the restaurant brand to others, where
you went last time. 4.198 .421
4
If the brand price is increased in comparison to its
competitors’ brands you will still buy form the same
restaurant brand 3.982 .368
5
If the restaurant brand you buy form is not having any outlet
in the near vicinity you will travel long distance to buy form
your restaurant brand
3.264 .341
6
Over all you consider yourself to be loyal to this restaurant
brand 3.547 .241
1= Strongly disagree, 2= Disagree, 3 =Neither Agree nor Disagree, 4=Agree and 5=Strongly Agree.
From the table 5.5.1, the researcher found that the statement with the highest mean value
is intent to repurchase (IRP) ( =4.482), followed by satisfied last purchase (SLP)
( =4.306), recommending the brand (RTB) ( =4.198), insensitive to changing price
(ICP) ( =3.982) and willingness to travel (WTT) ( =3.264). The overall brand loyalty
was =3.547 with standard deviation of 0.24. The mean value of all variables was found
above mid value (d=3) and less than 5 on 5 point scale, which indicates that customers
are satisfied with respect to branding in fast food industry.

5.5.2 COMPARATIVE ANALYSIS OF BRAND LOYALTY AMONG
THE SELECTED ORGANISATIONS.
Table 5.5.2 reveals that the satisfaction with the last purchase has been rated the highest
value ( =4.782) where as travelling long distances to buy from your preferred restaurant
has been rated the least value ( =3.021) by the customers of KFC.
Table 5.5.2 Comparative Analysis of Brand Loyalty among the Selected Organisations
S No. Statement
MEAN
KFC Mc
Donald
Pizza
Hut Dominos
1 You feel that you are satisfied with the last
purchased brand 4.782 4.394 4.147 4.617
2 You intend to repurchase the same
restaurant’s brand services 3.658 4.641 4.871 4.456
3 You will recommend the restaurant brand to
others, where you went last time. 4.621 4.278 3.025 4.159
4
If the brand price is increased in comparison
to its competitors’ brands you will still buy
form the same restaurant brand 4.278 3.111 4.369 4.258
5
If the restaurant brand you buy form is not
having any outlet in the near vicinity you will
travel long distance to buy form your
restaurant brand
3.021 4.017 4.258 3.065
6 Over all you consider yourself to be loyal to
this restaurant brand 4.312 4.374 4.287 4.390
1= Strongly disagree, 2= Disagree, 3 =Neither Agree nor Disagree, 4=Agree and 5=Strongly Agree.
The overall satisfaction with regards to branding stood at ( =4.312). The mean value of
all other variables except variable 2 was observed above mid value (d=3) and less than 5
on 5 point scale, this implies that customers of KFC are branding loyal. The customers of
Mc Donald have rated repurchasing the same brand the highest value ( =4.641) and

insensitivity to price with the lowest value ( =3.111). The overall satisfaction with
regard to branding is rated at ( =4.374) and all other variables’ mean value was
observed above mid value (d=3) and less than 5 on 5 point scale implying that customers
of Mc Donald’s are loyal to its brand. Repurchasing the same brand service was rated the
highest value ( =4.871) and recommending brand to others has been rated the lowest
value ( =3.025) by the customers of Pizza Hut. Moreover, the mean value of all other
variables was observed above mid value (d=3) and less than 5 on 5 point scale. As the
overall satisfaction with regard to branding quality is ( =4.287). It entails that the
customers of Pizza Hut are loyal to their brand. The customers of Dominos have rated
the highest value to the last purchase ( =4.617) and travelling long distances to buy
from your preferred restaurant has been rated the least value ( =3.065) by the customers
of Domino’s. The overall satisfaction with regards to branding stood at ( =4.390). The
mean value of all other variables was observed above the mid value (d=3) and less than 5
on 5 point scale signifying that the customers of Domino’s are loyal to their brand.
5.5.3 CORRELATION BETWEEN STATEMENTS OF BRANDING.
According to the table 5.5.3 the highest correlation was found between IRP and SLR
(0.328) and the lowest correlation was found between ICP and SLR (0.127).
Table 5.5.3 Correlation between Statements of Branding
SLR IRP RTB ICP WTT
SLR 1
IRP .328 1
RTB .268 .294 1
ICP .127 .309 .274 1
WTT .310 .254 .249 .184 1
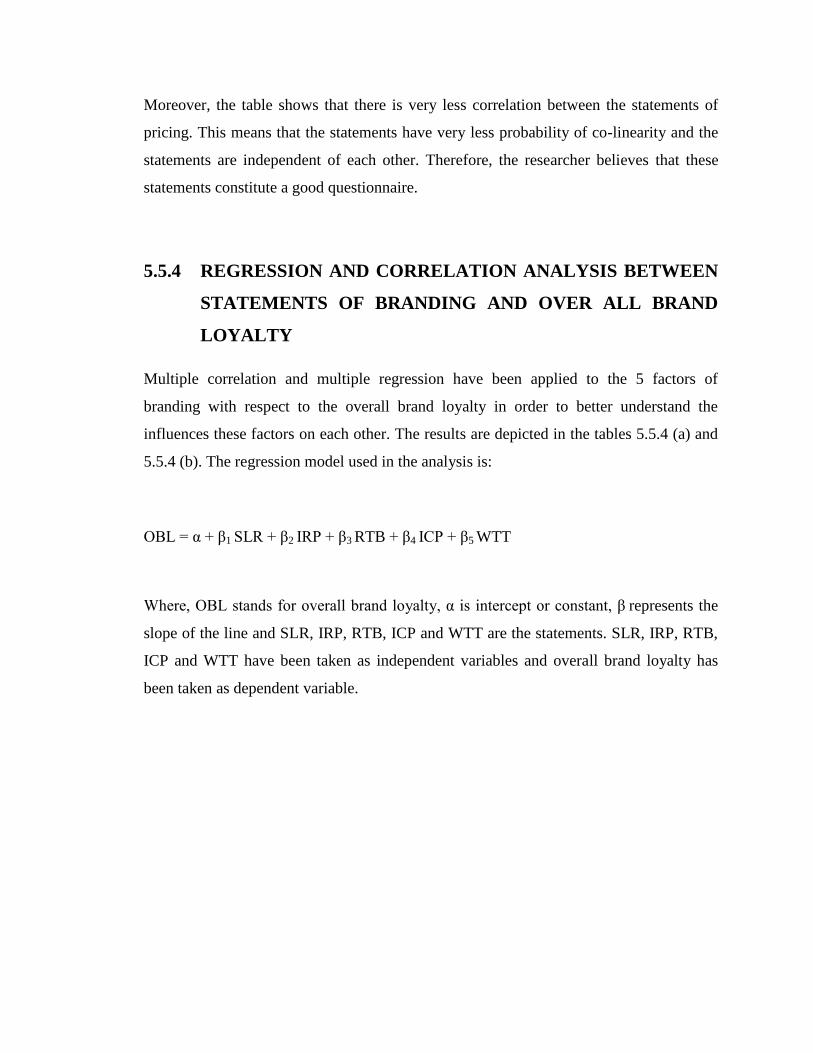
Moreover, the table shows that there is very less correlation between the statements of
pricing. This means that the statements have very less probability of co-linearity and the
statements are independent of each other. Therefore, the researcher believes that these
statements constitute a good questionnaire.
5.5.4 REGRESSION AND CORRELATION ANALYSIS BETWEEN
STATEMENTS OF BRANDING AND OVER ALL BRAND
LOYALTY
Multiple correlation and multiple regression have been applied to the 5 factors of
branding with respect to the overall brand loyalty in order to better understand the
influences these factors on each other. The results are depicted in the tables 5.5.4 (a) and
5.5.4 (b). The regression model used in the analysis is:
OBL = α + β1 SLR + β2 IRP + β3 RTB + β4 ICP + β5 WTT
Where, OBL stands for overall brand loyalty, α is intercept or constant, β represents the
slope of the line and SLR, IRP, RTB, ICP and WTT are the statements. SLR, IRP, RTB,
ICP and WTT have been taken as independent variables and overall brand loyalty has
been taken as dependent variable.
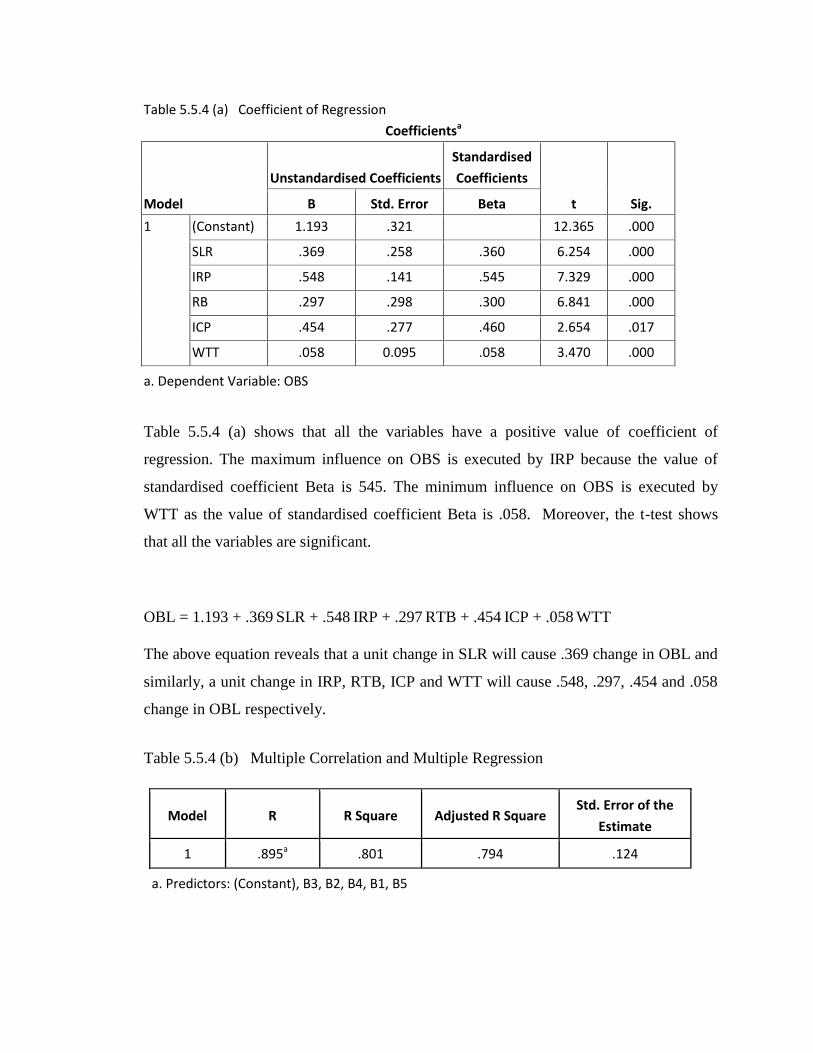
Table 5.5.4 (a) shows that all the variables have a positive value of coefficient of
regression. The maximum influence on OBS is executed by IRP because the value of
standardised coefficient Beta is 545. The minimum influence on OBS is executed by
WTT as the value of standardised coefficient Beta is .058. Moreover, the t-test shows
that all the variables are significant.
OBL = 1.193 + .369 SLR + .548 IRP + .297 RTB + .454 ICP + .058 WTT
The above equation reveals that a unit change in SLR will cause .369 change in OBL and
similarly, a unit change in IRP, RTB, ICP and WTT will cause .548, .297, .454 and .058
change in OBL respectively.
Table 5.5.4 (b) Multiple Correlation and Multiple Regression
Model R R Square Adjusted R Square Std. Error of the
Estimate
1 .895a .801 .794 .124
a. Predictors: (Constant), B3, B2, B4, B1, B5
Table 5.5.4 (a) Coefficient of Regression
Coefficientsa
Model
Unstandardised Coefficients
Standardised
Coefficients
t Sig. B Std. Error Beta
1 (Constant) 1.193 .321 12.365 .000
SLR .369 .258 .360 6.254 .000
IRP .548 .141 .545 7.329 .000
RB .297 .298 .300 6.841 .000
ICP .454 .277 .460 2.654 .017
WTT .058 0.095 .058 3.470 .000
a. Dependent Variable: OBS

Table 5.5.4 (b) reveals that the coefficient of multiple correlations between the overall
brand loyalty and the predictors is .895. This indicates that there is very high correlation
between the dependent and independent variables. Hence, change in independent
variables will bring considerable change in dependent variable. The value of coefficient
of multiple determination is .801. This means that change in independent variable
predicts 80.10% change in dependent variable. Therefore, the researcher believes that
independent variables bring considerable change in the dependent variable. The value of
standard error is less than 1.90. Hence, the researcher can conclude that the data is
reliable and has fewer deviations. As the value of R2
(0.801) is close to 1.0, the spread is
less, making the modal is a good fit.
5.6 EFFECT OF BRAND LOYALTY ON CUSTOMER
SATISFACTION
In this study, the researcher has tried to understand the relationship between the brand
loyalty and customer satisfaction. For this purpose, the researcher has subjected the data
to correlation and regression analysis. The SPSS software produced the following results.
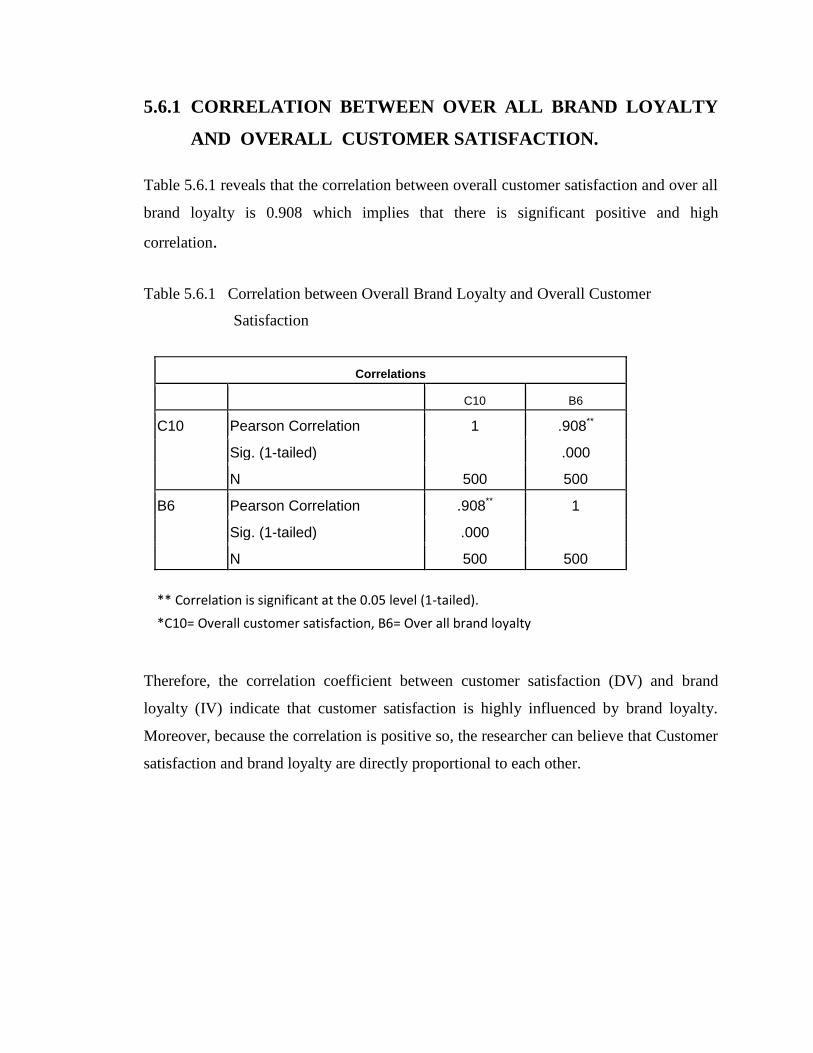
5.6.1 CORRELATION BETWEEN OVER ALL BRAND LOYALTY
AND OVERALL CUSTOMER SATISFACTION.
Table 5.6.1 reveals that the correlation between overall customer satisfaction and over all
brand loyalty is 0.908 which implies that there is significant positive and high
correlation.
Table 5.6.1 Correlation between Overall Brand Loyalty and Overall Customer
Satisfaction
Therefore, the correlation coefficient between customer satisfaction (DV) and brand
loyalty (IV) indicate that customer satisfaction is highly influenced by brand loyalty.
Moreover, because the correlation is positive so, the researcher can believe that Customer
satisfaction and brand loyalty are directly proportional to each other.
Correlations
C10 B6
C10 Pearson Correlation 1 .908**
Sig. (1-tailed) .000
N 500 500
B6 Pearson Correlation .908** 1
Sig. (1-tailed) .000
N 500 500
** Correlation is significant at the 0.05 level (1-tailed).
*C10= Overall customer satisfaction, B6= Over all brand loyalty

5.6.2 REGRESSION BETWEEN OVERALL BRAND LOYALTY
AND OVERALL CUSTOMER SATISFACTION.
The regression model used in the analysis is:
OCS = α + β1 OBL
OCS = 1.174 + .910 OBL, where OCS stands for overall customer satisfaction, α is
intercept or constant, β represents the slope of the line and OBL represents overall brand
loyalty. Here, overall brand loyalty has been taken as independent variables and overall
customer satisfaction has been taken as dependent variable.
Table 5.6.2 (a) Coefficient of Regression
From the table 5.6.2 (a), it is evident that when Brand loyalty is increased by one unit, the
customer satisfaction increases by 0.910 which is statically significant at t- value of
3.654.
Coefficientsa
Model
Unstandardised Coefficients
Standardised
Coefficients
t Sig. B Std. Error Beta
1 (Constant) 1.174 .314 8.324 .000
BL .910 .079 .910 3.654 .000
a. Dependent Variable: OCS
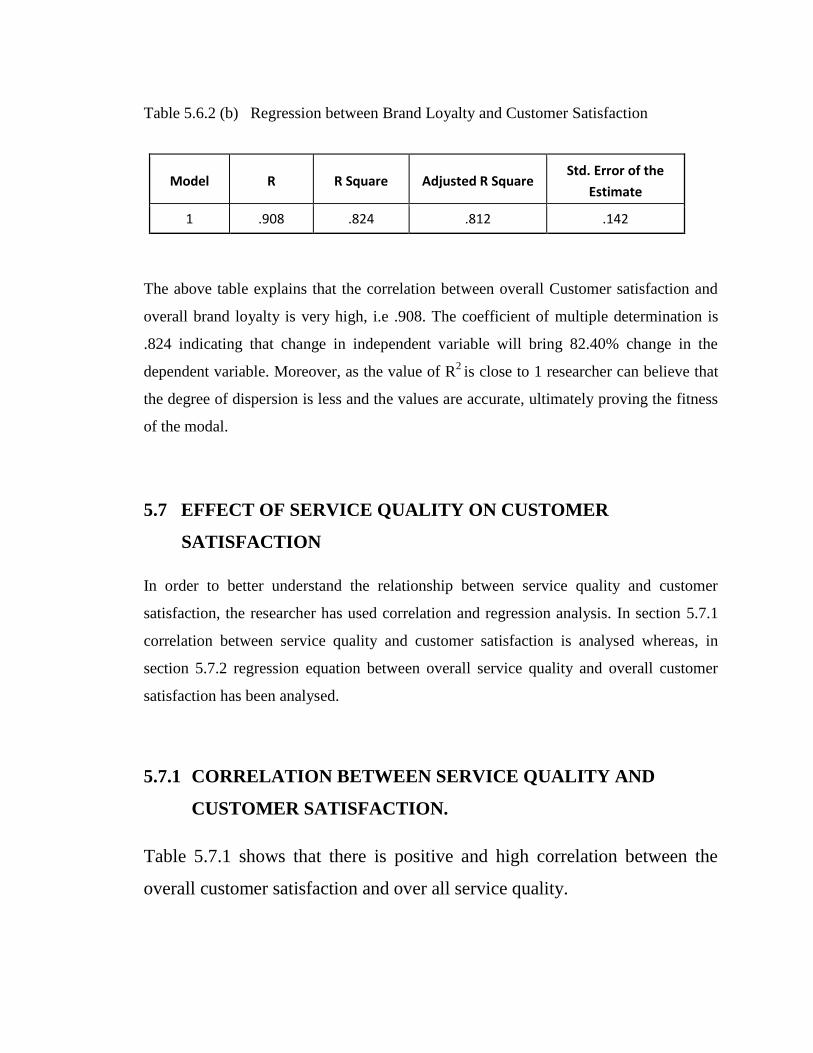
Table 5.6.2 (b) Regression between Brand Loyalty and Customer Satisfaction
The above table explains that the correlation between overall Customer satisfaction and
overall brand loyalty is very high, i.e .908. The coefficient of multiple determination is
.824 indicating that change in independent variable will bring 82.40% change in the
dependent variable. Moreover, as the value of R2 is close to 1 researcher can believe that
the degree of dispersion is less and the values are accurate, ultimately proving the fitness
of the modal.
5.7 EFFECT OF SERVICE QUALITY ON CUSTOMER
SATISFACTION
In order to better understand the relationship between service quality and customer
satisfaction, the researcher has used correlation and regression analysis. In section 5.7.1
correlation between service quality and customer satisfaction is analysed whereas, in
section 5.7.2 regression equation between overall service quality and overall customer
satisfaction has been analysed.
5.7.1 CORRELATION BETWEEN SERVICE QUALITY AND
CUSTOMER SATISFACTION.
Table 5.7.1 shows that there is positive and high correlation between the
overall customer satisfaction and over all service quality.
Model R R Square Adjusted R Square Std. Error of the
Estimate
1 .908 .824 .812 .142

Table 5.7.1 Correlation between Service Quality and Customer Satisfaction
This means that both are directly related to each other. Moreover, the researcher has used
one tailed significance because the hypotheses are directional. Because the values of
correlation is .912 and significance is less than 0.05, the researcher concludes that the
overall customer satisfaction and over all service quality are directly related to each other
and change in one variable will bring considerable change in the other variable.
5.7.2 REGRESSION EQUATION BETWEEN OVERALL SERVICE
QUALITY AND OVERALL CUSTOMER SATISFACTION.
The regression model used in the analysis is:
OCS = α + β1 OSQ
OCS = 1.287 + .914 OSQ, where OCS stands for overall customer satisfaction, α is
intercept or constant, β represents the slope of the line and OSQ represents overall service
quality. Here, overall service quality has been taken as independent variables and overall
customer satisfaction has been taken as dependent variable.
Correlations
C10 Q6
C10 Pearson Correlation 1 .912**
Sig. (1-tailed) .000
N 500 500
Q6 Pearson Correlation .912** 1
Sig. (1-tailed) .000
N 500 500
** Correlation is significant at the 0.05 level (1-tailed).
*C10= Overall customer satisfaction, Q6= Over all service quality
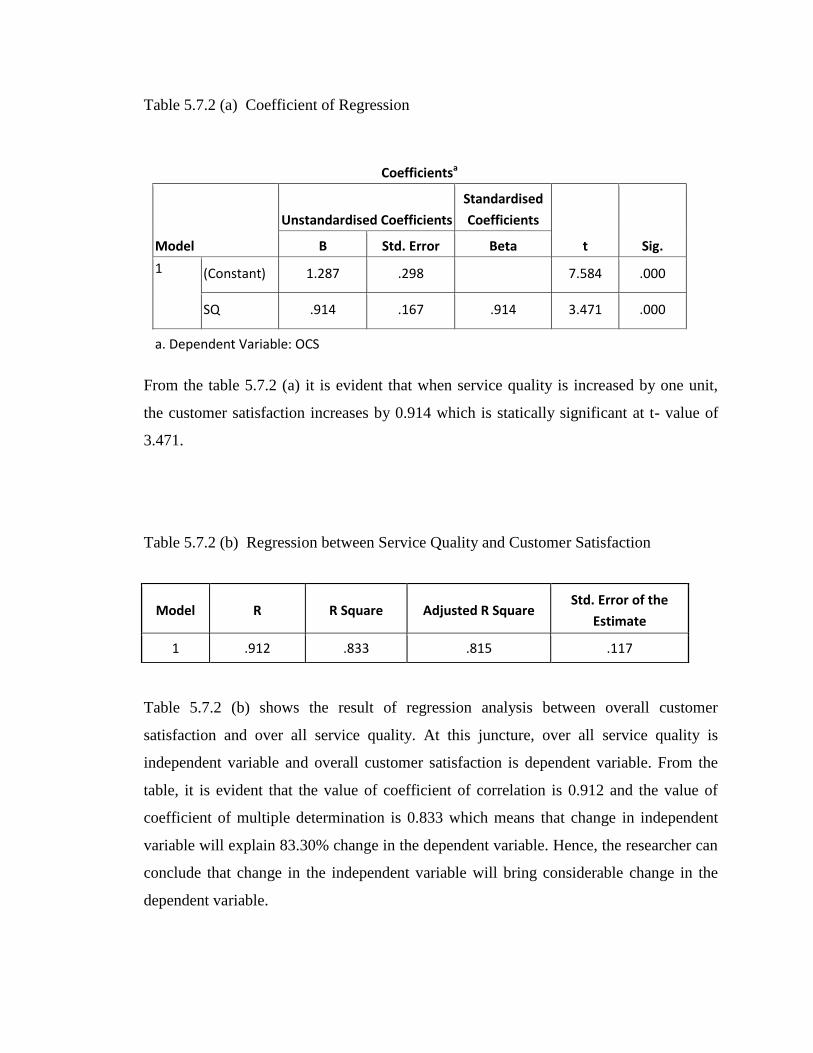
Table 5.7.2 (a) Coefficient of Regression
From the table 5.7.2 (a) it is evident that when service quality is increased by one unit,
the customer satisfaction increases by 0.914 which is statically significant at t- value of
3.471.
Table 5.7.2 (b) Regression between Service Quality and Customer Satisfaction
Table 5.7.2 (b) shows the result of regression analysis between overall customer
satisfaction and over all service quality. At this juncture, over all service quality is
independent variable and overall customer satisfaction is dependent variable. From the
table, it is evident that the value of coefficient of correlation is 0.912 and the value of
coefficient of multiple determination is 0.833 which means that change in independent
variable will explain 83.30% change in the dependent variable. Hence, the researcher can
conclude that change in the independent variable will bring considerable change in the
dependent variable.
Coefficientsa
Model
Unstandardised Coefficients
Standardised
Coefficients
t Sig. B Std. Error Beta
1 (Constant) 1.287 .298 7.584 .000
SQ .914 .167 .914 3.471 .000
a. Dependent Variable: OCS
Model R R Square Adjusted R Square Std. Error of the
Estimate
1 .912 .833 .815 .117
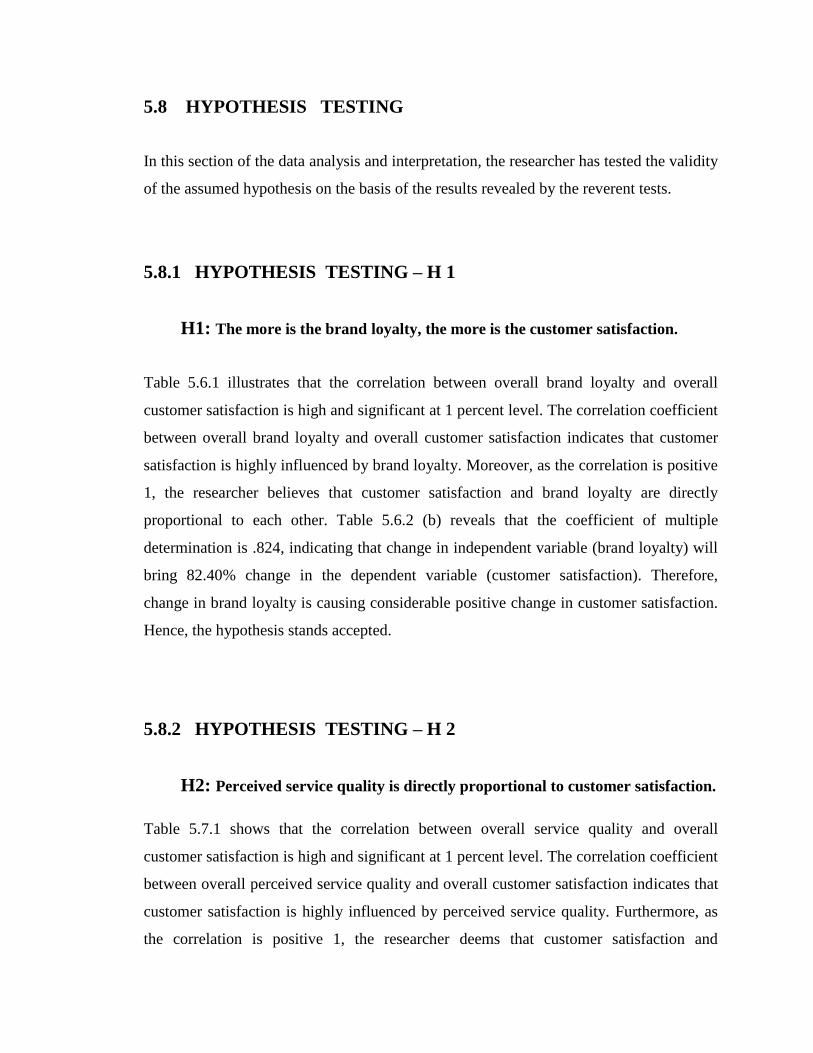
5.8 HYPOTHESIS TESTING
In this section of the data analysis and interpretation, the researcher has tested the validity
of the assumed hypothesis on the basis of the results revealed by the reverent tests.
5.8.1 HYPOTHESIS TESTING – H 1
H1: The more is the brand loyalty, the more is the customer satisfaction.
Table 5.6.1 illustrates that the correlation between overall brand loyalty and overall
customer satisfaction is high and significant at 1 percent level. The correlation coefficient
between overall brand loyalty and overall customer satisfaction indicates that customer
satisfaction is highly influenced by brand loyalty. Moreover, as the correlation is positive
1, the researcher believes that customer satisfaction and brand loyalty are directly
proportional to each other. Table 5.6.2 (b) reveals that the coefficient of multiple
determination is .824, indicating that change in independent variable (brand loyalty) will
bring 82.40% change in the dependent variable (customer satisfaction). Therefore,
change in brand loyalty is causing considerable positive change in customer satisfaction.
Hence, the hypothesis stands accepted.
5.8.2 HYPOTHESIS TESTING – H 2
H2: Perceived service quality is directly proportional to customer satisfaction.
Table 5.7.1 shows that the correlation between overall service quality and overall
customer satisfaction is high and significant at 1 percent level. The correlation coefficient
between overall perceived service quality and overall customer satisfaction indicates that
customer satisfaction is highly influenced by perceived service quality. Furthermore, as
the correlation is positive 1, the researcher deems that customer satisfaction and

perceived service quality are directly proportional to each other. Table 5.7.2 (b) reveals
the result of regression analysis between overall customer satisfaction and overall
perceived service quality. From the table, it is evident that the value of coefficient of
correlation is 0.912 and the value of coefficient of multiple determination is 0.833 which
means that change in independent variable (perceived service quality) will explain
83.30% change in the dependent variable (customer satisfaction). Therefore, change in
perceived service quality is causing considerable positive change in customer
satisfaction. Hence, the hypothesis stands accepted.

Chapter – VI
Findings and Suggestions
Chapter 6 Findings and Suggestions (151-162)
6.1 Findings of the Study 151
6.2 Suggestions 161

FINDINGS AND SUGGESTIONS
This chapter concludes the research work substantiated by the summary of the findings
associated with the study. Additionally, this chapter makes an attempt to insinuate a
range of suggestions in the milieu of the findings. The concept of consumer behaviour
has attracted huge attention both by academia and the industry especially in the service
industry due to its qualities associated with intangibility, perishability, variability and
inseparability from the fast food industry. Conventional education system and the
practice of consumer behaviour have been confronted by industry at many forums. This
has resulted in a gap between the academia and the industry, as a result of which, there is
an urgent need for further research work to bridge this widening gap and therefore,
approaches based on the consumer behaviour in fast food and beverage industry have
been acknowledged as a solution to the problem of archaic concepts and their diligence in
the vibrant modern era of developing global and technical business environment.
The fast food industry consumption pattern has gone through a series of paramount
transformations, as a result of which, the customers have become more conscious about
the options available in the market and their purchasing decision is inclined towards the
best possible option. Moreover, the belligerent competition has cornered the business
organisations working in the preview of fast food industry and left them with no other
option except to amend their ways of operations and embrace a new modal based on
quality vis –a vis competitive advantage. It has been realised that alterations are expected
in the pricing system, branding, quality regulations and the availability of the product in
conjugation with the dynamics of the market environment. Collective pricing,
personalised advertisements, total quality management (TQM), incorporation of
electronic communication systems, mobile restaurants, advertisements flying in air with
the help of gigantic helium balloons are a few of the jubilant strategies assimilated by the
business organisation operational in the fast food industry.
Moreover, in order to earn revenue and work effectively in close proximity with the
public outside the business organisation, it is imperative for the company to comprehend
the customers’ mind and their attributes. Consumer behaviour assists in this tedious task

and enables the business organisations to adapt strategies in conjugation with the major
individual determinants of consumer behaviour which in turn influences the way
consumers proceed through decision making process regarding products and services
offered by fast food restaurants. In India, there are numerous fast food vendors which
have evolved over many years to align themselves with the native demands and
requirements of the customers. These small, mobile and highly price competitive food
vendors confront big challenge for foreign fast food companies like McDonald, KFC,
Pizza Hut and Dominos which are new to the Indian food market and face numerous
legal and political resections. Therefore, to overcome these constraints and threats
understanding consumer behaviour in fast food and beverage industry is imperative.
Hence, the present study has been taken up to address these issues proficiently.
6.1 FINDINGS OF THE STUDY
The researcher has drawn certain logical conclusions on the basis of analysis and
interpretation of the data collected for the research. The summary of the major findings of
the study are conversed as under:
1) The respondents’ demographic profile reveals that 377 respondents are unmarried
and 123 respondents are married out of 500 respondents which represents 75.4
and 24.6 percent respectively. Bearing in mind the household income, it is
revealed that majority of the respondents belong to the group of Rs 31,000 to Rs
40,000 per month income bracket representing 23.4 percent, this is followed by
Rs 51,000 to Rs 60,000 per month making 23 percent, Rs 21,000 to Rs 30,000 per
month constituting 15.8 percent, Rs 41,000 to Rs 50,000 per month representing
15.4 percent, Rs 61,000 and above per month constituting 13.4 percent and in the
end from Rs 10,000 to Rs 20,000 per month representing 9 percent respectively.
Considering gender of the respondents, 175 are females and 325 are males
representing 35 and 65 percent of the total sample size respectively. Taking into
account the age group, it is found that mainstream of the respondents belong to
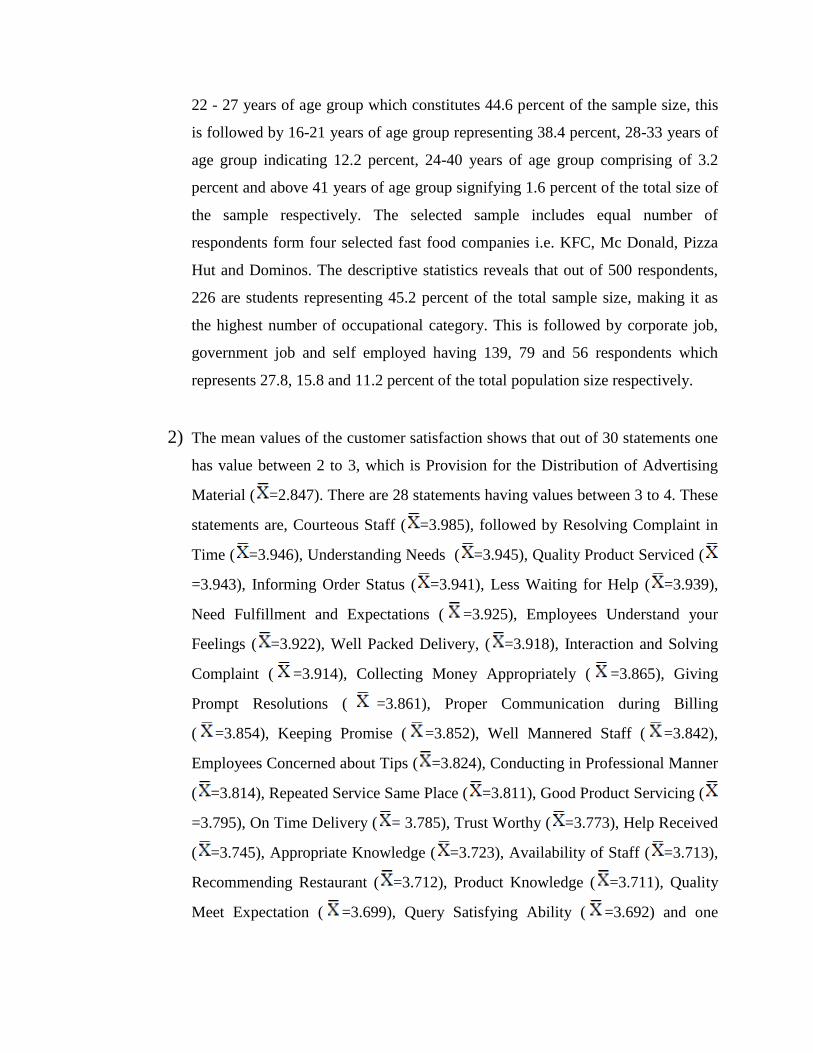
22 - 27 years of age group which constitutes 44.6 percent of the sample size, this
is followed by 16-21 years of age group representing 38.4 percent, 28-33 years of
age group indicating 12.2 percent, 24-40 years of age group comprising of 3.2
percent and above 41 years of age group signifying 1.6 percent of the total size of
the sample respectively. The selected sample includes equal number of
respondents form four selected fast food companies i.e. KFC, Mc Donald, Pizza
Hut and Dominos. The descriptive statistics reveals that out of 500 respondents,
226 are students representing 45.2 percent of the total sample size, making it as
the highest number of occupational category. This is followed by corporate job,
government job and self employed having 139, 79 and 56 respondents which
represents 27.8, 15.8 and 11.2 percent of the total population size respectively.
2) The mean values of the customer satisfaction shows that out of 30 statements one
has value between 2 to 3, which is Provision for the Distribution of Advertising
Material ( =2.847). There are 28 statements having values between 3 to 4. These
statements are, Courteous Staff ( =3.985), followed by Resolving Complaint in
Time ( =3.946), Understanding Needs ( =3.945), Quality Product Serviced (
=3.943), Informing Order Status ( =3.941), Less Waiting for Help ( =3.939),
Need Fulfillment and Expectations ( =3.925), Employees Understand your
Feelings ( =3.922), Well Packed Delivery, ( =3.918), Interaction and Solving
Complaint ( =3.914), Collecting Money Appropriately ( =3.865), Giving
Prompt Resolutions ( =3.861), Proper Communication during Billing
( =3.854), Keeping Promise ( =3.852), Well Mannered Staff ( =3.842),
Employees Concerned about Tips ( =3.824), Conducting in Professional Manner
( =3.814), Repeated Service Same Place ( =3.811), Good Product Servicing (
=3.795), On Time Delivery ( = 3.785), Trust Worthy ( =3.773), Help Received
( =3.745), Appropriate Knowledge ( =3.723), Availability of Staff ( =3.713),
Recommending Restaurant ( =3.712), Product Knowledge ( =3.711), Quality
Meet Expectation ( =3.699), Query Satisfying Ability ( =3.692) and one

statement has value between 4 to 5 which is Service in Appropriate Time
( =4.026) on 5 point scale.
3) Considering customer satisfaction among selected organisations, it was revealed
that the customers of KFC have rated Packed Product Delivery with the highest
satisfaction score of ( =4.214). However, they have rated Employees’ Concern
in Form of Tips the least value ( =2.297). The overall customer satisfaction was
( =3.947). The researcher discovered that the mean value of all other variables
was above mid value (d=3) and less than 5 on 5 point scale, conforming that KFC
is having satisfied customers. On the other hand, the customers of Mc Donald
have rated Service Time the highest value ( =4.593) and Informing the Order
Status the lowest value ( =3.071). Moreover, the overall customer satisfaction of
the customers of McDonald is ( =4.312) and all other variable’s mean value
was observed above mid value (d=3) and less than 5 on 5 point scale, implying
that customers are satisfied with Mc Donald. The customers of Pizza Hut rated
Timely Product Delivery the highest satisfaction score ( =4.671) and Employees
Concern about Tips the lowest satisfaction score ( =2.647). Additionally, by
excluding the statement number 8 and 6, the mean satisfaction value of rest of the
other statements was found above mid value (d=3) and less than 5 on 5 point
scale. The researcher came to the conclusion that the customers of Pizza Hut are
satisfied with it as the overall customer satisfaction score was found to be
( =4.037). The customers of Dominos have rated Quality Expectation of the
Product with the highest value of ( =4.597) and Providing Sales or
Advertisement Material with the lowest value of ( =3.023). Furthermore, the
overall customer satisfaction of the customers of Dominos was found to be (
=4.298) and the mean value of all other variables was observed above the mid
value (d=3) and less than 5 on 5 point scale, specifying that the customers of
Dominos are satisfied with it.

4) The results of comparison of customer satisfaction level of Pizza Hut, KFC, Mc
Donald and Dominos illustrates that Mc Donald stands at first position with
customer satisfaction score of ( =4.312) followed by Dominos
( =4.298), Pizza Hut ( =4.037) and finally KFC ( =3.947). Moreover, as the
value of standard deviation is less than 0.5, it indicates that the mean satisfaction
value has less dispersion, as a result of which the accuracy stratum of the mean
values are high. Furthermore, the ANOVA test reveals that the value of F is
164.381 and it is significant at 5 percent level. Moreover, as the value of F
statistic is more than 1 it implies that the calculated value of F is more than the
tabulated value of F. Therefore, the researcher assumes that there is significant
difference in the variances of the groups which is not caused by chance.
5) By taking into account the customer satisfaction on the basis of demographics, it
was found that the female respondents are less surveyed than the male
respondents and the mean satisfaction score of male respondents ( = 4.121) is
less than that of female respondents ( = 4.347). Additionally, as the value of
standard deviation of male and female is smaller than 0.5, the researcher assumes
that the mean satisfaction value has less spread and consequently is more
accurate. Moreover, as the t-value (t=1.981) is found to be significant at 5 percent
level, the reliability of mean satisfaction score is further enhanced by manifolds.
Considering the age group, the researcher found that the average age of the
respondents was 27 years and therefore the researcher has devised two groups i.e.
16 years to 27 years as group one and 28 years to 41 and above as group two. The
results demonstrate that the group one has higher number of respondents as
compared to group two. Furthermore, the customers bellowing to 28 years to 41
and above ( = 4.184) are less satisfied as compared to the customers bellowing
to16 years to 27 years of age group ( = 4.317). Additionally, the standard
deviation of group one and group two respondents are .318 and .274 respectively
and the t-value of 2.683 is significant at 1 percent level signifying high accuracy

of mean satisfaction score. As far as the marital status is concerned, the married
respondents are less as compared to the unmarried respondents and the mean
customer satisfaction value of unmarried customers ( = 4.473) is more than the
married customers ( =4.211). Therefore, the researcher concludes that the
married customers are less satisfied as compared to unmarried customers.
Moreover, the standard deviation of married and unmarried respondents are .385
and .210 respectively, because the standard deviation is less than 0.5 and the t-
value of 2.294 is significant at 5 percent level the researcher concludes that the
mean satisfaction value is reliable and accurate. The average household income of
the respondents was found to be Rs 40,000 per month. Thus, the researcher has
divided the respondents into two groups. The first group comprises of respondents
earning monthly house hold income between Rs 0 to Rs 40,000 and on the other
hand the second group consists of respondents having monthly house hold income
of Rs 41,000 and above. The study reveals that the customers bellowing to the
first group are less satisfied ( = 4.215) and are less in number as compared to the
customers bellowing to the second group ( =4.332). Moreover, as the standard
deviation of group one is .107 and group two is .302 which implies that the degree
of dispersion pertaining to the mean satisfaction value is less and the mean
satisfaction value is very accurate. Furthermore, the t-value of 3.451 is significant
at 1 percent level which speaks of the accuracy of the mean satisfaction value.
The study reveals that the employed respondents are more in number as compared
to the unemployed respondents and the mean customer satisfaction value of
employed customers ( = 4.321) is more than the unemployed customers
( =4.254). Hence, by taking into account the above mentioned conditions the
researcher concludes that the employed customers are more satisfied as compared
to the unemployed customers. Furthermore, the standard deviation of employed
and unemployed respondents are .2.05 and .197 respectively. As the standard
deviation is less than 0.5 and the t-value of 2.495 is significant at 5 percent level,
the mean satisfaction value is decidedly reliable and accurate.
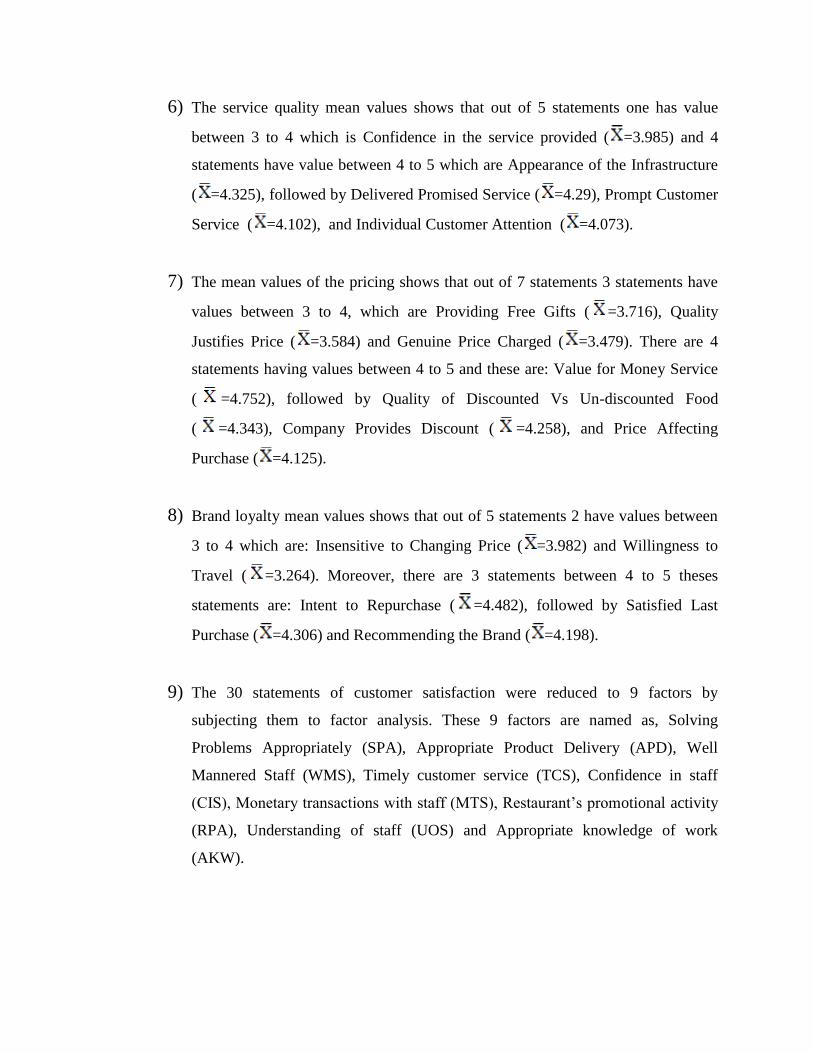
6) The service quality mean values shows that out of 5 statements one has value
between 3 to 4 which is Confidence in the service provided ( =3.985) and 4
statements have value between 4 to 5 which are Appearance of the Infrastructure
( =4.325), followed by Delivered Promised Service ( =4.29), Prompt Customer
Service ( =4.102), and Individual Customer Attention ( =4.073).
7) The mean values of the pricing shows that out of 7 statements 3 statements have
values between 3 to 4, which are Providing Free Gifts ( =3.716), Quality
Justifies Price ( =3.584) and Genuine Price Charged ( =3.479). There are 4
statements having values between 4 to 5 and these are: Value for Money Service
( =4.752), followed by Quality of Discounted Vs Un-discounted Food
( =4.343), Company Provides Discount ( =4.258), and Price Affecting
Purchase ( =4.125).
8) Brand loyalty mean values shows that out of 5 statements 2 have values between
3 to 4 which are: Insensitive to Changing Price ( =3.982) and Willingness to
Travel ( =3.264). Moreover, there are 3 statements between 4 to 5 theses
statements are: Intent to Repurchase ( =4.482), followed by Satisfied Last
Purchase ( =4.306) and Recommending the Brand ( =4.198).
9) The 30 statements of customer satisfaction were reduced to 9 factors by
subjecting them to factor analysis. These 9 factors are named as, Solving
Problems Appropriately (SPA), Appropriate Product Delivery (APD), Well
Mannered Staff (WMS), Timely customer service (TCS), Confidence in staff
(CIS), Monetary transactions with staff (MTS), Restaurant’s promotional activity
(RPA), Understanding of staff (UOS) and Appropriate knowledge of work
(AKW).
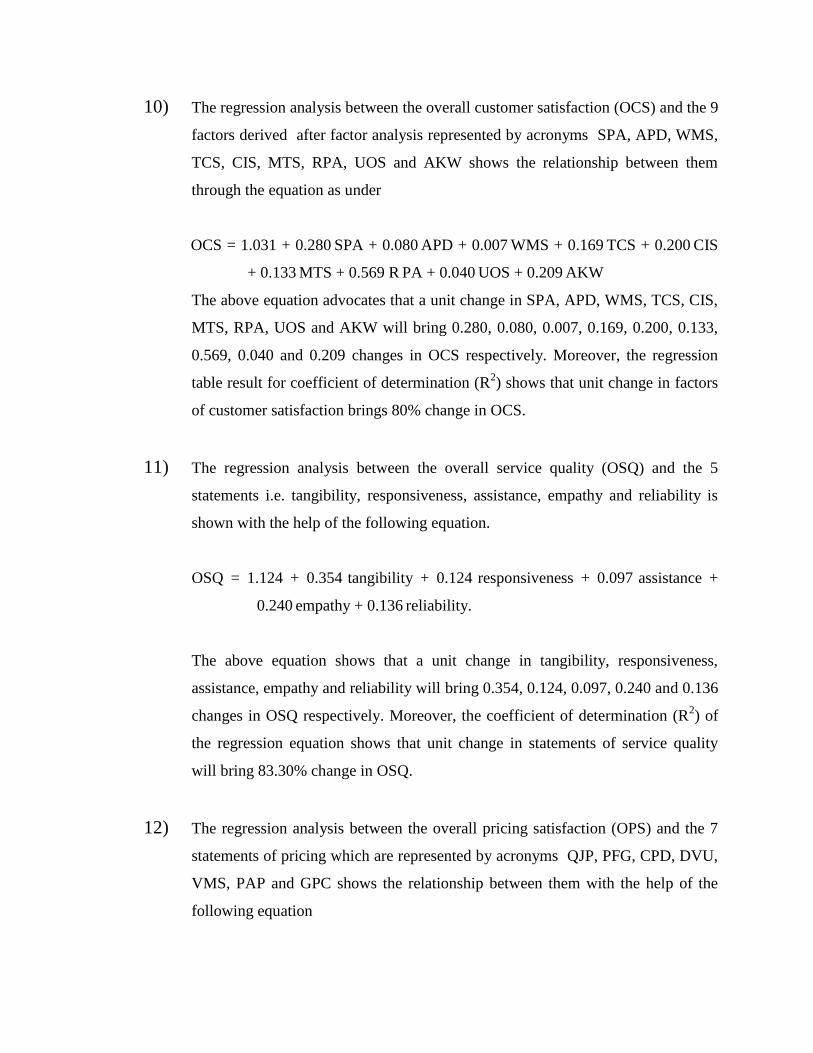
10) The regression analysis between the overall customer satisfaction (OCS) and the 9
factors derived after factor analysis represented by acronyms SPA, APD, WMS,
TCS, CIS, MTS, RPA, UOS and AKW shows the relationship between them
through the equation as under
OCS = 1.031 + 0.280 SPA + 0.080 APD + 0.007 WMS + 0.169 TCS + 0.200 CIS
+ 0.133 MTS + 0.569 R PA + 0.040 UOS + 0.209 AKW
The above equation advocates that a unit change in SPA, APD, WMS, TCS, CIS,
MTS, RPA, UOS and AKW will bring 0.280, 0.080, 0.007, 0.169, 0.200, 0.133,
0.569, 0.040 and 0.209 changes in OCS respectively. Moreover, the regression
table result for coefficient of determination (R2) shows that unit change in factors
of customer satisfaction brings 80% change in OCS.
11) The regression analysis between the overall service quality (OSQ) and the 5
statements i.e. tangibility, responsiveness, assistance, empathy and reliability is
shown with the help of the following equation.
OSQ = 1.124 + 0.354 tangibility + 0.124 responsiveness + 0.097 assistance +
0.240 empathy + 0.136 reliability.
The above equation shows that a unit change in tangibility, responsiveness,
assistance, empathy and reliability will bring 0.354, 0.124, 0.097, 0.240 and 0.136
changes in OSQ respectively. Moreover, the coefficient of determination (R2) of
the regression equation shows that unit change in statements of service quality
will bring 83.30% change in OSQ.
12) The regression analysis between the overall pricing satisfaction (OPS) and the 7
statements of pricing which are represented by acronyms QJP, PFG, CPD, DVU,
VMS, PAP and GPC shows the relationship between them with the help of the
following equation

OPS = 1.469 + 0.458 QJP + 0.136 PFG + 0.389 CPD + 0.074 DVU + 0.300 VMS+
0.147 PAP+ 0.151 GPC
From the above mentioned equation, it is evident that a unit change in QJP, PFG,
CPD, DVU, VMS, PAP and GPC will bring 0.458, 0.136, 0.389, 0.074, 0.300,
0.147 and 0.151 changes in OPS respectively. Furthermore, from the coefficient
of determination (R2) of the regression equation, it is evident that unit change in
statements of pricing will bring 89.60% change in OPS index.
13) The regression analysis between the 5 statements of the brand loyalty which are
represented by acronyms SLR, IRP, RTB, ICP and WTT, and the overall brand
loyalty (OBL) is shown with the help of the following equation.
OBL = 1.193 + 0.369 SLR + 0.548 IRP + 0.297 RTB + 0.454 ICP + 0.058 WTT
The above equation shows that a unit change in SLR, IRP, RTB, ICP and WTT
will eventually bring 0.369, 0.548, 0.297, 0.454 and 0.058 changes in OBL
respectively. Moreover, the coefficient of determination (R2) of the regression
equation shows that unit change in statements of brand loyalty will bring 80.10%
change in OBL.
14) The correlation between overall customer satisfaction and over all brand loyalty
implies that there is significant, positive and high correlation between them.
Hence, the correlation coefficient between customer satisfaction and brand loyalty
indicates that customer satisfaction is highly influenced by brand loyalty.
Furthermore, the researcher believes that customer satisfaction and brand loyalty
are directly proportional to each other as the correlation between them is positive.
Moreover, the regression analysis between overall customer satisfaction (OCS)
and over all brand loyalty (OBL) is shown with the help of equation which is as
under.
OCS = 1.174 + 0.910 OBL

The equation above shows that unit change in OBL, will bring 0.910 change in
OCS. Moreover, the coefficient of determination (R2) of the regression equation
shows that unit change in OBL will bring 82.40% change in OCS. Therefore,
change in brand loyalty is causing considerable positive change in customer
satisfaction. Hence, the hypothesis (H1- The more is the brand loyalty, the more is
the customer satisfaction) stands accepted.
15) In the study, the correlation between overall service quality and overall customer
satisfaction shows that there is significant, positive and high correlation between
them. Therefore, the correlation coefficient between customer satisfaction and
overall service quality indicates that customer satisfaction is highly influenced by
service quality. Moreover, as the correlation between them is positive, the
researcher believes that customer satisfaction and brand loyalty are directly
proportional to each other. Furthermore, the regression analysis between overall
customer satisfaction (OCS) and overall service quality (OSQ) is shown with the
help of equation which is as under.
OCS = 1.287 + 0.914 OSQ
From the above equation, it is evident that, unit change in OSQ will bring 0.914
change in OCS. Moreover, the coefficient of determination (R2) of the regression
equation shows that unit change in service quality will bring 83.30% change in
OCS. Hence, the researcher can conclude that change in perceived service quality
is causing considerable positive change in customer satisfaction. Hence, the
second hypothesis (H2- Perceived service quality is directly proportional to
customer satisfaction) stands accepted.
16) In order to understand the relationship between pricing and customer satisfaction,
the researcher has subjected over all pricing and overall customer satisfaction to
correlation and regression analysis. The result of the correlations between overall
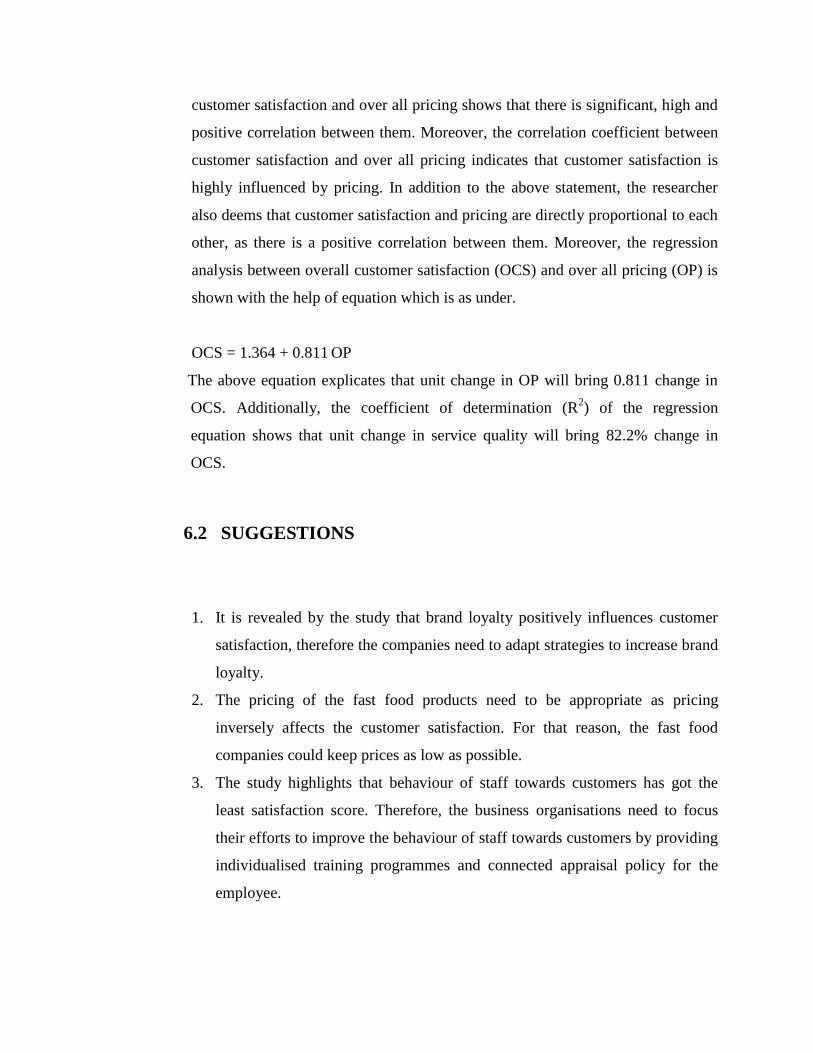
customer satisfaction and over all pricing shows that there is significant, high and
positive correlation between them. Moreover, the correlation coefficient between
customer satisfaction and over all pricing indicates that customer satisfaction is
highly influenced by pricing. In addition to the above statement, the researcher
also deems that customer satisfaction and pricing are directly proportional to each
other, as there is a positive correlation between them. Moreover, the regression
analysis between overall customer satisfaction (OCS) and over all pricing (OP) is
shown with the help of equation which is as under.
OCS = 1.364 + 0.811 OP
The above equation explicates that unit change in OP will bring 0.811 change in
OCS. Additionally, the coefficient of determination (R2) of the regression
equation shows that unit change in service quality will bring 82.2% change in
OCS.
6.2 SUGGESTIONS
1. It is revealed by the study that brand loyalty positively influences customer
satisfaction, therefore the companies need to adapt strategies to increase brand
loyalty.
2. The pricing of the fast food products need to be appropriate as pricing
inversely affects the customer satisfaction. For that reason, the fast food
companies could keep prices as low as possible.
3. The study highlights that behaviour of staff towards customers has got the
least satisfaction score. Therefore, the business organisations need to focus
their efforts to improve the behaviour of staff towards customers by providing
individualised training programmes and connected appraisal policy for the
employee.

4. The customer satisfaction is affected by the location and the ergonomics of the
restaurant outlet. Hence, the companies can open their outlets at the right
places and maintain good ergonomics.
5. Service quality directly affects the customer satisfaction. Hence, the
companies need to put in sincere efforts to increase and maintain high level of
service quality.
6. Findings reveal that customers of the age group between 22 - 27 years
constitute 44.6 percent of the overall customers. Therefore, the companies
need to focus more on this age group.
7. Students make 45.2 percent of the total customers and therefore the companies
need to concentrate more on the students oriented marketing strategies.
8. Having direct contract with the local farmers will reduce the delinquency
carried out by the middle men and also avail fresh raw material for the quick
service restaurants.
9. The fast food companies need to conduct regular audits and surveys in order
to enhance their abilities to deliver better services to their customers.
10. Companies in the fast food industry can reduce the service quality gap by the
induction of technology and tension reducing ergonomics.
11. As the study highlights that tasty but unhealthy food items confers more
financial gains to the business organisations as compared to less tasty but
healthy food items. The government need to ensure that the fast food
restaurants use healthy food items so that the health problems resulting from
unhealthy eating can be reduced to bear minimum.
12. The companies need to develop food items which are more tasty and healthy
for the customers.
13. The study reveals that individual attention got the least satisfaction score.
Therefore, the companies need to concentrate their efforts on providing more
individualised attention to the customers.

Bibliography

BOOKS
Aaker, D. A., (1991). Managing brand equity capitalizing on the value of a brand name.
New York: Free Press.
Aaker, D. A., (1996). Building strong brand. New York: Free Press.
Aaker, D. A., Kumar, V., & Day, G. S. (1995). Marketing research. New York: Wiley.
Attkisson, C.C. (1978). Evaluation of human service programs. New York: Academic
Press.
Awasthi, Jaggi Raman, Padmanand V, (2006) A Manual for Entrepreneurs for Food
Processing Industry, New Delhi, Tata McGraw-Hill.
Bateson, J.E.G. and Hoffman, K.D. (1999) Managing Services Marketing, Fort Worth,
TX: The Dryden Press.
Bauer, R., (1960), Consumer Behaviour as Risk Taking, In: Cox, Donald F., Risk Taking
and Information Handling in Consumer Behaviour, Boston: Harvard
University Press, pp.23-33.
Belch, G. E., & Belch, M. A. (2004). Advertising and Promotion: An Integrated
Marketing Communications Perspective, New York: NY: McGraw-
Hill.
Bender, A. E., & Bender, D. A. (1993). A dictionary of food and nutrition. Oxford:
Oxford University Press.
Berry, L. (1999) Discovering the Soul of Service, New York: The Free Press.
Blackwell, R.D., Miniard, P.W. and Engel, J.F. (2001) Consumer Behavior, Orlando,
FL: Harcourt.
Calhoun, C. (2002). The class consciousness of frequent travelers: Toward a critique of
actually existing cosmopolitanism.
Cunningham, S. M. (1967) The Major Dimensions of Perceived Risk, In: Cox, D. F.
Risk Taking and Information Handling in Consumer Behaviour,
Boston: Harvard: University Press, pp 82-111.
Doyle, P. (2002) Marketing Management and Strategy, Harlow: Pearson Education.
Engel, J.F., Blackwell, R.D., and Miniard, P.W. (1968) Consumer Behaviour, New
York: Holt, PP.79.
Engel, J.F., Blackwell, R.D., and Miniard, P.W. (1993) Consumer Behaviour Orlando:
The Dryden Press.
Engel, James F., Roger D., Blackwell and Paul W. Miniard (1993) Consumer
Behavior. Orlando, Fl: The Dryden Press.
Fishbein M. and Ajzen I. (1975). Belief Attitude, Intention and Behaviour. Princeton
press.
Ghauri, P. and Gronhaug, K. (2005) Research Methods in Business Studies: A
practical Guide, Pearson Education Limited.
Gupta .S.P (2002). Statistical methods. New Delhi: sultan and sons.
Hair, J.F. Jr, Anderson, R.E., Tatham, R.L., & Black, W.C. (1998). Multivariate
Data Analysis. Upper Saddle River, NJ: Prentice Hall.
Hawkins (1998). Application of the consumer behaviour, Tata McGraw-Hill: Educat, pp
1-9.
Hall, C. M., & Sharples, L. (2003). The consumption of experiences or the experiences
of consumption: An introduction to the tourism of taste, Food tourism
around the world, Development management and markets (pp 1–24).
Kapferer, J. N. (1994). Strategic brand management. New York: Free Press.
Keller, K.L., (2003). Strategic Brand Management: Building, Measuring and Managing
Brand Equity. New Jersey: Prentice Hall.
Kotler p. and Armstrong, G. (2004) principle of marketing, New Jersey: prentice hall.
Kotler, Wong, Saunder and Strong principle of marketing (2005), Handbook of
Modern Marketing, New York: McGraw-Hill.
Kotler Philip (2002). Marketing management, Prentice Hall.
Lisa Fortini Campbell (2001). Fostering collaboration, hitting the sweet spot: Copy
work shop, pp 145-168.
MacInnis Deborah J, Jaworski Bernard J (1989). Information processing from
advertisements: towards an integrative framework, 53, 1 – 23.

Mennell, S. (1985). All Manners of Food: Eating and Taste in England and France from
the Middle Ages. Oxford: Blackwell.
M.Omer Azabagaoglua, Oramana Yasemin (2011). Analysis of Customer
Expectations after the Recession: Case of Food Sector. International
Strategic Management Conference, 24, 229–236.
Molz, J. G. (2004). Tasting an Imagined Thailand: Authenticity and Culinary Tourism in
Thai Restaurants. Lexington: The University Press of Kentucky.
Murcott A. (1986). You Are What You Eat: John Wiley and Sons, Ltd.
Naik C.N.K, Reddy. L.V (1999). Consumer behaviour, Discovery publishing house:
New Delhi, pp 266-240.
Neal,W. D. (1999). Satisfaction is nice, but value drives loyalty. Marketing Research,
21–23.
Reichheld FF, (1993), Loyalty-Based Management, Harvard Business Review, March-
April, 64-73.
Saunders, M., Lewis, P., A., & Thornhill. (2003) Research Methods for Business
Student, England: Prentice Hall.
Schiffman (2010). Dynamics of motivation, consumer behaviour: Pearson education
India, pp109-131.
Schiffman Leon, Kanuk Leslie (2007). Consumer Behavior, Publisher: Prentice Hall
Shoultz, Donald (1989). Service Firms Are Customer Driven: Study. Amercan Banker,
17–18.
Spreng, Richard A. and Robert D. Mackoy (1995). An Empirical Examination of a
Model of Perceived Service Quality and Satisfaction in Marketing
Theory and Applications, 216-217.
Thomas Jones and Sasser .Jr, (1995). Why satisfied customers defect, Harvard business
review: Harvard Business Publishing.
Wanyne. D. Hoyer, Deborah. J. Maclnnis (2008). The process of decision manking,
cenngage learning, pp 193-298.

RESEARCH PAPERS
Ahmad Jamal, Peattie Sue and Peattie Ken (2012). Ethnic minority consumers'
responses to sales promotions in the packaged food market. Journal of
Retailing and Consumer Services, 19(1), 98-108.
Anderson, Eugene W. and Claes Fornell (2000). Foundations of the American
Customer Satisfaction Index, Total Quality Management, 11 (6), 869-
82.
Bell Robert A., Cassady Diana, Culp Jennifer and Alcalay Rina (2009), Frequency
and Types of Foods Advertised on Saturday Morning and Weekday
Afternoon on English and Spanish Language American Television
Programs. Journal of Nutrition Education and Behaviour, 41(6), 406-
413.
Bennett Dag (2004). The Taiwanese are Just like Australians in Their Loyalty to Fast
Food Outlets. Australasian Marketing Journal, 12 (3), 97-103.
Bitner, M.J. (1990). Evaluating service encounters: the effects of physical surroundings
and employee response. Journal of Marketing, 54 (2), 69-81.
Bloemer, J. M. M., Kasper, H. D. P., 1995. The complex relationship between
consumer satisfaction and brand loyalty. Journal of Economic
Psychology 16, 311-329.
Bolton, R. N., & Drew, J. H. (1991). A longitudinal analysis of the impact of service
changes on customer attitudes. Journal of Marketing, 55 (1), 1-9.
Brady Michael K., J Christopher. Robertson and Cronin J.Joseph (2001) Managing
behavioral intentions in diverse cultural environments: an investigation
of service quality, service value, and satisfaction for American and
Ecuadorian fast-food customers. Journal of International
Management, 7(2), 129-149.
Brewis, J, Jack, G (2005). Pushing speed: The marketing of fast and convenience food.
Journal of Consumption, Markets and Culture 8 (1), 49–67.
Burton Scot, Howlett Elizabeth, Tangari Heintz Andrea (2009). Food for Thought:
How Will the Nutrition Labeling of Quick Service Restaurant Menu Items
Influence Consumers’ Product Evaluations, Purchase Intentions, and
Choices. Journal of Retailing, 85 (3), 258-273.
Buddin, R. and R. W. Zimmer. (2005). A Closer Look at Charter School Student
Achievement. Journal of Policy Analysis and Management, 24(2), 351-
372.
Carmen Berné, José M Múgica, M Jesús Yagüe (2001). The effect of variety-seeking
on customer retention in services. Journal of Retailing and Consumer
Services, 8 (6), 335-345.
Chen Mei-Fang (2007). Consumer attitudes and purchase intentions in relation to
organic foods in Taiwan: Moderating effects of food related personality
traits. Food Quality and Preference, 18 (7), 1008-1021.
Cheol Park (2004). Efficient or enjoyable: Consumer values of eating-out and
fast food restaurant consumption in Korea. International Journal of
Hospitality Management, 23 (1), 87-94.
Cronin, J.J. and Taylor, S.A. (1992). Measuring Service Quality: A Reexamination and
Extension. Journal of Marketing, 56 (3), 55-68.
Cuma Akbay, Tiryaki Yildiz Gulgun, Gul Aykut (2007). Perceptions of Chinese
restaurants in the U.S.: What affects customer satisfaction and behavioral
intentions. International Journal of Hospitality Management, 28 (3), 338-
348.
Dohee Kim, Magnini P Vincent., Singal Manisha (2011). The effects of customers’
perceptions of brand personality in casual theme restaurants.
International Journal of Hospitality Management, 30 (2), 448-458.
Dunn I. Kirsten, Philip Mohr, Wilson J. Carlene, Wittert A. Gary (2011).
Determinants of fast food consumption: An application of the Theory
of Planned Behaviour. Appetite, 57 (2), 349-357.
Ebster Claus, Wagner Udo and Sabine Valis (2006). The effectiveness of verbal
prompts on sales, Journal of Retailing and Consumer Services, 13(3),
169-176.
Emma J. Boyland, Jason C.G. Halford (2011). Television advertising and branding:
Effects on eating behaviour and food preferences in children. Appetite.
56, 440-446.
Farhana Nadia and Islam Shohana (2011). Exploring Consumer Behavior in the
Context of Fast Food Industry in Dhaka City. World Journal of Social
Sciences 1(1), 107-124.
Fischer Eileen, Gainer Brenda and Bristor Julia (1997). The gender of the service
providers: Does it influence perceptions of service quality. Journal of
Retailing, 73(3), 361-382.
Gan, L., Vernon, V., (2003). Testing the Barten model of economies of scale in
household consumption: toward resolving a paradox of Deaton Paxson.
Journal of Political Economy 111, 1361–1377.
Glanz Karen, Hewitt M. Anne, Rudd Joel (1992). Consumer behaviour and nutrition
education: An integrative review. Journal of Nutrition Education, 24 (5),
267-277.
Goyal Anita, Singh N.P (2007). Consumer perception about fast food in India: an
exploratory study. British Food Journal, 109 (2), 182 – 195.

Groth Markus, Gilliland W Stephen (2001). The role of procedural justice in the
delivery of services: A study of customers' reactions to waiting. Journal
of Quality Management, 6 (1), 77-97.
Hall, C. M., & Mitchell, R. D. (2000). We are what we eat: Tourism, culture and the
globalisation and localisation of cuisine. Journal of Tourism Culture and
Communication, 2(1), 29–37.
Hawkes, C. (2009). Sales promotions and food consumption. Nutrition Reviews, 67(6),
333–342.
Herrmann, A., Xia, L., Monroe, K.B., and Huber. F., (2007). The Influence of Price
Fairness on Consumer Satisfaction: An Empirical Test in the Context of
Automobile Purchases. Journal of Product & Brand Management, 16
(1), 49-58.
Holbrook and Hirschman (1982). The Experiential Aspects of Consumption: Consumer
Fantasies, Feelings, and Fun. Journal of Consumer Research, 9, 132-
140.
Hong Qin, Prybutok R. Victor (2009). Service quality, customer satisfaction, and
behavioral intentions in fast-food restaurants. International Journal of
Quality and Service Sciences, 1(1), 78 – 95.
Inglis, D. and D. Gimlin. (2009). Food Globalizations: Ironies and ambivalences of food
cuisine and globality. In The Globalization of Food, 3-42.
Jang-Hyeon Nam and Timothy Jeonglyeol Lee (2011). Foreign travelers
, satisfaction with traditional Korean restaurants. International Journal
of Hospitality Management, 30 (4), 982-989.
Jennifer Culp, Bell. A. Robert and Cassady Diana (2010). Characteristics of Food
Industry Web Sites and Advertisement Games Targeting Children.
Journal of Nutrition Education and Behavior, 42(3), 197-201.
Jones, H. and Farquhar, J. D., (2003). Contact Management and Customer Loyalty.
Journal of Financial Services Marketing, 8 (1), 71-78.

Jones, M.A. & J. Suh (2000). Transaction-Specific Satisfaction and Overall Satisfaction:
An Empirical Analysis. The Journal of Services Marketing, 14 (2), 147-
159.
Joon-Wuk Kwun David (2011). Effects of campus foodservice attributes on perceived
value, satisfaction, and consumer attitude: A gender-difference approach.
International Journal of Hospitality Management, 30 (2), 252-261.
Jooyeon Ha, SooCheong (Shawn) Jang (2010). Effects of service quality
and food quality: The moderating role of atmospherics in an ethnic
restaurant segment. International Journal of Hospitality Management, 29
(3), 520-529.
Kennedy McColl-, J., & Schneider, U. (2000). Measuring customer satisfaction: why,
what and how. Total Quality Management, 11 (7), 1-14.
Kenneth L. Bernhardt, Donthu Naveen, Kennett A. Pamela (2000). A Longitudinal
Analysis of Satisfaction and Profitability. Journal of Business Research,
47, 161–171.
Kim Wansoo, Chihyung Ok, Deborah D. Canter (2010). Contingency variables
for customer share of visits to full-service restaurant. International
Journal of Hospitality Management, 29 (1), 136-147.
Kisang Ryu, Heesup Han, Tae-Hee Kim (2008). The relationships among overall
quick-casual restaurant image, perceived value, customer satisfaction,
and behavioural intentions. International Journal of Hospitality
Management, 27 (3), 459-469.
Kivela, J., & Crotts, J. C. (2006). Tourism and gastronomy: Gastronomy’s influence on
how tourists experience a destination. Journal of Hospitality and Tourism
Research, 30(3), 354–377.

Klinger, E., Barta, S.G. & Maxeiner, M.E. (1980). Motivational correlates of thought
content freguency and commitment. Journal of Personality and Social
Psychology, 39 (6), 1222-1237.
Krishnan, H.S. (1996). Characteristics of memory associations: a consumer based brand
equity perspective. International Journal of Research in Marketing, 13
(4), 389-405.
Kristin L. Morse, Judy A. Driskell (2009). Observed sex differences in fast
food consumption and nutrition self assessments and beliefs of college
students. Nutrition Research, 29 (3), 173-179.
Kynda R. curtis, Jill J. Mccluskey, Thomas I. Wahl (2007). Consumer preferences for
western-style convenience foods in China, China Economic Review, 18
(1), 1-14.
Lee Soojin, Kim Woo Gon and Kim Hyun Jeong (2006). The impact of co-branding on
post-purchase behaviors in family restaurants. International Journal of
Hospitality Management, 25(2), 245-261.
Lefa Teng (2009). A comparison of two types of price discounts in shifting consumers'
attitudes and purchase intentions. Journal of Business Research, 62 (1),
14-21.
Lockie Stewart, Kristen Lyons, Geoffrey Lawrence, Janet Grice (2004) Choosing
organics: a path analysis of factors underlying the selection of
organic food among Australian consumers. Appetite, 43(2), 135-146.
Lyndal Wellard, Colleen Glasson, Chapman Kathy (2012). Fries or a fruit bag.
Investigating the nutritional composition of fast food children’s meals.
Appetite, 58(1), 105-110.
Parasuraman, A., Zeithaml, V.A. and Berry, L.L. (1985), A conceptual model of
service quality and its implication, Journal of Marketing, 49, 41-50.
Paravantis John, Bouranta Nancy and Chitiris Leonidas (2009). The relationship
between internal and external service quality, Contemporary Hospitality
Management, 21(3), 275-293.
Paula Lazzarin Uggioni, Elisabete Salay (2012). Reliability and validity of a scale to
measure consumer attitudes regarding the private food safety certification
of restaurants. Appetite, 58 (2), 470-477.
R.D Mueller, A Palmer, R Mack, R McMullan (2003). Service in the
restaurant industry: an American and Irish comparison of service failures
and recovery strategies. International Journal of Hospitality Management,
22 (4), 395-418.
Riadh Ladhari, Isabelle Brun, Miguel Morales (2008). Determinants of
dining satisfaction and post-dining behavioral intentions. International
Journal of Hospitality Management, 2 (4), 563-573.
Roth, M. and Romeo, J.B. (1992). Matching product category and country image
perceptions: a framework for managing country-of-origin effects. Journal
of International Business Studies, 23 (3), 477-98.
Seung-Hee Baek, Sunny Ham, Il-Sun Yang (2006). A cross-cultural comparison of fast
food restaurant selection criteria between Korean and Filipino college
students. International Journal of Hospitality Management, 25 (4), 683-
698.
Sunghyup Sean Hyun, Wansoo Kim, Myong Jae Lee (2011). The impact of
advertising on patrons’ emotional responses, perceived value, and
behavioral intentions in the chain restaurant industry: The moderating role
of advertising-induced arousal. International Journal of Hospitality
Management, 30 (3), 689-700.
Ungku Zainal (2011). Food service hygiene factors: The consumer perspective.
International Journal of Hospitality Management, 30 (1), 38-45.
Upadhaya Ram, (2004). Glocom modification: How the global consumes the local
McDonald’s in Israel. Current Sociology, 52(1), 11–31.
Verbeke Wim (2005). Consumer acceptance of functional foods: socio-demographic,
cognitive and attitudinal determinants. Food Quality and Preference 16,
45–57.
Victor P. Lau, Thamis Wing-chun Lo, Zhenquan Sha, He Yun (2007). Service quality
in restaurant operations in China: Decision and experiential-oriented
perspectives. International Journal of Hospitality Management, 26 (3),
698-710.
Vincent C.S. Heung, Tianming Gu (2012). Influence of restaurant atmospherics on
patron satisfaction and behavioral intentions. International Journal of
Hospitality Management, 22 (2), 126-137.
Voon Boo Ho (2012). Role of Service Environment for Restaurants: The Youth
Customers’ Perspective. Procedia - Social and Behavioural Sciences, 38,
388-395.
Wen-Bao Lin (2007). The exploration of customer satisfaction model from a
comprehensive perspective. Expert Systems with Applications, 33 (1),
110–121.
Wesslen, A, Sepp, H & Fjellstrom, C (2002). Swedish Preschool Children’s Experience
of Food. International Journal of Consumer Studies, 26 (4), 264-272.
Westbrook, Robert A. (1980). Intrapersonal Affective Influences on Consumer
Satisfaction with Products. Journal of Consumer Research. 7, 49-54.
Woo Gon Kim, Christy Yen Nee Ng, Yen-soon Kim (2009). Influence of institutional
DINESERV on customer satisfaction, return intention, and word-of-mouth.
International Journal of Hospitality Management, 28 (1), 10–17.
Xia, L., Monroe, K. , & Cox, J.. (2004). The Price Is Unfair: A Conceptual Framework
of Price Fairness Perceptions. Journal of Marketing, 68 (4), 1-15.
Ying Hua, Liu and Soo Cheong, Jang (2009). perception of Chinese restaurants in
USA. International Journal of Hospitality and Management, (28), 338-348.
Ying-Feng Kuo, Chi-Ming Wu, Wei-Jaw Deng (2009). The relationships among
service quality, perceived value, customer satisfaction and post-purchase
intention in mobile value-added services. Computers in Human Behaviour,
25, 887–896.
Yoon Jung Jang, Woo Gon Kim, Mark A. Bonn (2011). Generation Y consumers’
selection attributes and behavioral intentions concerning green restaurants.
International Journal of Hospitality Management, 30 (4), 803-811.
Young Hoon Kim, MinCheol Kim, Ben K. Goh (2011). An examination
of food tourists’ behavior: Using the modified theory of reasoned action.
Tourism Management, 32 (5), 1159-1165.
Young Namkung, SooCheong (Shawn) Jang, Soo Keun Choi (2011).
Customer complaints in restaurants: Do they differ by service stages and
loyalty levels. International Journal of Hospitality Management, 30 (3),
495-502.
Yu ksel, Atila and Mike Rimmington, (1998). Customer satisfaction measurement,
Cornell hotel and restaurant administration quarterly. International journal
of hospitality management, 39 (6), 60-70.
THESIS
Creel. S. Jennifer (2006). The availability of healthy food options in fast food outlets in
six rural countries, Texas University, USA.
Hirekenchanagoudar. Renuka (2008). Consumer behaviour towards ready to eat food
products. University of agriculture business management Dharwada,
India.

Hitchins. K. Richards (1993). Changing patterns of taste and preferences for food in
Great Britain, University of New Castel.
Mamalis, Spyridom (2004) Consumer attitude towards fast food restaurants in Greece:
an investigation of the image, satisfaction, and loyalty. New Castel
University.
Mai. Li. Nei. Donna (1997). Direct marketing: An analysis of consumer characteristics
and their perception of attitudes to mail-order specialty food in the
UK, University of New Castel.
Tamboli. Sajid. M (2008). Buying behaviour of Danish female students, Aarhus School
of business, University of Aarhud, Denmark.
WEBSITES
ACSI (2012). American Customer Satisfaction Index, retrieved from http://.
www.ASCI.com
Admin(2011). Dominos pizza prices: Pizza Menus with Prices, Pizza Price List,
Retrieved from, http://www.dominos.co.in/blog/dominos-pizza-prices
American essay (2011). Mc Donalds’s marketing Mix, Retrieved from http://www
.americanessays.com/study-aids/free-essays/ marketing/mcdonalds.php
Amy (2009). Product strategy, Retrieved from http://productstrategy-
amy.blogspot.in/
Anna-Louise Jackson and Anthony Feld (2011). Domino’s ‘Brutally Honest’ Ads
Attract Sales as Consumer Spending Falters. Retrieved from,
http://www.bloomberg.com/news/2011-10-17/domino-s-brutally-honest-
ads- offset-slowing-consumer-spending.html

Arminv (2006). Masters in branding. Retrieved from, http://www.
/underconsideration.com/brandnew/archives/the_colonels_brand_new_clo
thes.php
Baker Rosie (2010). McDonald's names top UK marketer, Retrieved from
http://www.marketingweek.co.uk/mcdonalds-names-top-uk
marketer/3018443.article
Baker Rosie (2012). McDonald's promotes taste of the world menu, Retrieved from
http://www.marketingweek.co.uk/news/mcdonalds-promotes-taste-of
the-world-menu/4004409.article
Bhattacharyya Anushree (2012). Domino's Pizza to go bullish on digital.
Retrievedfrom, http://www.afaqs.com/news/story/32784_Dominos
Pizza-to- go-bullish-on -digital
Brandau Mark (2010). Pizza Hut ads shift from value to branding, Retrieved from,
http://nrn.com/article/pizza-hut-ads-shift-value-branding
Burger Business (2010), McDonald’s Menu Strategy? Simplicity, Quality Sell,
Retrieved from http://www.burgerbusiness.com/?p=5886
Chitika (2009). Pizza Hut's Marketing Strategies, Retrieved from http://ivythesis
.typepad.com/term_paper_topics/2009/12/pizza-huts-marketing-
strategies.html
Chaudhari. G. Rajendra (2012), Indian fast food industry Retrieved from.,
http://www.scribd.com/doc/101852209/indian-fast-food-industry
Coolster Pranay (2009), Pizza Hut Promotional Strategies, Retrieved from
http://www.studymode.com/essays/Pizza-Hut-Promotional-Strategies-
242410.html
Dale Buss (2012). Domino’s Rolls Out Digital Thanks in US, New Logo Beyond US.
Retrieved from, http://www.brandchannel.com/home. /post/2012/08/06/
/Domino / s-Logo-Digital-080612.aspx
D’Altorio Tony (2010). Investment U Research Tuesday, Retrieved from
http://www.investmentu.com/2010/December/mcdonalds-growth-
continues.html
De Billartiss, Shrader (2004). THE pizza hut marketing plan, Retrieved from
http://dreambugdesigns.com/pizzaHut.pdf
Dhavale. P (2012). McDonalds marketing strategies. Retrieved from, http://www .
.slideshare.net/pridhavale/mcdonalds-marketing-strategies.
Domino's IP Holder LLC (2008). Domino's investor relations. Retrieved from,
http://phx.corporate-ir.net/phoenix.zhtml?c=135383&p=irol-irhome
Domino's IP Holder LLC (2008). Our heritage. Retrieved from, http: //www.
dominosbiz .com/Public EN/Site+Content/Secondary/Inside+. Dominos
/ Our+Heritage/
Dominos News (2010). Domino’s pizza scoops silver at BFA franchise awards.
Retrieved from, http://www.dominos.uk.com/media_centre/pdf/261
Ebert. Jesse’s Blog (2012). Sugary Drinks: Jon Stewart vs. Michael Bloomberg,
Retrieved from http://aftertheperiod.wordpress.com/tag/mcdonalds
Ecuatoriall (2012). McDonald’s Pricing Strategy, Retrieved from http://
ecuatoriall.com/mcdonalds-pricing-strategy/
Elogiboyau (2009). KFC chicken in france. Retrieved from, http://elogiboyau.
/centerblog.net/
Food edotrials (2006). Pizza hut success story, Retrieved from http://www.
streetdirectory.com/food_editorials/snacks/pizza/pizza_hut_is_an_amer
ican_success_story.html
Franchise direct (2012). Top 100 Global Franchises Rankings. Retrieved from,
http://www.franchisedirect.com/top100globalfranchises/rankings/
Ganesan Sathish (2012). Flavors of Incredible India opportunity in the food industry,
Retrieved from http://www.scribd.com/doc/97186556. /Flavors-of-
Incredible-India-09
Geoff Riley (2010). Dominos Pizza - Growth & Strategy- Smart Marketing. Retrieved
from http://www.tutor2u.net/blog/index.php/business-
studies/comments/dominos-pizza-growth-strategy-part-3-smart-
marketing
Haymarket Business Media (1998). UK: Service Excellence Awards - Winner
Consumer Services Category - Pizza Hut (UK), Retrieved from.
http://www.managementtoday.co.uk/news/411451/UK-Service-
Excellence-Awards---Winner-Consumer-Services-Category---Pizza-
HutUK/?DCMP=ILC-SEARCH
Hearst Communications, Inc (2012). Advertisement strategy, Retrieved from
http://smallbusiness.chron.com/product-development-strategy-
mcdonalds-12207.html
Helperdogg (2011). Branding spot light: dominos pizza. Retrieved from,
http://blog.yellowdoggdesigns.com/branding-profile-dominos-pizza/
IBIS world (2012). Global Fast Food Restaurants: Market Research Report, retrieved
form, http://www.ibisworld.com/industry/global/global-fast-food-
restaurants.html
Ishaq (2010). Report on Pizza Hut, Retrieved from http://www.studymode..
com/essays/Report-On-Pizza-Hut-327020.html
Jubilant Food Works (2012). Dominos pizza time line. Retrieved from
http://www.dominos.co.in/milestones

Kaasik, Andre (2008). McDonald's history, Retrieved fromhttp://www.slide
share.net/merikekk/mcdonalds-264401
Karenvnunen (2008). KFC History. Retrieved from, http://www.studymode.com
/essays/Kfc-History-139611.html
Keith (2001). Kentucky Fried Chicken. Retrieved from, http://kelley_keith.
tripod.com/mgmnt5313.html
KFC Holdings (2011). Quality of KFC products. Retrieved from,
http://www.kfc.com.my/about-quality.php
Kochi (2011) Survey finds a rising palate for the instant variety, Retrieved from.
http://www.thehindu.com/todays-paper/tp-
international/article1123097.ece
Krunal Mansi (2010). Pizza Hut Marketing Strategy, Retrieved from http://www.s.
tudymode.com/essays/Pizza-Hut-Marketing-Strategy-374272.html
Lauren Johnson (2012). McDonald's beefs up advertising strategy with mobile game,
Retrieved from http://www.mobilemarketer.com/cms/.
news/advertising/12447.html
Lavan (2011). Pizza Hut: An overview of Promotion Strategies for Marketing Strategy
of Pizza Hut, Retrieved from http://www.scribd.com/
doc/53436740/9/Pizza-Hut-An-overview-of%E2%80%9 Promotion. C
-Strategies%E2%80%9D
Mathur Sameer (2010). SWOT, Market Product Strategies, Retrieved from
http,://www.slideshare.net/ProfessorMathur/swot-market-product-
strategies-mcdonalds-subway
Munoth Puneeth (2010). Pizza Hut Marketing Strategies, Retrieved from
http://www.scribd.com/doc/32693206/27107311-Pizza-Hut-
Marketing-Strategies

Nanjundaiya Ramesh (2011). Coming out swinging. Retrieved from, http:// www.
Economist.com/users
Nikhilstar (2008). McDonalds Product Mix, Retrieved from http://www. study
.mode.com/essays/Mcdonalds-Product-Mix-188253.html
Odell Patricia (2012). KFC Shares its Social Media Strategy. Retrieved from,
http://chiefmarketer.com/social-marketing/kfc-shares-its-social-media-
strategy-qa
Paul Praveen (2012). KFC brand strategy pyramid. Retrieved from,
http://www.slideshare.net/paulachan/kfc-brand-strategy-pyramid
Pizza Hut UK Ltd (2012). Our history, Retrieved from http://www.pizzahut.co.uk
/restaurants/our-history.aspx
Pjanto (2011). Pizza hut Brand Standards Manual Final, Retrieved from
http://www.scribd.com/doc/47339523/PIZZA-HUT-Brand-Standards-
Manual-Final
QSR News (2011). Top growing markets for restaurants, Retrieved form,
http://www.QSR.com
Quvol.com (2010).Final pizza hut, Retrieved from http://www.slideshare .net.
/quvol/final-pizza-hut-2010
Recipe Pizza (2010). The History of Dominos Pizza, Retrieved from
http://www.recipepizza.com/the_history_of_dominos_pizza.html
Reggieagarcia (2011). Analysing pricing strategy-Dominos Pizza, Retrieved from
http://www.studymode.com/essays/Analyzing-A-Pricing-Strategy-
Dominos. -Pizza-709722 html.
Reuters (2012). Domino's Pizza Enterprises Ltd (DMP.AX). Retrieved from
,http://www.reuters.com/finance/stocks/companyOfficers?symbol=DM
P.AX

Rocky (2008). McDonald's 4P's of marketing, Retrieved from http://www.
.scribd.com/doc/6464143/McDonalds-4Ps-Of-marketing
Romualdez Veronica (2012). The history of KFC in China. Retrieved from, http:
//www.ehow.com/about_5476140_history-kfc-china_html#ixz
z2AYjqd3nQ
Saint Ann (2010). Irate Pizza Consumer, Retrieved from http://www.topix.com/
forum/city/dexter-mo/T14UC1J0I6E18HF6N
Salemang (2011). Kfc-Pricing Essay. Retrieved from, http://www. antiessays
.com/free-essays/101383.html
Sam Oches (2011). The top quick-serve and fast-casual brands in the nation. Retrieved
from, http://www.qsrmagazine.com/reports/2011-qsr-50.
Sarkar Ranju (2011). McDonald's new growth drivers, Retrieved form http://www
.business-standard.com/india/news/mcdonald%5Cs-new-growth-
drivers/450679/
Sharma Neha (2011). Mc Donald’s introduction, Retrieved from http://www.
.slideshare.net/neha111289/mcdonalds-9099614
Sha Riq (2007). KFC marketing strategy in India. Retrieved from, http:// small
business.yahoo.com/advisor/answers/other-advertising-and-marketing-
20081114203505AAHTQc4.html
Sharonulysses (2009). KFC marketing strategies. Retrieved from, http://www.
scribd.com/doc/17818440/KFC-marketing-strategies
Singh Kamal (2010). KFC Project. Retrieved from, http://www.studymode.com
/essays/Kfc-Project-374289.html

Taylor Cohn (2011). Domino's pizza digital marketing strategy, Retrieved from,
http://www.slideshare.net/tcohn44/dominos-pizza-digital-marketing-
strategy-10375834
Toporek, Adam (2012). Marketing domino’s: should an ad campaign tell the
Customers no? Retrieved from, http:/customers that stick.com/blog/
uncategorized/marketing-dominos-should-an-ad-campaign-tell
-customers-no/
Vocusprw Holdings (2010). Domino’s Crowned Top Pizza Delivery Chain Retrieved
from. http://uk.prweb.com/releases/2010/11/ prweb48. 01564.html
Wadhawan Nisha (2012). Doing Business in India 2012 Country Commercial Guide for
U.S. Companies, retrieved from, http://export.gov/india/build/.
groups/. public/@eg_in/documents/webcontent/eg_in_049379.pdf
Wenluan (2011). Marketing Strategies of Pizza Hut, Retrieved from
http://www.schoolsucks.com/paper/Marketing-Strategies-Of-Pizza-
Hut/15374.html
Wikipedia (2012). Domino's Pizza, Retrieved from http://en.wikipedia
org/wiki./Domino's_Pizza
Wikipedia (2012). Economy of India. Retrieved from http://en.wikipedia org/ wiki/.
Economy_of_India
Wikipedia (2012). KFC. Retrieved from, http://en.wikipedia.org/wiki/KFC.
Wikipedia (2012). McDonald's advertising, Retrieved from http://en. Wikipedia
org/wiki/McDonald's_advertising
Wikipedia (2011).Pizza Hut, retrieved from http://en .wikipedia.org/wiki/Pizza/ Hut.
Zouku (2009). KFC Advertising project. Retrieved from, http://www.scribd
/.com/doc/22407725/KFC-Advertising-project

Annexure

CONSUMER BEHAVIOUR IN FOOD AND BEVERAGE (F&B)
INDUSTRY: A CASE STUDY OF FAST FOOD INDUSTRY
Dear Respondent,
As part of my Ph.D research work in Jammu University. I am conducting a survey that
investigates aspects related to the Consumer Behavior in Fast Food and Beverage (F&B) industry.
This work will be submitted to the Jammu University in the form of a Ph.D thesis. If you are
interested the results can be made available to you. I will be thankful to you for your active
participation in the completion of this questionnaire. The information acquired from you in the
form of completely filled questionnaire will be kept confidential. Moreover, you are free to
withdraw your participation at any time. If you have any query or problem pertaining to the
questionnaire please contact me at [email protected].
Thanking you,
Sandeep Singh Chib (Researcher)
The Business School,
Department of Management Studies.
Jammu University, (J&K)
Which of the following fast food companies have you visited maximum times in last one
year? (Please tick one choice).
Mc Donald Pizza hut KFC Dominos KFC
You are requested to please tick one of the options listed at the end of each question
which are marked as 1,2,3,4 or 5 where:
1= Strongly disagree, 2= Disagree, 3= Neither Agree nor Disagree,
4= Agree and 5= Strongly Agree.

1. Staff members understand your needs. .
2. The staff served you in appropriate time. .
3. The staff was available when you wanted. .
4. The staff was able to satisfy your query. .
5. The products were delivered to you on time. .
6. The employees had knowledge of the restaurant products. .
7. The staff has enough knowledge of what they are doing .
8. The product delivered to you was well packed. .
9. The level of the quality of the product was as per your expectation. .
10. You feel that the way of the product servicing was good. .
11. The staff members conducted themselves in a professional manner .
12. The staff listened to your complaints and gave prompt resolutions .
13. The staff was courteous to you. .
14. The level of the need fulfillment form the product/service was
in accordance with your expectations. .
15. The staff was trust worthy and honest. .
16. The staff told you the status of your order while it was in progress. .
17. The staff kept their promise given to you. .
18. The staff collected money form you in an appropriate manner. .
19. Employees gave you any sales or advertising gifts or material. .
20. You feel that the staff can resolve your complaint in time. .
21. The staff communicated with you properly while giving bills. .
22. Employees seem to understand how you feel. .
23. You feel that employees are concerned about extra
money in form of tips. .
24. You waited a short period of time to get help after you asked for it. .
25. You are satisfied with the quality of the product serviced. . 26. You believe that the serving staff was well mannered. . 27. The staff had good interaction with you while solving your complaint . 28. If you want to get same service you will come back to the same place. . 29. How satisfied are you with the amount of help you have received. . 30. If a friend needs same service or product you will recommend the same restaurant to him/ her as well. .
31. You are overall satisfied with the services the restaurant is providing. .
Section 1: Consumer satisfaction 1 2 3 4 5
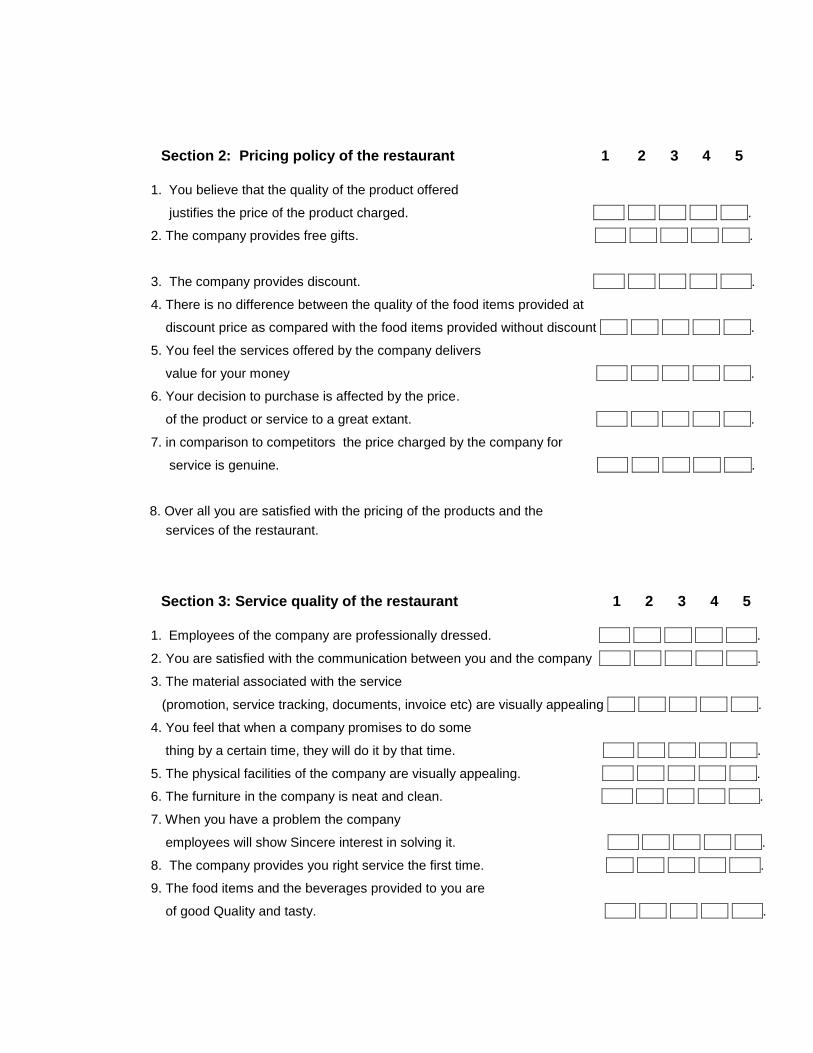
1. You believe that the quality of the product offered
justifies the price of the product charged. .
2. The company provides free gifts. .
3. The company provides discount. .
4. There is no difference between the quality of the food items provided at
discount price as compared with the food items provided without discount .
5. You feel the services offered by the company delivers
value for your money .
6. Your decision to purchase is affected by the price.
of the product or service to a great extant. .
7. in comparison to competitors the price charged by the company for
service is genuine. .
8. Over all you are satisfied with the pricing of the products and the
services of the restaurant.
1 2 3 4 5 1. Employees of the company are professionally dressed. .
2. You are satisfied with the communication between you and the company .
3. The material associated with the service
(promotion, service tracking, documents, invoice etc) are visually appealing .
4. You feel that when a company promises to do some
thing by a certain time, they will do it by that time. .
5. The physical facilities of the company are visually appealing. .
6. The furniture in the company is neat and clean. .
7. When you have a problem the company
employees will show Sincere interest in solving it. .
8. The company provides you right service the first time. .
9. The food items and the beverages provided to you are
of good Quality and tasty. .
Section 2: Pricing policy of the restaurant 1 2 3 4 5
Section 3: Service quality of the restaurant 1 2 3 4 5

Section 4: Brand Loyalty 1 2 3 4 5
1. You feel that you are satisfied with the last purchased brand .
2. You feel that you intend to repurchase the same restaurant’s brand service .
3. You will recommend the restaurant brand you bought last time
to others. .
4. If the brand price increased in comparison to its competitor’s
Brands you will still buy form the same restaurant brand .
5. If the restaurant brand you buy form is not having any outlet
in the near vicinity you will travel long distance to buy
form your restaurant brand .
6. Over all you consider yourself to be loyal to this restaurant brand .
1 2 3 4 5
10. The food items and beverages provided to you are fresh. .
11. You are allowed to fill your beverage at least one time free .
12. The employees of the restaurant instill confidence in you. .
13. You feel safe to have transactions with the restaurant. .
14. The employees of the restaurant give prompt service to you .
15. The employees of the company give you individual attention. .
16. The restaurant has modern cooking machinery. .
17. The employees of the company are co-operative. .
18. The employees of the company are always willing to help you with a smile .
19. The employees of the restaurant will tell you exactly
how long will it Take to process your order. .
20. The employees have knowledge to answer your questions. .
21. The restaurant has operation hours convenient to you. .
22. The employees are never too busy to respond to your request. .
23. You are satisfied with the overall service quality of the restaurant. .

Section 5: Demographics Please tick the box of your choice.
Gender:
Marital Status:
Age group:
10-15 . 16-21 . 22- 27 . 28-33 . 34-40 . Above 40 .
House hold income per month:
10k-20k . 21k-30k . 31k-40k . 41k-50k . 51k-60K . Above 60K .
Occupation:
Self employed .
Student . Corporate Job . Government Job .
Thanks, for the information you have shared with me.
Male . Female .
Married . Divorce . Unmarried . .