consumer choice of smartphone attributes: an application
TRANSCRIPT

www.theinternationaljournal.org > RJSSM: Volume: 06, Number: 06, October 2016 Page 62
Consumer Choice of Smartphone Attributes: An Application of Conjoint Analysis.
Dr. S. Chandramouli,
Associate Professor, St. Xavier’s P. G. College, (Affiliated to Osmania University, Hyderabad.)
Gopanpally (V), Serilingampally (M), Hyderabad, Telangana, India. [email protected]
09948673007.
ABSTRACT The market for Smartphones (now more commonly known as mobile phones, or just 'mobiles') experienced rapid growth until 2012, when it can be considered to have reached maturity. Since then, the market focus has been on mobile replacement rather than on first-time purchase, and the profiles of buyers - and of their tastes, needs and preferences - have changed to a remarkable extent. A new generation of mobiles - generally labelled Smartphones has roused which general consumer interest. The present study an exploratory study which identifies the consumer choice patterns regarding the six attributes of a Smartphone: RAM (Random access memory), Memory, Camera, Battery backup, Colour, and size. The objective is to analyse the consumer preferences regarding six attributes mentioned. Conjoint Analysis was used to find out the different aspects of consumer choice regarding Smartphone attributes. This study is based on a field survey conducted of 100 respondents in and around Hyderabad of Telangana state. The study shed light on the most preferred attributes like RAM and quality of camera out of the available attributes that can serve as basis for new product development or modifying the existing product. Similarly the study brought out the differences of opinion regarding the preferred attributes between the subgroups that can help design a marketing plan to target that particular segment of subgroup. Key words: Smartphone, market, new product development, conjoint analysis. Introduction Mobile phones are now replaced with smartphones and experienced rapid growth until 2012 when it can be considered to have reached maturity. Since then, the consumers who are using conventional mobile handset have been replacing with smartphones and of their preferences tastes, and needs - have changed to a great extent. A new generation of mobiles - generally labelled Smartphone - has been released which have excited general consumer interest. It is therefore important for the companies to understand the main attributes of a smartphone and to understand what further steps are required to market Smartphone to both current users and potential new customers. A smartphone can be considered as an integration of computer and mobile phone which provides a multifunction of different features and applications. it can be marketed to different segments of consumers. Smartphone were initially used mainly for specialized purposes such as delivery services and medical services but began to be used as a mutli-purpose when general customer needs were taken into consideration and functions such as multimedia, games were included. In general, a smartphone is defined as an advanced cellular handset that provides traditional mobile phone features but also such personal digital assistant features as Internet access and portable personal computer functions. Despite the change in the mobile market from earlier handset (we refer to them as 'feature phones') to Smartphone, few researchers tried to address issues related to the evolution of the smartphone market in terms of user behaviours. In real sense Smartphone is an electronic gadgets with advanced attributes like making phone calls and sending text messages. The Smartphones are equipped with to display photos, play videos, navigation, play games, built-in camera, audio/video playback and recording, built in apps for social web sites send/receive e-mail, and surf the Web, wireless Internet and much more.
www.theinternationaljournal.org > RJSSM: Volume: 06, Number: 06, October 2016 Page 63
Literature Review Le-Marie Thompson, (2003) wrote a journal article entitled ‘Death of Landline,’ where she analyzed this exact phenomenon. Beyond the fact that almost all adults in the developing world own a cell phone. Leung and Wei (2000) found that motivations for mobile phone use included 'fashion and position', 'emotion and sociality', 'relaxation', 'mobility', 'instantaneity', and 'relief from work'. However, since the characteristics of Smartphone differ greatly from those of feature phones. Youngmo Kang, et.al, (2014) investigated the adoption factors of Smartphone focusing on the differences of smartphone and feature phone users. The TAM was initially proposed by Davis (1989) it comprises two beliefs, the perceived utilities and the perceived ease of application, which determine attitudes to adopt new technologies. The attitude toward adoption will decide about the adopter’s positive or negative behaviour in the future concerning new technology. Qiang Xu et.al (2011) explained about Smartphone users are increasingly shifting to using apps as gateways” to Internet services rather than traditional web browsers. App marketplaces for iOS, Android, and Windows Phone platforms have made it attractive for developers to deploy apps easy for users to discover and start using many network-enabled apps quickly. J. Huang, et. al, also proposed measurement tools for Smartphone devices characterizing either the device performance or the performance of certain apps. Our study is complementary to these, as it focuses on attributes of Smartphone. Muhammad Sarwar, Tariq Rahim Soomro (2013) investigated how Smartphone are impacting the society and also how Smartphone are going to transform the culture, social life, technology landscape and other diverse aspects of modern society. Chad Tossell, et.al, (2015) examined smartphone user behaviours and their relation to self-reported smartphone addiction. Smartphone use is becoming ubiquitous. According to recent statistics, over one billion people worldwide own at least one of these devices [Strategy Analytics, 2012] and they use them for a wide number of tasks, from placing a phone call to checking email, surfing the web, and listening to music [Blom J , 2011]. These technologies have been adopted at a rate faster than any other in history [Farago P. 2012.] and the web is currently accessed more from Smartphone than any other type of device [Newark-French C. 2011]. Statement of the Problem Smartphone industry is set to become more competitive as most of the strategic alliances have made in the past been broken and the foreign companies operating independently. In such a scenario, the smartphone manufacturers need to know the importance of the attributes of a smartphone and whether there are any differences of choice pattern in different segments of the consumer. These facts provided the motivation for this study. The objective is to find out the consumer preference ordering of various attributes of a smartphone and applicability of conjoint analysis in finding out and the probable use of the tool in new product development and market segmentation. This study was based on a field survey conducted in and around Hyderabad. The statistical tool of conjoint analysis is employed to analyse the findings that may serve as input for new product development and market segmentation. Scope of the Study This study was based on a field survey conducted in and around Hyderabad about the consumer preference ordering of various attributes of a Smartphone, findings that may serve as input for new product development and market segmentation. Objectives of the study
1. To study the socio-economic characteristics of the Smartphone users. 2. To explain the history of smartphone and their market share in India 3. To know consumer ranking of preference of attributes of different companies. 4. To analyse the consumer preference ordering of various attributes of a Smartphone. 5. To find out the most preferred attributes of smartphone by applying the conjoint analysis. 6. To suggest what attributes are necessary for companies for new product development.
www.theinternationaljournal.org > RJSSM: Volume: 06, Number: 06, October 2016 Page 64
Research Methodology Scope of the study: The study is confined only in and around Hyderabad city only. Research Approach: A structured questionnaire is designed specifically to meet the objectives of the study. Sampling Technique: Convenient Sampling has been used. Sample: A sample of only 100 respondents is chosen for the study. Primary Data: It is gathered by administering the questionnaire and depth interview with the retailers of Smartphone. Secondary Data: It is collected from books, journals, newspapers, periodicals, reports and internet. Framework of Analysis: The collected data has been processed both physically and with the help of statistical package for social science (SPSS). Tools like Percentage Analysis and Conjoint Analysis. Why Conjoint Analysis? The origin of conjoint analysis dates back to the 1960s when a mathematical psychologist name Luce and statistician named Tukey developed the concept in a joint paper in 1964. Thereafter conjoint analysis has been developed in the subsequent years by scholars like Kruskal, Carroll and Young in the late 1960s, Srinivasan and Green in the 1970s and Johnson in the 1980s. Choice of Preference Model The preference model chosen here was the “part worth” model. The “part worth” model suggests that the consumer attaches a specific utility to one level of an attribute. The total utility of a multi attribute product is some additive function of the part worth’s of the attribute levels present in that particular product. The part worth model is simple to explain and has greater flexibility compared to other preference models like “ideal point” or “vector” model. In fact, the part worth model can be converted into other models like the ideal point or vector model using suitable assumption. In the given study, a part worth model has been chosen because the study is an exploratory one. For the sake of simplicity, interaction effects have been assumed to be not present. Conjoint Design The design chosen is the full profile conjoint, where hypothetical products have been developed using the complete set of attributes and levels. The “trade off” or “two factor at a time” method is not selected here because of the problem of routinized response. Also, since the numbers of attributes or factors are low, it will not make the consumers face the problem of information overload. The basic advantage of the full profile method is that it gives a realistic picture of the stimuli by defining the levels of each factor. Scholars such as Wittink and Cattin (1989) have given favourable opinion about the full profile conjoint method because of its flexibility and friendliness for numerical improvements. Green and Srinivasan (1978) have also recommended the use of full profile conjoint if the number of attributes is six or less History of Smartphone Today‘s Smartphone has been around since last six years when Apple introduced the Smartphone in mass consumer market, but the Smartphone has been used by consumers since 1993. The Smartphone era is divided into three main phases. First phase was purely meant for corporate. During this phase all the smartphones were targeting the corporations and the characteristics and functions were as per corporate needs. This era began with the advent of the very first Smartphone the Simon from IBM in 1993. Blackberry is considered as the pioneer to introduce smartphone of this era; it introduced many features including Web browsing, E-mail, Camera, Internet,. This phase was totally based on smartphones targeting enterprises [James Niccolai, Nancy Gohring, 2010]. The second phase of Smartphone started with the advent of iPhone, the major breakthrough in 2007. Apple revealed its first smart phone in 2007. This the first time when industry introduced the Smartphone for general consumers market [Hamza Querashi, 2012]. End of 2007 Google unveiled its Android Operating System with the intention to target the consumer Smartphone market. The emphasis during this time period was to introduce features that the consumer need and at the same time keep the cost at lower to
www.theinternationaljournal.org > RJSSM: Volume: 06, Number: 06, October 2016 Page 65
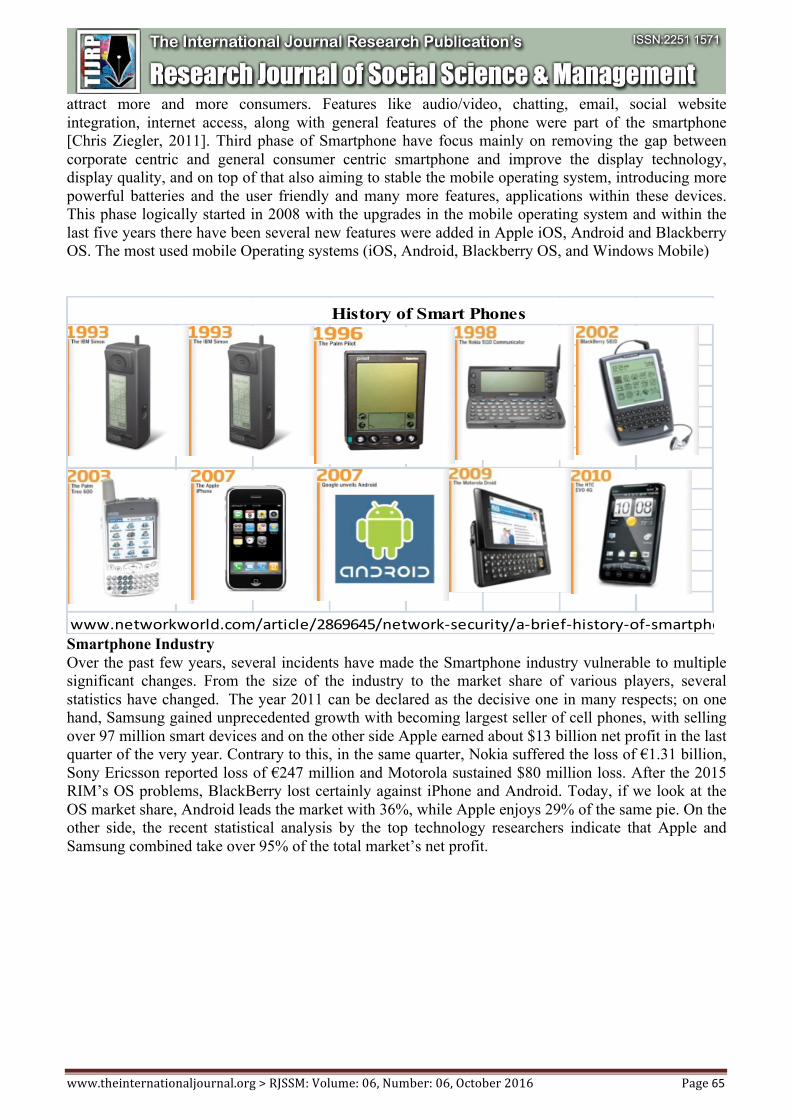
attract more and more consumers. Features like audio/video, chatting, email, social website integration, internet access, along with general features of the phone were part of the smartphone [Chris Ziegler, 2011]. Third phase of Smartphone have focus mainly on removing the gap between corporate centric and general consumer centric smartphone and improve the display technology, display quality, and on top of that also aiming to stable the mobile operating system, introducing more powerful batteries and the user friendly and many more features, applications within these devices. This phase logically started in 2008 with the upgrades in the mobile operating system and within the last five years there have been several new features were added in Apple iOS, Android and Blackberry OS. The most used mobile Operating systems (iOS, Android, Blackberry OS, and Windows Mobile)
www.networkworld.com/article/2869645/network-‐security/a-‐brief-‐history-‐of-‐smartphones
History of Smart Phones
Smartphone Industry Over the past few years, several incidents have made the Smartphone industry vulnerable to multiple significant changes. From the size of the industry to the market share of various players, several statistics have changed. The year 2011 can be declared as the decisive one in many respects; on one hand, Samsung gained unprecedented growth with becoming largest seller of cell phones, with selling over 97 million smart devices and on the other side Apple earned about $13 billion net profit in the last quarter of the very year. Contrary to this, in the same quarter, Nokia suffered the loss of €1.31 billion, Sony Ericsson reported loss of €247 million and Motorola sustained $80 million loss. After the 2015 RIM’s OS problems, BlackBerry lost certainly against iPhone and Android. Today, if we look at the OS market share, Android leads the market with 36%, while Apple enjoys 29% of the same pie. On the other side, the recent statistical analysis by the top technology researchers indicate that Apple and Samsung combined take over 95% of the total market’s net profit.

www.theinternationaljournal.org > RJSSM: Volume: 06, Number: 06, October 2016 Page 66
This statistic shows a forecast of India's global market share of smartphone shipments in 2013 and 2017. The source predicts that India will increase its market share to 10.3 percent by 2017.Market share of shipments 3% in 2013 and 10.3% in 2017. The fact that every 1 out of 4 phones sold in India is a Samsung device proves how much the Korean giant has been able to imprint itself in the minds of Indians. The numbers rise even higher when it comes to Smartphone with 3 out of every 10 Smartphone being sold in India bearing the Samsung moniker. With their new generation of LTE-capable devices, Samsung posted a very healthy 27% YoY increase fuelled by the launch of the J series Smartphone in low and mid range and the S7 and S7 Edge in the premium handset segment. While the report on smartphone market share in India provides an interesting point of view into the Indian Smartphone scenario, the main battle for the budget Smartphone in India is being fought online. In fact, as a recent report has revealed, in 2015, on out of every three Smartphone sold in India has been through online channels. This is why despite racking up impressive growth in China, Vivo and Oppo if they keep to their strategy of going offline.

www.theinternationaljournal.org > RJSSM: Volume: 06, Number: 06, October 2016 Page 67
Source: http://9to5mac.com/2016/01/28/iphone-global-shipments-marketshare. Data Analysis Development of the Stimulus Set Having selected the design methodology, the question of preparing the stimulus set arises. Three important issues arise in this part:
1. The decision about the number of attribute and their levels. 2. The total number of stimuli to be used. 3. The construction of the stimuli.
The decision about the number of attributes and their levels: Since the study is to find out the consumer preference patterns of Smartphone, research conducted to identify the important attributes of a Smartphone. After going through the specifications of 24 different brands, six attributes were finalized. But the stimulus set it is generating consisted of minimum 32 stimuli which can lead to the problem of routinized response. So, some of the levels of the attributes were reduced without the loss of generality. Finally the attributes and their levels are:
Table 1: Attributes and levels
Attributes Levels 1 2 3 4RAM. (random
access memory) 4 <2 GB 4 GB 6 GB >8 GBMemory. 4 <4 GB 8 GB 16 GB >32 GB
Quality of Camera.(megapixels) 4 <5 MP 8 MP 13 MP >18 MPBattery life 3 12 hours 18 hours 24 hours -Colour. 3 Black. White. Other. Size (in Inches) 4 3.5 - 4 4 - 4.5 4.5 - 5 5- 5.5 And more
Source: primary data
Brand Models Brand Models Brand Models Brand Models
Samsung 371 Acer 4 Dell 1 HTC 148Apple 93 Black Berry 31 Fly 12 Huawei 30Lenovo 97 Celkon 296 Haier 17 Iball 1Asus 92 Coolpad 1 HP 1 Karbonn 606Lava 379 Micromax 607 Microsoft 36 Motorola 30Nokia 159 Reliance 13 Sony 138 Vivo 25
Table2: Brands and their model levels
Source: compiled from online.

www.theinternationaljournal.org > RJSSM: Volume: 06, Number: 06, October 2016 Page 68
Table 3: Demographic Profile S.No Demographic
No of Respondent
s
Percentage
1 Gendera) Male 68 68b) Female 32 32
2 Age (in Years)a) Below 20 10 10b) 20 – 30 70 70c) 30 – 40 15 15d) Above 40 5 5
3 Occupationa) Student 42 42b) Private Employee 35 35
c) Govt. Employee 16 16d) Other 7 7
4 Residenta) Rural 36 36b) Urban 64 64
Source: Primary Data The possible set of combinations from the levels of six attributes is to be 4 x 4 x 4 x 3 x 3 x 4 = 2304. These combinations are reduced to a manageable set using the orthogonal design to ease evaluation. The final 12 set of hypothetical combinations of smartphons were presented to the respondents in a structured questionnaire (Table 4). The stimuli were presented in a structured questionnaire (see table 1) to the respondents. The Smartphone names mentioned as Smartphone A, Smartphone B etc., in the table are known as cards in conjoint terminology. Each card stands for a particular combination of attributes and is expected
Source: primary data to evoke a particular utility in the respondent’s mind. In case of small products or FMCGs, the researchers can have the option of providing the respondent with sample products with a particular set of attribute levels. This was not possible given the scale and scope of the study. The other method of presenting the stimulus is in a pictorial format which was not possible in this case because, except colour, the other attributes cannot be represented pictorially. Thus the method adapted was one of the verbal representations. However, the interviewers were sufficiently equipped to answer queries of the respondents. Scale of Measurement Ranked data are assumed to be more reliable. Thus, the respondents were asked to rank the stimuli/ combinations in their order of preference, where rank 1 means most preferred and rank 9 means last preferred.
Table 4: The Full Profile Conjoint
Smartphone Brand Name
RAM. (GB)
processor
Memory (GB)
Quality of Camera.
(Mega Pixels)
Battery life or backup.(Hours)
Colour.
Size.
( inches)
Smartphone A 4 8 13 24 other 4 Smartphone B 6 16 8 24 Black 5 Smartphone C 4 32 8 24 Black 5 Smartphone D 4 16 5 24 White 4 Smartphone E 2 16 5 24 Other 3 Smartphone F 8 4 13 18 White 5.5 Smartphone G 2 4 8 24 White 5 Smartphone H 4 32 18 24 Black 5.5 Smartphone I 2 8 5 24 Black 3 Smartphone J 4 16 5 24 White 4 Smartphone K 2 16 5 24 Other 3 Smartphone L 8 4 13 18 White 5.5

www.theinternationaljournal.org > RJSSM: Volume: 06, Number: 06, October 2016 Page 69
This indicates that RAM and Quality of camera are more important to the students rather than colour. The part worth estimates of the different levels of each attribute are given in Table 4(A, B). The total permutations and combinations of the levels of attributes were calculated and found to be 4096.
Group2 4 6 8 8 16 32 5 8 13 18
Overall -16.849 -1.729 20.01 -12.169 12.852 -12.85 11.18 10.46 10.18 11.05 12.852 -12.85Student -15.024 -2.028 17.65 -9.75 13.752 -13.75 12.16 11.13 14.16 9.98 13.752 -13.75
Non Student -20.601 -1.375 21.09 -18.965 11.678 -11.68 9.96 8.85 11.46 10.65 11.678 -11.68
Group12 18 24 Black White Others 3 4 5 5.5
Overall 3.69 5.513 -15.643 -8.318 5.318 3.019 -12.17 11.05 -8.318 11.18Student 4.53 5.363 -15.500 -9.376 7.376 2.153 -9.75 9.98 -9.376 12.16
Non Student 4.79 4.415 -15.225 -5.963 3.963 2.097 -18.97 10.65 -5.963 9.96
Table 6A The Part worth Estimates
Table 6B The Part worth EstimatesColour Size (Inches)
Quality of Camera (M Pixels)
Battery Backup (Hours)
RAM (GB) Memory (GB)
When it came to the part worth of different levels of attributes, it was found out that, there existed significant differences in the part worth assigned to the most preferred level of RAM and the most preferred level of memory among the students and nonstudents. Summary of Findings
1. RAM: Data collected shows that, RAM is the most important factor in selecting the Smartphone, followed by the Quality of Camera, Size, Power Back Up, Memory, and finally the Colour.
2. The Quality of Camera: It is found that most of the respondents prefer high quality camera with minimum 5 megapixels. Smartphones have changed the way of traditional Photography, because smartphone is easy to carry. This habit has brought people sharing and using photo-editing apps.
1. Size: comparing different sizes, the respondents attached 5.5 inches size as most preferred size of smartphone.
2. Battery life: it is found that students and non-students preferred minimum 18 hours Battery life for their smartphone. The important feature of any smartphone is battery life and it should have more mAh battery capacity.
3. Memory: Most of the respondents preferred minimum 4 GB internal and 64 GB external memory for their phone. It is inferred that memory is one of the most important features of any smartphone which decides the choice to buy.
4. Colour: Students and non-students preferred white and black colour rather than any other colour.
On the basis of the findings we can find out the total utility of each combination for each group. The model used here is an additive model which can be mathematically represented as
Group RAM Memory Quality of Camera
Battery Backup
Colour Size Total
Overall 27.6 11.09 19.89 13.46 9.55 18 100
Student 25.2 11.13 20.19 14.69 10.98 18 100
Non Student 30.1 11.05 19.6 12.23 8.13 19 100
Table 5: Weight Assigned to Different Attributes (in %)
www.theinternationaljournal.org > RJSSM: Volume: 06, Number: 06, October 2016 Page 70
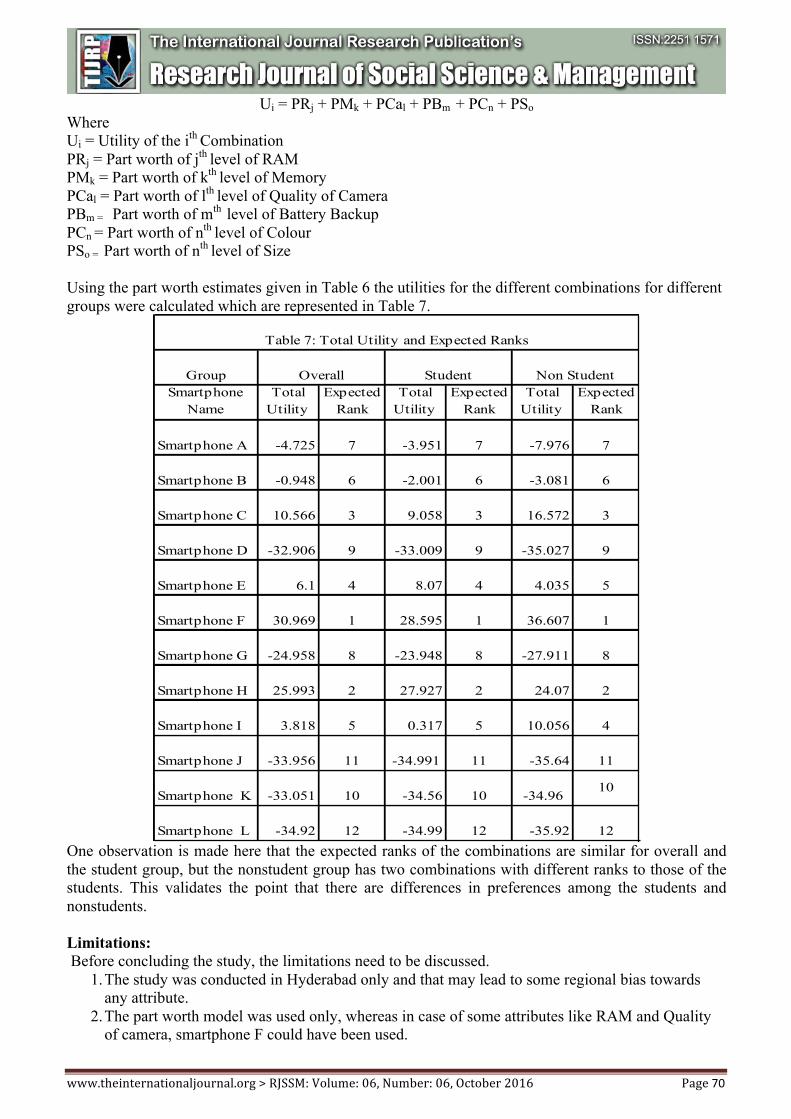
Ui = PRj + PMk + PCal + PBm + PCn + PSo Where Ui = Utility of the ith Combination PRj = Part worth of jth level of RAM PMk = Part worth of kth level of Memory PCal = Part worth of lth level of Quality of Camera PBm = Part worth of mth level of Battery Backup PCn = Part worth of nth level of Colour PSo = Part worth of nth level of Size Using the part worth estimates given in Table 6 the utilities for the different combinations for different groups were calculated which are represented in Table 7.
GroupSmartphone
NameTotal
UtilityExpected
RankTotal
UtilityExpected
RankTotal
UtilityExpected
Rank
Smartphone A -4.725 7 -3.951 7 -7.976 7
Smartphone B -0.948 6 -2.001 6 -3.081 6
Smartphone C 10.566 3 9.058 3 16.572 3
Smartphone D -32.906 9 -33.009 9 -35.027 9
Smartphone E 6.1 4 8.07 4 4.035 5
Smartphone F 30.969 1 28.595 1 36.607 1
Smartphone G -24.958 8 -23.948 8 -27.911 8
Smartphone H 25.993 2 27.927 2 24.07 2
Smartphone I 3.818 5 0.317 5 10.056 4
Smartphone J -33.956 11 -34.991 11 -35.64 11
Smartphone K -33.051 10 -34.56 10 -34.9610
Smartphone L -34.92 12 -34.99 12 -35.92 12
Table 7: Total Utility and Expected Ranks
Overall Student Non Student
One observation is made here that the expected ranks of the combinations are similar for overall and the student group, but the nonstudent group has two combinations with different ranks to those of the students. This validates the point that there are differences in preferences among the students and nonstudents. Limitations: Before concluding the study, the limitations need to be discussed.
1. The study was conducted in Hyderabad only and that may lead to some regional bias towards any attribute.
2. The part worth model was used only, whereas in case of some attributes like RAM and Quality of camera, smartphone F could have been used.
www.theinternationaljournal.org > RJSSM: Volume: 06, Number: 06, October 2016 Page 71
3. Individual choice patterns were not studied in detail. Conclusion: In spite of the limitations, the study can act as a stepping stone of a study with more detail and rigor. Because the findings suggest that any company in the Smartphone business should concentrate on RAM, Quality of Camera as that is most important to any consumer. Then it should focus on the memory aspect as there is an increasing awareness about internal and external data storage people wants more data storage capacity. Lastly, it can be concluded from the study that the Smartphone market can be segmented into students and non students section because there is a difference in the performance pattern of the students and non students. Thus, any company which wants to target a particular segment should change its marketing plan to suit the needs of its target group. References:
1. Blom J, Gatica-Perez D. Smartphone usage in the wild: a large-scale analysis of applications and context. Proceedings of the 13th international conference on multimodal interfaces http://dx.doi.org/10.1145/2070481.2070550/ ( accessed on 12-08-2016).
2. Chad Tossell, et.al, (2015), “Exploring Smartphone Addiction: Insights from Long-Term Telemetric Behavioural Measures” IJIM ‒ Volume 9, Issue 2, pp 36-40.
3. Carroll Douglas J and Green Paul E (1995). “Psychometric Methods in Marketing Research: Part 1, Conjoint Analysis.” Journal of Marketing Research, November, Vol. 32, Issue 4, p. 385.
4. Cattin Philippe; Gelfand Alan E and Danes Jeffrey (1983). “A Simple Bayesian Procedure for Estimation in a Conjoint Model”. Journal of Marketing Research. February, Vol. 20, Issue 1, p. 29.
5. Dey Abhijeet (2000). “Models on Two Wheels.” www.indiainfoline.com, January, collected from http://www.indiainfoline.com/nevi/twoo.
6. Davis (1989) http://www.igi-global.com/dictionary/technology-acceptance-model-tam/29485. (Accessed on 26/08/2016)
7. Green Paul E and Srinivasan V, (1990). “Conjoint Analysis in Marketing: New Developments with implications for Research and Practice.” Journal of Marketing, October, Vol. 54, Issue 4, p. 3.
8. Farago P. (2012). iOS and Android Adoption Explodes Internationally. http://blog.flurry.com/bid/88867/iOS-a, nd? ( accessed on 12-08-2016). J. Huang, Q. Xu, B. Tiwana, Z. M. Mao, M. Zhang, and P. Bahl (2010).. Anatomizing Application Performance Differences on Smartphones. Retrived from experts.umich.edu/ (acessed on 14/08/2016)
9. Lonial Subhash, Menezes Dennis and Zaim Selin (2000). “Identifying Purchase Driving Attributes and Market Segments for PCs Using Conjoint and Cluster Analysis” Journal of Economic and Social Research, July, Vol. 2, Issue 2, p. 19.
10. Le-Marie Vanesssa Joan Thompson (2003), “Death of the Landline: Analysis of Mobile Phone Use”, Georgetown University.
11. LEUNG, L., Wei, R. (2000). “More than just talk on the move: uses and gratifications of the cellular phone”. Journalism and Mass Communication Quarterly, 77(2), 308-320.
12. Muhammad Sarwar, Tariq Rahim Soomro (2013),” European Journal of Scientific Research” ISSN 1450-216X / 1450-202X Vol. 98 No 2 March, 2013, pp.216-226 http://www.europeanjournalofscientificresearch.com
13. Moskowitz Howard (2001), “Creating New Product Concepts for Food Service-The Role of Conjoint Measurement to Identity Promising Product Features”. Food Service Technology, Spring, Vol. 1, Issue 1, p. 35.
14. Qiang Xu et.al , “Identifying Diverse Usage Behaviours of Smartphone Apps” IMC’11, November 2–4, 2011, Berlin, Germany. https://web.eecs.umich.edu/~zmao/Papers/imc11_xu.pdf/ ( accessed on 25/08/016)

www.theinternationaljournal.org > RJSSM: Volume: 06, Number: 06, October 2016 Page 72
15. Strategy Analytics (2012). Worldwide Smartphone Population Tops 1 Billion in Q3 2012.Wireless Smartphone. Strategies.http://blogs.strategyanalytics.com/WDS/post/2012/10/17/Worldwi e-Smartphone-Population-Tops-1-Billion-in-Q3-2012.aspx.
16. Newark-French C. (2011) Mobile apps put the web in their rear view mirror. http://blog.flurry.com/?month=6&year=2011. ( accessed on 12-08-2016)
17. Wittink Dick R and Cattin Philippe (1989). “Commercial Use of Conjoint Analysis: An Update”, Journal of Marketing, July, Vol. 53, Issue 3.
WEBSITES
1. http://www.business2community.com/mobile-apps/samsung-vs-apple-an-overview-of-smartphone-industry-0133145#KkGfGL1AIVB0sZV4.99.
2. http://www.telecomlead.com/telecom-statistics/indian-mobile-operators-market-share-feb-2016-revealed-68513.
3. http://www.pcworld.com/article/195199/article.html 4. http://en.wikipedia.org/wiki/BlackBerry.