consumer confidence & tet spending 2015 tns reseach
TRANSCRIPT

Vietnam Consumer Trends

© TNS
Above VND 20mil
VND 13.5mil – VND 20mil
VND 8.5mil – VND 13.5mil
VND 5.5mil – VND 8.5mil
VND 3mil – VND 5.5mil
Below VND 3mil
2011 2014
Income: Increasing income levels
Source: TNS VietCycle report
Monthly Householdincome
4

GDP: From Slowdown to Stability
3
GDP Growth rate and GDP Per Capita (US $)
Source: GSO Vietnam and World Bank
7.88.4 8.2
8.5
6.2
5.3
6.8
5.9
5.3 5.45.98
2004 2005 2006 2007 2008 2009 2010 2011 2012 2013 2014
1,9111,2321,165 1,334 1,543 1,755607 699 797 919 2,028

© TNS
59
3545 41
30 2617
35
24
29
32 38
3830
37
46
16
3622 21
3244 46
18
2008 2009 2010 2011 2012 2013 2014 2015
Positive Neutral Negative
89
64
78 79
68
5651
82
Consumer Confidence: Rebound
5
Ave. Petrol VND/ liter
Negative sentiment going down – things cant get worse
Source: TNS Consumer Confidence – HCMC + HN
15,125 14,004 16,364 19,450 22,333 23,678 23,264 17,040

© TNS
Employment: Reduced uncertainty
68
63
56
65
20
32
24
23
12
5
20
12
2012
2013
2014
2015
Present job is safe Chance of unemployment Don't knowNot sure
Source: TNS Consumer Confidence – HCMC + HN

© TNS
Saving: Optimism fuelling consumer spend
55
32
19
16
18
26
14
29
14
23
20
37
13
18
45
18
2011
Mid 2012
2014
2015
Up to 5% 5% - 10% 10% - 20% More than 20%
Source: TNS Consumer Confidence – HCMC + HN

© TNS
3
4
4
4
4
20
6
10
2
2
8
41
53
58
59
63
49
64
71
79
79
74
56
42
38
37
33
30
29
20
19
18
17
Education
Health care products / services
Food & beverages products
Household utilities
Communications
Entertainment & dining out
Transportation
Personal devices
Household care products
Personal care products
Home appliances
%
Less The Same More
Education, health care and household necessities show a growth in spending. Entertainment and dining out top of consumers’ cut-off list
7
Consumer planned spending in 2015:+/- ‘more’ trend
vs. 2014
+8
+7
+7
+13
+4
+18
+8
-
-11
-3
-
Source: TNS Consumer Confidence – HCMC + HN

© TNS
New brands New experiences
8
0
50
100
150
200
250
300
2Y 1Y 6M 3M 1M Now
Retail & Service Turnover (VND, tril)

© TNS
Consumers are Shopping
Average monthly shopping frequency
11
SOURCE: TNS VietCycle 2014 – Urban only
21
times
14
times
1.9
times
Wet markets Street Shops
Hyper/super
market
Convenient
stores
Minimarkets Shopping
centers
1.9
times
1.5
times
0.3
times
Department
stores
0.3
times

© TNS
Vietnam Digital Trends
© TNS
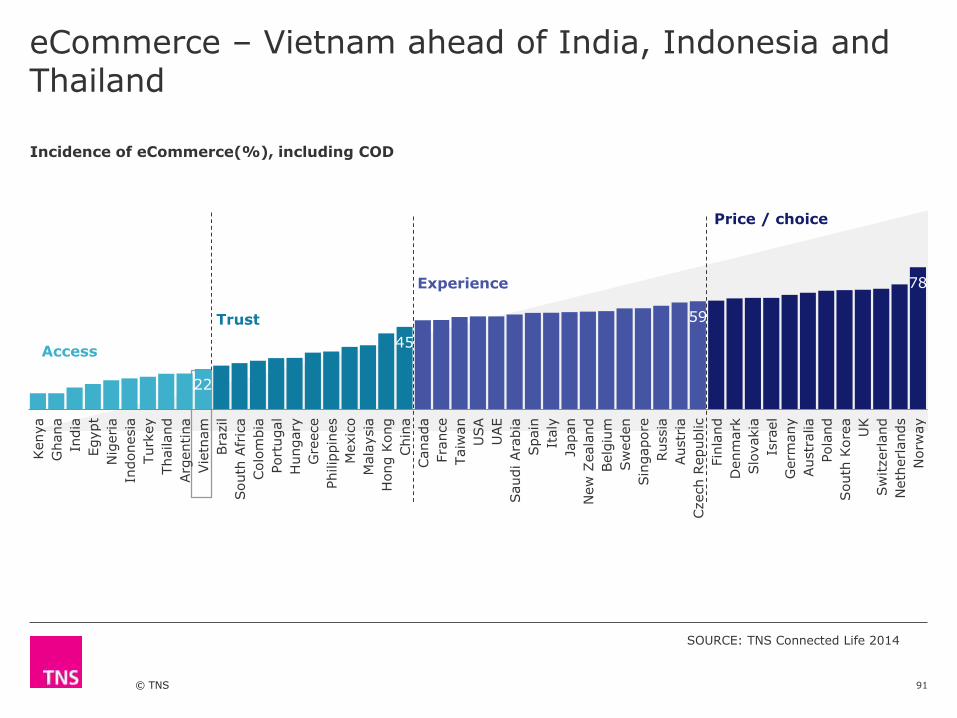
eCommerce – Vietnam ahead of India, Indonesia and Thailand
Incidence of eCommerce(%), including COD
Access
Trust
Experience
Price / choice
91
SOURCE: TNS Connected Life 2014
22
45
59
78
Kenya
Ghana
India
Egypt
Nig
eria
Indonesia
Turk
ey
Thailand
Arg
entina
Vie
tnam
Bra
zil
South
Afr
ica
Colo
mbia
Port
ugal
Hungary
Gre
ece
Philip
pin
es
Mexic
o
Mala
ysia
Hong K
ong
Chin
a
Canada
Fra
nce
Taiw
an
USA
UAE
Saudi Ara
bia
Spain
Italy
Japan
New
Zeala
nd
Belg
ium
Sw
eden
Sin
gapore
Russia
Austr
ia
Czech R
epublic
Fin
land
Denm
ark
Slo
vakia
Isra
el
Germ
any
Austr
alia
Pola
nd
South
Kore
a
UK
Sw
itzerl
and
Neth
erl
ands
Norw
ay
© TNS
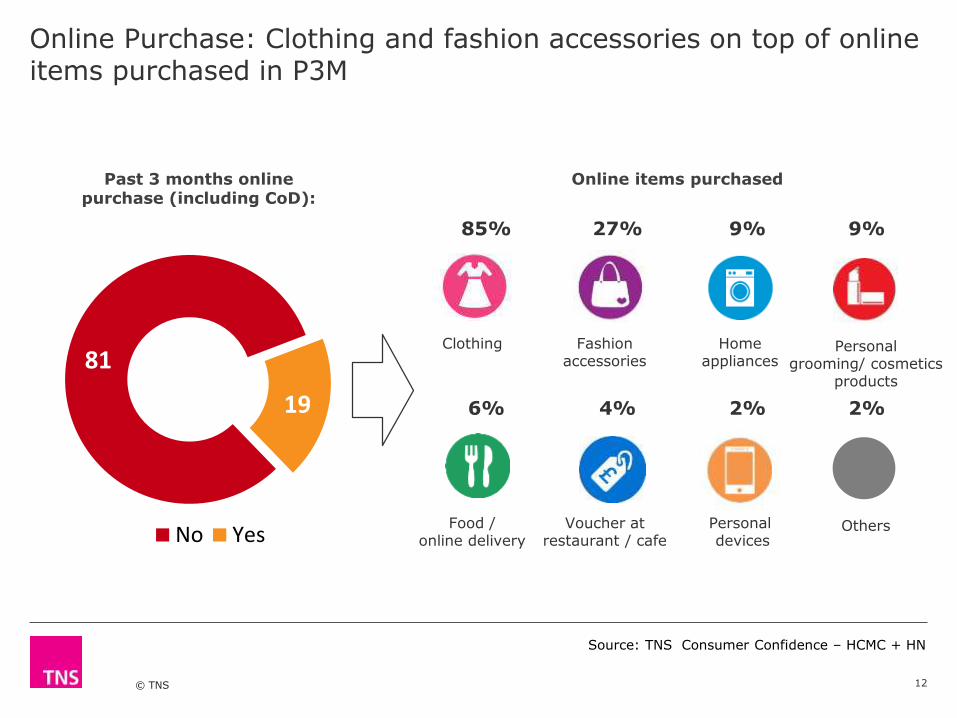
Online Purchase: Clothing and fashion accessories on top of online items purchased in P3M
12
81
19
No Yes
Past 3 months online purchase (including CoD):
85%
Clothing
27% 9% 9%
Fashion accessories
Home appliances
Personal grooming/ cosmetics
products
6%
Food / online delivery
4% 2% 2%
Voucher at restaurant / cafe
Personaldevices
Others
Online items purchased
Source: TNS Consumer Confidence – HCMC + HN
© TNS
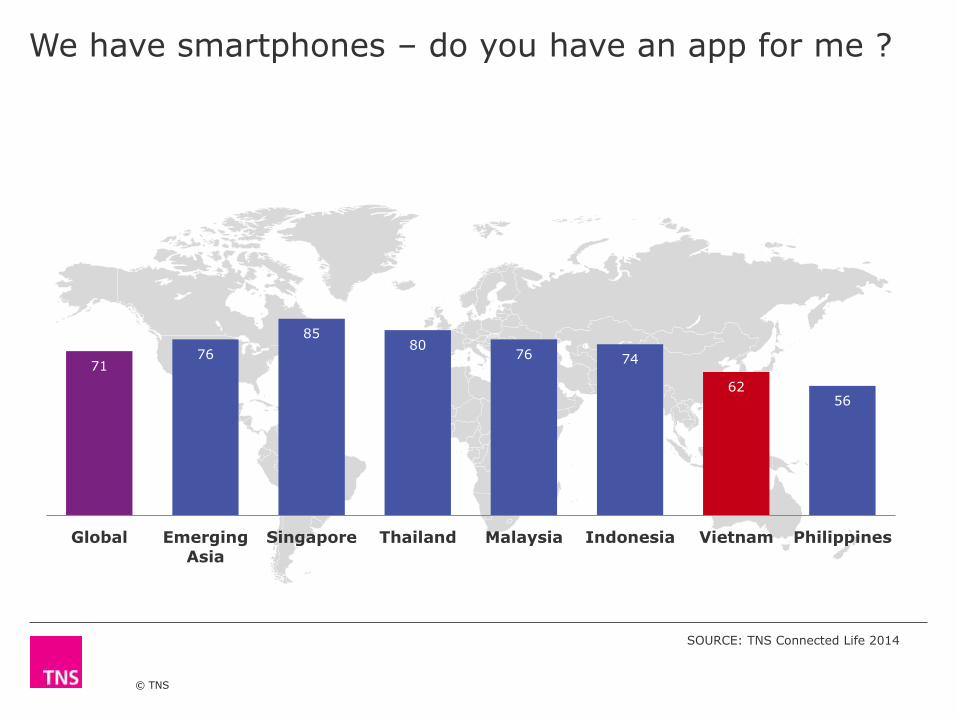
We have smartphones – do you have an app for me ?
SOURCE: TNS Connected Life 2014
7176
8580
76 74
6256
Global Emerging
Asia
Singapore Thailand Malaysia Indonesia Vietnam Philippines

© TNS
Digital
14
SOURCE: TNS Connected Life 2014
66%Urban
62%
12%
Internet penetration
Device ownership
52%
43%37%
Feature Phone
(National)
Smartphone TabletLaptopDesktop

© TNS
Relatively high online Video viewership: catching up on what we have missed all these years
46
SOURCE: TNS Connected Life 2014
Traditional TV and Online video usage
A1. Frequency of media consumption | C1. Frequency of activities | D2. Total time spent on mediaBase: Global- typical day(40,157) | Vietnam- typical day(645) Note: Classification of TV and online video consumption determined by frequency and volume of TV watching, and frequency of online videos. TV hours and video frequency on axis represent the lowest and highest points for each metric. See definitions page for details.
Heavy online videos, Heavy TVHeavy online videos, Light TVLight online videos, Heavy TVLight online videos, Light TV
Online video consumption
TV consumption
Argentina
AustraliaAustria
Brazil
Canada
China
Colombia
Denmark
EgyptFrance
GermanyGhana
Greece
Hong Kong
India
Indonesia
Israel
Italy
Kenya Malaysia
Mexico
Netherlands
New
Zealand
Nigeria
Norway
Philippines
PolandPortugal Russia
Saudi Arabia
Singapore
South Africa
South Korea
Spain
Sweden
Switzerland Taiwan
Thailand
Turkey
UAE
UK
USA
Vietnam
TV consumption
Heavy online videosMax. 8.8 times a week
Light online videosMin. 2.6 times a week
Heavy TVMax. 3.0 hrs daily
Light TVMin. 0.8 hrs daily
© TNS
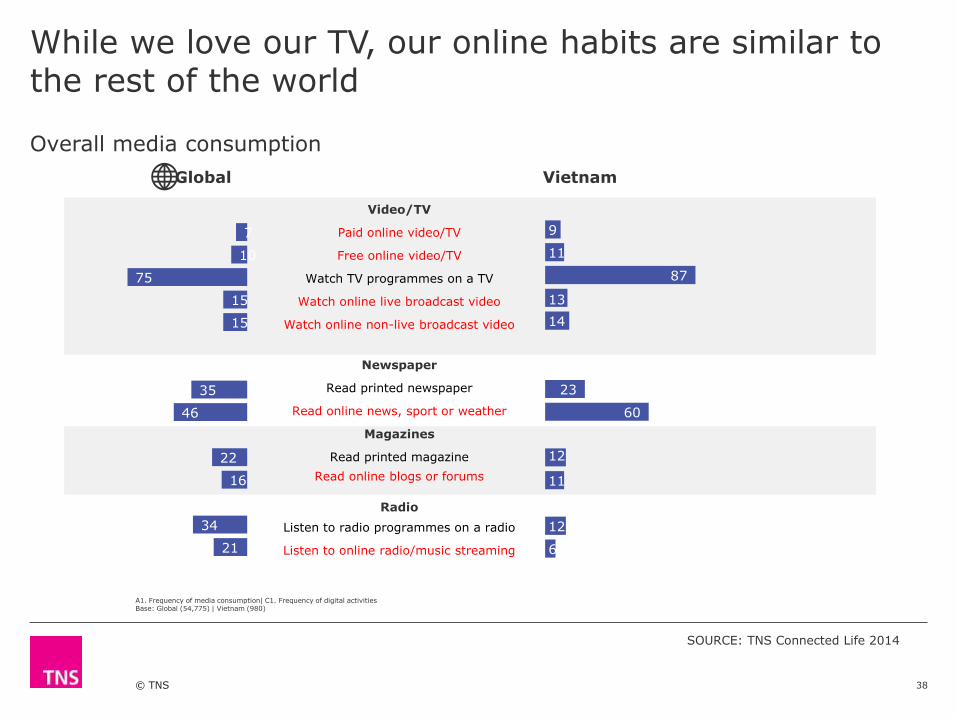
While we love our TV, our online habits are similar to the rest of the world
Overall media consumption
A1. Frequency of media consumption| C1. Frequency of digital activitiesBase: Global (54,775) | Vietnam (980)
38
SOURCE: TNS Connected Life 2014
7
10
75
15
15
35
46
22
16
34
21
9
11
87
13
14
23
60
12
11
12
6
Global Vietnam
Video/TV
Paid online video/TV
Free online video/TV
Watch TV programmes on a TV
Watch online live broadcast video
Watch online non-live broadcast video
Newspaper
Read printed newspaper
Read online news, sport or weather
Magazines
Read printed magazine
Read online blogs or forums
Radio
Listen to radio programmes on a radio
Listen to online radio/music streaming

© TNS
We love online News, Social Networks & Gaming
52
SOURCE: TNS Connected Life 2014
28
6
13
14
10
9
24
21
15
15
9
7
60
4
1
46
8
6
42
16
12
6
Global Vietnam
%
C1. Frequency of activitiesBase: Global (54,775) | Vietnam (980)
55
11
9
3
Information seeking
Reading news, sports or weather
Visit e-learning or education site
Access info from local government
Entertainment
Play games via a mobile/tablet
Stream music/radio online
Watch live video online
Watch recorded/on-demand video online
Play games on website/console
Watch paid TV/movie online
Social
Accessing social networks
Visit blogs/forums
Upload photos, video or music online
Write my own blog

© TNS
TV compliments Lunch/ Dinner, online Videos all other time
45
SOURCE: TNS Connected Life 2014
0
25
50
75
100
In bedwhen I
wake up
Earlymorning
Latemorning
Duringlunch
Earlyafternoon
Lateafternoon
Earlyevening
Duringdinner
Lateevening
In bedbefore I go
to sleep
Watch TV programme on a TV Watch videos/TV shows or movies on a device
How traditional TV and online videos are consumed throughout the day
D3. Device/media usage by daypart | D4. Activities by daypartBase: Vietnam- typical day (648)
Reach %

© TNS
Affinity for TV advertising decreasing continuously
19
SOURCE: TNS Vietcycle Report 2014
45
40
3332
24
The products advertised the most on TV are always the best product
to buy
2001 2004 2008 2011 2014
Top-2-box agreement (%):

© TNS
What catches the consumerattention

© TNS
Authenticity matters
Yes!“I need to know the
companies where the
products or services are
from so I have confidence
to use them”
GUARANTEE
QUALITY / SAFETY
Authenticity will become paramount for brands as they look to regain credibility and trust. Consumers have lost a great deal of faith in brands; they are searching for truths and clamouring for transparency.
© TNS
Mobile device as the everything hub
Absolutely!
DEVELOP YOUTH
APPLICATIONS FOR
YOUR BUSINESS
As the availability of wireless broadband
expands & the cost of advanced mobile phones drop, the mobile device will
become the preferred hub for digital activity.
© TNS
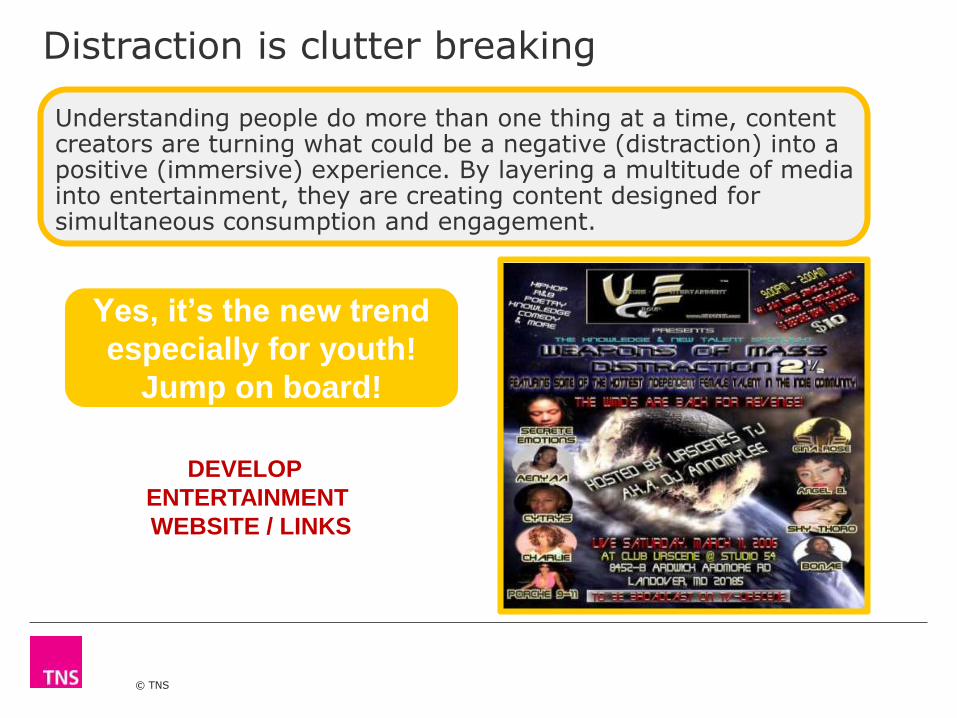
Distraction is clutter breaking
Yes, it’s the new trend
especially for youth!
Jump on board!
DEVELOP
ENTERTAINMENT
WEBSITE / LINKS
Understanding people do more than one thing at a time, content creators are turning what could be a negative (distraction) into a positive (immersive) experience. By layering a multitude of media into entertainment, they are creating content designed for simultaneous consumption and engagement.

© TNS
Tet Spending 2015

© TNS
2015: Relatively higher willingness to spend
25
13 46 41 12015
17 38 37 82014
Less The same More Don't know
Consumer’s overall intention to spend more or less in 2015:
Source: TNS Consumer Confidence – HCMC + HN

© TNS
Households across HCMC and Hanoi intending to spend around VND 10million over the Tet period
26
VND 9,661,623
VND 11,286,087
VND 13,934,133 VND 14,159,465
HCM City Hanoi
Intended Tet spending
Average monthly household income
Intended spendfor Tet
Intended amount to be spent during Tet per urban household:
VND 9,918,276
Source: TNS Consumer Confidence – HCMC + HN

© TNS
Above VND 20mil
VND 13.5mil – VND 20mil
VND 8.5mil – VND 13.5mil
VND 5.5mil – VND 8.5mil
VND 3mil – VND 5.5mil
Below VND 3mil
Monthly HouseholdIncome 2014
HouseholdTet spending
Approximately 1 month of income is spent on Tet
Income/ Spend Range
4
3
24
37
17
12
55
13
20
30
21
11
Source: TNS Consumer Confidence – HCMC + HN

© TNS
The majority of the household Tet spend will go to the household, however a significant portion of Tet spending – around USD 300 –will go to gifts for others.
28
31Percentage of overall Tet spending that households will use for gifting others, including food, drink and lucky money
69Percentage of overall Tet
spending that households will use to buy things for
their for their own personal and household
consumption
Intended amount to be spent during Tet per urban household:
Source: TNS Consumer Confidence – HCMC + HN

© TNS
Food & beverage will make up a large proportion of household spending, followed by clothing & accessories. In terms of gifting, food & beverage also the biggest contributor. Lucky money to contribute around 10% - ~ VND 1 million - of total household Tet spending.
29
29
10
9
7
3
18
9
6
3
15
7
6
2
5
4
1
2
Food & Beverage
Food
Beer
Non-alcoholic beverages
Spirits/ liquor
Clothing & accessories
Clothing
Fashion accessories
Personal grooming
Home
Entertainment & dining out
Home improvement
Home appliances
Transport
Transportation to hometown
Travelling for pleasure
Other
15
4
3
2
6
10
6
Food & Beverage
Food
Non-alcoholic beverages
Spirits/ liquor
Beer
Lucky money
Support family for
celebrations
Breakdown of household Tet spending %: Breakdown of Tet gifting spending:
69%Household
spend
31%Tet Gifting
VND 9.9 million
Source: TNS Consumer Confidence – HCMC + HN
© TNS
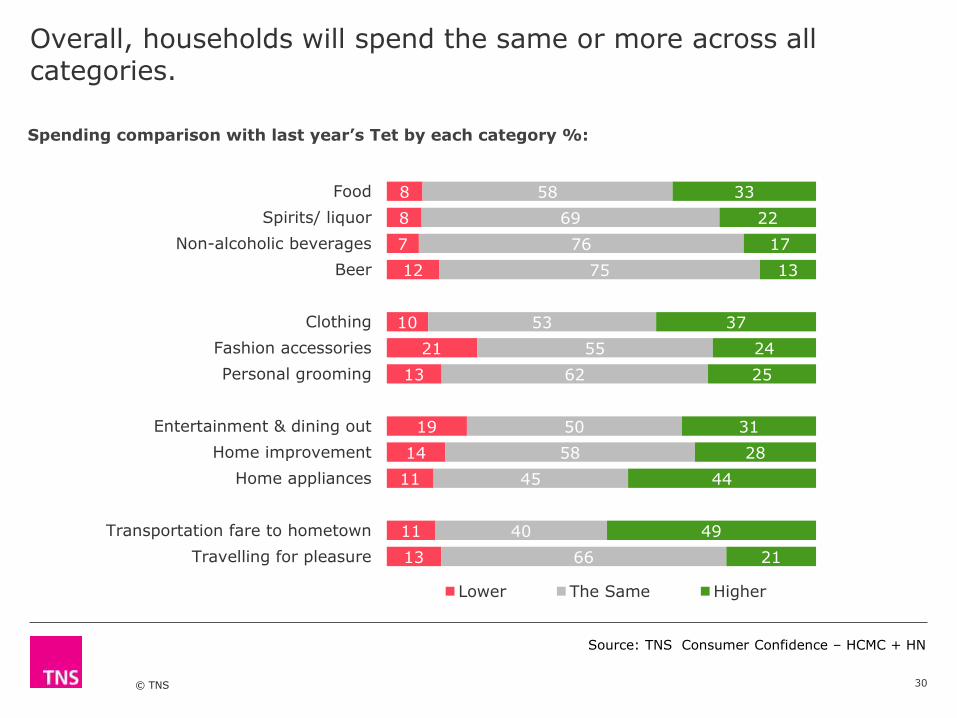
Overall, households will spend the same or more across all categories.
30
Spending comparison with last year’s Tet by each category %:
8
8
7
12
10
21
13
19
14
11
11
13
58
69
76
75
53
55
62
50
58
45
40
66
33
22
17
13
37
24
25
31
28
44
49
21
Food
Spirits/ liquor
Non-alcoholic beverages
Beer
Clothing
Fashion accessories
Personal grooming
Entertainment & dining out
Home improvement
Home appliances
Transportation fare to hometown
Travelling for pleasure
Lower The Same Higher
Source: TNS Consumer Confidence – HCMC + HN

© TNS
The majority of consumers planning to spend the duration of their Tet holiday at home with family.
31
How consumers plan on spending their Tet holiday %:
85
77 0
I'll stay in my hometown and stay there withfamily for the duration of the Tet holiday.
I'll stay in my hometown for a couple of days thengo travelling somewhere in Vietnam for pleasure.
Due to economic difficulties, this year I will not goback to my hometown.
I'll stay in my hometown for a couple of days thengo travelling somewhere overseas for pleasure.
Source: TNS Consumer Confidence – HCMC + HN

© TNS
Summary
32
1. Consumer Confidence - New level of optimism owing to stability, less uncertainty, lower fuel prices.
2. FMCG – last year has been challenging, with lots of brands competing for stagnant category volume. 2015 will be about winning the battle at the last mile and winning shoppers at the point of sale. Strong local brands should consider ASEAN potential.
3. Consumer Spending – with growing incomes and consumer confidence, savings are coming down and discretionary spending on Food & entertainment, OTC, Education growing up
4. Digitally savvy – high acceptance of e-commerce and COD, fast emerging as an emerging channel in HCMC & Hanoi for Fashion, Technology and value deals.
5. Tet spending is likely to be flat for most categories. Increased spending on Clothes, Food & Beverages, Home appliances and Travel.
