consumer directed community supports survey -...
TRANSCRIPT
1
Consumer DirectedCommunity Supports
Survey
Minnesota Governor’s Council onDevelopmental Disabilities
May 2002
2MarketResponse International
This project was financed in part by grant numberG0001MNBS24 and 90DF005601 from theDepartment of Health and Human Services,Administration on Developmental Disabilities,under provisions of Public Law 106-402. Contentof this project does not necessarily reflect theposition or policy of the Administration onDevelopmental Disabilities or the MinnesotaDepartment of Administration.
3MarketResponse International
I. Table of Contents . . . . . . . . . . . . . . . . . . . . . . 3
II. Executive Summary. . . . . . . . . . . . . . . . . . . . . 4
III. Project Overview. . . . . . . . . . . . . . . . . . . . . . . . 6
IV. Overall Satisfaction with CDCS Program . . . . . 8
V. Program Benefits. . . . . . . . . . . . . . . . . . . . . . Ê21
Appendix: Respondent Profile. . . . . . . . . . . . . . . . 29
I. Table of ContentsPage

4MarketResponse International
II. Executive Summary
5MarketResponse International
The Consumer Directed Community Supports (CDCS) program has been very successfuland highly appreciated by its participants -- 93% are satisfied with the overall program.Participants’ satisfaction is driven mostly by their relationship with their county socialservices department, as well as their belief that the program is flexible, allocates money better within the system, and decreases their overall stress level.
CDCS is clearly the best option that has come along for individuals with developmentaldisabilities who have access to a support network of family and friends needed tosuccessfully participate. The program should continue to expand to the rest of thecounties in the state, as well as to groups not currently participating in the program.
This does not mean, however, that the program cannot be improved. There are dramatic differences in participant satisfaction and in the ways that the program has been implemented across the counties. Counties have identified inconsistencies in theirapproaches, but have responded to this issue mainly by increasing the guidelines andlimiting the flexibility of the program. The counties need to establish a model that provides consistency but maintains the individual’s self direction opportunities.
Keys to maintaining CDCS as a successful program are maintaining flexibility and keecultures and languages.
ping the program simple and understandable for participants of all abilities,
II. Executive Summary
6MarketResponse International
III. Project Overview

7MarketResponse International
In April, 2002, 2,444 survey questionnaires were mailed to individualsparticipating in the Consumer Directed Community Supports (CDCS)program offered by the Minnesota Department of Human Services (DHS).Addresses were provided by the DHS, and questionnaires were addressedto the individual participants -- at the addresses to which DHS-related,CDCS financial documents are sent for them.
Program participants were informed that the survey was confidential.There was no method employed to track an individual response to aparticular individual.
650 surveys were returned for an overall response rate of 27%. 53 surveyswere returned for an incorrect address or addressee not known.
The survey was developed based on interviews with stakeholders in theCDCS program: county social services managers, county case managers /social workers, fiscal intermediaries, and individuals with a developmentaldisability and their families. Additionally, comments and quotes in thisreports are supplemented by information gathered in these personalinterviews.
III. Project Overview- Survey Process -
8MarketResponse International
IV. Overall Satisfaction

9MarketResponse International
• CDCS has changed people’s lives: It is clear that CDCS is a very powerful program that hasdramatically changed the lives of many of its participants and should be continued and expanded.
• Satisfaction and Likelihood to Recommend rated highly: 93% of CDCS participants are satisfied with the program, and 88% are more than somewhat likely to recommend this program to a friend who finds him/herself in a similar situation. This means that knowing what they know about this program, these people believe that it is the best option out there for individuals and families with developmental disabilities.
• Most participants’ expectations have been met: 73% of CDCS participants say that theprogram has more than met their expectations. This is a slightly lower number than for the otherquestions, but it is still strong. The distribution of answers on this question was much broader,however -- with 27% of participants saying that the program has merely met or has failed theirexpectations.
• CDCS has significant opportunities for improvement: From both the quantitative andqualitative analysis, it is clear there are dramatic differences in the ways this program has beenimplemented by the various counties and fiscal intermediaries. This has created inconsistencies indecision making and put pressure on the individual and family to find ways to successfully workwithin the system to make this program meet their needs.
• The flexibility of the program is in jeopardy: A quality program should strive to eliminateinconsistencies in delivery. The counties have identified this need and recognize inconsistency intheir decision making. The general response from the counties, however, has been to addrestrictions. Taking away this flexibility will eliminate the most inportant benefit fo this program and some participants have already begun to experience frustration with this. (See driving factors of overall satisfaction).
IV. Overall Satisfaction with CDCS Program- Summary -
10MarketResponse International
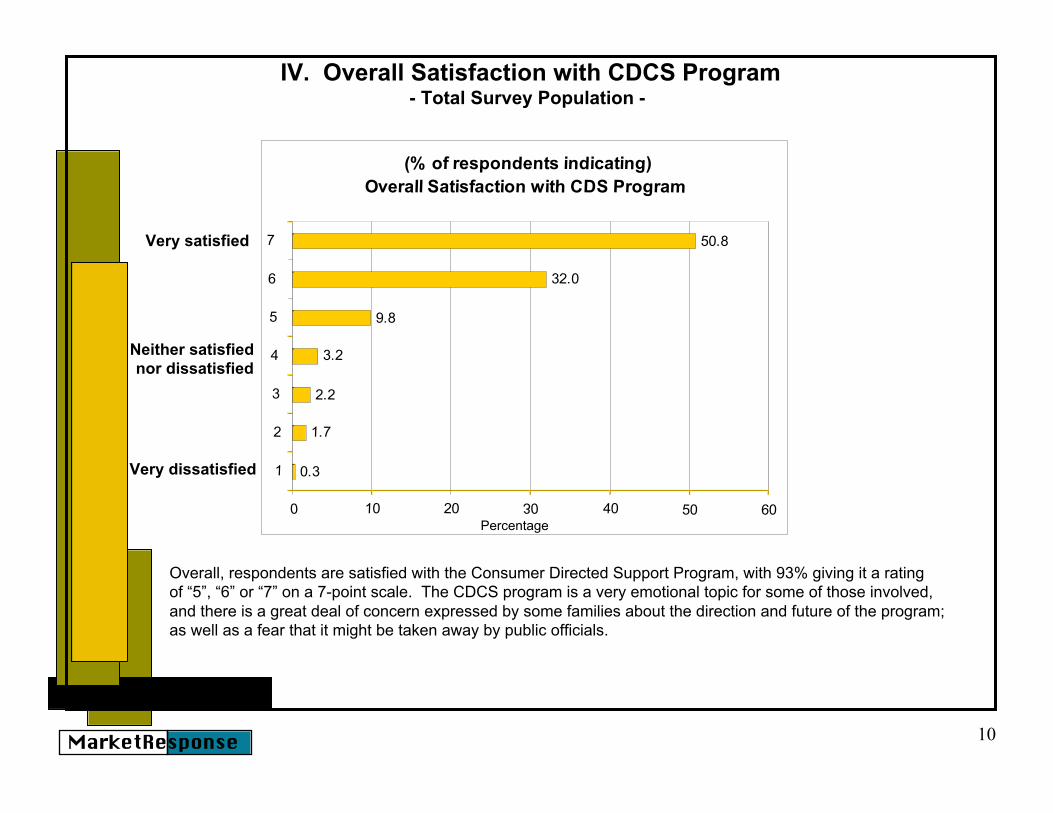
IV. Overall Satisfaction with CDCS Program- Total Survey Population -
Overall Satisfaction with CDS Program (% of respondents indicating)
0.3
1.7
2.2
3.2
9.8
32.0
50.8
010 20
3040 50 60
1
2
3
4
5
6
7Very satisfied
Neither satisfiednor dissatisfied
Very dissatisfied
Overall, respondents are satisfied with the Consumer Directed Support Program, with 93% giving it a rating of “5”, “6” or “7” on a 7-point scale. The CDCS program is a very emotional topic for some of those involved, and there is a great deal of concern expressed by some families about the direction and future of the program; as well as a fear that it might be taken away by public officials.
Percentage
11MarketResponse International
Likelihood to Recommend CDS Program (% of respondents indicating)
1.1
0.6
0.9
3.5
5.7
21.3
66.8
0 10 20 30 40 50 60 70 80
1
2
3
4
5
6
7Very likely
Neither likelynor unlikely
Very unlikely
Percentage
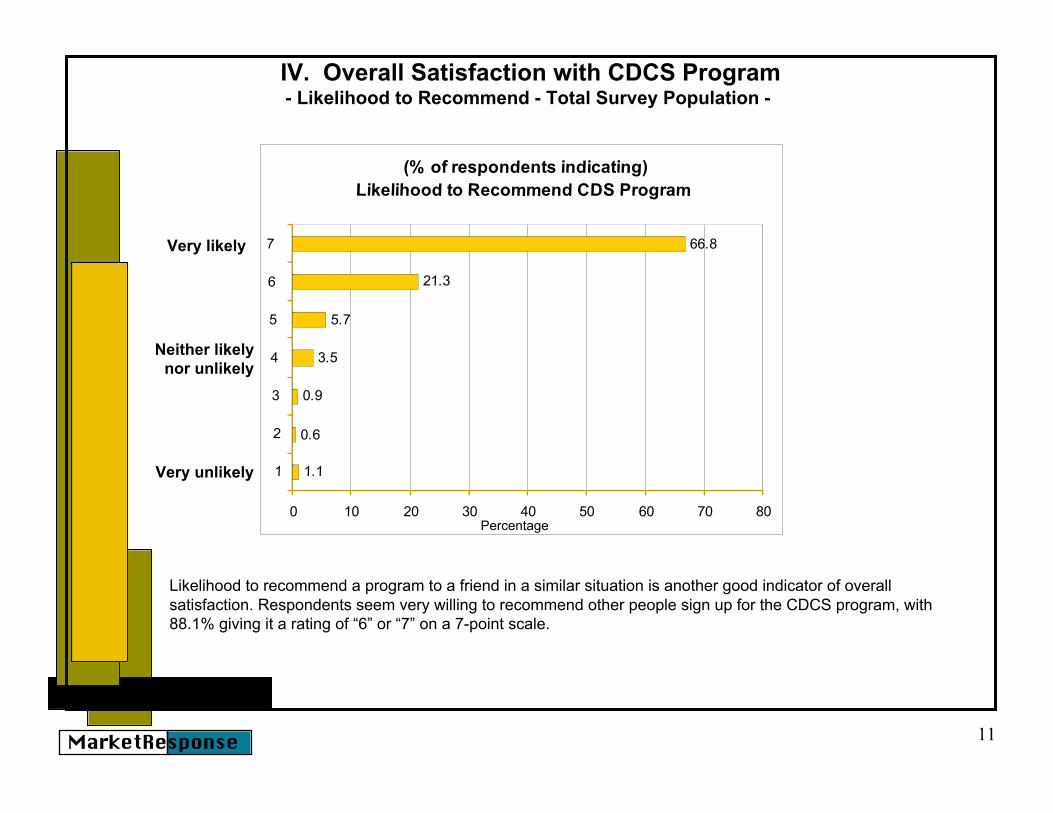
IV. Overall Satisfaction with CDCS Program- Likelihood to Recommend - Total Survey Population -
Likelihood to recommend a program to a friend in a similar situation is another good indicator of overallsatisfaction. Respondents seem very willing to recommend other people sign up for the CDCS program, with88.1% giving it a rating of “6” or “7” on a 7-point scale.
12MarketResponse International
Has CDS met expectations set by County (% of respondents indicating)
2.2
2.1
4.8
18.2
9.9
27.4
35.4
0 5 10 15 20 25 30 35 40
1
2
3
4
5
6
7Exceededexpectations
Met expectations
Failedexpectations
Percentage
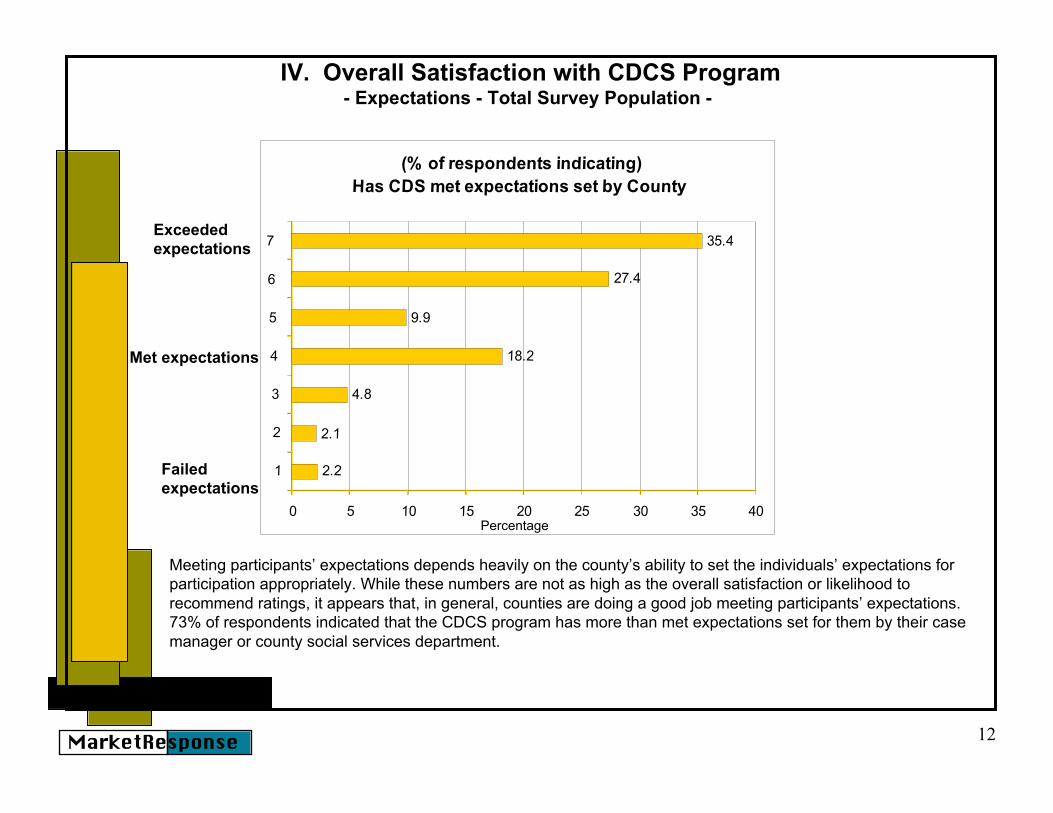
IV. Overall Satisfaction with CDCS Program- Expectations - Total Survey Population -
Meeting participants’ expectations depends heavily on the county’s ability to set the individuals’ expectations forparticipation appropriately. While these numbers are not as high as the overall satisfaction or likelihood torecommend ratings, it appears that, in general, counties are doing a good job meeting participants’ expectations.73% of respondents indicated that the CDCS program has more than met expectations set for them by their casemanager or county social services department.
13MarketResponse International
The Problem Definition Tree Representation (see appendix) is an analysisthat groups respondents into clusters that represent the best explanation oftheir responses to the overall satisfaction question based upon theirresponses to other questions in the survey.
This analysis gives us an indication of which questions are most closelyrelated to a respondent’s overall satisfaction.
Questions taken into consideration for this analysis were:– Consumer Directed Supports questions related to quality of life,
environment, flexibility, staffing, individual development, and the system
– Overall satisfaction questions for the county social services, county casemanager, and fiscal intermediary
– Overall satisfaction questions for independence, productivity, integration,inclusion, and self-determination
IV. Overall Satisfaction with CDCS Program- Problem Definition Tree Representation -
14MarketResponse International
From this analysis, it is clear that the most important factor in determining theoverall satisfaction with the program, is the participant’s overall satisfactionwith his/her county social services department.
Other contributing factors include the participant’s agreement that– the program provides more flexibility,
– money is being better allocated,
– and the program has reduced the participant’s/family’s stress levels.
These factors combine to explain 50% of the variance in overall satisfactionresponses (which is good for this type of analysis). If a person agrees withthese statements, he/she is likely to have higher overall satisfaction.
IV. Overall Satisfaction with CDCS Program- Driving Factors -
15MarketResponse International
These three factors (flexibility, better allocation of money, and stressreduction) had relatively highly rated responses -- with participants agreeingthat these are benefits that have been realized through the CDCS program.However, if a person tends to disagree with these statements, he/she is likelyto have much lower overall satisfaction.
For example, if a participant rated his/her overall satisfaction with countysocial services as a “7” out of 7, and rated his/her level of agreement with theprogram providing flexibility as a “5” out of 5 -- the average rating for overallsatisfaction for respondents who answered similarly(Group 7) was anextremely high 6.9 out of 7.0. On the other hand, if a participant rated his/heroverall satisfaction with county social services anywhere from “1” to ”5” out of7, and rated his/her level of agreement with the program providing flexibilityas anywhere from “1” to “3” out of 5 -- the average rating for overallsatisfaction for respondents who answered similarly (Group 1) was arelatively low 4.0 out of 7.0.
IV. Overall Satisfaction with CDCS Program- Driving Factors -
16MarketResponse International
The program has given me more flexibility to meet my specific needs
The term “Consumer Directed” implies that the individual will have some control over how money will be spent,rather than some sort of government agency, social worker, or institution making all the decisions regardingtherapies, living arrangements, activities, education, etc. for the individual or family. One of the greatest benefitsthat we heard from program participants was CDCS’s ability to give people the power to make decisionsaccording to their specific needs.
The [old] system was trying to fit a square peg in a round hole. It was designed for people with obvious physical disabilities.CDCS has helped us design something to fit the specific needs of our child -- you don’t have to deal with a bunch of stuff thatisn’t quite right.
People who are not as satisfied with the flexibility given them by the program, are likely upset by a perceptionthat the implementation of the program has moved away from the original idea of self-determination, which wasintended by the program.
In spirit, the CDCS program is on the forefront of what social care should be. The administration of it is not following the spirit,however. The county doesn’t want the parent to make choices. They give “guidelines” and caps and we are back to theoriginal waiver situation where you are spending money on things you don’t need.
The county is saying “we know what’s right for you - you come begging to us.” The program was designed to promote self-direction and individual planning. It doesn’t resemble its intent. You can file an appeal, but it’s complicated. We’ve had threedifferent sets of guidelines in the past year and the fourth is on the table. They keep excluding things. It’s becoming moreregimented and less self-directed.
IV. Overall Satisfaction with CDCS Program- Driving Factors - Flexibility -
17MarketResponse International
Money is being better allocated within the system
The allocation of money is closely related to flexibility, but implies that the funding is going for products andservices that more directly benefit the individual with a developmental disability. This has had a huge impact onmany people’s ability to obtain the things they need.
Prior to CDCS, we were only able to receive 6 hours/week of direct care staff and $3000 - $5000 in adaptive equipment(depending on whether we were fully staffed). The staff was paid $8/hr. We had one staff person for a year, the rest of the timewe had a variety of staff. We had gone for weeks without staff and we had to pay for all their training. Now, we are able to get12 hours / week of staffing, 48 days respite, and $10,500 worth of equipment and environmental modifications and we’ve knownour staff for three years.
However, some people are extremely frustrated by the counties that promised them hope. They feel there isstill a large bureaucracy and that the counties might be benefiting more than they are.
The county got the money by making these promises to the federal government. Now they are playing god. They got all of uson the waiver because it was a huge savings to the county since they don’t have to use county money to pay for PCA services.
There are also issues with purchases being “defensible to the taxpayer”, parental fees, caps on certainallocations such as activities or equipment purchases, and the reimbursement process which may havenegatively affected people’s responses to this statement.
IV. Overall Satisfaction with CDCS Program- Driving Factors - Better Allocation of Money -
18MarketResponse International
This program had reduced my (or my family’s) overall stress level -- life is easier
Another important promise that this program had was an increased quality of life for the individuals and theirfamilies. Dealing with all the government agencies involved when you have a developmental disability can beoverwhelming. Having a child with a developmental disability can add a lot of pressure onto a family.This program has helped many individuals and families achieve a quality of life they thought impossible.
It has alleviated a ton of stress from our family. We are not just watching our son foundering. This had created a domino effectof stress though the family structure. The divorce rate is very high among families with children with developmental disabilities.I would expect to see a significant difference under this program.
It gives you time to be a parent and not just a staff person.
For some folks, however, the CDCS program has added a new layer of stress to an already difficult situation.
They made promises. This is an emotional roller coaster. We work very hard to develop the plans and then half the stuff isrefused. It’s very draining. People get hope and then they take it away.
IV. Overall Satisfaction with CDCS Program- Driving Factors - Stress Reduction -
19MarketResponse International
IV. Overall Satisfaction with CDCS Program- Key Demographic Factors -
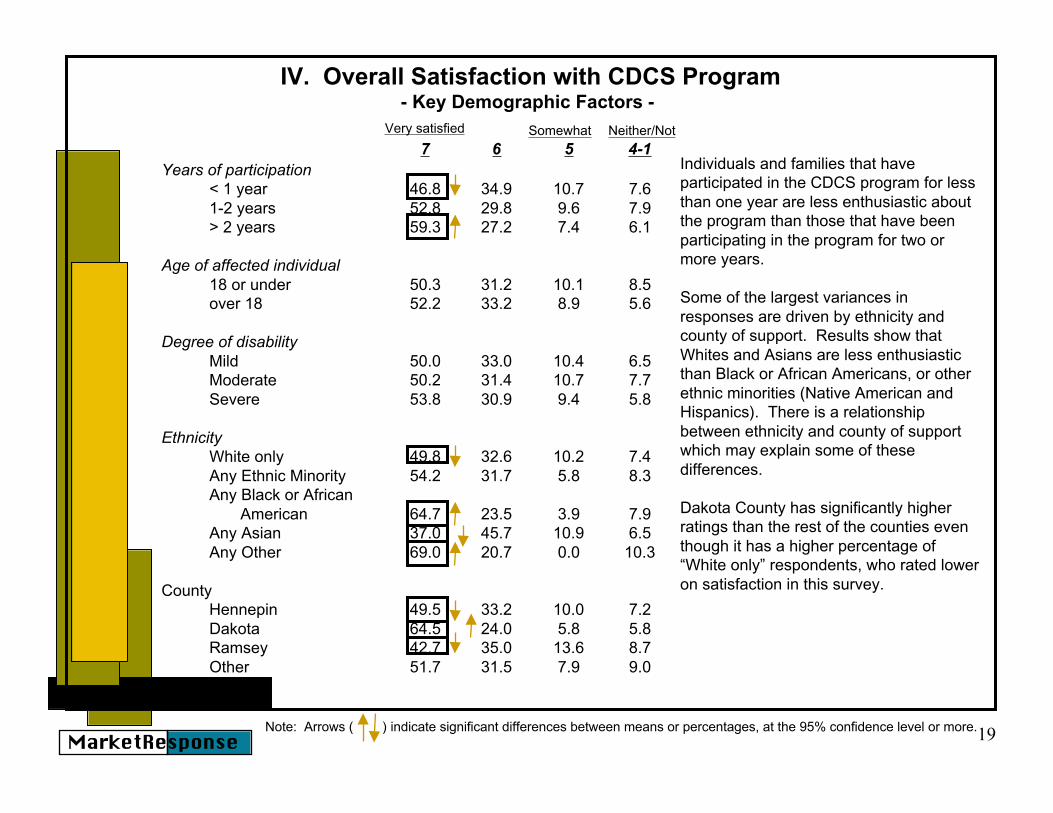
Years of participation< 1 year 46.8 34.9 10.7 7.61-2 years 52.8 29.8 9.6 7.9> 2 years 59.3 27.2 7.4 6.1
Age of affected individual18 or under 50.3 31.2 10.1 8.5over 18 52.2 33.2 8.9 5.6
Degree of disabilityMild 50.0 33.0 10.4 6.5Moderate 50.2 31.4 10.7 7.7Severe 53.8 30.9 9.4 5.8
EthnicityWhite only 49.8 32.6 10.2 7.4Any Ethnic Minority 54.2 31.7 5.8 8.3Any Black or African American 64.7 23.5 3.9 7.9Any Asian 37.0 45.7 10.9 6.5Any Other 69.0 20.7 0.0 10.3
CountyHennepin 49.5 33.2 10.0 7.2Dakota 64.5 24.0 5.8 5.8Ramsey 42.7 35.0 13.6 8.7Other 51.7 31.5 7.9 9.0
Very satisfied
Note: Arrows ( ) indicate significant differences between means or percentages, at the 95% confidence level or more.
7 6 5 4-1Somewhat Neither/Not
Individuals and families that haveparticipated in the CDCS program for lessthan one year are less enthusiastic aboutthe program than those that have beenparticipating in the program for two ormore years.
Some of the largest variances inresponses are driven by ethnicity andcounty of support. Results show thatWhites and Asians are less enthusiasticthan Black or African Americans, or otherethnic minorities (Native American andHispanics). There is a relationshipbetween ethnicity and county of supportwhich may explain some of thesedifferences.
Dakota County has significantly higherratings than the rest of the counties eventhough it has a higher percentage of“White only” respondents, who rated loweron satisfaction in this survey.

20MarketResponse International
IV. Overall Satisfaction with CDCS Program- Impact of individual budget/fee on Overall Satisfaction -
Current annual budget % % %Less than $25,000 83 8 9$25,000 - $31,999 83 10 7$32,000 - $37,999 89 5 6$38,000 - $45,999 85 10 5$46,000 or more 77 13 10
Pay parental feeYes 82 11 7No 83 9 8
Amount of parental fee$300 or less 77 9 12$301 - $2099 85 5 7$2100 - $4199 84 5 7$4200 or more 80 15 5
Very Satisfied
7-6 5 4-1Somewhat Neither/Not
At a total-sample level, there does notappear to be a correlation between theindividual’s annual budget, whether theypay a parental fee, and the amount of thatfee, with the individual’s overallsatisfaction.
This does not mean that the budget andfees are not important, only that there areother factors that carry more weight onoverall satisfaction.
21MarketResponse International
V. Program Benefits
22MarketResponse International
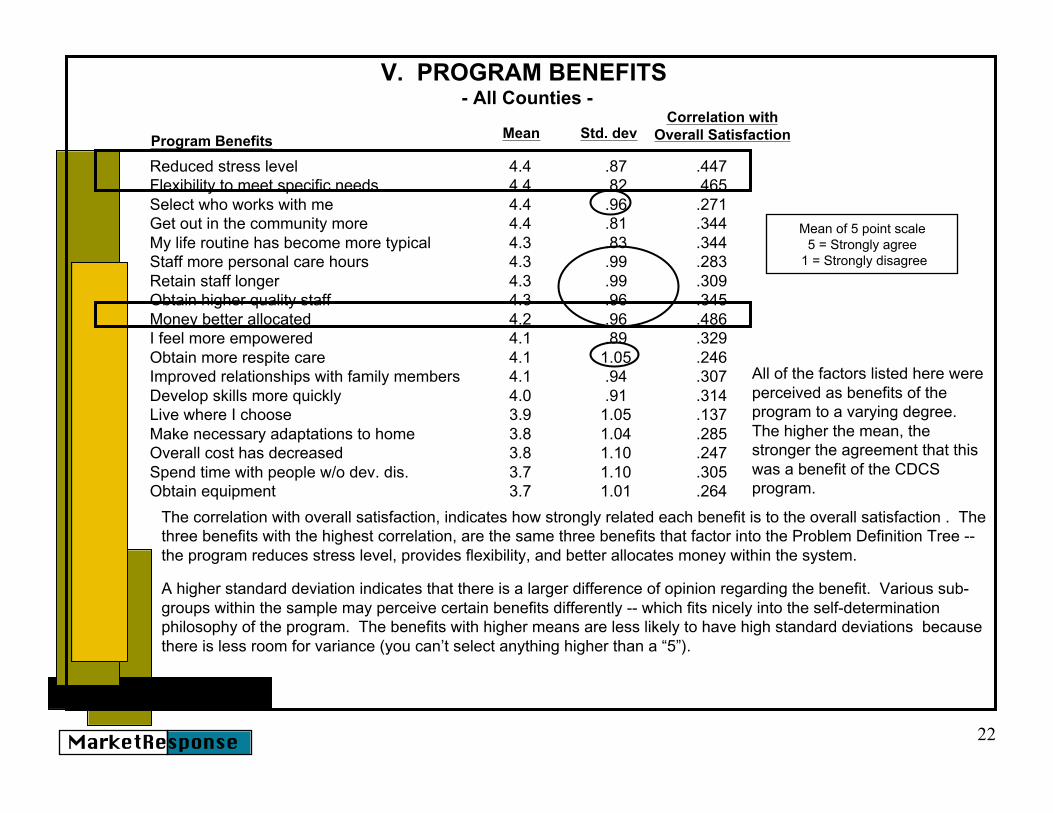
V. PROGRAM BENEFITS- All Counties -
Reduced stress level 4.4 .87 .447Flexibility to meet specific needs 4.4 .82 .465Select who works with me 4.4 .96 .271Get out in the community more 4.4 .81 .344My life routine has become more typical 4.3 .83 .344Staff more personal care hours 4.3 .99 .283Retain staff longer 4.3 .99 .309Obtain higher quality staff 4.3 .96 .345Money better allocated 4.2 .96 .486I feel more empowered 4.1 .89 .329Obtain more respite care 4.1 1.05 .246Improved relationships with family members 4.1 .94 .307Develop skills more quickly 4.0 .91 .314Live where I choose 3.9 1.05 .137Make necessary adaptations to home 3.8 1.04 .285Overall cost has decreased 3.8 1.10 .247Spend time with people w/o dev. dis. 3.7 1.10 .305Obtain equipment 3.7 1.01 .264
All of the factors listed here wereperceived as benefits of theprogram to a varying degree.The higher the mean, thestronger the agreement that thiswas a benefit of the CDCSprogram.
MeanCorrelation with
Overall Satisfaction
Mean of 5 point scale5 = Strongly agree
1 = Strongly disagree
Std. dev
The correlation with overall satisfaction, indicates how strongly related each benefit is to the overall satisfaction . Thethree benefits with the highest correlation, are the same three benefits that factor into the Problem Definition Tree --the program reduces stress level, provides flexibility, and better allocates money within the system.
A higher standard deviation indicates that there is a larger difference of opinion regarding the benefit. Various sub-groups within the sample may perceive certain benefits differently -- which fits nicely into the self-determinationphilosophy of the program. The benefits with higher means are less likely to have high standard deviations becausethere is less room for variance (you can’t select anything higher than a “5”).
Program Benefits
23MarketResponse International
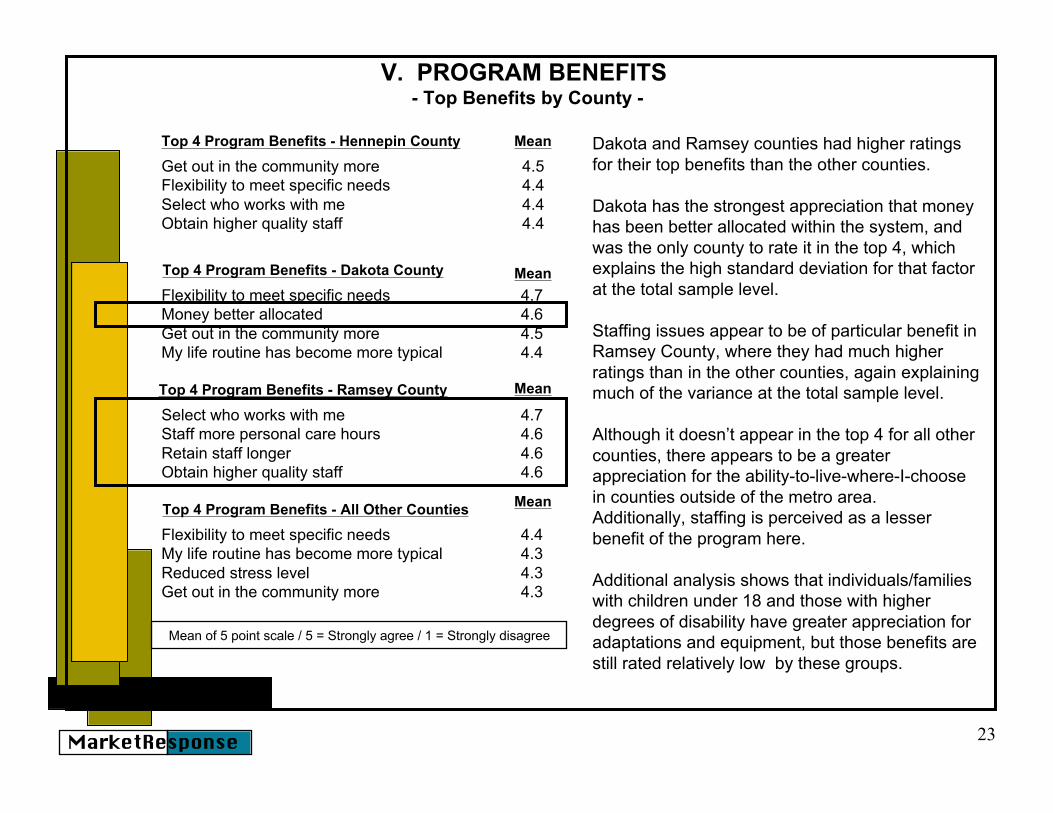
V. PROGRAM BENEFITS- Top Benefits by County -
Get out in the community more 4.5Flexibility to meet specific needs 4.4Select who works with me 4.4Obtain higher quality staff 4.4
Dakota and Ramsey counties had higher ratingsfor their top benefits than the other counties.
Dakota has the strongest appreciation that moneyhas been better allocated within the system, andwas the only county to rate it in the top 4, whichexplains the high standard deviation for that factorat the total sample level.
Staffing issues appear to be of particular benefit inRamsey County, where they had much higherratings than in the other counties, again explainingmuch of the variance at the total sample level.
Although it doesn’t appear in the top 4 for all othercounties, there appears to be a greaterappreciation for the ability-to-live-where-I-choosein counties outside of the metro area.Additionally, staffing is perceived as a lesserbenefit of the program here.
Additional analysis shows that individuals/familieswith children under 18 and those with higherdegrees of disability have greater appreciation foradaptations and equipment, but those benefits arestill rated relatively low by these groups.
Mean
Mean of 5 point scale / 5 = Strongly agree / 1 = Strongly disagree
Top 4 Program Benefits - Hennepin County
Flexibility to meet specific needs 4.7Money better allocated 4.6Get out in the community more 4.5My life routine has become more typical 4.4
MeanTop 4 Program Benefits - Dakota County
Select who works with me 4.7Staff more personal care hours 4.6Retain staff longer 4.6Obtain higher quality staff 4.6
MeanTop 4 Program Benefits - Ramsey County
Flexibility to meet specific needs 4.4My life routine has become more typical 4.3Reduced stress level 4.3Get out in the community more 4.3
MeanTop 4 Program Benefits - All Other Counties
24MarketResponse International
Appendix: Respondent Profile
25MarketResponse International
• Ethnically diverse sample: the survey has an ethnically diverse responsemaking it valid to project the results to the entire population of CDCS program participants.
• Changing set of needs: the demographics show that the newest people onCDCS are more likely to have autism and more likely to have higher householdincomes than people who have been on the program for more than two years,which may indicate a changing set of participant needs. CDCS must be capableof adapting as the base of consumers it serves changes -- especially as CDCSrolls out to more rural communities with different needs than the metro areacommunities.
• Ethnic differences between counties: there are significant differences in ethnicpopulations between the counties. Hennepin and Ramsey counties’ high ethnicpopulations and numbers of individuals with English as a second language,increases the importance for flexibility in budgetary decision-making, as well asthe need for simple, clear guidelines that can be easily explained and/ortranslated.
• Inconsistent budgets / fee structures: According to respondents, budget andfee structures vary dramatically from one county to the next. As much aspossible, confusion and/or differences in these structures should be minimized tosupport consistency of services from one county to another.
Appendix: Respondent Profile- Summary -
26MarketResponse International
Appendix: Respondent Profile- Age -
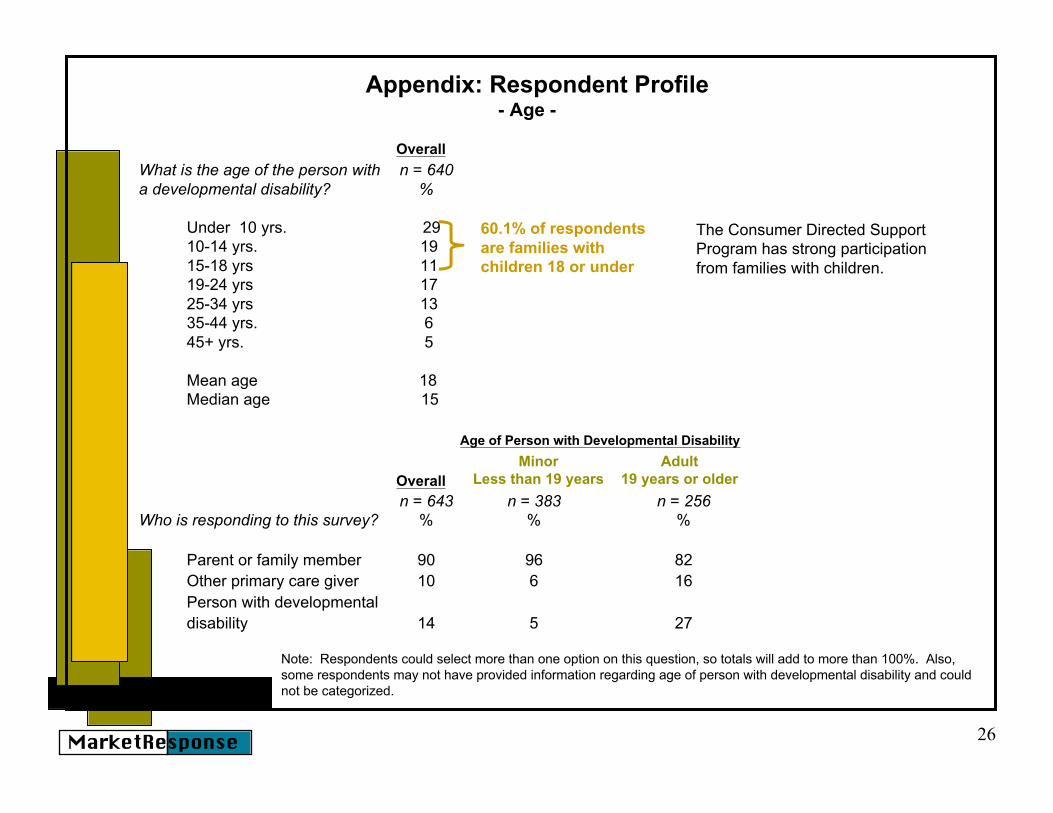
What is the age of the person with n = 640a developmental disability? %
Under 10 yrs. 2910-14 yrs. 1915-18 yrs 1119-24 yrs 1725-34 yrs 1335-44 yrs. 645+ yrs. 5
Mean age 18Median age 15
The Consumer Directed SupportProgram has strong participation from families with children.
Overall
60.1% of respondentsare families withchildren 18 or under
MinorLess than 19 years
Adult19 years or olderOverall
Age of Person with Developmental Disability
n = 643 n = 383 n = 256Who is responding to this survey? % % %
Parent or family member 90 96 82Other primary care giver 10 6 16Person with developmentaldisability 14 5 27
Note: Respondents could select more than one option on this question, so totals will add to more than 100%. Also,some respondents may not have provided information regarding age of person with developmental disability and couldnot be categorized.
27MarketResponse International
Appendix: Respondent Profile- Degree and Nature of Disability -
Mild ModerateOverall
Degree of Disability
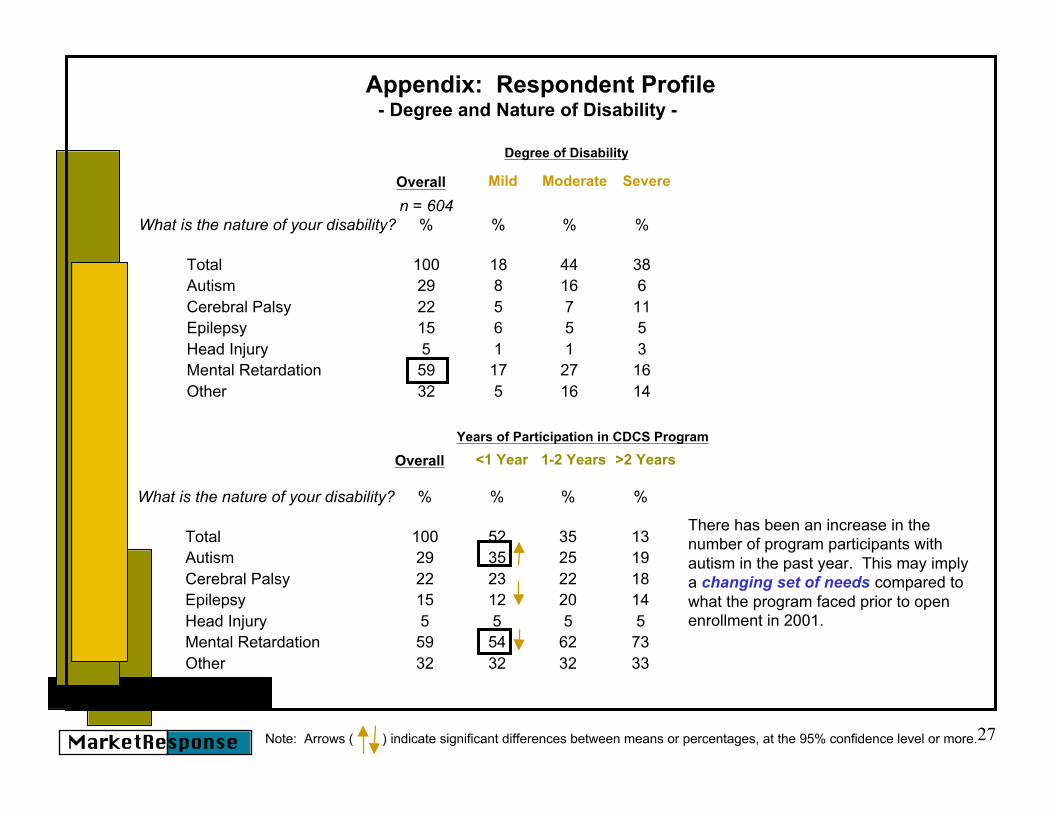
n = 604What is the nature of your disability? % % % %
Total 100 18 44 38Autism 29 8 16 6Cerebral Palsy 22 5 7 11Epilepsy 15 6 5 5Head Injury 5 1 1 3Mental Retardation 59 17 27 16Other 32 5 16 14
Severe
<1 Year 1-2 YearsOverall
Years of Participation in CDCS Program
What is the nature of your disability? % % % %
Total 100 52 35 13Autism 29 35 25 19Cerebral Palsy 22 23 22 18Epilepsy 15 12 20 14Head Injury 5 5 5 5Mental Retardation 59 54 62 73Other 32 32 32 33
>2 Years
Note: Arrows ( ) indicate significant differences between means or percentages, at the 95% confidence level or more.
There has been an increase in thenumber of program participants withautism in the past year. This may implya changing set of needs compared towhat the program faced prior to openenrollment in 2001.
28MarketResponse International
Appendix: Respondent Profile- County of Residence and Support -
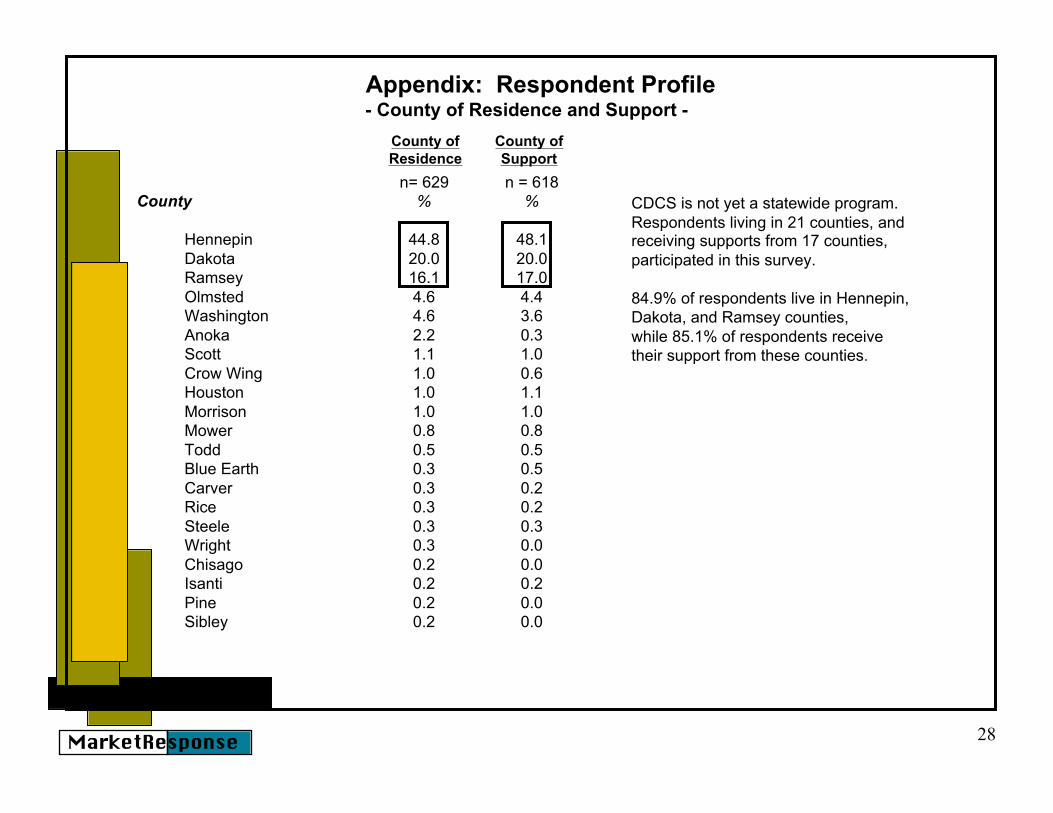
n= 629 n = 618County % %
Hennepin 44.8 48.1Dakota 20.0 20.0Ramsey 16.1 17.0Olmsted 4.6 4.4Washington 4.6 3.6Anoka 2.2 0.3Scott 1.1 1.0Crow Wing 1.0 0.6Houston 1.0 1.1Morrison 1.0 1.0Mower 0.8 0.8Todd 0.5 0.5Blue Earth 0.3 0.5Carver 0.3 0.2Rice 0.3 0.2Steele 0.3 0.3Wright 0.3 0.0Chisago 0.2 0.0Isanti 0.2 0.2Pine 0.2 0.0Sibley 0.2 0.0
CDCS is not yet a statewide program.Respondents living in 21 counties, andreceiving supports from 17 counties,participated in this survey.
84.9% of respondents live in Hennepin, Dakota, and Ramsey counties, while 85.1% of respondents receive their support from these counties.
County ofResidence
County ofSupport
29MarketResponse International
Appendix: Respondent Profile- Ethnicity -
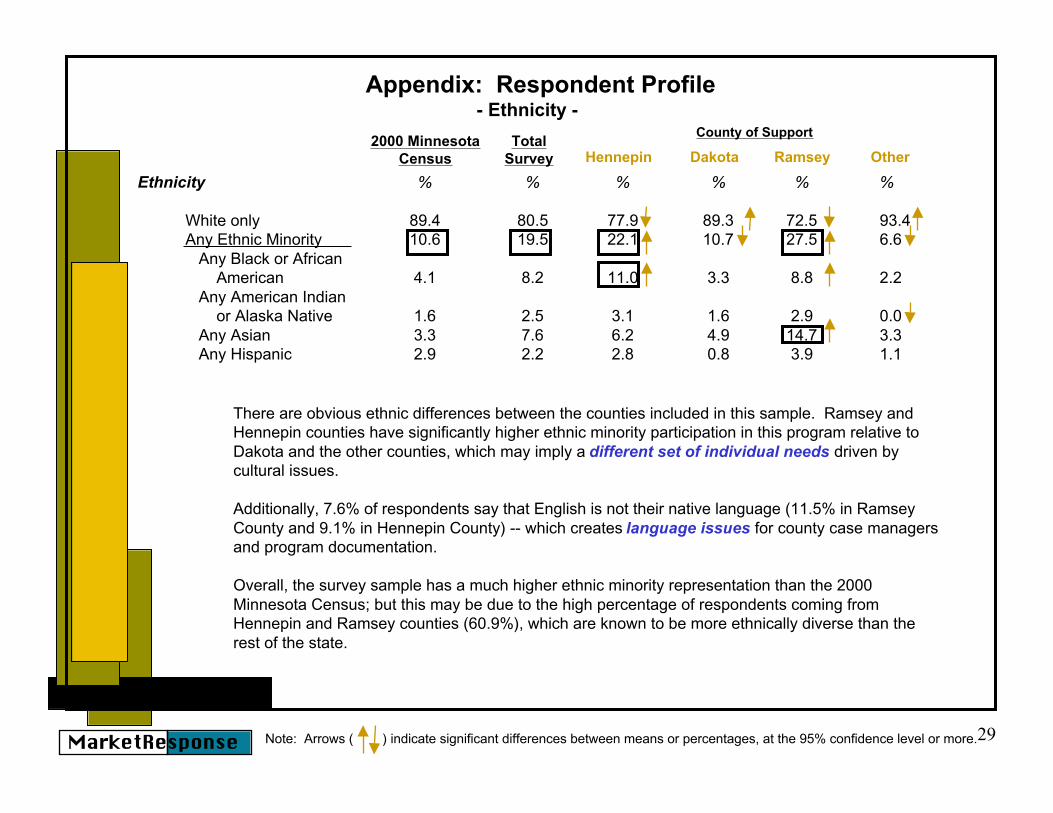
Ethnicity % % % % % %
White only 89.4 80.5 77.9 89.3 72.5 93.4Any Ethnic Minority 10.6 19.5 22.1 10.7 27.5 6.6 Any Black or African American 4.1 8.2 11.0 3.3 8.8 2.2 Any American Indian or Alaska Native 1.6 2.5 3.1 1.6 2.9 0.0 Any Asian 3.3 7.6 6.2 4.9 14.7 3.3 Any Hispanic 2.9 2.2 2.8 0.8 3.9 1.1
2000 MinnesotaCensus
TotalSurvey Hennepin Dakota Ramsey Other
County of Support
There are obvious ethnic differences between the counties included in this sample. Ramsey andHennepin counties have significantly higher ethnic minority participation in this program relative toDakota and the other counties, which may imply a different set of individual needs driven bycultural issues.
Additionally, 7.6% of respondents say that English is not their native language (11.5% in RamseyCounty and 9.1% in Hennepin County) -- which creates language issues for county case managersand program documentation.
Overall, the survey sample has a much higher ethnic minority representation than the 2000Minnesota Census; but this may be due to the high percentage of respondents coming fromHennepin and Ramsey counties (60.9%), which are known to be more ethnically diverse than therest of the state.
Note: Arrows ( ) indicate significant differences between means or percentages, at the 95% confidence level or more.
30MarketResponse International
Appendix: Respondent Profile- Years of Participation / Budget -
Note: Arrows ( ) indicate significant differences between means or percentages, at the 95% confidence level or more.
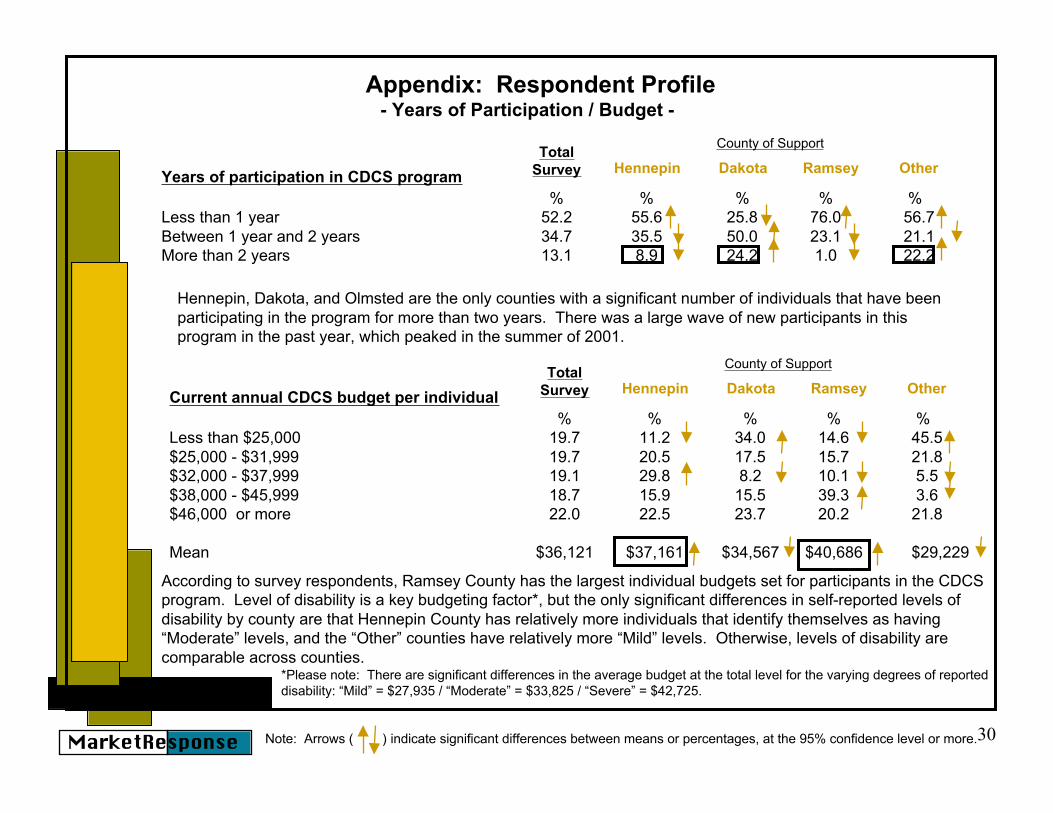
% % % % %Less than 1 year 52.2 55.6 25.8 76.0 56.7Between 1 year and 2 years 34.7 35.5 50.0 23.1 21.1More than 2 years 13.1 8.9 24.2 1.0 22.2
TotalSurvey Hennepin Dakota Ramsey Other
County of Support
Years of participation in CDCS program
Hennepin, Dakota, and Olmsted are the only counties with a significant number of individuals that have beenparticipating in the program for more than two years. There was a large wave of new participants in thisprogram in the past year, which peaked in the summer of 2001.
% % % % %Less than $25,000 19.7 11.2 34.0 14.6 45.5$25,000 - $31,999 19.7 20.5 17.5 15.7 21.8$32,000 - $37,999 19.1 29.8 8.2 10.1 5.5$38,000 - $45,999 18.7 15.9 15.5 39.3 3.6$46,000 or more 22.0 22.5 23.7 20.2 21.8
Mean $36,121 $37,161 $34,567 $40,686 $29,229
TotalSurvey Hennepin Dakota Ramsey Other
County of Support
Current annual CDCS budget per individual
According to survey respondents, Ramsey County has the largest individual budgets set for participants in the CDCSprogram. Level of disability is a key budgeting factor*, but the only significant differences in self-reported levels ofdisability by county are that Hennepin County has relatively more individuals that identify themselves as having“Moderate” levels, and the “Other” counties have relatively more “Mild” levels. Otherwise, levels of disability arecomparable across counties.
*Please note: There are significant differences in the average budget at the total level for the varying degrees of reporteddisability: “Mild” = $27,935 / “Moderate” = $33,825 / “Severe” = $42,725.
31MarketResponse International
Appendix: Respondent Profile- Household Income / Parental Fees -
<1 Year 1-2 YearsOverallYears of Participation in CDCS Program
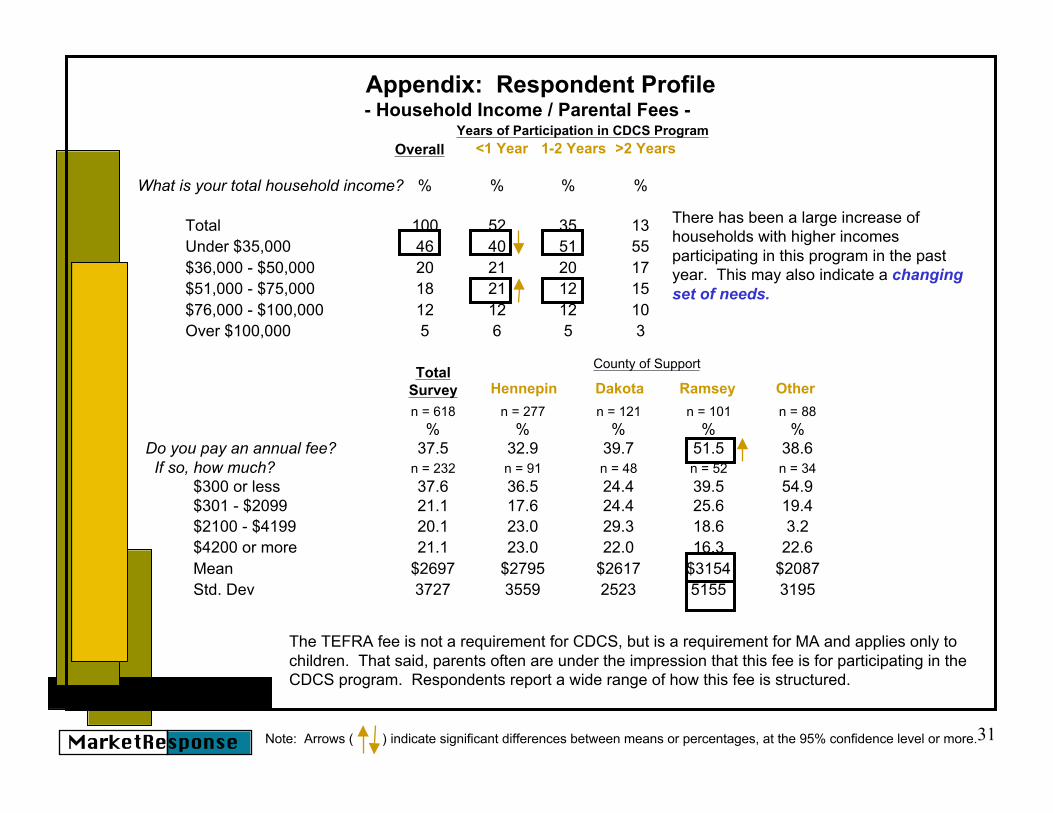
What is your total household income? % % % %
Total 100 52 35 13Under $35,000 46 40 51 55$36,000 - $50,000 20 21 20 17$51,000 - $75,000 18 21 12 15$76,000 - $100,000 12 12 12 10Over $100,000 5 6 5 3
>2 Years
Note: Arrows ( ) indicate significant differences between means or percentages, at the 95% confidence level or more.
There has been a large increase ofhouseholds with higher incomesparticipating in this program in the pastyear. This may also indicate a changingset of needs.
n = 618 n = 277 n = 121 n = 101 n = 88
% % % % %Do you pay an annual fee? 37.5 32.9 39.7 51.5 38.6 If so, how much? n = 232 n = 91 n = 48 n = 52 n = 34
$300 or less 37.6 36.5 24.4 39.5 54.9$301 - $2099 21.1 17.6 24.4 25.6 19.4$2100 - $4199 20.1 23.0 29.3 18.6 3.2$4200 or more 21.1 23.0 22.0 16.3 22.6Mean $2697 $2795 $2617 $3154 $2087Std. Dev 3727 3559 2523 5155 3195
The TEFRA fee is not a requirement for CDCS, but is a requirement for MA and applies only tochildren. That said, parents often are under the impression that this fee is for participating in theCDCS program. Respondents report a wide range of how this fee is structured.
TotalSurvey Hennepin Dakota Ramsey Other
County of Support