consumer perception survey report - co.imperial.ca.us · during fy 15-16 the consumer perception...
TRANSCRIPT
Imperial County Behavioral Health Services
Consumer Perception Survey Report
FY 2015-2016
Presented by: Gilda Adame
FY 15-16 Prepared by: GA QIC: 6/8/17
1
IMPERIAL COUNTY BEHAVIORAL HEALTH SERVICES
Consumer Perception Survey Results
FY 15-16
Purpose of Survey
The Department of Health Care Services (DHCS) is required to collect and report to the legislature data on county performance as established by AB
188 (Bronzan, Chapter 89, Statutes of 1991), commonly known as Realignment. Additionally, as a condition of receiving federal Substance Abuse
and Mental Health Services Administration (SAMHSA) funds, DHCS must also be responsive to federal performance reporting initiatives and
incorporate nationally derived accountability indicators.
Methodology
The survey method uses a point-in-time method that targets all consumers receiving face-to-face mental health services, case-management, day
treatment and medication services from county-operated and contract organization providers during a two-week sampling period semi-annually,
throughout the state of California.
During FY 15-16 the Consumer Perception Survey was administered twice (Fall 2015 and Spring 2016) to consumers receiving services at all MHP
team centers. The survey was administered in the threshold languages of English and Spanish. Prior to the date of the survey a specialized training
“Consumer Perception Survey Data Collection Training” was provided to Adult, Children and Youth and Young Adult Service staff.
The following groups receiving specialty mental health services were surveyed during two sampling periods over the fiscal year, 137 youth (age 13-
17), 389 family members/caregivers of youth, 313 adults (age 18-59), and 36 older adults (age 60+). There were a total of 507 participants in the Fall
of 2015 and 368 participants in the Spring 2016.
The following is a summary of the findings of the FY 15-16 Consumer Perceptions Surveys Satisfaction Rates.
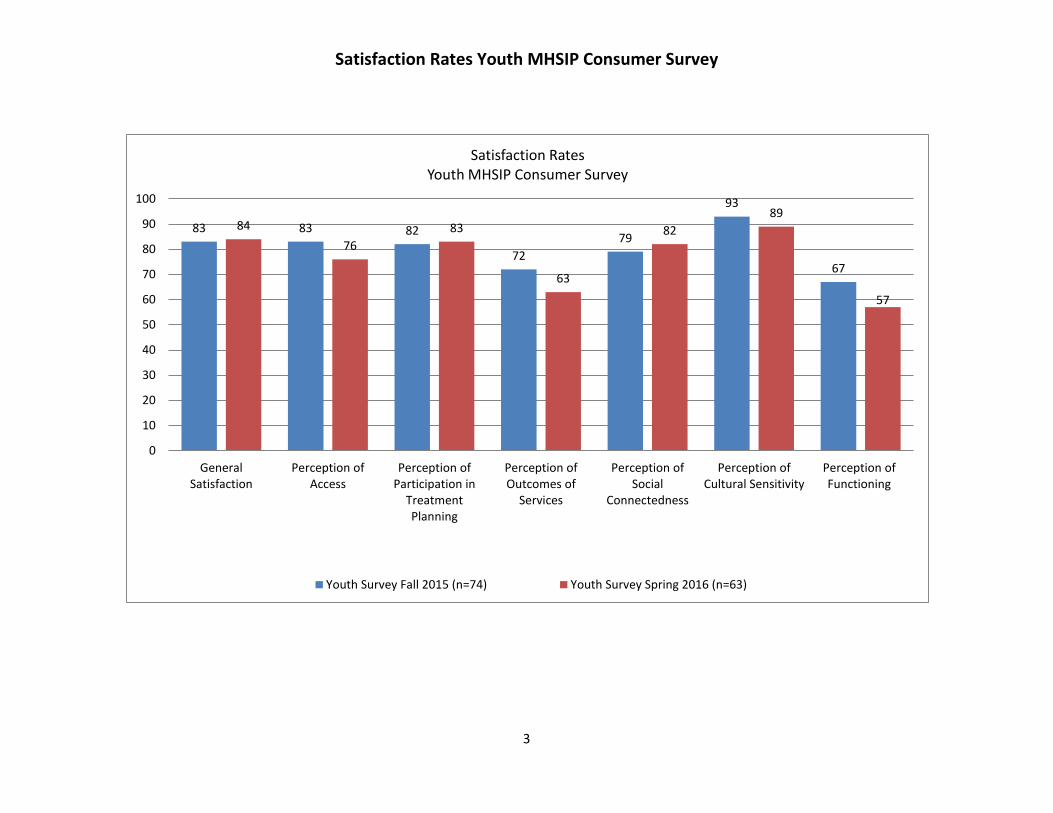
A total of 137 youth surveys were completed during FY 15-16. During Fall 2015 and Spring 2016 youth participants reported high satisfaction (76-
93%) in the areas of General Satisfaction, Perception of Access, Participation in Treatment Planning, Social Connectedness and Cultural Sensitivity.
The lowest satisfaction (57-72%) reported by youth was in the following areas: Perception of outcome of services, and perception of functioning.
Detailed information for the Youth survey results is found on pages 3-8.
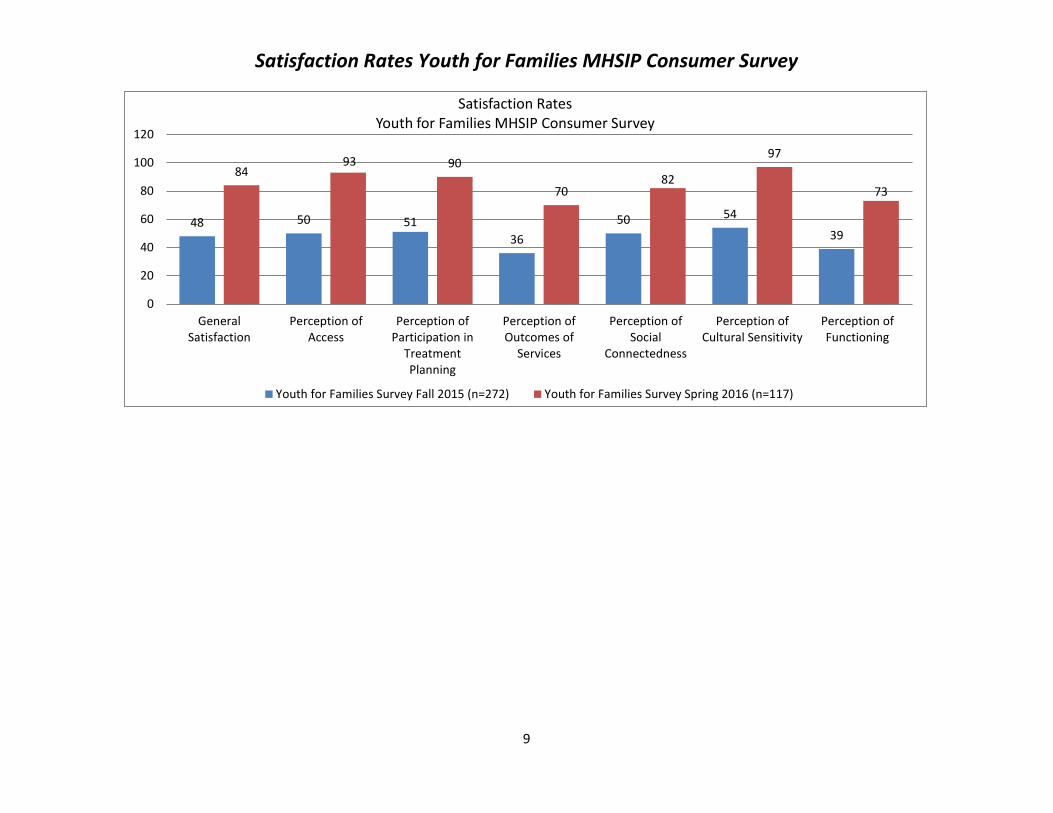
A total of 389 youth families surveys were completed during FY 15-16. During Fall 2015 youth families reported low satisfaction (36% to 54%) in
all areas surveyed. However, during Spring 2016 youth families reported a significant satisfaction increase (82-97%) in the following areas: General
Satisfaction, Perception of Access, Participation in Treatment Planning, Social Connectedness and Cultural Sensitivity. The lowest satisfaction
2
reported by youth families during the Spring 2016 (70-73%) was in the following areas: Perception of outcome of services, and perception of
functioning. Detailed information for the Youth for Families survey results is found on pages 9-14.
In addition, a comparison chart of Youth and Youth for Families Satisfaction Item – Analysis is found on page 15 of this document.
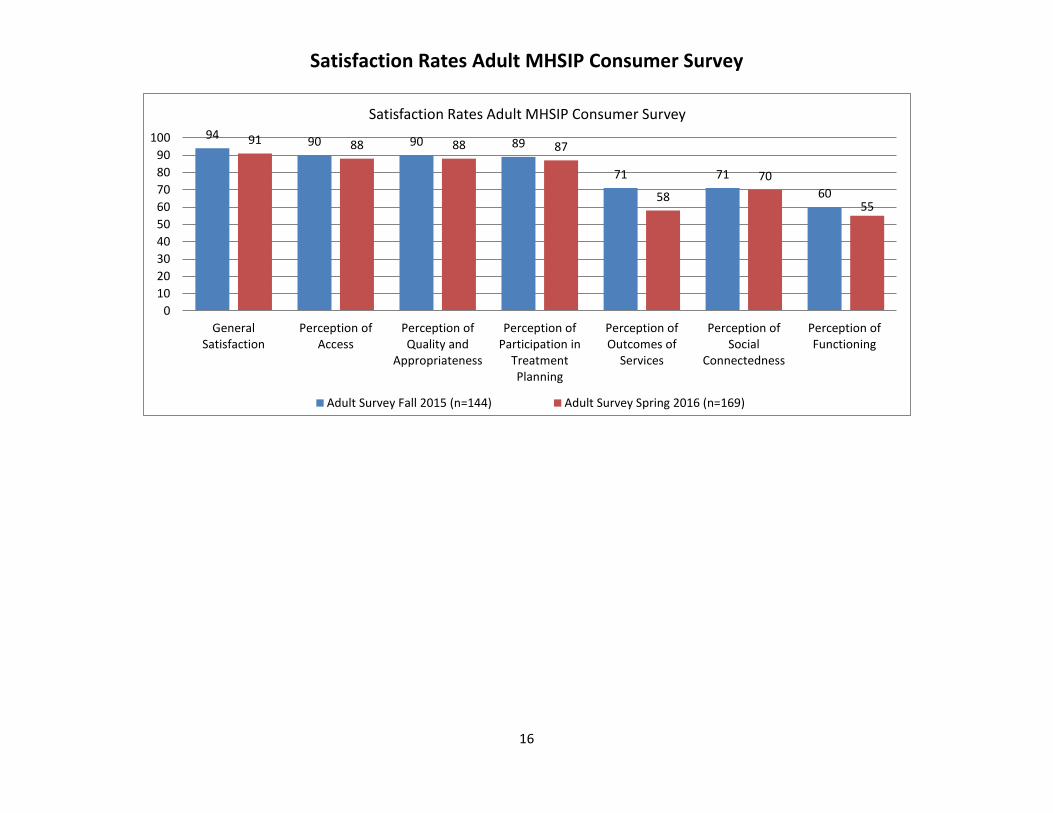
A total of 313 adult consumers completed the survey during FY 15-16. During Fall 2015 and Spring 2016 surveys, adult clients reported high
satisfaction (87-94%) in the areas of: General Satisfaction, Perception of Access, Quality and Appropriateness, and Participation in Treatment
Planning. The lowest satisfaction (55-71%) reported by adults was in the following areas: Perception of outcome of services, Social Connectedness
and Perception of Functioning. Detailed information for the Adult survey results is found on pages 16-21.
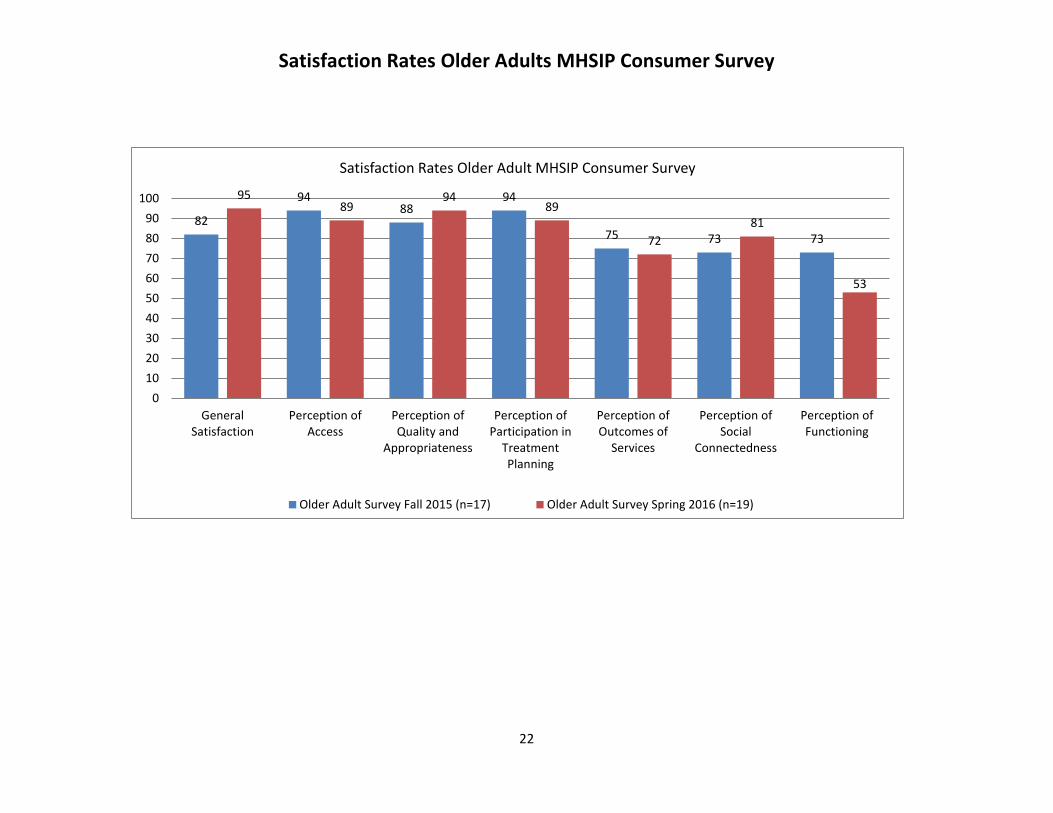
A total of 36 Older Adult consumers completed the survey during FY 15-16. During Fall 2015 and/or Spring 2016 surveys, older adult consumers
reported high satisfaction (81-95%) in the areas of: General Satisfaction, Perception of Access, Quality and Appropriateness, Participation in
Treatment Planning and Social Connectedness (Spring only). The lowest satisfaction (53-75%) reported by older adults was in the following areas:
Perception of outcome of services, Social Connectedness (Fall only) and Perception of Functioning. Detailed information for the Older Adult survey
results is found on pages 22-27.
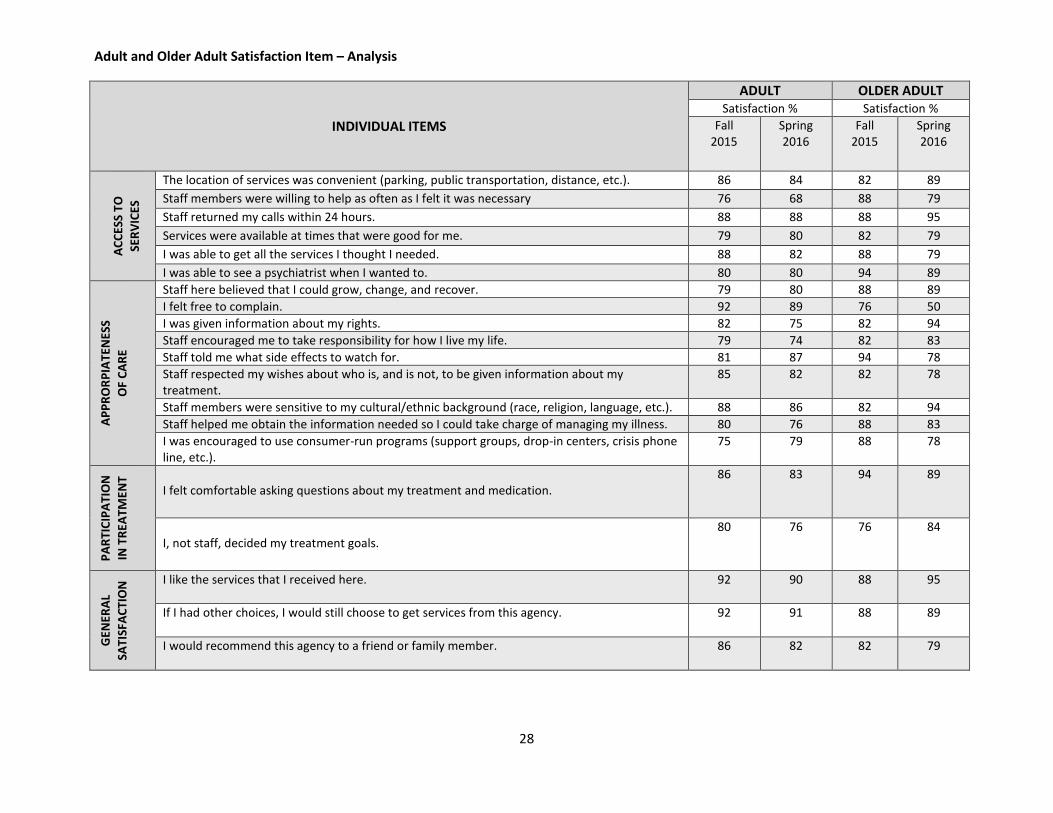
In addition, a comparison chart entitled Adult and Older Adult Satisfaction Item – Analysis is found on page 28 of this document.
3
Satisfaction Rates Youth MHSIP Consumer Survey
83 83 82
72
79
93
67
84
76
83
63
82
89
57
0
10
20
30
40
50
60
70
80
90
100
GeneralSatisfaction
Perception ofAccess
Perception ofParticipation in
TreatmentPlanning
Perception ofOutcomes of
Services
Perception ofSocial
Connectedness
Perception ofCultural Sensitivity
Perception ofFunctioning
Satisfaction Rates Youth MHSIP Consumer Survey
Youth Survey Fall 2015 (n=74) Youth Survey Spring 2016 (n=63)
4
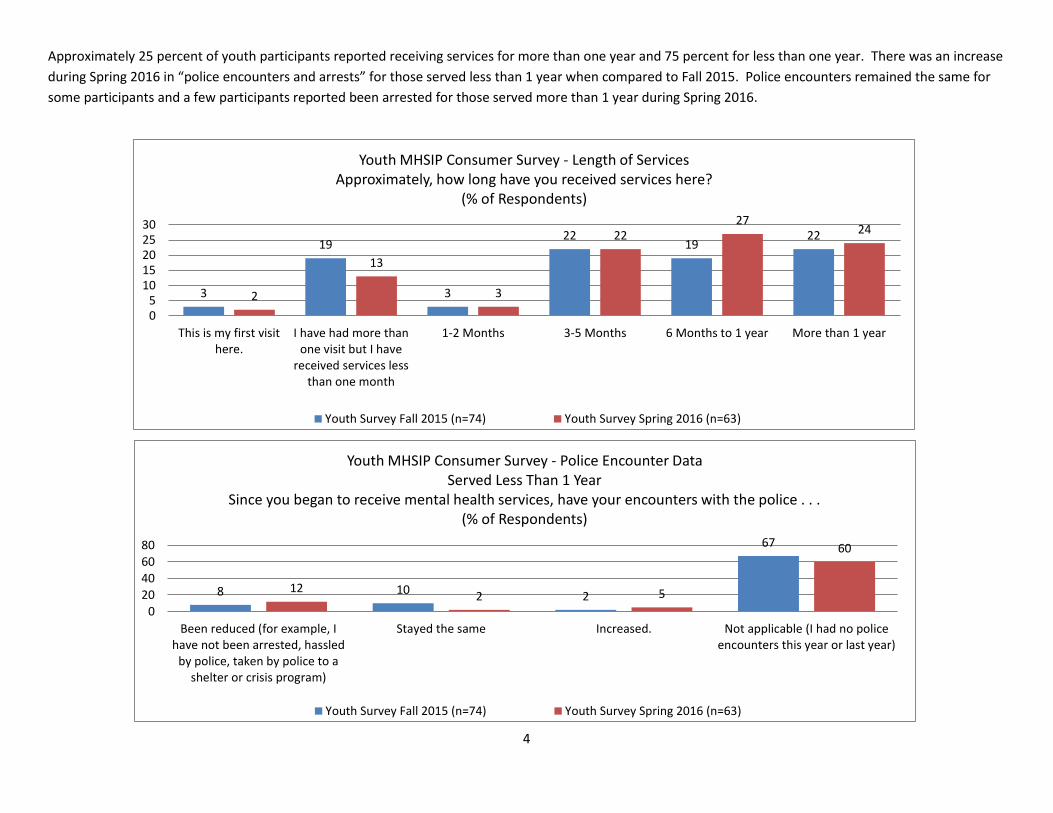
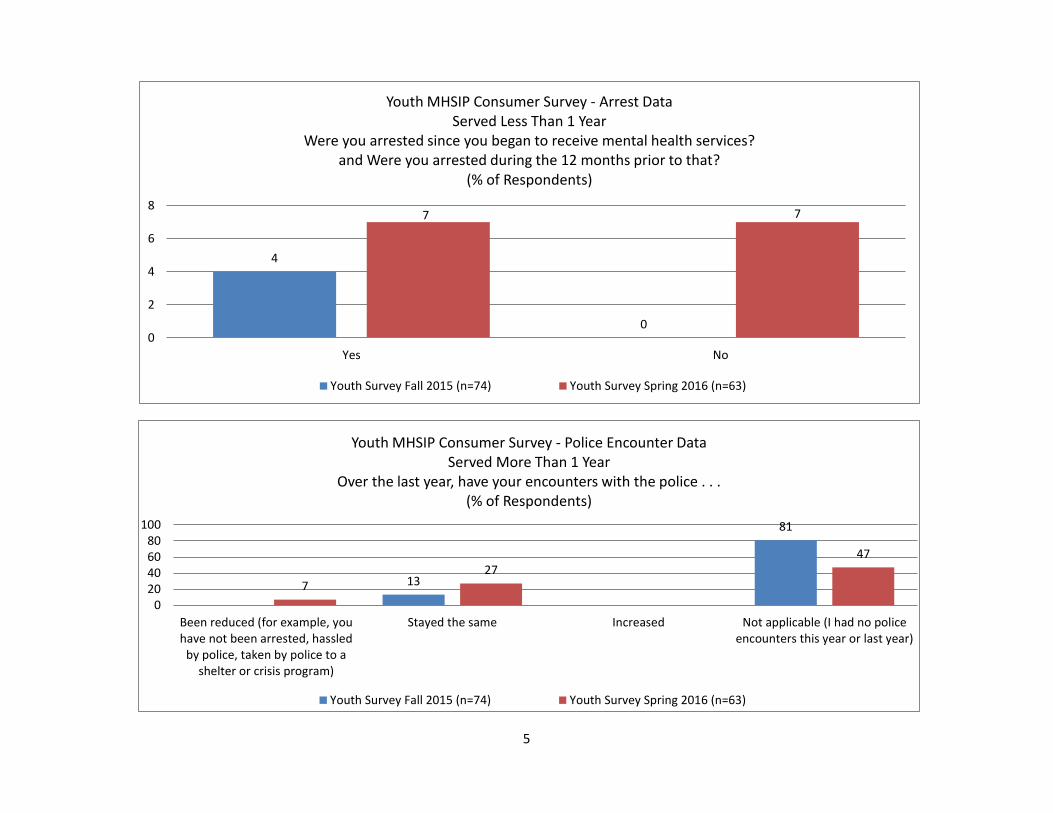
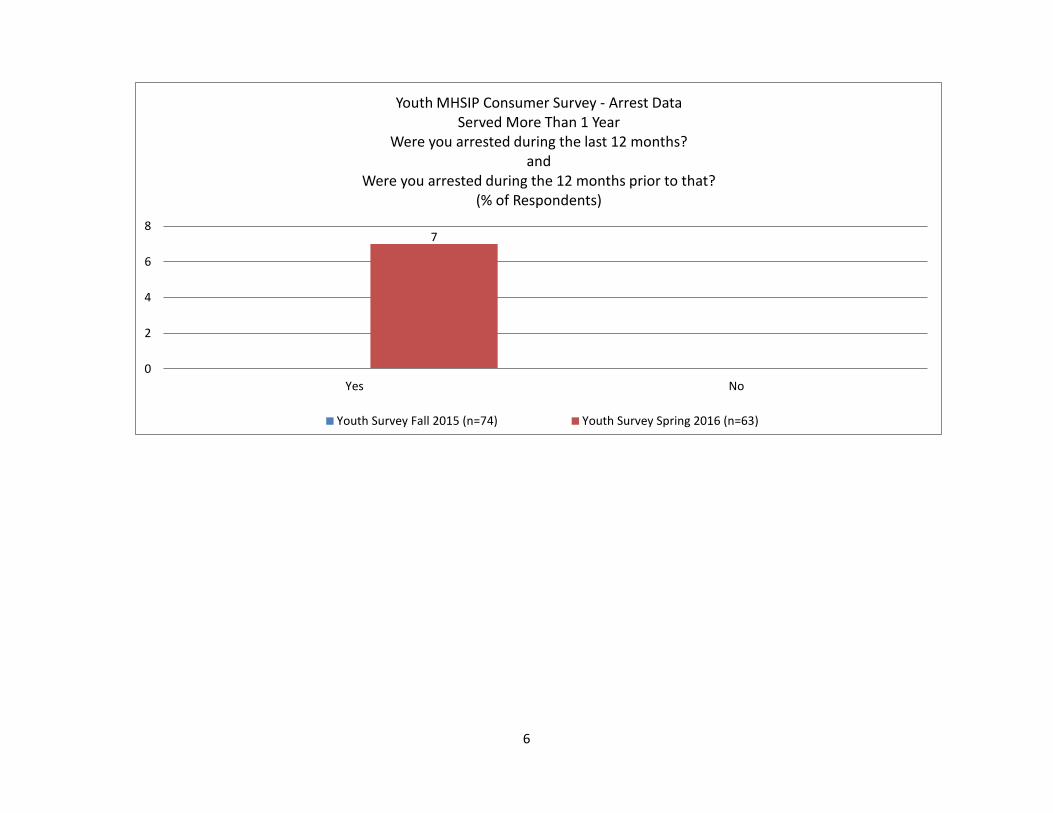
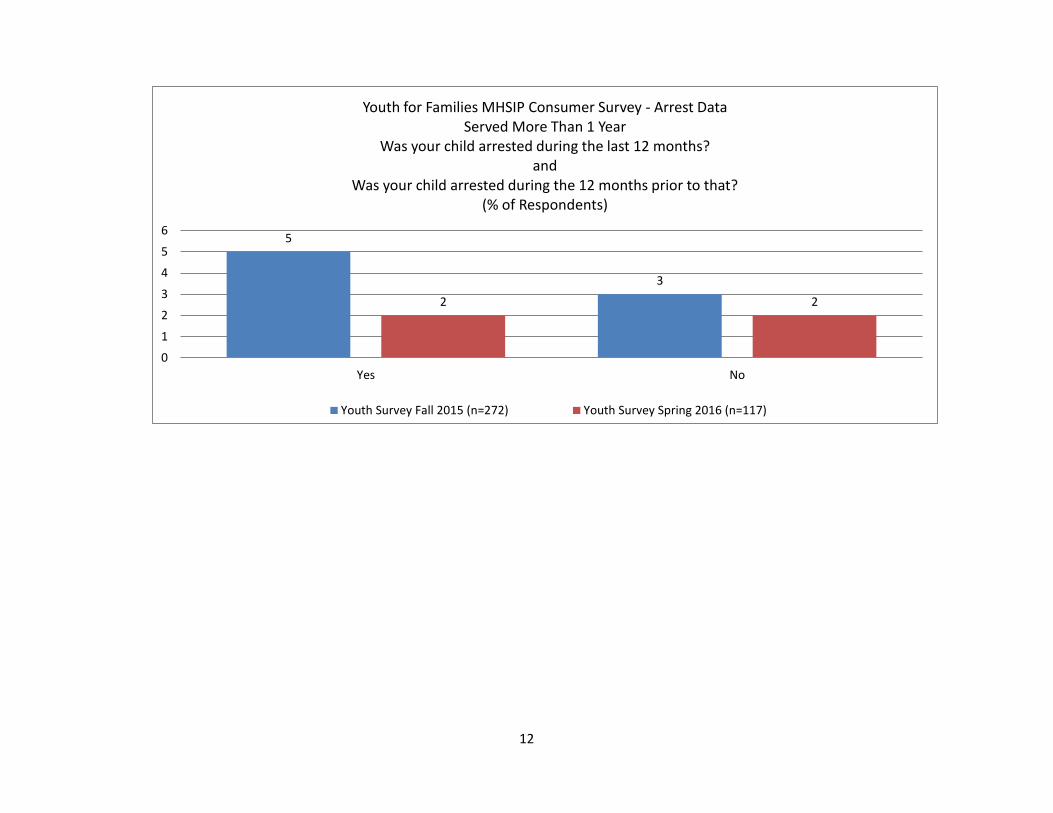
Approximately 25 percent of youth participants reported receiving services for more than one year and 75 percent for less than one year. There was an increase
during Spring 2016 in “police encounters and arrests” for those served less than 1 year when compared to Fall 2015. Police encounters remained the same for
some participants and a few participants reported been arrested for those served more than 1 year during Spring 2016.
3
19
3
2219
22
2
13
3
2227
24
05
1015202530
This is my first visithere.
I have had more thanone visit but I have
received services lessthan one month
1-2 Months 3-5 Months 6 Months to 1 year More than 1 year
Youth MHSIP Consumer Survey - Length of ServicesApproximately, how long have you received services here?
(% of Respondents)
Youth Survey Fall 2015 (n=74) Youth Survey Spring 2016 (n=63)
8 10 2
67
122 5
60
0
20
4060
80
Been reduced (for example, Ihave not been arrested, hassled
by police, taken by police to ashelter or crisis program)
Stayed the same Increased. Not applicable (I had no policeencounters this year or last year)
Youth MHSIP Consumer Survey - Police Encounter DataServed Less Than 1 Year
Since you began to receive mental health services, have your encounters with the police . . .(% of Respondents)
Youth Survey Fall 2015 (n=74) Youth Survey Spring 2016 (n=63)
5
4
0
7 7
0
2
4
6
8
Yes No
Youth MHSIP Consumer Survey - Arrest DataServed Less Than 1 Year
Were you arrested since you began to receive mental health services? and Were you arrested during the 12 months prior to that?
(% of Respondents)
Youth Survey Fall 2015 (n=74) Youth Survey Spring 2016 (n=63)
13
81
727
47
020406080
100
Been reduced (for example, youhave not been arrested, hassled
by police, taken by police to ashelter or crisis program)
Stayed the same Increased Not applicable (I had no policeencounters this year or last year)
Youth MHSIP Consumer Survey - Police Encounter DataServed More Than 1 Year
Over the last year, have your encounters with the police . . . (% of Respondents)
Youth Survey Fall 2015 (n=74) Youth Survey Spring 2016 (n=63)
6
7
0
2
4
6
8
Yes No
Youth MHSIP Consumer Survey - Arrest DataServed More Than 1 Year
Were you arrested during the last 12 months? and
Were you arrested during the 12 months prior to that?(% of Respondents)
Youth Survey Fall 2015 (n=74) Youth Survey Spring 2016 (n=63)
7
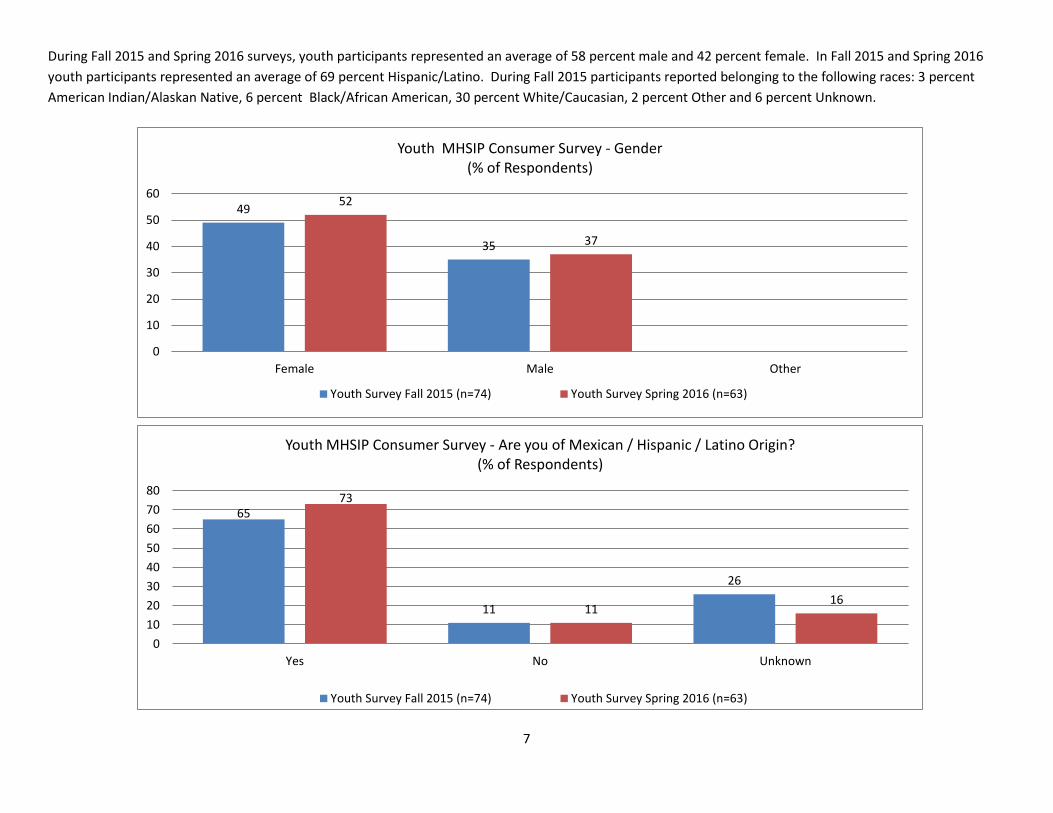
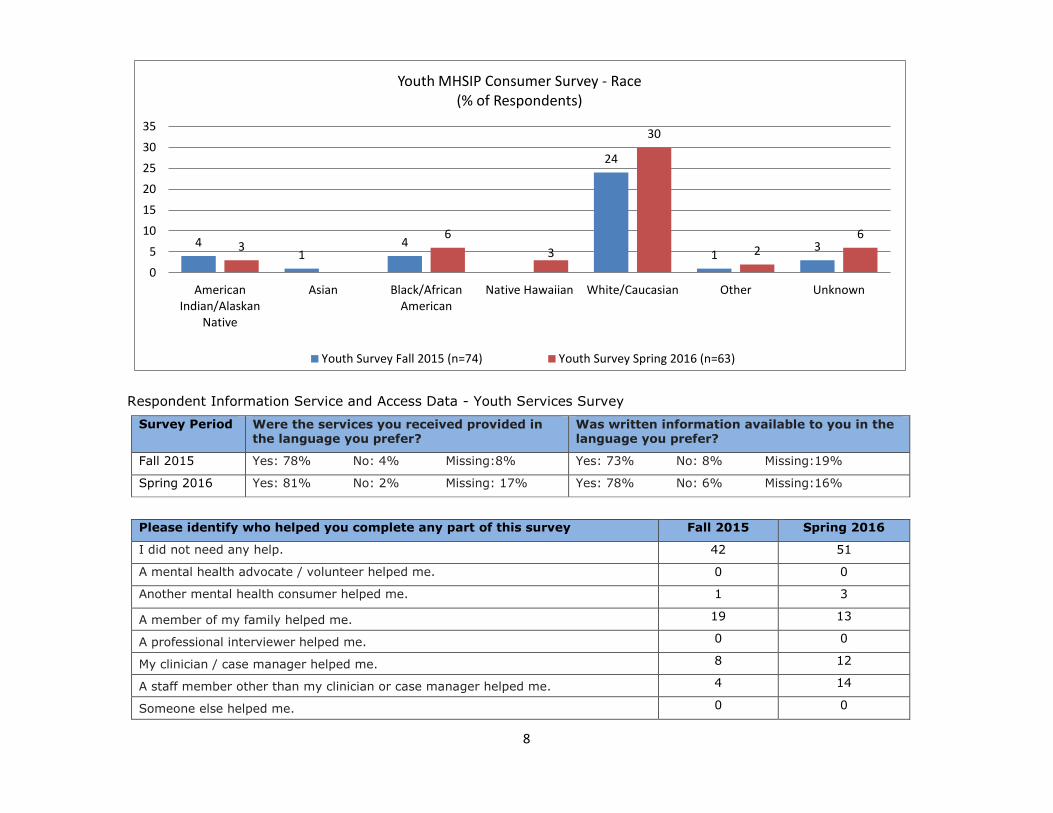
During Fall 2015 and Spring 2016 surveys, youth participants represented an average of 58 percent male and 42 percent female. In Fall 2015 and Spring 2016
youth participants represented an average of 69 percent Hispanic/Latino. During Fall 2015 participants reported belonging to the following races: 3 percent
American Indian/Alaskan Native, 6 percent Black/African American, 30 percent White/Caucasian, 2 percent Other and 6 percent Unknown.
49
35
52
37
0
10
20
30
40
50
60
Female Male Other
Youth MHSIP Consumer Survey - Gender(% of Respondents)
Youth Survey Fall 2015 (n=74) Youth Survey Spring 2016 (n=63)
65
11
26
73
1116
0
10
20
30
40
50
60
70
80
Yes No Unknown
Youth MHSIP Consumer Survey - Are you of Mexican / Hispanic / Latino Origin?(% of Respondents)
Youth Survey Fall 2015 (n=74) Youth Survey Spring 2016 (n=63)
8
Respondent Information Service and Access Data - Youth Services Survey
Survey Period Were the services you received provided in the language you prefer?
Was written information available to you in the language you prefer?
Fall 2015 Yes: 78% No: 4% Missing:8% Yes: 73% No: 8% Missing:19%
Spring 2016 Yes: 81% No: 2% Missing: 17% Yes: 78% No: 6% Missing:16%
Please identify who helped you complete any part of this survey Fall 2015 Spring 2016
I did not need any help. 42 51
A mental health advocate / volunteer helped me. 0 0
Another mental health consumer helped me. 1 3
A member of my family helped me. 19 13
A professional interviewer helped me. 0 0
My clinician / case manager helped me. 8 12
A staff member other than my clinician or case manager helped me. 4 14
Someone else helped me. 0 0
41
4
24
133
6
3
30
2
6
0
5
10
15
20
25
30
35
AmericanIndian/Alaskan
Native
Asian Black/AfricanAmerican
Native Hawaiian White/Caucasian Other Unknown
Youth MHSIP Consumer Survey - Race(% of Respondents)
Youth Survey Fall 2015 (n=74) Youth Survey Spring 2016 (n=63)
9
Satisfaction Rates Youth for Families MHSIP Consumer Survey
48 50 51
36
50 54
39
8493 90
7082
97
73
0
20
40
60
80
100
120
GeneralSatisfaction
Perception ofAccess
Perception ofParticipation in
TreatmentPlanning
Perception ofOutcomes of
Services
Perception ofSocial
Connectedness
Perception ofCultural Sensitivity
Perception ofFunctioning
Satisfaction Rates Youth for Families MHSIP Consumer Survey
Youth for Families Survey Fall 2015 (n=272) Youth for Families Survey Spring 2016 (n=117)
10
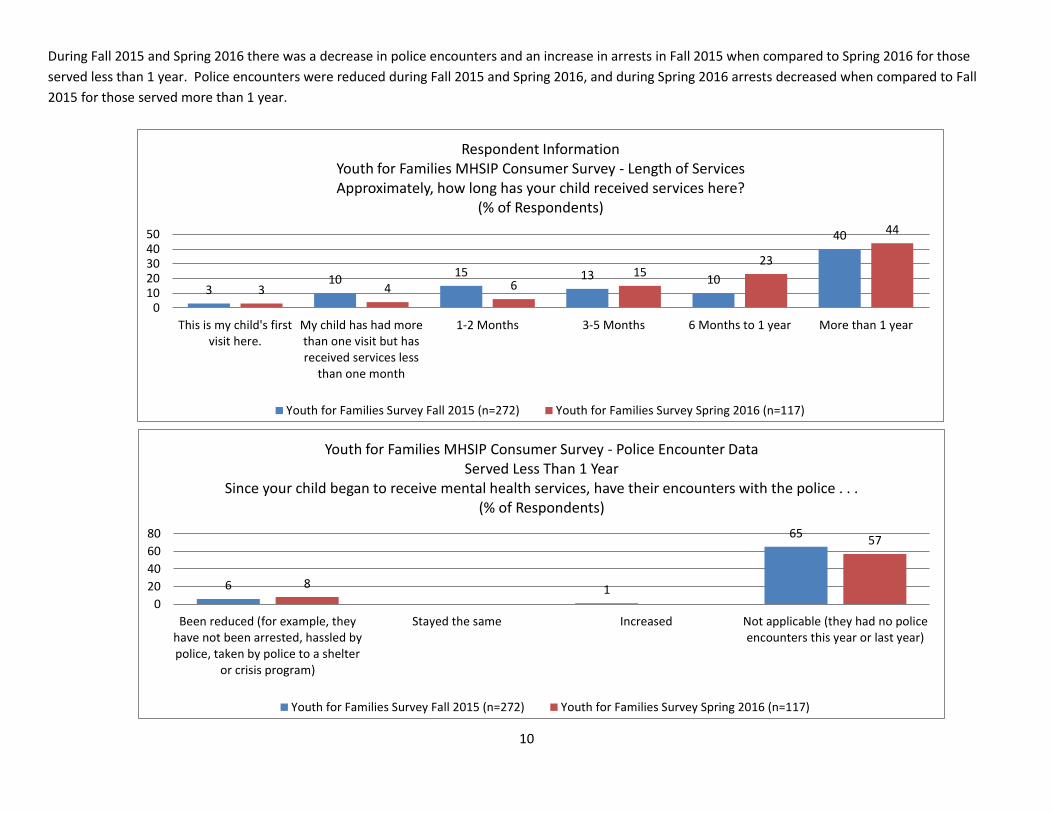
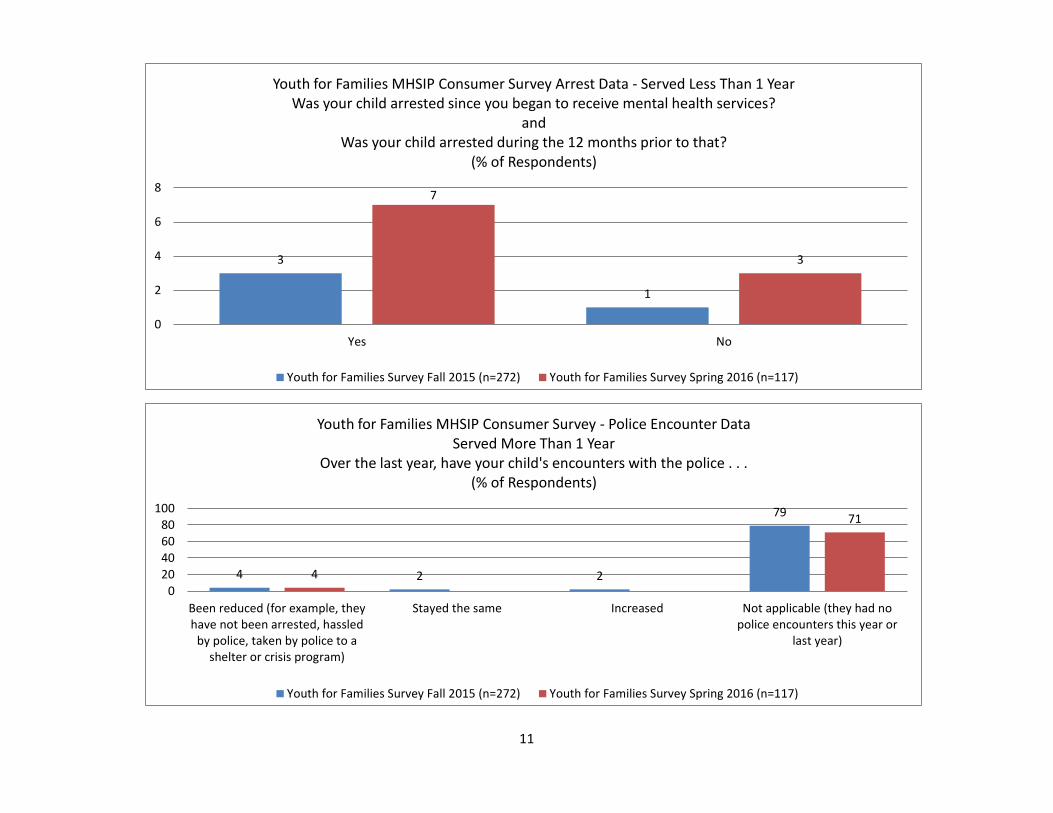
During Fall 2015 and Spring 2016 there was a decrease in police encounters and an increase in arrests in Fall 2015 when compared to Spring 2016 for those
served less than 1 year. Police encounters were reduced during Fall 2015 and Spring 2016, and during Spring 2016 arrests decreased when compared to Fall
2015 for those served more than 1 year.
310
15 13 10
40
3 4 615
23
44
01020304050
This is my child's firstvisit here.
My child has had morethan one visit but hasreceived services less
than one month
1-2 Months 3-5 Months 6 Months to 1 year More than 1 year
Respondent InformationYouth for Families MHSIP Consumer Survey - Length of ServicesApproximately, how long has your child received services here?
(% of Respondents)
Youth for Families Survey Fall 2015 (n=272) Youth for Families Survey Spring 2016 (n=117)
6 1
65
8
57
0
20
40
60
80
Been reduced (for example, theyhave not been arrested, hassled bypolice, taken by police to a shelter
or crisis program)
Stayed the same Increased Not applicable (they had no policeencounters this year or last year)
Youth for Families MHSIP Consumer Survey - Police Encounter DataServed Less Than 1 Year
Since your child began to receive mental health services, have their encounters with the police . . . (% of Respondents)
Youth for Families Survey Fall 2015 (n=272) Youth for Families Survey Spring 2016 (n=117)
11
3
1
7
3
0
2
4
6
8
Yes No
Youth for Families MHSIP Consumer Survey Arrest Data - Served Less Than 1 YearWas your child arrested since you began to receive mental health services?
andWas your child arrested during the 12 months prior to that?
(% of Respondents)
Youth for Families Survey Fall 2015 (n=272) Youth for Families Survey Spring 2016 (n=117)
4 2 2
79
4
71
020406080
100
Been reduced (for example, theyhave not been arrested, hassled
by police, taken by police to ashelter or crisis program)
Stayed the same Increased Not applicable (they had nopolice encounters this year or
last year)
Youth for Families MHSIP Consumer Survey - Police Encounter DataServed More Than 1 Year
Over the last year, have your child's encounters with the police . . .(% of Respondents)
Youth for Families Survey Fall 2015 (n=272) Youth for Families Survey Spring 2016 (n=117)
12
5
3
2 2
0
1
2
3
4
5
6
Yes No
Youth for Families MHSIP Consumer Survey - Arrest DataServed More Than 1 Year
Was your child arrested during the last 12 months?and
Was your child arrested during the 12 months prior to that?(% of Respondents)
Youth Survey Fall 2015 (n=272) Youth Survey Spring 2016 (n=117)
13
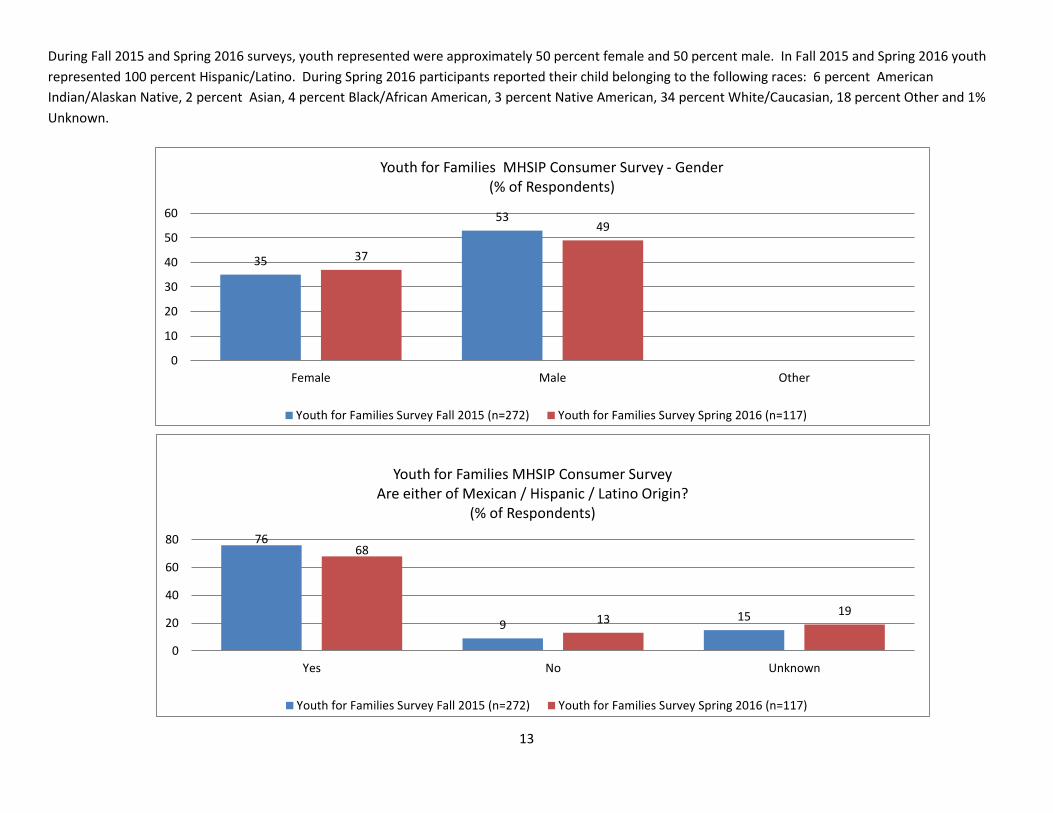
During Fall 2015 and Spring 2016 surveys, youth represented were approximately 50 percent female and 50 percent male. In Fall 2015 and Spring 2016 youth
represented 100 percent Hispanic/Latino. During Spring 2016 participants reported their child belonging to the following races: 6 percent American
Indian/Alaskan Native, 2 percent Asian, 4 percent Black/African American, 3 percent Native American, 34 percent White/Caucasian, 18 percent Other and 1%
Unknown.
35
53
37
49
0
10
20
30
40
50
60
Female Male Other
Youth for Families MHSIP Consumer Survey - Gender(% of Respondents)
Youth for Families Survey Fall 2015 (n=272) Youth for Families Survey Spring 2016 (n=117)
76
915
68
1319
0
20
40
60
80
Yes No Unknown
Youth for Families MHSIP Consumer Survey Are either of Mexican / Hispanic / Latino Origin?
(% of Respondents)
Youth for Families Survey Fall 2015 (n=272) Youth for Families Survey Spring 2016 (n=117)
14
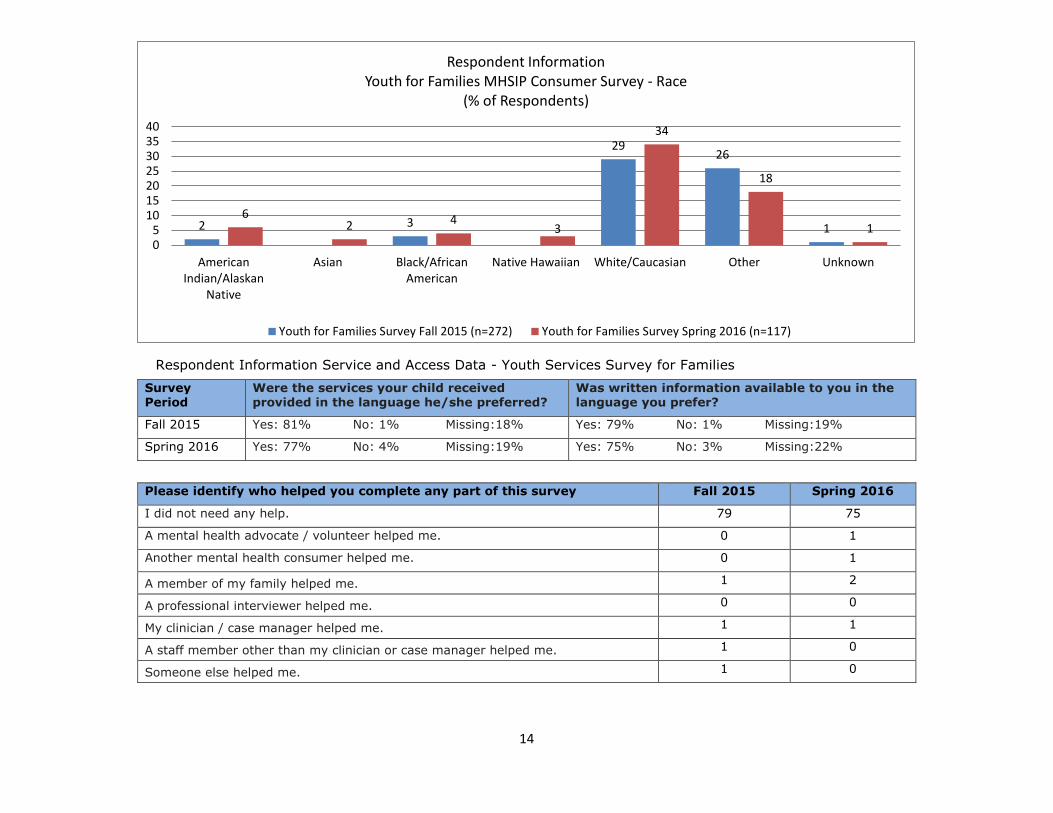
Respondent Information Service and Access Data - Youth Services Survey for Families
Survey Period
Were the services your child received provided in the language he/she preferred?
Was written information available to you in the language you prefer?
Fall 2015 Yes: 81% No: 1% Missing:18% Yes: 79% No: 1% Missing:19%
Spring 2016 Yes: 77% No: 4% Missing:19% Yes: 75% No: 3% Missing:22%
Please identify who helped you complete any part of this survey Fall 2015 Spring 2016
I did not need any help. 79 75
A mental health advocate / volunteer helped me. 0 1
Another mental health consumer helped me. 0 1
A member of my family helped me. 1 2
A professional interviewer helped me. 0 0
My clinician / case manager helped me. 1 1
A staff member other than my clinician or case manager helped me. 1 0
Someone else helped me. 1 0
2 3
2926
16
2 43
34
18
105
10152025303540
AmericanIndian/Alaskan
Native
Asian Black/AfricanAmerican
Native Hawaiian White/Caucasian Other Unknown
Respondent InformationYouth for Families MHSIP Consumer Survey - Race
(% of Respondents)
Youth for Families Survey Fall 2015 (n=272) Youth for Families Survey Spring 2016 (n=117)
15
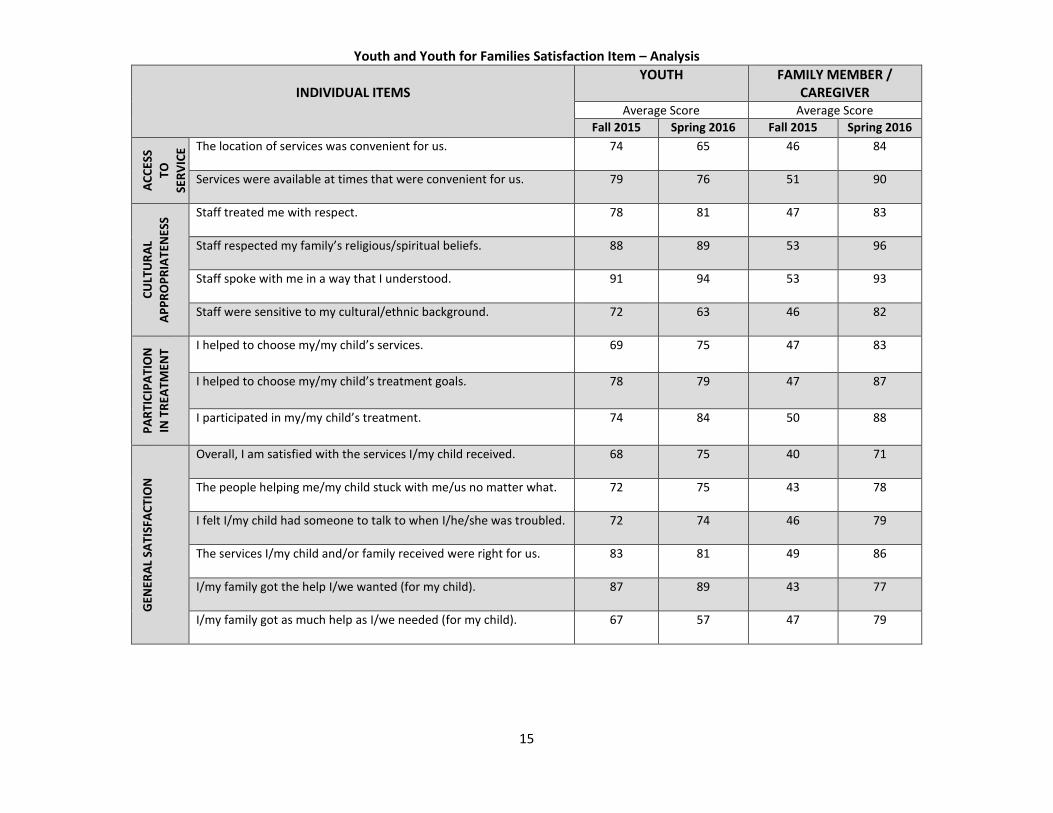
Youth and Youth for Families Satisfaction Item – Analysis
INDIVIDUAL ITEMS
YOUTH FAMILY MEMBER / CAREGIVER
Average Score Average Score
Fall 2015 Spring 2016 Fall 2015 Spring 2016
AC
CES
S
TO
SER
VIC
E
S
The location of services was convenient for us.
74 65 46 84
Services were available at times that were convenient for us.
79 76 51 90
CU
LTU
RA
L
AP
PR
OP
RIA
TEN
ESS
Staff treated me with respect.
78 81 47 83
Staff respected my family’s religious/spiritual beliefs.
88 89 53 96
Staff spoke with me in a way that I understood.
91 94 53 93
Staff were sensitive to my cultural/ethnic background.
72 63 46 82
PA
RTI
CIP
ATI
ON
IN T
REA
TMEN
T I helped to choose my/my child’s services.
69 75 47 83
I helped to choose my/my child’s treatment goals.
78 79 47 87
I participated in my/my child’s treatment.
74 84 50 88
GEN
ERA
L SA
TISF
AC
TIO
N
Overall, I am satisfied with the services I/my child received.
68 75 40 71
The people helping me/my child stuck with me/us no matter what.
72 75 43 78
I felt I/my child had someone to talk to when I/he/she was troubled.
72 74 46 79
The services I/my child and/or family received were right for us.
83 81 49 86
I/my family got the help I/we wanted (for my child).
87 89 43 77
I/my family got as much help as I/we needed (for my child).
67 57 47 79
16
Satisfaction Rates Adult MHSIP Consumer Survey
9490 90 89
71 71
60
91 88 88 87
58
70
55
0
10
20
30
40
50
60
70
80
90
100
GeneralSatisfaction
Perception ofAccess
Perception ofQuality and
Appropriateness
Perception ofParticipation in
TreatmentPlanning
Perception ofOutcomes of
Services
Perception ofSocial
Connectedness
Perception ofFunctioning
Satisfaction Rates Adult MHSIP Consumer Survey
Adult Survey Fall 2015 (n=144) Adult Survey Spring 2016 (n=169)
17
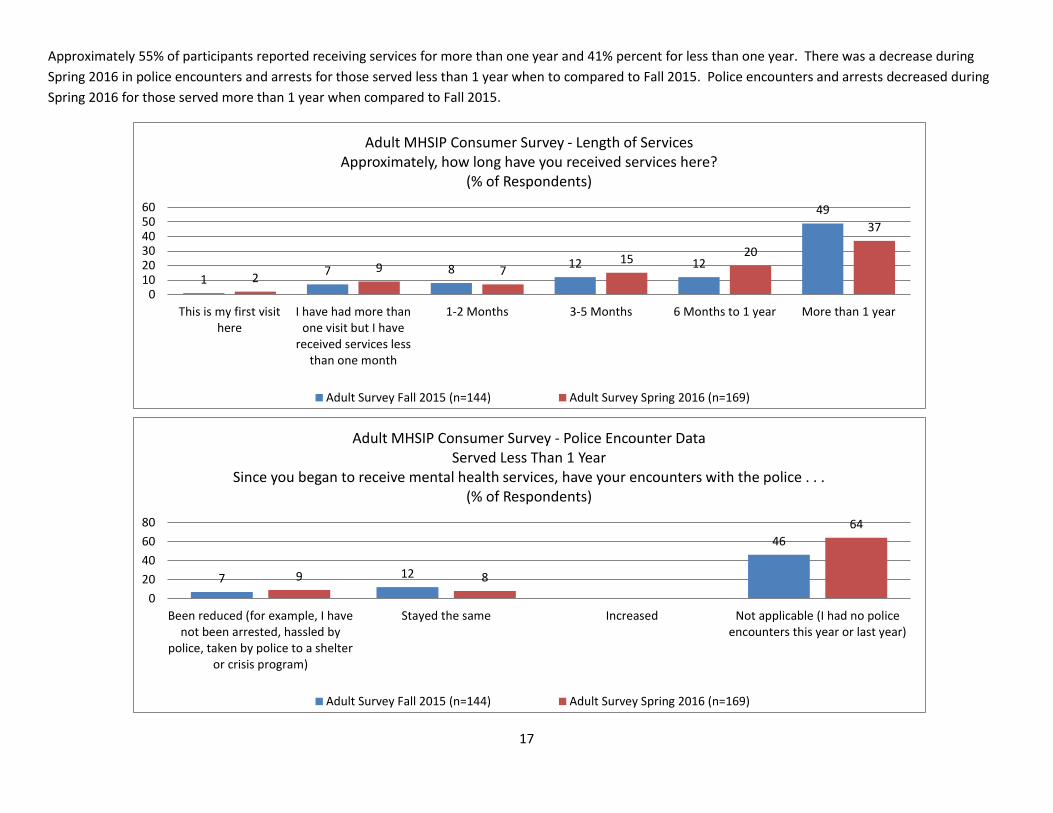
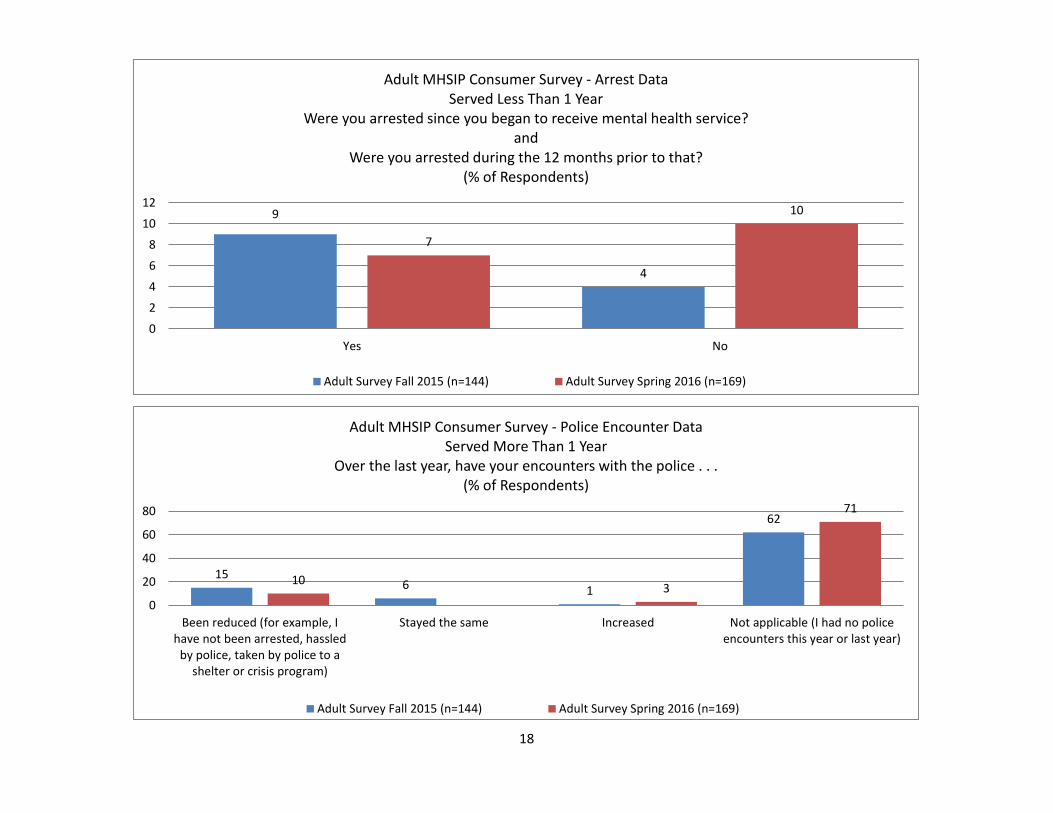
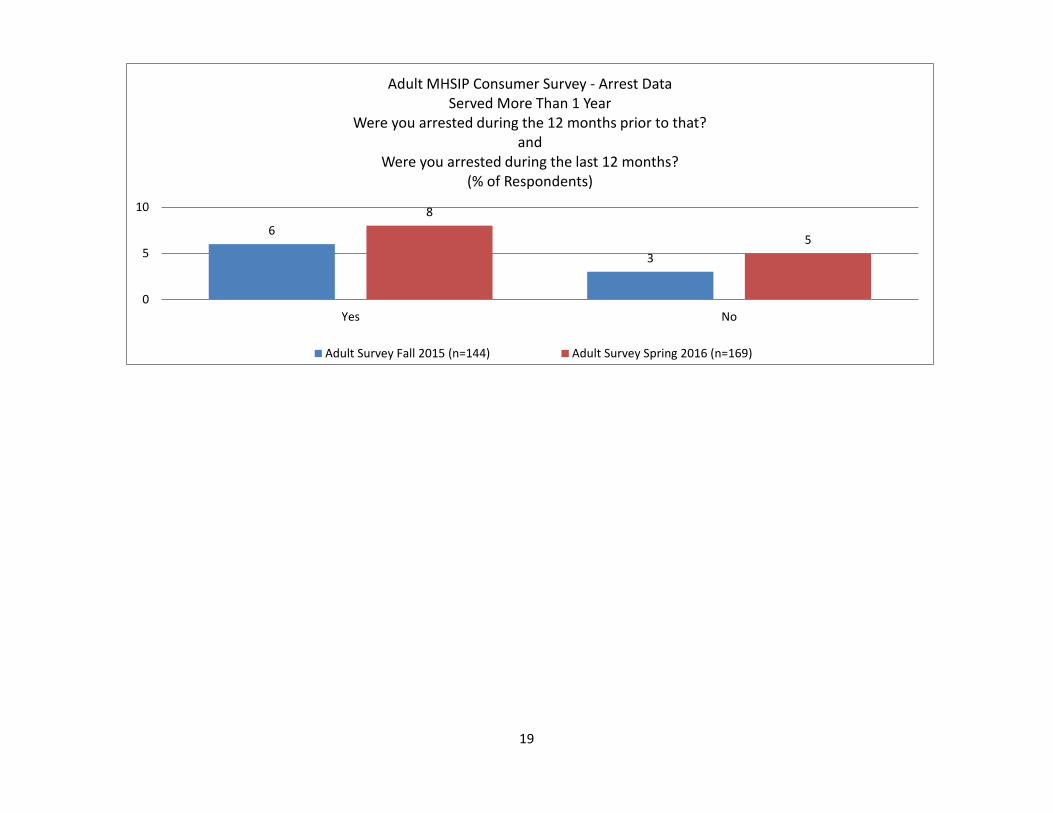
Approximately 55% of participants reported receiving services for more than one year and 41% percent for less than one year. There was a decrease during
Spring 2016 in police encounters and arrests for those served less than 1 year when to compared to Fall 2015. Police encounters and arrests decreased during
Spring 2016 for those served more than 1 year when compared to Fall 2015.
17 8 12 12
49
29 7
1520
37
0102030405060
This is my first visithere
I have had more thanone visit but I have
received services lessthan one month
1-2 Months 3-5 Months 6 Months to 1 year More than 1 year
Adult MHSIP Consumer Survey - Length of ServicesApproximately, how long have you received services here?
(% of Respondents)
Adult Survey Fall 2015 (n=144) Adult Survey Spring 2016 (n=169)
7 12
46
9 8
64
0
20
40
60
80
Been reduced (for example, I havenot been arrested, hassled by
police, taken by police to a shelteror crisis program)
Stayed the same Increased Not applicable (I had no policeencounters this year or last year)
Adult MHSIP Consumer Survey - Police Encounter DataServed Less Than 1 Year
Since you began to receive mental health services, have your encounters with the police . . . (% of Respondents)
Adult Survey Fall 2015 (n=144) Adult Survey Spring 2016 (n=169)
18
9
4
7
10
0
2
4
6
8
10
12
Yes No
Adult MHSIP Consumer Survey - Arrest DataServed Less Than 1 Year
Were you arrested since you began to receive mental health service?and
Were you arrested during the 12 months prior to that?(% of Respondents)
Adult Survey Fall 2015 (n=144) Adult Survey Spring 2016 (n=169)
156 1
62
103
71
0
20
40
60
80
Been reduced (for example, Ihave not been arrested, hassled
by police, taken by police to ashelter or crisis program)
Stayed the same Increased Not applicable (I had no policeencounters this year or last year)
Adult MHSIP Consumer Survey - Police Encounter DataServed More Than 1 Year
Over the last year, have your encounters with the police . . .(% of Respondents)
Adult Survey Fall 2015 (n=144) Adult Survey Spring 2016 (n=169)
19
6
3
8
5
0
5
10
Yes No
Adult MHSIP Consumer Survey - Arrest DataServed More Than 1 Year
Were you arrested during the 12 months prior to that?and
Were you arrested during the last 12 months?(% of Respondents)
Adult Survey Fall 2015 (n=144) Adult Survey Spring 2016 (n=169)
20
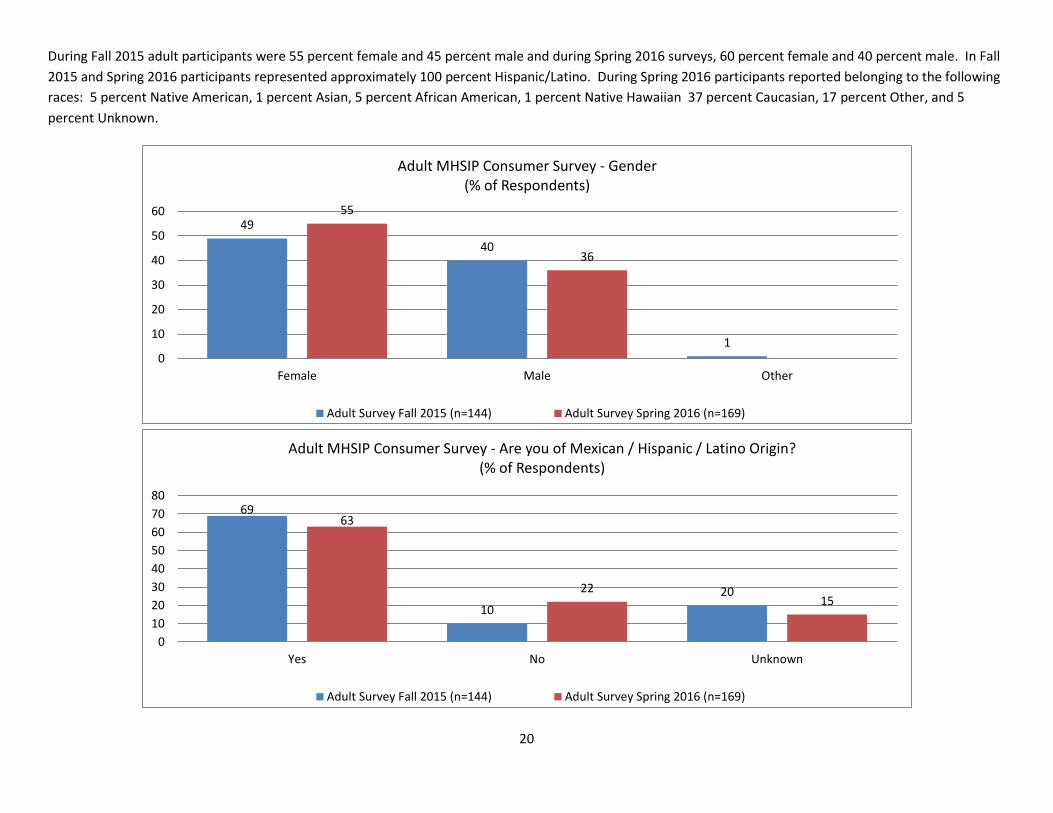
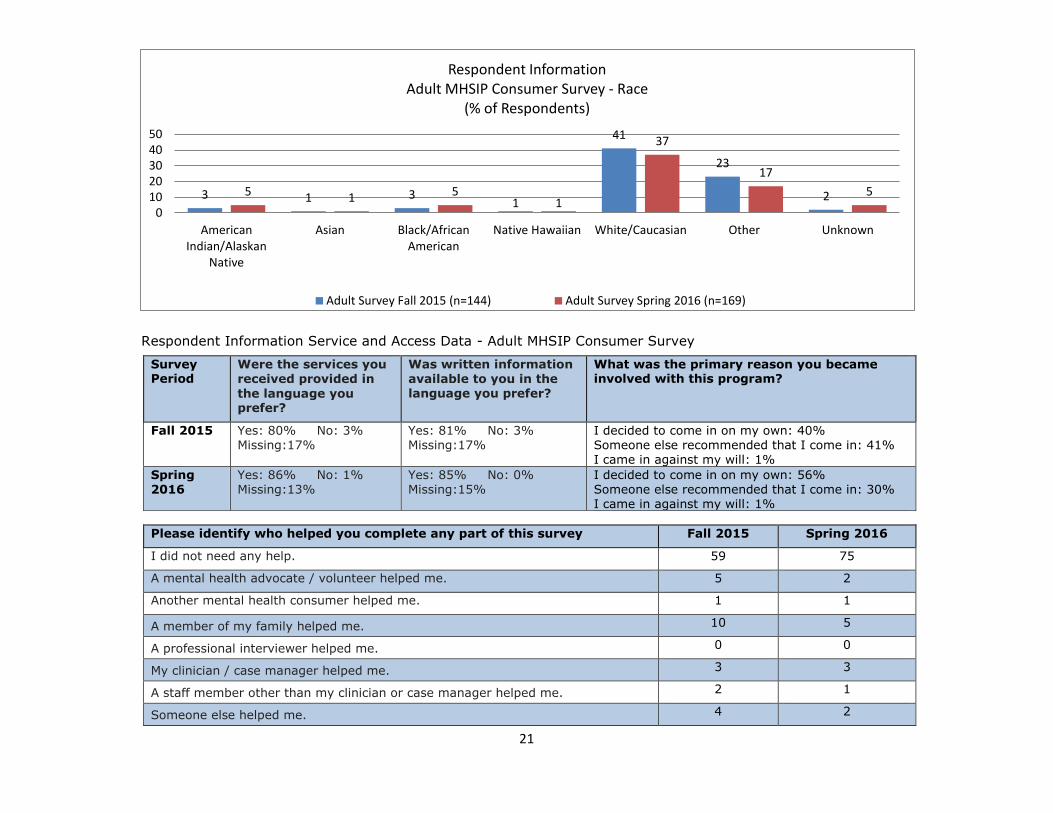
During Fall 2015 adult participants were 55 percent female and 45 percent male and during Spring 2016 surveys, 60 percent female and 40 percent male. In Fall
2015 and Spring 2016 participants represented approximately 100 percent Hispanic/Latino. During Spring 2016 participants reported belonging to the following
races: 5 percent Native American, 1 percent Asian, 5 percent African American, 1 percent Native Hawaiian 37 percent Caucasian, 17 percent Other, and 5
percent Unknown.
49
40
1
55
36
0
10
20
30
40
50
60
Female Male Other
Adult MHSIP Consumer Survey - Gender(% of Respondents)
Adult Survey Fall 2015 (n=144) Adult Survey Spring 2016 (n=169)
69
10
20
63
2215
0
10
20
30
40
50
60
70
80
Yes No Unknown
Adult MHSIP Consumer Survey - Are you of Mexican / Hispanic / Latino Origin?(% of Respondents)
Adult Survey Fall 2015 (n=144) Adult Survey Spring 2016 (n=169)
21
Respondent Information Service and Access Data - Adult MHSIP Consumer Survey
Survey Period
Were the services you received provided in
the language you prefer?
Was written information available to you in the
language you prefer?
What was the primary reason you became involved with this program?
Fall 2015 Yes: 80% No: 3% Missing:17%
Yes: 81% No: 3% Missing:17%
I decided to come in on my own: 40% Someone else recommended that I come in: 41% I came in against my will: 1%
Spring 2016
Yes: 86% No: 1% Missing:13%
Yes: 85% No: 0% Missing:15%
I decided to come in on my own: 56% Someone else recommended that I come in: 30% I came in against my will: 1%
Please identify who helped you complete any part of this survey Fall 2015 Spring 2016
I did not need any help. 59 75
A mental health advocate / volunteer helped me. 5 2
Another mental health consumer helped me. 1 1
A member of my family helped me. 10 5
A professional interviewer helped me. 0 0
My clinician / case manager helped me. 3 3
A staff member other than my clinician or case manager helped me. 2 1
Someone else helped me. 4 2
3 1 31
41
23
25 1 51
37
17
5
01020304050
AmericanIndian/Alaskan
Native
Asian Black/AfricanAmerican
Native Hawaiian White/Caucasian Other Unknown
Respondent InformationAdult MHSIP Consumer Survey - Race
(% of Respondents)
Adult Survey Fall 2015 (n=144) Adult Survey Spring 2016 (n=169)
22
Satisfaction Rates Older Adults MHSIP Consumer Survey
82
9488
94
75 73 73
9589
9489
72
81
53
0
10
20
30
40
50
60
70
80
90
100
GeneralSatisfaction
Perception ofAccess
Perception ofQuality and
Appropriateness
Perception ofParticipation in
TreatmentPlanning
Perception ofOutcomes of
Services
Perception ofSocial
Connectedness
Perception ofFunctioning
Satisfaction Rates Older Adult MHSIP Consumer Survey
Older Adult Survey Fall 2015 (n=17) Older Adult Survey Spring 2016 (n=19)
23
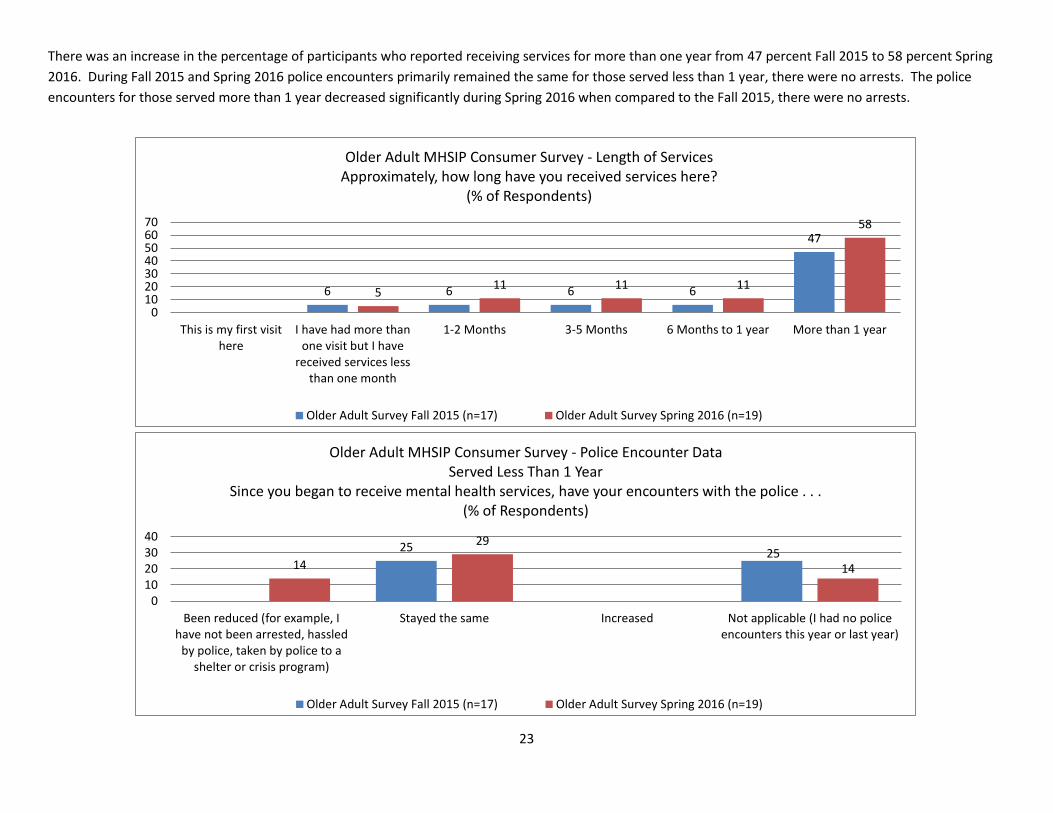
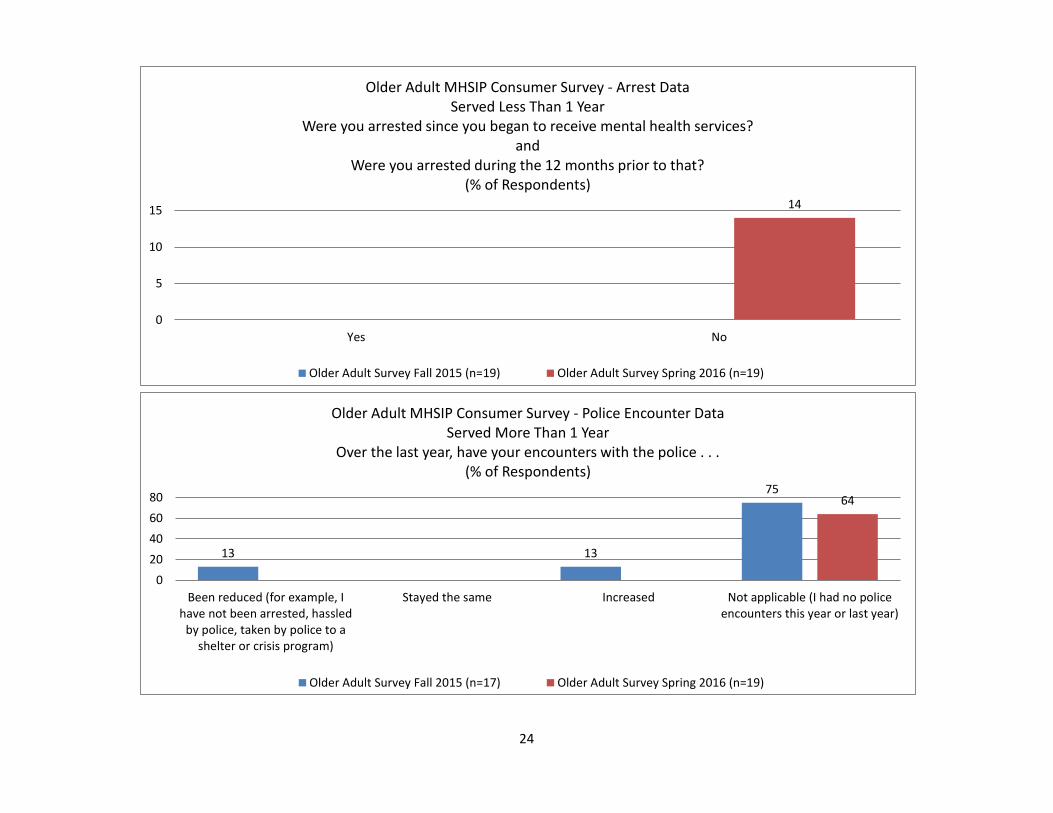
There was an increase in the percentage of participants who reported receiving services for more than one year from 47 percent Fall 2015 to 58 percent Spring
2016. During Fall 2015 and Spring 2016 police encounters primarily remained the same for those served less than 1 year, there were no arrests. The police
encounters for those served more than 1 year decreased significantly during Spring 2016 when compared to the Fall 2015, there were no arrests.
6 6 6 6
47
511 11 11
58
010203040506070
This is my first visithere
I have had more thanone visit but I have
received services lessthan one month
1-2 Months 3-5 Months 6 Months to 1 year More than 1 year
Older Adult MHSIP Consumer Survey - Length of ServicesApproximately, how long have you received services here?
(% of Respondents)
Older Adult Survey Fall 2015 (n=17) Older Adult Survey Spring 2016 (n=19)
25 2514
29
14
010203040
Been reduced (for example, Ihave not been arrested, hassled
by police, taken by police to ashelter or crisis program)
Stayed the same Increased Not applicable (I had no policeencounters this year or last year)
Older Adult MHSIP Consumer Survey - Police Encounter DataServed Less Than 1 Year
Since you began to receive mental health services, have your encounters with the police . . . (% of Respondents)
Older Adult Survey Fall 2015 (n=17) Older Adult Survey Spring 2016 (n=19)
24
14
0
5
10
15
Yes No
Older Adult MHSIP Consumer Survey - Arrest DataServed Less Than 1 Year
Were you arrested since you began to receive mental health services?and
Were you arrested during the 12 months prior to that?(% of Respondents)
Older Adult Survey Fall 2015 (n=19) Older Adult Survey Spring 2016 (n=19)
13 13
7564
0
20
40
60
80
Been reduced (for example, Ihave not been arrested, hassled
by police, taken by police to ashelter or crisis program)
Stayed the same Increased Not applicable (I had no policeencounters this year or last year)
Older Adult MHSIP Consumer Survey - Police Encounter DataServed More Than 1 Year
Over the last year, have your encounters with the police . . . (% of Respondents)
Older Adult Survey Fall 2015 (n=17) Older Adult Survey Spring 2016 (n=19)
25
0
0.5
1
1.5
Yes No
Respondent InformationOlder Adult MHSIP Consumer Survey - Arrest Data
Served More Than 1 YearWere you arrested during the last 12 months?
andWere you arrested during the 12 months prior to that?
(% of Respondents)
Older Adult Survey Fall 2015 (n=19) Older Adult Survey Spring 2016 (n=17)
26
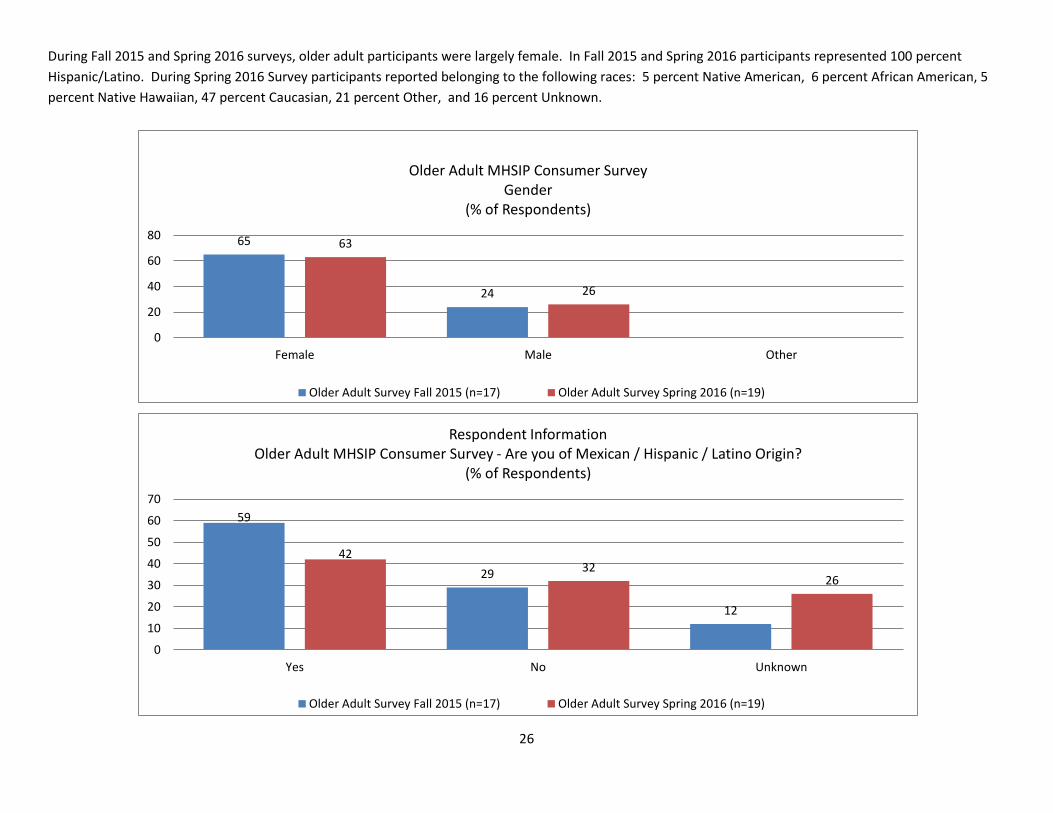
During Fall 2015 and Spring 2016 surveys, older adult participants were largely female. In Fall 2015 and Spring 2016 participants represented 100 percent
Hispanic/Latino. During Spring 2016 Survey participants reported belonging to the following races: 5 percent Native American, 6 percent African American, 5
percent Native Hawaiian, 47 percent Caucasian, 21 percent Other, and 16 percent Unknown.
65
24
63
26
0
20
40
60
80
Female Male Other
Older Adult MHSIP Consumer SurveyGender
(% of Respondents)
Older Adult Survey Fall 2015 (n=17) Older Adult Survey Spring 2016 (n=19)
59
29
12
4232
26
0
10
20
30
40
50
60
70
Yes No Unknown
Respondent InformationOlder Adult MHSIP Consumer Survey - Are you of Mexican / Hispanic / Latino Origin?
(% of Respondents)
Older Adult Survey Fall 2015 (n=17) Older Adult Survey Spring 2016 (n=19)
27
Respondent Information Service and Access Data - Older Adult MHSIP Consumer Survey
Survey Period
Were the services you received provided in
the language you prefer?
Was written information available to you in the language you prefer?
What was the primary reason you became involved with this program?
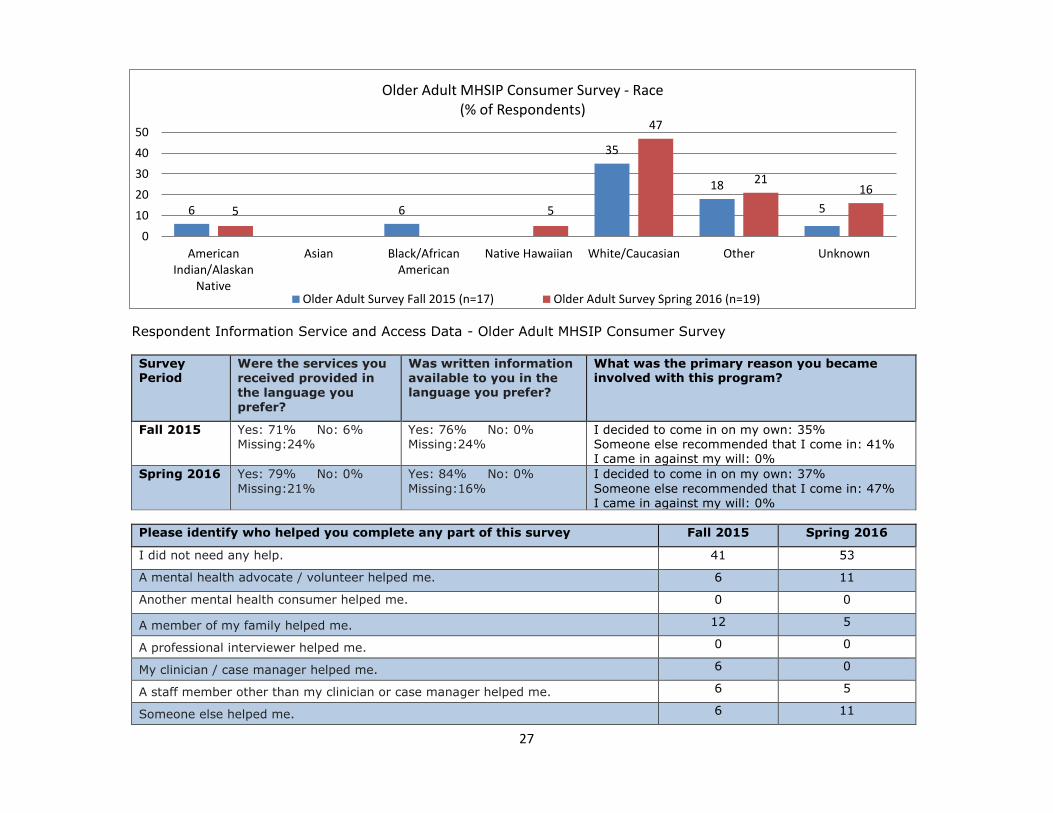
Fall 2015 Yes: 71% No: 6% Missing:24%
Yes: 76% No: 0% Missing:24%
I decided to come in on my own: 35% Someone else recommended that I come in: 41% I came in against my will: 0%
Spring 2016 Yes: 79% No: 0%
Missing:21%
Yes: 84% No: 0%
Missing:16%
I decided to come in on my own: 37%
Someone else recommended that I come in: 47% I came in against my will: 0%
Please identify who helped you complete any part of this survey Fall 2015 Spring 2016
I did not need any help. 41 53
A mental health advocate / volunteer helped me. 6 11
Another mental health consumer helped me. 0 0
A member of my family helped me. 12 5
A professional interviewer helped me. 0 0
My clinician / case manager helped me. 6 0
A staff member other than my clinician or case manager helped me. 6 5
Someone else helped me. 6 11
6 6
35
18
55 5
47
2116
0
10
20
30
40
50
AmericanIndian/Alaskan
Native
Asian Black/AfricanAmerican
Native Hawaiian White/Caucasian Other Unknown
Older Adult MHSIP Consumer Survey - Race(% of Respondents)
Older Adult Survey Fall 2015 (n=17) Older Adult Survey Spring 2016 (n=19)
28
Adult and Older Adult Satisfaction Item – Analysis
INDIVIDUAL ITEMS
ADULT OLDER ADULT Satisfaction % Satisfaction %
Fall 2015
Spring 2016
Fall 2015
Spring 2016
AC
CES
S T
O
SER
VIC
ES
The location of services was convenient (parking, public transportation, distance, etc.). 86 84 82 89
Staff members were willing to help as often as I felt it was necessary 76 68 88 79
Staff returned my calls within 24 hours. 88 88 88 95
Services were available at times that were good for me. 79 80 82 79
I was able to get all the services I thought I needed. 88 82 88 79
I was able to see a psychiatrist when I wanted to. 80 80 94 89
AP
PR
OR
PIA
TEN
ESS
OF
CA
RE
Staff here believed that I could grow, change, and recover. 79 80 88 89
I felt free to complain. 92 89 76 50
I was given information about my rights. 82 75 82 94
Staff encouraged me to take responsibility for how I live my life. 79 74 82 83
Staff told me what side effects to watch for. 81 87 94 78
Staff respected my wishes about who is, and is not, to be given information about my treatment.
85 82 82 78
Staff members were sensitive to my cultural/ethnic background (race, religion, language, etc.). 88 86 82 94
Staff helped me obtain the information needed so I could take charge of managing my illness. 80 76 88 83
I was encouraged to use consumer-run programs (support groups, drop-in centers, crisis phone line, etc.).
75 79 88 78
PA
RTI
CIP
ATI
ON
IN T
REA
TMEN
T
I felt comfortable asking questions about my treatment and medication.
86 83 94 89
I, not staff, decided my treatment goals.
80 76 76 84
GEN
ERA
L
SATI
SFA
CTI
ON
I like the services that I received here.
92 90 88 95
If I had other choices, I would still choose to get services from this agency.
92 91 88 89
I would recommend this agency to a friend or family member.
86 82 82 79