consumer trends - pet food in brazil - language · pdf fileexecutive summary inside this issue...
TRANSCRIPT
International Markets Bureau
MARKET INDICATOR REPORT | JULY 2013
Consumer Trends
Pet Food in Brazil

EXECUTIVE SUMMARY INSIDE THIS ISSUE
DID YOU KNOW?
PAGE 2
Consumer Trends Pet Food in Brazil
Executive Summary 2
Market Overview 3
Industry Trends 5
Global Competition 6
Dog Food 7
Cat Food 9
Other Pet Food 11
Product Developments 13
Product Innovations 13
Product Introductions, 2007-2012
14
Brazil has the second-largest market for pet food in the world, behind only the United States.
The Brazilian dog food market
is massive. Valued at just over US$4.9 billion, it makes up 77% of the country’s entire pet food market (2012).
The cat population is
increasing significantly in Brazil, recording a 7% growth in 2012 alone.
Differentiation and health orientation are driving growth in Brazil’s pet food market. The development of pet foods and treats with increased nutrients and specific health benefits have defined the market in recent years.
Consumers are treating pets as members of their families, and this pet “humanization” trend has taken off in Brazil, in recent years. It has evolved to the point where many consumers will spend the extra money or effort to obtain natural, high-quality foods for their pets. They want their pets to live long, healthy lives and one of the easiest ways to encourage this is through their food intake.
Not only is pet health awareness on the rise, but Brazil’s general pet popularity is increasing significantly. In 2012, the dog population in Brazil was over 35 million, followed by the cat, bird, and fish populations at just over 20 million a piece. This represented an increase of 14% over the past 5 years in Brazilian dogs, and a 37.6% increase in the cat population over the same time period.
Finally, to further propel this industry, there has been an increase in both consumer income and the younger middle class population in Brazil. Many new couples and bachelors are moving up into Brazil’s middle class as the country recovers from the effects of the recession. With this move comes an increase in consumer confidence and, subsequently, spending. This younger middle class tends to delay having children, making a pet the perfect companion to spend their time and money on.
These factors are all leading to increased spending in the pet food market, but they are also leading to increased demands. Consumers are more educated about the needs of their pets and want specific, health-oriented foods to suit these needs. Their demand is being met in large by companies like Mars Ltda. and Nestlé SA, who are constantly developing new products that appeal to the needs of pets of all ages, sizes, and breeds. It has now become a market entry requirement to offer diverse, healthy products and this will drive innovation and competition in the pet food market for years to come.

MARKET OVERVIEW
PAGE 3
2007 2008 2009 2010 2011 2012
Total pet food 3,673.4 4,287.5 4,701.8 5,234.1 5,826.6 6,420.1
Dog and cat food 3,312.7 3,894.8 4,292.5 4,763.0 5,289.5 5,792.2
- Dog food 2,834.0 3,290.0 3,651.5 4,055.2 4,504.3 4,922.7
- Cat food 478.7 604.9 641.0 707.8 785.2 869.6
Other pet food 360.7 392.7 409.3 471.1 537.1 627.9
Sales of Pet Food in Brazil by Category - Value in US$ millions
Source: Euromonitor, 2012
Forecast Sales of Pet Food in Brazil by Category - Value in US$ millions
2013 2014 2015 2016 2017
Total pet food 6,822.0 7,226.4 7,559.6 7,935.7 8,309.9
Dog and cat food 6,126.9 6,466.5 6,742.5 7,055.8 7,357.9
- Dog food 5,223.0 5,504.0 5,741.0 6,005.5 6,257.3
- Cat food 903.9 962.5 1,001.6 1,050.4 1,100.6
Other pet food 695.1 759.9 817.1 879.8 952.0
Source: Euromonitor, 2012
In 2012, Brazilian pet food sales grew just over 10% to reach a value of US$6.4 billion. With its recent increase, the country has overtaken Japan as the second largest market for pet food worldwide, behind only the United States (U.S.).
Brazil’s total pet food sales accounted for 91% of all pet care products sold in the country in 2012. Broken into categories, dog food is the most profitable with an 11% growth in 2012, reaching a value of
just over US$4.9 billion. Cat food is the second-largest category, registering the same growth rate and sales of US$869 million in 2012. Lastly, the category of other pet food, consisting of pet bird, fish, small mammal and reptile foods, saw total sales of just under US$628 million, but recorded rapid growth of 16.9% in the past year.
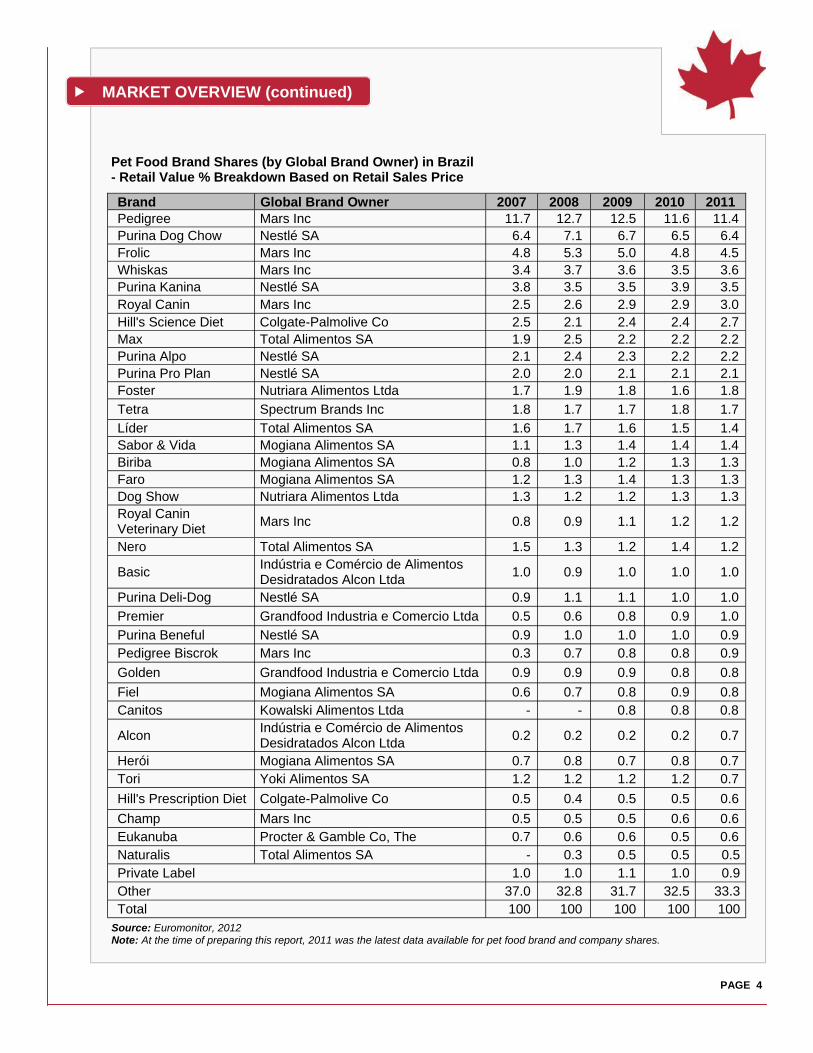
Mars Inc. has been the brand leader in the market for some time now, representing 23.5% of the
industry in 2011. It is followed closely by Nestlé SA who controls a market share of 15.8%. Together, these companies are responsible for the top six selling brands of pet food in Brazil.
Although these big players seek to saturate the market, other companies have been able to tap into it
by marketing to specific pets with specific diets. For example, the seventh-highest earning brand in the market in 2011 was Colgate-Palmolive’s ‘Hill’s Science Diet’, a nutrient and vitamin-enriched food available for both cats and dogs, that is developed in different formulas to suit the varying health needs among these animals.
MARKET OVERVIEW (continued)
PAGE 4
Brand Global Brand Owner 2007 2008 2009 2010 2011 Pedigree Mars Inc 11.7 12.7 12.5 11.6 11.4 Purina Dog Chow Nestlé SA 6.4 7.1 6.7 6.5 6.4 Frolic Mars Inc 4.8 5.3 5.0 4.8 4.5 Whiskas Mars Inc 3.4 3.7 3.6 3.5 3.6 Purina Kanina Nestlé SA 3.8 3.5 3.5 3.9 3.5 Royal Canin Mars Inc 2.5 2.6 2.9 2.9 3.0 Hill's Science Diet Colgate-Palmolive Co 2.5 2.1 2.4 2.4 2.7 Max Total Alimentos SA 1.9 2.5 2.2 2.2 2.2 Purina Alpo Nestlé SA 2.1 2.4 2.3 2.2 2.2 Purina Pro Plan Nestlé SA 2.0 2.0 2.1 2.1 2.1 Foster Nutriara Alimentos Ltda 1.7 1.9 1.8 1.6 1.8
Tetra Spectrum Brands Inc 1.8 1.7 1.7 1.8 1.7
Líder Total Alimentos SA 1.6 1.7 1.6 1.5 1.4 Sabor & Vida Mogiana Alimentos SA 1.1 1.3 1.4 1.4 1.4 Biriba Mogiana Alimentos SA 0.8 1.0 1.2 1.3 1.3 Faro Mogiana Alimentos SA 1.2 1.3 1.4 1.3 1.3 Dog Show Nutriara Alimentos Ltda 1.3 1.2 1.2 1.3 1.3 Royal Canin Veterinary Diet
Mars Inc 0.8 0.9 1.1 1.2 1.2
Nero Total Alimentos SA 1.5 1.3 1.2 1.4 1.2
Basic Indústria e Comércio de Alimentos Desidratados Alcon Ltda
1.0 0.9 1.0 1.0 1.0
Purina Deli-Dog Nestlé SA 0.9 1.1 1.1 1.0 1.0
Premier Grandfood Industria e Comercio Ltda 0.5 0.6 0.8 0.9 1.0
Purina Beneful Nestlé SA 0.9 1.0 1.0 1.0 0.9 Pedigree Biscrok Mars Inc 0.3 0.7 0.8 0.8 0.9
Golden Grandfood Industria e Comercio Ltda 0.9 0.9 0.9 0.8 0.8
Fiel Mogiana Alimentos SA 0.6 0.7 0.8 0.9 0.8 Canitos Kowalski Alimentos Ltda - - 0.8 0.8 0.8
Alcon Indústria e Comércio de Alimentos Desidratados Alcon Ltda
0.2 0.2 0.2 0.2 0.7
Herói Mogiana Alimentos SA 0.7 0.8 0.7 0.8 0.7 Tori Yoki Alimentos SA 1.2 1.2 1.2 1.2 0.7
Hill's Prescription Diet Colgate-Palmolive Co 0.5 0.4 0.5 0.5 0.6
Champ Mars Inc 0.5 0.5 0.5 0.6 0.6 Eukanuba Procter & Gamble Co, The 0.7 0.6 0.6 0.5 0.6 Naturalis Total Alimentos SA - 0.3 0.5 0.5 0.5 Private Label 1.0 1.0 1.1 1.0 0.9 Other 37.0 32.8 31.7 32.5 33.3
100 100 100 100 100 Total
Pet Food Brand Shares (by Global Brand Owner) in Brazil - Retail Value % Breakdown Based on Retail Sales Price
Source: Euromonitor, 2012 Note: At the time of preparing this report, 2011 was the latest data available for pet food brand and company shares.

INDUSTRY TRENDS
PAGE 5
In Brazil, the health and wellness trend is on the rise, and many people are beginning to ensure that their pets stay in shape by eating healthy. This has led to a recent surge in the market for therapeutic and functional non-therapeutic pet foods. Many brands are developing foods that target pets with weight problems, digestive diseases, or urinary tract infections, among others. The market for dog and cat therapeutic and functional non-therapeutic foods is expected to increase at a compound annual growth rate (CAGR) of 4% over the forecast period of 2013 to 2017.
Although gross domestic product (GDP) growth did not meet its target for 2012, there has been a
strong increase in both the middle class population of Brazil and the amount of disposable income available to them. These factors, along with government benefits and raised salaries, have led to an increase in both pet ownership and pet spending.
Combined, sales of dog and cat food accounted for 82% of all pet care products sold in Brazil in 2012.
Both benefit from established products and a solid market base, and are growing at a rate faster than any pet care product currently on the market. Still, companies cannot simply hope to gain more sales by pushing more volume of the same products. Pet food brands must diversify their products and offer foods to specific breeds and ages in order to appeal to more discerning consumers.
Over the past five years, Brazil’s cat population rose an outstanding 37.6%, and the dog population
rose by 14%, while the other pet populations remained relatively stable for the 2007 to 2012 period. The spike in cat ownership can likely be attributed to the strong growth of smaller households, childless couples, and young adults living alone in Brazil. Cats require much less round-the-clock care than most other pets, and are thus favoured among consumers in this population who, for the most part, live in apartment buildings and work during the day.
Pet shops continue to remain the primary place to purchase cat and dog food in Brazil, representing
47.2% of sales in 2012. They have always been the favourite in Brazil as they offer a wide variety of therapeutic and breed-specific foods. However, grocery retailers are becoming slightly more prominent in this market, representing 23.5% of sales for 2012, due to their ability to sell the large economy brands at a reasonable price.
Gaining the recognition and endorsement of veterinarians is a new market tactic employed by larger
businesses in Brazil to increase awareness of their therapeutic pet foods. Colgate-Palmolive, for example, has been known to host conferences with various veterinarians to explain the health benefits of their cat and dog food brand, Hill’s Science Diet. By gaining veterinarian approval, they have established this brand as one of the most trusted, and therefore purchased, in the Brazilian market.
2007 2008 2009 2010 2011 2012
Dog population 31,242.0 32,478.0 33,259.9 34,089.5 34,947.0 35,698.1
Cat population 15,127.0 15,986.0 16,962.8 17,897.4 19,352.2 20,815.3
Bird population 18,932.5 19,627.0 20,192.6 19,889.7 20,188.0 20,309.1
Fish population 18,693.0 19,293.0 19,600.0 19,879.0 20,326.3 20,684.0
Small mammal population 1,080.6 1,113.9 1,141.3 1,175.0 1,210.2 1,241.1
Reptile population 55.0 54.1 55.1 56.1 55.6 55.5
Pet Population in Brazil - in Thousands of Animals
Source: Euromonitor, 2012

GLOBAL COMPETITION
PAGE 6
Brazil’s imports of pet food have risen steadily since 2007, with the only exception being a drop of US$15 million in 2009 due to the economic recession. In the past five years, Brazilian pet food imports have grown 66.1%, reaching just under US$222 million in 2012.
China is Brazil’s largest supplier of pet food in the world, accounting for approximately 32% of their
imports in that category for 2012.
Though the U.S. has dominated the pet food market for some time, Brazil is experiencing much higher
growth in the industry, seeing value sales increase by 74.8% since 2007. On a global scale, Brazilian pet food sales jumped from fourth to second place during the same time period.
2007 2008 2009 2010 2011 2012
World 133.6 154.9 139.2 169.0 200.0 221.9
China 23.1 42.6 33.1 53.1 64.9 70.4
Netherlands 29.9 24.7 17.5 26.4 23.5 25.4
France 6.7 12.2 11.3 17.2 19.1 25.1
United States 29.0 21.9 20.7 19.6 22.8 24.9
Belgium 8.6 8.4 10.4 10.7 13.7 15.9
Argentina 2.9 4.6 4.1 6.6 12.2 15.4
United Kingdom 8.5 11.5 20.3 6.4 14.5 13.3
Germany 3.4 4.3 4.3 7.5 7.2 6.7
Canada 6.5 7.7 6.1 6.1 3.7 4.7
Austria 4.9 3.5 3.3 4.2 5.7 3.5 Source: Global Trade Atlas, 2012.
2007 2008 2009 2010 2011 2012
World 56,137.5 60,135.8 63,267.8 65,418.2 68,285.3 71,914.7
United States 16,566.7 17,723.2 18,553.0 18,572.3 18,996.4 19,676.3
Brazil 3,673.4 4,287.5 4,701.8 5,234.1 5,826.6 6,420.1
Japan 5,999.5 6,084.5 6,087.6 5,791.9 5,635.0 5,551.6
United Kingdom 3,846.0 3,991.7 4,176.4 4,403.0 4,682.0 4,953.2
Germany 3,539.5 3,704.4 3,810.1 3,844.6 3,866.1 3,922.4
France 3,441.1 3,532.6 3,624.7 3,700.3 3,794.5 3,879.0
Russia 1,191.2 1,474.7 1,670.0 1,924.8 2,219.6 2,658.6
Italy 2,240.7 2,340.3 2,452.8 2,530.5 2,580.2 2,618.3
Mexico 1,215.3 1,492.9 1,626.9 1,850.2 1,977.7 2,159.1
Australia 1,650.6 1,761.1 1,895.0 1,961.4 1,991.6 2,034.3
Brazilian Imports from the World - Pet Food Put Up for Retail Sale - Value in US$ millions
Source: Euromonitor, 2012
Pet Food Market Sizes based on Retail Sales (by Country) - Value in US$ millions

DOG FOOD
PAGE 7
The dog population in Brazil grew 2% in 2012 to reach a total of 35.7 million. The number of pet dogs has only slightly fluctuated over the years, with the number of Brazilian homes having a dog rising just 1.4% since 2007.
In 2012, 46.4% of households in Brazil owned a dog, making them the most popular pet in the country.
Dogs are becoming a more valued member of the family and are treated as such by their owners, who are willing to spend more money on better, healthier food for their pets. In fact, Nestlé Brazil Ltda conducted its new promotional campaigns under the slogan “He’s more than a dog... he’s part of the family,” which clearly resonates with the Brazilian trend of pet humanization.
Over the course of the 2007-2012 review period, dog food has increased at a constant value CAGR of
12% to reach sales of US$4.9 billion. Due to limited growth, the dog population is aging as a whole. This creates opportunities for companies
like Premier, who launched an anti-aging dog food formula last year for canines between 4 and 7 years of age.
The prepared packaged dog food market is expanding significantly in Brazil, as it recovers from the
effects of the recession. Traditionally, economy dry dog food was the preferred choice due to its low cost, but as Brazilian consumers become wealthier, they are willing to spend more on convenient, healthy foods for their dogs.
From 2013 to 2017, dog food sales are expected to increase at a total rate of 27.7% to reach just over
US$6.2 billion. Over the course of this forecast period, dog treats and mixers are expected to experience significant growth of just over 60%, representing a CAGR of 10%. This is likely due to the increases in pet humanization and consumer incomes which gives owners more cause to spoil their pets with things like treats and food mixers.
2007 2008 2009 2010 2011 2012 Total dog food 2,834.0 3,290.0 3,651.5 4,055.2 4,504.3 4,922.7
Dog treats and mixers 29.3 73.6 91.4 101.8 114.3 130.9 Dry dog food 2,781.7 3,190.4 3,532.1 3,924.2 4,357.2 4,756.4 Wet dog food 23.0 26.0 28.0 29.2 32.9 35.3
2013 2014 2015 2016 2017 Total dog food 5,223.0 5,504.0 5,741.0 6,005.5 6,257.3
Dog treats and mixers 144.0 165.1 179.2 194.9 210.6 Dry dog food 5,042.5 5,301.0 5,522.5 5,770.0 6,005.0 Wet dog food 36.5 37.9 39.3 40.6 41.7
Source for both: Euromonitor International, 2012 Note: The figures used in both tables were derived from Brazilian currency at a fixed exchange rate of R$1.6678 = US$1.00.
Sales of Dog Food in Brazil by Type - Value in fixed US$ millions
Forecast Sales of Dog Food in Brazil by Type - Value in fixed US$ millions
DOG FOOD (continued)
PAGE 8
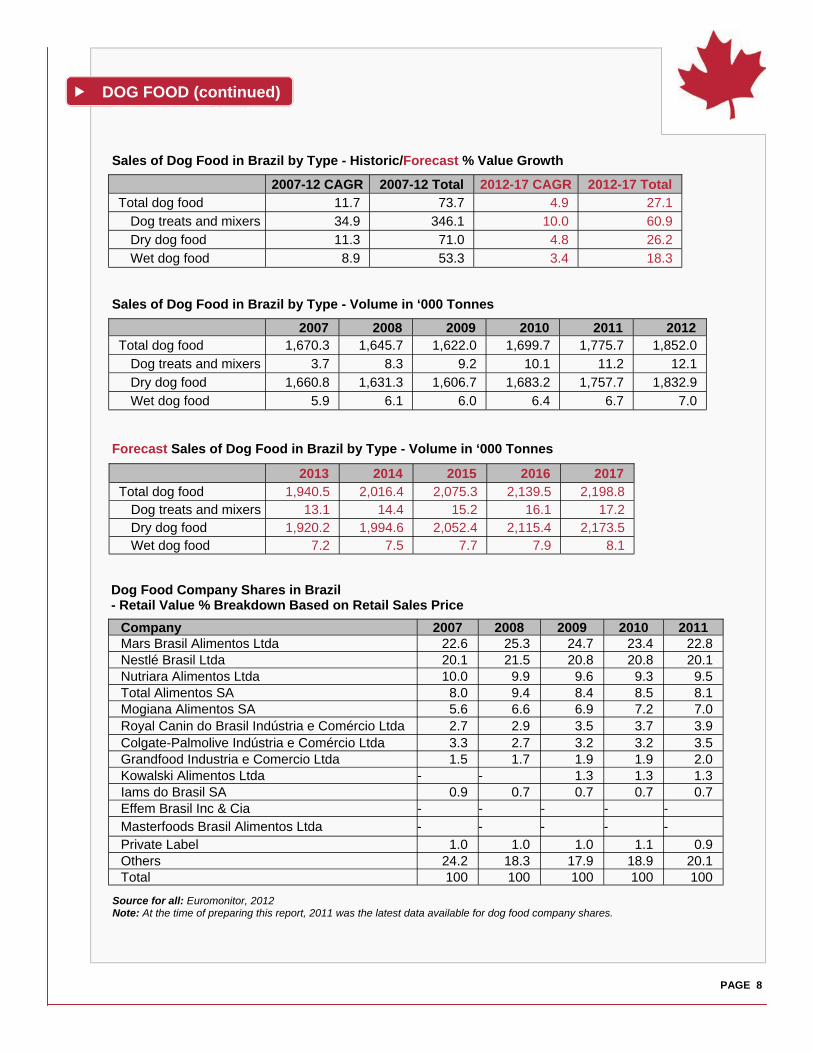
2007-12 CAGR 2007-12 Total 2012-17 CAGR 2012-17 Total Total dog food 11.7 73.7 4.9 27.1
Dog treats and mixers 34.9 346.1 10.0 60.9 Dry dog food 11.3 71.0 4.8 26.2 Wet dog food 8.9 53.3 3.4 18.3
2007 2008 2009 2010 2011 2012 Total dog food 1,670.3 1,645.7 1,622.0 1,699.7 1,775.7 1,852.0
Dog treats and mixers 3.7 8.3 9.2 10.1 11.2 12.1 Dry dog food 1,660.8 1,631.3 1,606.7 1,683.2 1,757.7 1,832.9 Wet dog food 5.9 6.1 6.0 6.4 6.7 7.0
2013 2014 2015 2016 2017 Total dog food 1,940.5 2,016.4 2,075.3 2,139.5 2,198.8
Dog treats and mixers 13.1 14.4 15.2 16.1 17.2 Dry dog food 1,920.2 1,994.6 2,052.4 2,115.4 2,173.5 Wet dog food 7.2 7.5 7.7 7.9 8.1
Company 2007 2008 2009 2010 2011 Mars Brasil Alimentos Ltda 22.6 25.3 24.7 23.4 22.8 Nestlé Brasil Ltda 20.1 21.5 20.8 20.8 20.1 Nutriara Alimentos Ltda 10.0 9.9 9.6 9.3 9.5 Total Alimentos SA 8.0 9.4 8.4 8.5 8.1 Mogiana Alimentos SA 5.6 6.6 6.9 7.2 7.0 Royal Canin do Brasil Indústria e Comércio Ltda 2.7 2.9 3.5 3.7 3.9 Colgate-Palmolive Indústria e Comércio Ltda 3.3 2.7 3.2 3.2 3.5 Grandfood Industria e Comercio Ltda 1.5 1.7 1.9 1.9 2.0 Kowalski Alimentos Ltda - - 1.3 1.3 1.3 Iams do Brasil SA 0.9 0.7 0.7 0.7 0.7 Effem Brasil Inc & Cia - - - - - Masterfoods Brasil Alimentos Ltda - - - - - Private Label 1.0 1.0 1.0 1.1 0.9 Others 24.2 18.3 17.9 18.9 20.1 Total 100 100 100 100 100
Dog Food Company Shares in Brazil - Retail Value % Breakdown Based on Retail Sales Price
Source for all: Euromonitor, 2012 Note: At the time of preparing this report, 2011 was the latest data available for dog food company shares.
Sales of Dog Food in Brazil by Type - Historic/Forecast % Value Growth
Sales of Dog Food in Brazil by Type - Volume in ‘000 Tonnes
Forecast Sales of Dog Food in Brazil by Type - Volume in ‘000 Tonnes

PAGE 9
Cats are owned by just over 20% of households in Brazil, and are slowly becoming the pet of choice amongst the emerging middle class population. Compared to dogs, cats are less demanding and time consuming in terms of care requirements and therefore, make more convenient pets for those with tighter schedules and budgets.
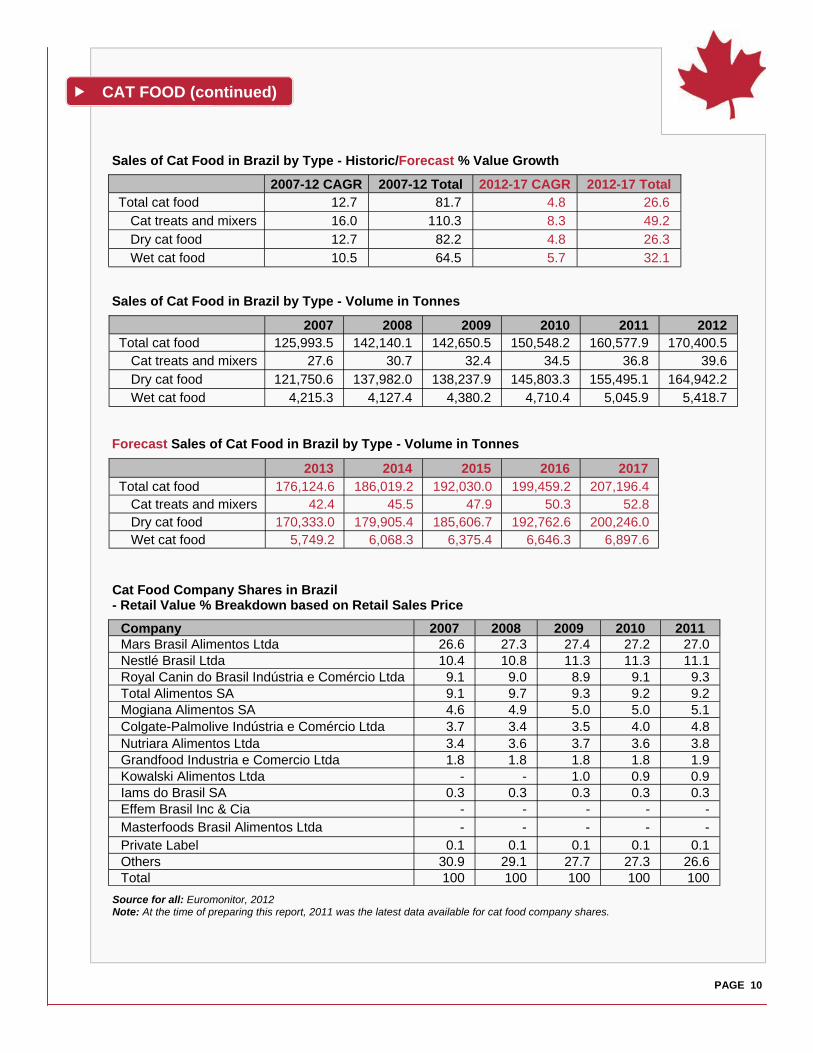
Cat food sales grew at a constant CAGR of 12.7% from 2007 to 2012, to attain a value of
US$869.6 million in 2012. Driving these increases was a spike in cat treats and mixers, which had a CAGR of 16%, and dry cat food with a CAGR of 12.7%.
Dry cat food continues to dominate the Brazilian cat food market, accounting for 97% of all cat food
sold in 2012 in value terms. Wet cat food is quite expensive compared to dry and is seen as more of a treat or reward by cat owners. Though it only accounted for 3% of cat food sales, wet food is still on the rise, increasing slightly more rapidly than dry cat food with a sales growth of 13.5% in 2012.
The cat food market continues to be led by Mars Ltda. and Nestlé SA. who own shares of 27% and
11.1% respectively. These companies have a solid advantage in terms of capital and resources, giving them more research and marketing opportunities than smaller businesses. Mars used such advantages to dominate the market with their Whiskas brand, which is now so well recognized, it accounted for over 25% of all Brazilian cat food sales in 2011.
Total cat food sales are projected to grow 26.6% over the next five years (between 2013 and 2017),
bringing the industry value to US$1.1 billion in 2017. Segmentation and health benefits are two key attributes for the expanding cat food market. Brazilian
consumers are becoming wealthier and more aware of their cats’ specific needs, and thus demand either more specialized or more nutritious foods. Companies that wish to succeed in this market must put an emphasis on diversifying certain brands to suit cats of a specific age, breed, or health condition.
CAT FOOD
2007 2008 2009 2010 2011 2012 Total cat food 478.7 604.9 641.0 707.8 785.2 869.6
Cat treats and mixers 1.0 1.2 1.4 1.6 1.8 2.0 Dry cat food 462.3 586.4 622.0 686.4 761.2 842.4 Wet cat food 15.4 17.3 17.6 19.8 22.2 25.3
2013 2014 2015 2016 2017 Total cat food 903.9 962.5 1,001.6 1,050.4 1,100.6
Cat treats and mixers 2.2 2.4 2.6 2.8 2.9 Dry cat food 874.7 931.3 968.5 1,015.6 1,064.2 Wet cat food 27.0 28.8 30.5 32 33.3
Source for all: Euromonitor International, 2012 Note: The figures used in both tables were derived from Brazilian currency at a fixed exchange rate of R$1.6678 = US$1.00.
Sales of Cat Food in Brazil by Type - Value in fixed US$ millions
Forecast Sales of Cat Food in Brazil by Type - Value in fixed US$ millions
CAT FOOD (continued)
PAGE 10
2007-12 CAGR 2007-12 Total 2012-17 CAGR 2012-17 Total Total cat food 12.7 81.7 4.8 26.6
Cat treats and mixers 16.0 110.3 8.3 49.2 Dry cat food 12.7 82.2 4.8 26.3 Wet cat food 10.5 64.5 5.7 32.1
2007 2008 2009 2010 2011 2012 Total cat food 125,993.5 142,140.1 142,650.5 150,548.2 160,577.9 170,400.5
Cat treats and mixers 27.6 30.7 32.4 34.5 36.8 39.6 Dry cat food 121,750.6 137,982.0 138,237.9 145,803.3 155,495.1 164,942.2 Wet cat food 4,215.3 4,127.4 4,380.2 4,710.4 5,045.9 5,418.7
2013 2014 2015 2016 2017 Total cat food 176,124.6 186,019.2 192,030.0 199,459.2 207,196.4
Cat treats and mixers 42.4 45.5 47.9 50.3 52.8 Dry cat food 170,333.0 179,905.4 185,606.7 192,762.6 200,246.0 Wet cat food 5,749.2 6,068.3 6,375.4 6,646.3 6,897.6
Company 2007 2008 2009 2010 2011 Mars Brasil Alimentos Ltda 26.6 27.3 27.4 27.2 27.0 Nestlé Brasil Ltda 10.4 10.8 11.3 11.3 11.1 Royal Canin do Brasil Indústria e Comércio Ltda 9.1 9.0 8.9 9.1 9.3 Total Alimentos SA 9.1 9.7 9.3 9.2 9.2 Mogiana Alimentos SA 4.6 4.9 5.0 5.0 5.1 Colgate-Palmolive Indústria e Comércio Ltda 3.7 3.4 3.5 4.0 4.8 Nutriara Alimentos Ltda 3.4 3.6 3.7 3.6 3.8 Grandfood Industria e Comercio Ltda 1.8 1.8 1.8 1.8 1.9 Kowalski Alimentos Ltda - - 1.0 0.9 0.9 Iams do Brasil SA 0.3 0.3 0.3 0.3 0.3 Effem Brasil Inc & Cia - - - - - Masterfoods Brasil Alimentos Ltda - - - - - Private Label 0.1 0.1 0.1 0.1 0.1 Others 30.9 29.1 27.7 27.3 26.6 Total 100 100 100 100 100
Source for all: Euromonitor, 2012 Note: At the time of preparing this report, 2011 was the latest data available for cat food company shares.
Cat Food Company Shares in Brazil - Retail Value % Breakdown based on Retail Sales Price
Sales of Cat Food in Brazil by Type - Historic/Forecast % Value Growth
Sales of Cat Food in Brazil by Type - Volume in Tonnes
Forecast Sales of Cat Food in Brazil by Type - Volume in Tonnes
OTHER PET FOOD
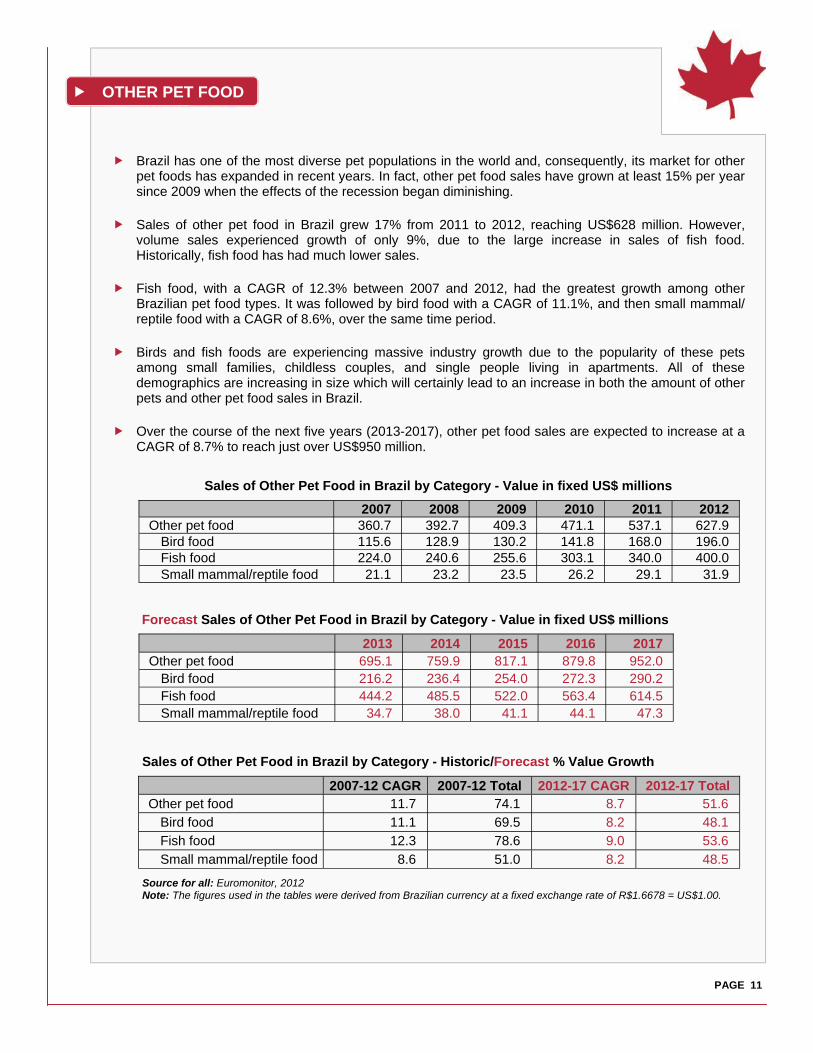
Brazil has one of the most diverse pet populations in the world and, consequently, its market for other pet foods has expanded in recent years. In fact, other pet food sales have grown at least 15% per year since 2009 when the effects of the recession began diminishing.
Sales of other pet food in Brazil grew 17% from 2011 to 2012, reaching US$628 million. However,
volume sales experienced growth of only 9%, due to the large increase in sales of fish food. Historically, fish food has had much lower sales.
Fish food, with a CAGR of 12.3% between 2007 and 2012, had the greatest growth among other
Brazilian pet food types. It was followed by bird food with a CAGR of 11.1%, and then small mammal/reptile food with a CAGR of 8.6%, over the same time period.
Birds and fish foods are experiencing massive industry growth due to the popularity of these pets
among small families, childless couples, and single people living in apartments. All of these demographics are increasing in size which will certainly lead to an increase in both the amount of other pets and other pet food sales in Brazil.
Over the course of the next five years (2013-2017), other pet food sales are expected to increase at a
CAGR of 8.7% to reach just over US$950 million.
2007 2008 2009 2010 2011 2012 Other pet food 360.7 392.7 409.3 471.1 537.1 627.9
Bird food 115.6 128.9 130.2 141.8 168.0 196.0 Fish food 224.0 240.6 255.6 303.1 340.0 400.0 Small mammal/reptile food 21.1 23.2 23.5 26.2 29.1 31.9
2013 2014 2015 2016 2017 Other pet food 695.1 759.9 817.1 879.8 952.0
Bird food 216.2 236.4 254.0 272.3 290.2 Fish food 444.2 485.5 522.0 563.4 614.5 Small mammal/reptile food 34.7 38.0 41.1 44.1 47.3
2007-12 CAGR 2007-12 Total 2012-17 CAGR 2012-17 Total Other pet food 11.7 74.1 8.7 51.6
Bird food 11.1 69.5 8.2 48.1 Fish food 12.3 78.6 9.0 53.6 Small mammal/reptile food 8.6 51.0 8.2 48.5
Source for all: Euromonitor, 2012 Note: The figures used in the tables were derived from Brazilian currency at a fixed exchange rate of R$1.6678 = US$1.00.
PAGE 11
Sales of Other Pet Food in Brazil by Category - Value in fixed US$ millions
Forecast Sales of Other Pet Food in Brazil by Category - Value in fixed US$ millions
Sales of Other Pet Food in Brazil by Category - Historic/Forecast % Value Growth

OTHER PET FOOD (continued)
Brand Company 2008 2009 2010 2011
BIRD FOOD
Tori Yoki Alimentos SA 38.4 42.2 45.8 22.7
Alcon Club Eco Indústria (C de A)* Desidratados Alcon Ltda - - - 17.8
Nutropica Grandfood Industria e Comercio Ltda - - - 9.0
Trill Mars Brasil Alimentos Ltda 26.3 30.1 32.1 7.5
Private label Private Label 4.0 4.5 - -
Others Others 31.3 23.2 22.0 42.9
Total Total 100 100 100 100
FISH FOOD
Tetra Aquarium Alimentos para Peixe Ltda 30.3 31.4 30.7 29.4
Basic Indústria (C de A)* Desidratados Alcon Ltda 16.8 17.9 17.7 17.8
Private label Private Label 2.5 2.6 2.6 2.5
Others Others 50.4 48.1 49.0 50.2
Total Total 100 100 100 100
SMALL MAMMAL/REPTILE FOOD
Alcon Indústria (C de A)* Desidratados Alcon Ltda 43.6 43.9 44.3 44.5
Others Others 56.4 56.1 55.7 55.5
Total Total 100 100 100 100
Other Pet Food Brand Shares (by Company) in Brazil by Category - Retail Value % Breakdown Based on Retail Sales Price
Source for all: Euromonitor, 2012 Note: At the time of preparing this report, 2011 was the latest data available for other pet food brand shares. *(C de A) in the table stands for (Comércio de Alimentos)
2007 2008 2009 2010 2011 2012 Other pet food 26,086.9 27,686.4 28,328.6 30,199.0 32,812.7 35,821.9
Bird food 24,159.2 25,666.7 26,295.6 28,017.9 30,455.5 33,272.6 Fish food 795.4 840.8 895.4 989.4 1,098.3 1,235.6 Small mammal/reptile food 1,132.3 1,178.9 1,137.6 1,191.6 1,259.0 1,313.7
2013 2014 2015 2016 2017 Other pet food 38,667.7 41,257.1 43,143.3 44,913.2 46,668.7
Bird food 35,967.7 38,413.5 40,176.7 41,803.8 43,388.2 Fish food 1,339.4 1,426.4 1,491.3 1,574.8 1,685.1 Small mammal/reptile food 1,360.6 1,417.2 1,475.3 1,534.5 1,595.4
PAGE 12
Forecast Sales of Other Pet Food in Brazil by Category - Volume in Tonnes
Sales of Other Pet Food in Brazil by Category - Volume in Tonnes
PRODUCT DEVELOPMENTS
PAGE 13
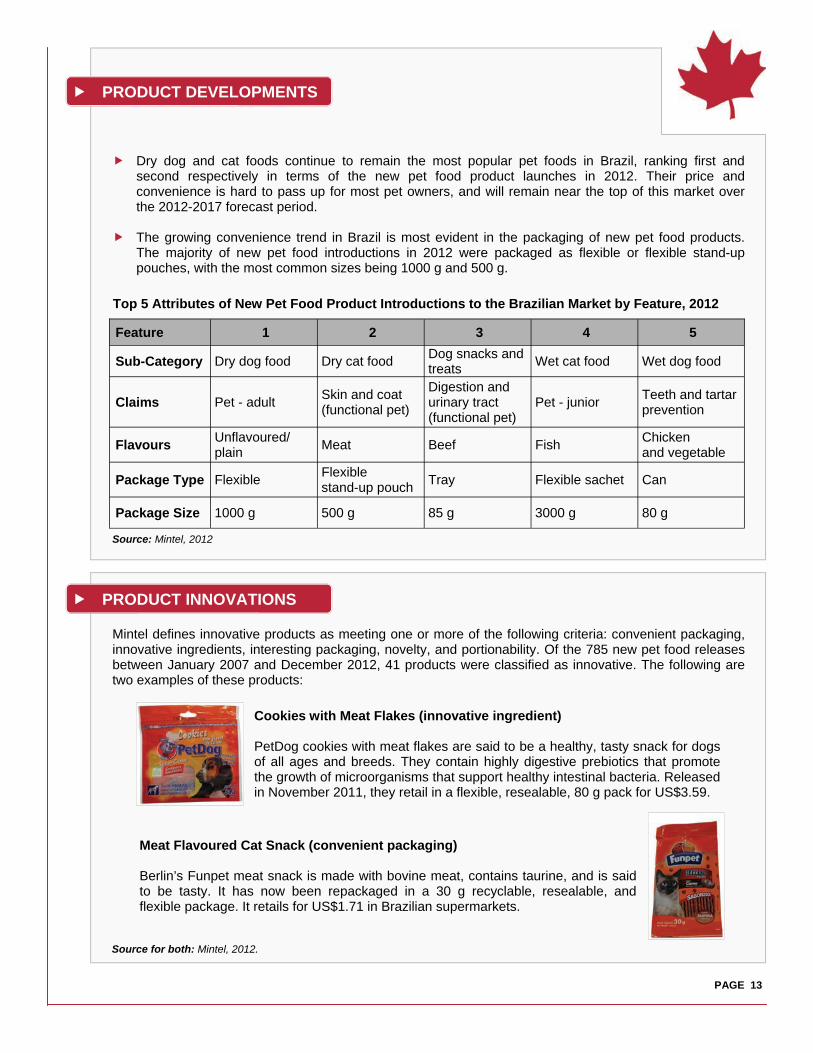
Top 5 Attributes of New Pet Food Product Introductions to the Brazilian Market by Feature, 2012
Feature 1 2 3 4 5
Sub-Category Dry dog food Dry cat food Dog snacks and treats
Wet cat food Wet dog food
Claims Pet - adult Skin and coat (functional pet)
Digestion and urinary tract (functional pet)
Pet - junior Teeth and tartar prevention
Flavours Unflavoured/ plain
Meat Beef Fish Chicken and vegetable
Package Type Flexible Flexible stand-up pouch
Tray Flexible sachet Can
Package Size 1000 g 500 g 85 g 3000 g 80 g
Dry dog and cat foods continue to remain the most popular pet foods in Brazil, ranking first and second respectively in terms of the new pet food product launches in 2012. Their price and convenience is hard to pass up for most pet owners, and will remain near the top of this market over the 2012-2017 forecast period.
The growing convenience trend in Brazil is most evident in the packaging of new pet food products.
The majority of new pet food introductions in 2012 were packaged as flexible or flexible stand-up pouches, with the most common sizes being 1000 g and 500 g.
Mintel defines innovative products as meeting one or more of the following criteria: convenient packaging, innovative ingredients, interesting packaging, novelty, and portionability. Of the 785 new pet food releases between January 2007 and December 2012, 41 products were classified as innovative. The following are two examples of these products:
Source: Mintel, 2012
PRODUCT INNOVATIONS
Cookies with Meat Flakes (innovative ingredient) PetDog cookies with meat flakes are said to be a healthy, tasty snack for dogs of all ages and breeds. They contain highly digestive prebiotics that promote the growth of microorganisms that support healthy intestinal bacteria. Released in November 2011, they retail in a flexible, resealable, 80 g pack for US$3.59.
Meat Flavoured Cat Snack (convenient packaging) Berlin’s Funpet meat snack is made with bovine meat, contains taurine, and is said to be tasty. It has now been repackaged in a 30 g recyclable, resealable, and flexible package. It retails for US$1.71 in Brazilian supermarkets.
Source for both: Mintel, 2012.

PAGE 14
PRODUCT INTRODUCTIONS, 2007-2012
There were 785 new pet food products introduced to the Brazilian market between January 2007 and December 2012. Brazil experienced a huge spike in 2009, with 336 new pet food products being launched as the worldwide economic downturn came to an end. Since then, new product introductions have declined, with only 76 new launches in 2012.
Of the new products released in this time period, a surprising majority (169) were unflavoured/plain.
Meat was the next most popular flavour category but appeared in only 75 new pet food products. Even among dog snacks and treats, plain was the most common flavour, which shows that companies are focusing less on taste and more on health. They are aware that consumers prefer natural or beneficial foods for their pets and are prioritizing these ingredients and benefits ahead of flavour.
Of the 785 new pet food launches between 2007 and 2012, 325
were dry dog food products, making it the most popular sub-category. The most popular flavours for dry dog foods were unflavoured/plain (81) and meat (27). The most popular claims in this sub-category were ‘vitamin/mineral fortified’ and ‘skin and coat (functional pet)’.
Dog snacks and treats recorded the second most pet food
releases with 229 between 2007 and 2012, followed by dry cat food (135).
Plain remained the most popular flavour among the second and third top-most subcategories, while
chicken and meat were more popular among wet dog and cat foods. The most used claim for dog snacks and treats was ‘teeth and tartar prevention’ and for dry cat food, it was ‘digestion and urinary tract’.
2007 2008 2009 2010 2011 2012
Product introductions 90 62 332 119 106 76
New Pet Food Introductions in Brazil, by Year
Source: Mintel, 2012.
Top Sub-Categories for New Product Launches
1. Dry dog food 2. Dog snacks and treats 3. Dry cat food 4. Wet dog food 5. Wet cat food
Source for all: Mintel, 2012.
Ultra Soft Kitten Food
Wet cat food (May. 2012)
Sub-Categories
Lamb and Rice Dog Food
Dry dog food (Oct. 2012)
Barbecue Flavoured Dog Treats
Dog snacks and treats (Sep. 2010)
Premium Dry Cat Food
Dry cat food (Jun. 2009)
Chicken Pate for Dogs
Wet dog food (Sep. 2009)

PAGE 15
PRODUCT INTRODUCTIONS, 2007-2012 (continued)
Top Claims for New Product Launches
1. Vitamin/mineral fortified 2. Skin and coat (functional
pet) 3. Digestion and urinary tract
(functional pet) 4. Teeth and tartar prevention
(functional pet) 5. Premium
’Vitamin/mineral fortified’ was the most popular claim for new pet food products launched between 2007 and 2012, although not by much. It was used by 198 of 785 products, followed closely by ‘skin and coat’ on 191 products, and ‘digestion and urinary tract’ on 188.
Among the new releases with the three most popular claims, a
majority were new products. This exemplifies how companies are claiming health benefits to successfully launch new products.
Among these products, the most frequent flavour was no flavour at
all, accounting for 214 of products with these five top claims.
Flexible is the clear frontrunner in package types, featured in 519 of the 785 new product launches between 2007 and 2012. Flexible stand-up pouches are also gaining popularity, representing the second-most popular package type with 70 launches.
In terms of package size, bigger seems to be better with the three
most frequent being 1000 g, 8000 g, and 2000 g respectively. However, the 65 g package also gained popularity with the rise in introductions of snacks and treats.
Combining the package types and sizes, it was no surprise that
flexible, 1000 g packages were the most popular among the new launches with 131 releases. This was followed by flexible 8000 g packs, and then flexible 2000 g packs.
Calcium Enriched Snack
Vitamin/mineral fortified (Mar. 2007)
Natural Dog Food Skin and coat (Oct. 2008)
Dry Food for Kitten and Adult Cats
Digestion and urinary tract (Jun. 2012)
Oral Hygiene Range for Dogs Teeth and tartar
prevention (Apr. 2008)
Super Premium Puppy Food
Premium (Aug. 2010)
Top Package Types and Sizes for New Product Launches
1. Flexible 2. Flexible stand-up pouch 3. Can 4. Flexible sachet 5. Carton
1. 1000 g 2. 8000 g 3. 2000 g
4. 65 g 5. 500 g
Prawn and Salmon Cat Food Flexible stand-up, 1000 g
(Jan. 2008)
Cat Food Can, (only in 340g)
(Mar. 2010)
Dry Dog Food Flexible, 8000 g
(Oct. 2009)
Chicken Snacks Flexible sachet, 65 g
(Sep. 2007)
Dog Biscuits Carton, 500 g (Mar. 2007)
Source for all: Mintel, 2012.
Source for all: Mintel, 2012.
Claims
Packaging

Consumer Trends: Pet Food in Brazil © Her Majesty the Queen in Right of Canada, represented by the Minister of Agriculture and Agri-Food (2013). ISSN 1920-6615 AAFC No. 12038E Photo Credits All photographs reproduced in this publication are used by permission of the rights holders. All images, unless otherwise noted, are copyright Her Majesty the Queen in Right of Canada. For additional copies, to request an alternate format, and for all other inquiries regarding this publication, please contact: Agriculture and Agri-Food Canada, Global Analysis Division 1341 Baseline Road, Tower 5, 4th floor Ottawa, ON Canada K1A 0C5 E-mail: [email protected] Aussi disponible en français sous le titre : Tendances de consommation : Aliments pour animaux de compagnie au Brésil
The Government of Canada has prepared this report based on primary and secondary sources of information. Although every effort has been made to ensure that the information is accurate, Agriculture and Agri-Food Canada (AAFC) assumes no liability for any actions taken based on the information contained herein.
Reproduction or redistribution of this document, in whole or in part, must include acknowledgement of Agriculture and Agri-Food Canada as the owner of the copyright in the document, through a reference citing AAFC, the title of the document and the year. Where the reproduction or redistribution includes data from this document, it must also include an acknowledgement of the specific data source(s), as noted in this document. Agriculture and Agri-Food Canada provides this document and other report services to agriculture and food industry clients free of charge.