consumers’ expectations of over-the-counter (otc) medicines
TRANSCRIPT

CONSUMERS’ EXPECTATIONS OF
OVER-THE-COUNTER (OTC) MEDICINES:
LOCATION OF SALE
A Thesis
Submitted to the College of Graduate Studies and Research
in Partial Fulfillment of the Requirements
for the Degree of Master of Science
in the College of Pharmacy and Nutrition
University of Saskatchewan
Saskatoon
By Ya-Ning (Helen) Lo
©Copyright Ya-Ning (Helen) Lo, August 2006. All rights reserved.

PERMISSION TO USE STATEMENT
In the presenting of this thesis in partial fulfillment of the requirements for a
Postgraduate degree from the University of Saskatchewan, I agree that the Libraries of
this University may make it freely available for inspection. I further agree that
permission for copying of this thesis in any manner, in whole or in part, for scholarly
purposes may be granted by any of the following:
Jeff G. Taylor, Ph. D.
College of Pharmacy and Nutrition
In their absence, permission may be granted by the Dean of the College of
Pharmacy and Nutrition. It is understood that any copying or publication or use of this
thesis or parts thereof for financial gain shall not be allowed without any written
permission. It is also understood that due recognition shall be given to me and to the
University of Saskatchewan in any scholarly use which may be made of any material in
my thesis.
Requests for permission to copy or to make other use of material in this thesis in
whole or part should be addressed to:
Dean of College of Pharmacy and Nutrition
University of Saskatchewan
110 Science Place
Saskatoon, Saskatchewan
S7N 5C9
i

ABSTRACT
Over-the counter (OTC) medicines are used commonly for treating minor
illnesses. Even though most Canadians believe that OTC medicines are safe and
effective, they can pose some risk through side effects and interactions if people do not
take them with due care. With notable exceptions, people in Canada can purchase OTC
medicines from pharmacies or non-pharmacy outlets such as convenience stores. Global
trends in medicine-related legislation are leading to more of these products ending up in
retail outlets other than pharmacies. Therefore, understanding public attitudes involving
OTC medicine is becoming more and more important. Public expectations of OTC
medicines in relation to location of sale were investigated in this study. It was
hypothesized that the product buying public would perceive medicines differently based
on where they are sold.
Adult Saskatoon residents over 18 years old (n = 2547) were randomly selected
from a telephone registry. Advance letters were initially mailed to them, followed by a
ten page questionnaire and two reminder letters. Non-response letters were only sent to
subjects who did not reply after two reminders. Subjects were asked to indicate what
attributes (effectiveness, safety, potency, side effect propensity, price, etc.) they would
expect from OTC medicines depending on where they were purchased – pharmacies
versus convenience stores.
The usable response rate was 57.5 percent. Almost every participant (96.1 percent)
had bought OTC medicines from pharmacies. Most respondents (80.7 percent) were
aware that OTC medicines could be purchased in convenience stores; however, only
42.2 percent of respondents had purchased OTC medicines from such locations.
Significantly different expectations for the two locations were seen for product variety
and quality, price, and ability to get help. Pharmacies should have a better selection of
products and be of better quality than these OTC medicines sold in convenience stores.
Public expectations for OTC product potency, safety, effectiveness, propensity for side
effects, and package information did not differ across locations. The findings of this
study suggest that location of sale has minimal effect on Saskatoon residents’
expectations of OTC medicines along clinical attributes. Saskatoon residents also appear
ii

to have healthy attitudes regarding OTC medicines and realize care is needed during
their use. This may have implications in how people use such products after they are
purchased and may be important for how they are scheduled for the Canadian
marketplace.
iii

ACKNOWLEDGMENTS
First of all, I would like to express my sincere appreciation to my supervisor, Dr.
Jeff Taylor. I thank him for giving me the opportunity to be a graduate student in the
College of Pharmacy and Nutrition, University of Saskatoon. I appreciate Dr. Taylor’s
detailed instructions in guiding me how to do the research work and to write a thesis
professionally. These have a great influence in my future career.
I would like to thank my advisory committee members, Dr. Alfred Rémillard, Dr.
Linda Suveges, and Dr. Roy Dobson for their valuable time, suggestions, and kindness
throughout my graduate studies. Special appreciation also goes to Dr. Linda Suveges for
providing a part of the financial support for my research work.
I wish to thank the entire staff and graduate students of the College of Pharmacy
and Nutrition, especially my colleagues in Room 124 Thorvaldson Building (2001-2004),
for their care, cooperation and support from the inception of my graduate studies to the
every end. Deep appreciation extends to two great secretaries, Sandy Knowles and Tracy
McLennan, for their kind help during the survey.
I also want to thank my friends in Taiwan and in Saskatoon, especially Ya-Chen
Lo, Julia Ji, and Carol Tai, for their moral support during the years of my living in
Saskatoon.
Finally, I would like to acknowledge my dear parents (Yu-Hsin Lo and Mei-Fang
Hsu), my sister (Ya-Ting Lo), and my brother (Kuan-Wu Lo) for their love,
encouragement and support to make my dream come true.
This project was funded in part by the College of Pharmacy and Nutrition
Research Trust Fund and in part by the research funds of the Assistant Dean (Dr. Linda
Suveges). My personal funding was from the Ford Postgraduate Fellowship and
Walgreen Co. Scholarship in Pharmacy Practice Research.
iv

DEDICATION
This Thesis Is Dedicated to
My Parents, Yu-Hsin Lo and Mei-Fang Hsu
v

TABLE OF CONTENTS
PERMISSION TO USE STATEMENT…………………………………….....
ABSTRACT…………………………………………………………………….
ACKNOWLEDGMENTS………………………………………………..…….
DEDICATION………………………………………………………………….
TABLE OF CONTENTS………………………………………………………
LIST OF TABLES……………………………………………………………...
LIST OF FIGURES…………………………………………………………….
i
ii
iv
v
vi
x
xiv
1 INTRODUCTION………………………………………………………....
2 LITERATURE REVIEW………………………………………………...
2.1 Introduction…………………………………………………………...
2.2 Self-Care, Self-Medication, and Minor Illness……………………….
2.2.1 Definitions of Self-Care/Self-Medication…………………….....
2.2.2 Benefits of Self-Care/Self-Medication…………………………..
2.2.3 Common Types of Minor Illnesses………………………………
2.3 OTC Medication Usage………………………………………………
2.3.1 OTC Medicines and Regulatory Systems………………………..
2.3.2 OTC Retail Market……………………………………………....
2.3.3 Pharmacy versus Non-Pharmacy Sales….………………………
2.3.4 Usage Figures of OTC Medicines……………………………….
2.3.5 Demographics of Users………………………………………….
2.4 Pharmacist’s Role in Self-Care.………………………………………
2.4.1 The Responsibilities of Pharmacists....…………………………..
2.4.2 The Frequency of Consumer-Pharmacist Interaction…………....
2.4.3 Barriers to Interaction……………………………………………
1
4
4
4
4
5
7
8
8
9
10
11
13
13
13
16
18
vi

2.5 Response of Public to Minor Illness………………………………….
2.5.1 Factors Influencing Responses to Minor Illnesses………………
2.5.2 Information Sources Used……………………………………….
2.5.3 Pharmacist Influence as OTC Consultants on Consumers………
2.5.4 Risks of Self-Care/Self-Medication……………………………...
2.5.5 Patronage Motives Associated with Location of Sale…………...
2.5.6 Consumer Perceptions of OTC Medicines………………………
3 OBJECTIVES……………………………………………………………..
3.1 Objective……………………………………………………………...
3.2 Significance of the Study……………………………………………..
3.3 Research Questions…………………………………………………...
3.4 Null Hypotheses………………………………………………………
4 METHODOLOGY………………………………………………………...
4.1 Overview……………………………………………………………...
4.2 Population/Sample……………………………………………………
4.3 Instrument Development……………………………………………..
4.3.1 Components and Item Wording of the Questionnaire…………...
4.3.1.1 Purchase and Use of OTC Medicines………....................
4.3.1.2 Information-Seeking Behaviour……………………………..
4.3.1.3 Minor Symptoms and Common OTC Products………….
4.3.1.4 Consumer Impressions of OTC Medicines and
Pharmacists……………………………………………...
4.3.1.5 Consumer Expectations of OTC Products……………….
4.3.1.6 Demographics……………………………………………
4.3.2 Assessment by Experts…………..................................................
4.3.3 Questionnaire Sensitivity………………………………………...
4.3.4 Pilot Test…………………………………………………………
4.4 Instrument Validity and Reliability…………………………………...
4.5 Instrument Delivery and Recovery…………………………………...
4.6 Data Analysis…………………………………………………………
4.7 Ethics…………………………………………………………………
20
21
23
25
27
28
32
34
34
34
35
35
36
36
36
37
37
38
39
39
40
40
40
41
42
42
42
43
44
45
vii

5 RESULTS…………………………………………………………………..
5.1 Instrument Development……………………………………………..
5.1.1 Item Wording of the Questionnaire…………...............................
5.1.2 Expectations Scale Pre-Test……………………………………..
5.1.3 The Reliability of Questionnaire………………………………...
5.1.4 Wording Suggestions from Interviewees………………………...
5.1.5 Pilot Test…………………………………………………………
5.2 Main Survey…………………………………………………………..
5.2.1 Response Rate…………................................................................
5.2.2 Demographics of Subjects……………………………………….
5.2.3 Consumers’ Experiences with Buying and Using Medicines……
5.2.4 Information-Seeking Behaviours………………………………...
5.2.5 Minor Illnesses…………………………………………………..
5.2.6 OTC Use and Effectiveness……………………………………...
5.2.7 Consumer Impressions of Care Needed When Using OTC
Medicines………………………………………………………...
5.2.8 Consumers’ Impressions of Pharmacists………………………...
5.2.9 Consumer Expectations of OTC Medicines According to
Location of Sale………………………………………………….
5.3 Test – Retest…………………………………………………………..
5.4 Potential for Non-Response Bias……………………………………..
6 DISCUSSION……………………………………………………………...
6.1 Reliability and Validity of Results……………………………………
6.2 Consumer Expectations of OTC Medicines According to Location of
Sale…………………………………………………………………...
6.3 Minor Illness and Use of OTC Medicines……………………………
6.4 Information-Seeking Behaviour……………………………………...
6.5 Consumer Impressions of Pharmacists…………………………….....
6.6 Limitations……………………………………………………………
6.7 Future Research………………………………………………………
7 CONCLUSION…………………………………………………………….
46
46
46
49
49
50
51
51
52
52
54
69
84
89
93
96
99
119
124
126
126
128
131
134
136
136
139
140
viii
8 REFERENCES…………………………………………………………….
9 APPENDICES……………………………………………………………..
Appendix A: The Wording Trial Document………………………………...
Appendix B: Working Version of the Questionnaire………………………..
Appendix C: The Final Version of the Questionnaire………………………
Appendix D: The Advance Letter…………………………………………..
Appendix E: The Cover Letter……………………………………………...
Appendix F: The First Follow-Up Letter…………………………………...
Appendix G: The Second Follow-Up Letter………………………………..
Appendix H: The Non-Response Card……………………………………..
Appendix I: Comments Section from the Word Trial Document…………...
142
156
157
162
172
182
183
185
186
187
188
ix

LIST OF TABLES
Table 2.1 Actions Taken by People in Response to Minor Illness……........ 21
Table 5.1 Consumer Ability to Distinguish Store-Type……………………. 47
Table 5.2 Consumer Shopping Experiences in Each Outlet………………. 47
Table 5.3 Comparison of Meanings of Each Word-Pairing………………... 48
Table 5.4 Expectations Scale Pre-Test: Difference in Public Expectations
of OTC Medicines for Two Locations (Convenience Store
versus Pharmacy)………………………………………………...
50
Table 5.5 Demographics of the Study Population…………………………. 53
Table 5.6 Frequency of OTC Purchases from Either Location Within the
Past Six Months………………………………………………….
59
Table 5.7 Frequency of OTC Purchases in Convenience Stores Within the
Past Six Months According to Demographic Parameters..............
60
Table 5.8 Frequency of OTC Purchases in Pharmacies Within the Past Six
Months According to Demographics Parameters………………..
61
Table 5.9 Frequency of Visits to Either Location for Any Reason Within
the Past 30 Days……………………………………....................
62
Table 5.10 Frequency of Pharmacy Visits Within the Past 30 Days
According to Demographic Parameters…………………….........
62
Table 5.11 Frequency of Convenience Store Visits Within the Past 30 Days
According to Demographic Parameters………………………….
63
Table 5.12 Number of Different Medicines Taken Within the Past 30 Days.. 64
Table 5.13 Number of OTC Medicines Taken Within the Past 30 Days
According to Demographic Parameters…………………….........
65
Table 5.14 Number of Prescription Medicines Taken Within the Past 30
Days According to Demographic Parameters……………………
66
Table 5.15 Consumer Claims for Reading Information on OTC Medicine
Packaging When BUYING or USING/GIVING a Product for
the First Time…………………………………………………….
69
x

Table 5.16 Claims for Information Sections Read by Consumers When
BUYING and USING/GIVING a Product for the First
Time…...........................................................................................
74
Table 5.17 Information Sections on an OTC Product Package That Would
be Read by Consumers When BUYING a Product for the First
Time by Demographic Parameters……………............................
75
Table 5.18 Information Sections on an OTC Product Package That Would
be Read by Consumers When USING/GIVING a Product for
the First Time by Demographic Parameters……………………...
76
Table 5.19 Frequency of Each Information Section That Would be Read by
Consumers When BUYING and USING/GIVING an OTC
Product for the First Time………………………………………..
77
Table 5.20 Propensity to Ask a Medical Doctor for Advice on OTC
Medicines………………………………………………………...
77
Table 5.21 Percentages of Consumers Who Had Received Advice from
Pharmacists Regarding OTC Medicines……………………........
80
Table 5.22 Propensity to Ask Pharmacists for Advice When Buying OTC
Medicines for the First Time…………………………..................
83
Table 5.23 Reasons Consumers Do Not Always Ask a Pharmacist for
Advice When Buying an OTC Medicine for the First Time…….
84
Table 5.24 Minor Symptoms Experienced by Respondents Within the Past
Six Months…………………………………………….................
85
Table 5.25 Number of Minor Symptoms Experienced by Consumers Within
the Past Six Months by Demographic Parameters…….................
86
Table 5.26 Number of Different Types of OTC Products Used Within the
Past Six Months………………………………………………….
90
Table 5.27 Types of OTC Products Consumers Used Within the Past Six
Months...........................................................................................
90
Table 5.28 Perceived Effectiveness of Each Type of OTC Medicine………. 92
Table 5.29 Impressions of Care Needed Regarding Use of OTC Medicines.. 94
xi

Table 5.30 Consumers’ Impressions of Pharmacists………………………… 97
Table 5.31 Consumer Expectations of OTC Medicines Sold in Convenience
Stores………………………………………….............................
101
Table 5.32 Consumer Expectations of OTC Medicines Sold in Pharmacies.. 102
Table 5.33 Difference in Public Expectations of OTC Medicines Between
Two Locations – Convenience Stores and Pharmacies…………..
104
Table 5.34 Difference in Public Expectations According to Awareness That
OTC Medicines Could be Purchased in Convenience Stores……
106
Table 5.35 Difference in Public Expectations According to Consumer
Experience with Purchasing OTCs from a Convenience Store….
107
Table 5.36 Difference in Public Expectations for OTCs available in
Convenience Stores According to Frequency of Purchases Made
from Convenience Stores………………………………………...
109
Table 5.37 Difference in Public Expectations for OTCs available in
Pharmacies According to Frequency of Purchases Made from
Pharmacies……………………………………………………….
110
Table 5.38 Difference in Public Expectations According to Frequency in
Taking OTC Medicines…………………………………………..
111
Table 5.39 Difference in Public Expectations According to Consumer
Experiences of Side Effects from OTC Use……………………..
113
Table 5.40 Difference in Public Expectations According to Gender………... 114
Table 5.41 Difference in Public Expectations According to Household
Income………………………………………………....................
116
Table 5.42 Difference in Public Expectations According to Education
Level...............................................................................................
117
Table 5.43 Difference in Public Expectations According to Age………........ 118
Table 5.44 Consistency of Responses for Questions of Part IV –
Impressions of Care Needed When Using OTC Medicines……..
120
Table 5.45 Consistency of Responses for Questions of Part V -- Impressions
of Pharmacists…………………...............................
121
xii

Table 5.46 Consistency of Responses for Questions of Part VI --
Expectations of OTC Medicines Sold in Convenience Stores…..
122
Table 5.47 Consistency of Responses for Questions of Part VI --
Expectations of OTC Medicines Sold in Pharmacies……………
123
Table 5.48 Comparison of Non-Responder and Responder Demographic
Data………………………………………………………………
125
xiii

LIST OF FIGURES
Figure 5.1 Percentage of Consumers Aware of the Option to Purchase OTC
Medicines in Convenience Stores by Education Level……..........
54
Figure 5.2 Percentage of Consumers Aware of the Option to Purchase OTC
Medicines in Convenience Stores by Household Income……….
55
Figure 5.3 Percentage of Consumers Aware of the Option to Purchase OTC
Medicines in Convenience Stores by Age……………………….
55
Figure 5.4 Number of Consumers Who Had Purchased OTC Medicines
from Either Location – Pharmacy vs. Convenience Store……….
56
Figure 5.5 Percentage of Male and Female Consumers Who Had Purchased
OTC Medicines from Each Location……………….....................
57
Figure 5.6 Percentage of Consumers Who Had purchased OTC Medicines
from Each Location by Education Level………………………...
57
Figure 5.7 Percentage of Consumers Who Had Purchased OTC Medicines
from Each Location by Household Income……………………...
57
Figure 5.8 Percentage of Consumers Who Had Purchased OTC Medicines
from Each Location by Age……………………………………...
58
Figure 5.9 Percentage of Consumers Who Had Purchased OTC Medicines
from Each Location by Parental/Guardian Status………………..
58
Figure 5.10 Frequency of Convenience Store Visits Within the Past 30 Days
by Age…………………………………………………………...
64
Figure 5.11 Average Number of Prescription Medicines Taken Within the
Past 30 Days by Education Level………………………………..
67
Figure 5.12 Average Number of Prescription Medicines Taken Within the
Past 30 Days by Household Income……………………………..
67
Figure 5.13 Average Number of Prescription Medicines Taken Within the
Past 30 Days by Age……………………………………………..
68
Figure 5.14 Consumers Claiming to Have Experienced Side Effect(s) Upon
Taking OTC Medicines………………………………………......
68
Figure 5.15 Propensity to Read OTC Medicine Package Information When
BUYING a Product for the First Time by Gender……………....
70
xiv
Figure 5.16 Propensity to Read OTC Medicine Package Information When
BUYING a Product for the First Time by Parent/Guardian
Status……………………………………………………………..
70
Figure 5.17 Propensity to Read OTC Medicine Package Information When
BUYING a Product for the First Time by Education Level……..
71
Figure 5.18 Propensity to Read OTC Medicine Package Information When
BUYING a Product for the First Time by Household Income…..
71
Figure 5.19 Propensity to Read OTC Medicine Package Information When
BUYING a Product for the First Time by Age…………………..
71
Figure 5.20 Propensity to Read OTC Medicine Package Information When
USING/GIVING a Product for the First Time by Gender………
72
Figure 5.21 Propensity to Read OTC Medicine Package Information When
USING/GIVING a Product for the First Time by
Parent/Guardian Status…………………………………………...
72
Figure 5.22 Propensity to Read OTC Medicine Package Information When
USING/GIVING a Product for the First Time by Education
Level……………………………………………………………...
73
Figure 5.23 Propensity to Read OTC Medicine Package Information When
USING/GIVING a Product for the First Time by Household
Income…………………………………………………………....
73
Figure 5.24 Propensity to Read OTC Medicine Package Information When
USING/GIVING a Product for the First Time by Age………….
73
Figure 5.25 Propensity to Ask a Medical Doctor for Advice on OTC
Medicines by Gender…………………………………………….
78
Figure 5.26 Propensity to Ask a Medical Doctor for Advice on OTC
Medicines by Parent/Guardian Status…………………………....
79
Figure 5.27 Propensity to Ask a Medical Doctor for Advice on OTC
Medicines by Education Level…………………………………...
79
Figure 5.28 Propensity to Ask a Medical Doctor for Advice on OTC
Medicines by Household Income………………………………...
79
Figure 5.29 Propensity to Ask a Medical Doctor for Advice on OTC
Medicines by Age………………………………………………..
80
xv

Figure 5.30 Consumer Receipt of Advice from Pharmacists on OTC
Medicines by Gender…………………………………………….
81
Figure 5.31 Consumer Receipt of Advice from Pharmacists on OTC
Medicines by Parent/Guardian Status……………………………
81
Figure 5.32 Consumer Receipt of Advice from Pharmacists on OTC
Medicines by Education Level…………………………………...
82
Figure 5.33 Consumer Receipt of Advice from Pharmacists on OTC
Medicines by Household Income………………………………...
82
Figure 5.34 Consumer Receipt of Advice from Pharmacists on OTC
Medicines by Age………………………………………………..
82
Figure 5.35 Mean Number of Minor Symptoms Experienced by Consumers
Within the Past Six Months by Age……………………………...
86
Figure 5.36 Frequency of Each Symptom Experienced by Respondents
Within the Past Six Months……………………………………...
87
Figure 5.37 Percentage of Male and Female Respondents Who Experienced
Each Symptom…………………………………………………..
88
Figure 5.38 The Percentages of Consumers in Each Age Group Who Had
Experienced Headaches, Dry Skin, Constipation and Difficulty
Getting to Sleep…………………………………………………..
89
Figure 5.39 Frequency of Global Scores to Reflect Care Needed during OTC
Medicine Use……………………………………………..............
95
Figure 5.40 Frequency of Each Sum Score for the Impression of
Pharmacists……………………………………………………….
98
xvi

CHAPTER 1: INTRODUCTION
The four essential levels of care are self-care, primary professional care, general
specialist care, and tertiary specialist care.1 Self-care is the broad base of health care, and
a frequent part of everyday life. For instance, if a symptom is not considered serious,
people will often choose to ignore it or self-treat it, rather than seeking a professional’s
help. In recent years, the idea of self-care has been strongly promoted by governments in
many countries. People are being encouraged to monitor their own illnesses, self-treat
minor symptoms, prevent diseases, and improve/maintain their health. Studies in the
United Kingdom and the United States show that people provide 66-95 percent of all
health care for themselves and their families.2-6
Within the self-care structure, over-the-counter (OTC) medicine is a major
element. People often use OTC products to treat their minor illnesses, which usually are
common health problems such as colds, headaches, heartburn, and sore feet. In a British
study, Dunnell and Cartwright found that using OTC medicine was the most frequently
reported response to symptoms associated with minor illnesses, surpassing “doing
nothing,” “seeing a physician,” and all other treatment options.7 According to this study,
96 percent of the study population believed the OTC medicines really did help. Another
British study reported that 66 percent of the respondents had taken OTC medicines
during a one-month study period, in contrast to the 25 percent who had taken
prescription medicines during the same period.8 In Canada, OTC drugs are also
commonly used and thus play an important role in its health care system. For instance, a
Canadian report showed that over 90 percent of Canadians used an OTC product in
1991.9 A more recent study indicated that 58 percent of Canadians took an OTC
medication in the last six months.10 These studies suggest that OTC medicine is indeed a
common choice for treating minor conditions.
The Canadian OTC market has been growing year by year. In 1999, the self-
1

care products industry generated approximately $2.9 billion in sales (including OTC
drugs and natural health products).11 According to a report released by the Canadian
Institute for Health Information, an estimated $3.3 billion was spent on the OTC market
(including OTC drugs and personal health supplies) in 2001, a 13.8 percent increase
over 1999.12 One explanation for this growth is that more and more OTC products are
available on the market.
If the medicine is classified as an unscheduled drug in Canada, it can be sold
from any retail outlet. Products such as Benylin DM, Sudafed, Tylenol, Advil, and
Nicorette gum are in this category.
In the United States, there are no restrictions and OTC products can be purchased
from all locations. Thus, people in North America can purchase such products from
pharmacies or from non-pharmacy outlets. In an American OTC survey in 1995, 46
percent of OTC medicines were purchased from pharmacies, with the majority (54
percent) bought from non-pharmacy outlets.13 This means that more than half of OTC
purchases were made without the direct or indirect supervision of a pharmacist, which
could have resulted in some potential risks such as misuse, misdiagnosing diseases, and
adverse effects/drug interactions.
Although Canadians can purchase OTC medicines in many places (pharmacies,
convenience stores, and supermarkets), most OTC purchases take place in pharmacies.
One possible reason is that Canada has more strict drug classifications, so there are not
as many medicines sold outside of pharmacies. Another reason is that most food
stores/supermarkets in this country have their own pharmacies, thus people may prefer
to purchase OTC products there. A third reason is that convenience stores may offer less
OTC product selection than pharmacies do (for those specific agents they are legally
allowed to sell). For example, an anecdotal examination of one of the convenience store
chains in Saskatoon found approximately 30 kinds of OTC products, far less than the
number available in most pharmacies.
Even though OTC products are believed to be safe for self-treatment,
pharmacists are concerned about the impact of product sales outside pharmacies. They
worry that such products may not be given the respect they require by the public, that
they are indeed potent medicines that must be used judiciously. One writer coined the
2

phrase – the de-medicinization of OTC medicines – to reflect a possible negative trend
that denigrates OTC medicines to the level of other simple consumer goods such as
breakfast cereals or household cleaning products.14 Furthermore, as governments switch
more medicines to OTC status and the medicines become more potent,15,16 public
attitudes to OTC medicines will become more important. This leads to an important
question – does the location of sale influence public attitude to the medicine? In other
words, does a shopper feel that an OTC product purchased in a convenience store is less
of a “medicine” than one purchased in a pharmacy? Does it require less vigilance during
its use because ‘it is so safe that even 7-11 sells it’? Unfortunately, no evidence exists to
answer such questions, either in Canada or in the United States. Research is needed to
explore people’s experiences and expectations when purchasing OTC products in
pharmacies and non-pharmacy outlets under the premise of optimal patient care.
3

CHAPTER 2: LITERATURE REVIEW
2.1 Introduction
In recent decades, self-care has been promoted in many countries (United States,
Canada, Britain, Australia, Japan etc) as part of a public policy agenda. The main
impetus for this is to divert people from the formal health care system, to save resources
while still meeting acceptable levels of care. There is evidence that more and more
people are taking greater responsibility for their own health, as witnessed by the self-
help movement of the seventies and the boom in herbal and alternative health measures
of the eighties, the latter of which shows little sign of abating. Once a common practice
across centuries of human history, self-diagnosis and self-treatment are making a
comeback. OTC medicines are the most common choice for self-treatment, with almost
everyone having some experience in using or purchasing such medicines.
2.2 Self-Care, Self-Medication, and Minor Illness
2.2.1 Definitions of Self-Care/Self-Medication
There has been growing interest in self-care over the past two decades. For the
years of what is now known as the golden age of medicine (1930s to 1950s), self-care
was actually frowned upon by the medical establishment. The reason was that in the
wake of tremendous achievements in drug discovery of the time, more traditional ways
of treating illness were considered both unsafe and ineffective. Accordingly, patients
were encouraged by physicians to seek formal care for even the most mundane of
illnesses and to use modern pharmacotherapies to rectify the problem.
What is self-care? It can be simply said that individuals partaking in self-care
take charge of protecting, maintaining, and improving their own health status.
4

Lunde cites a definition of self-care from WHO:1
Self-care refers to unorganized health activities and health-related decision-making by individuals, families, friends, colleagues at work, etc.; it includes self-medication, self-treatment, social support in illness, first aid in a ‘natural setting’, ie, the normal social context of people’s everyday lives. Self-care is definitely the primary health resource in the health care system. It does not imply purposeful organization and is often provided on an ad hoc basis in intimate settings.
Lunde has indicated that self-care includes four main aspects: health promotion,
disease prevention, treatment of minor illnesses and injuries, and the management of
chronic diseases and rehabilitation.1 Under this definition, changing lifestyle patterns
would be a form of self-care.
Self-medication is also a form of self-care, and a critical one. Products to be used
for such purposes can be defined as those “the average consumer can use to treat minor,
self-limiting illnesses without the intervention of a prescribing, dispensing or monitoring
health professional with relative assurance of its safety and effectiveness.”17 Medications
of this type are usually known as non-prescription or over-the-counter (OTC) products.
2.2.2 Benefits of Self-Care/Self-Medication
Even though self-care/self-medication is as old as human history, governments
and health insurers still encourage the public to do more of it. The main reason for
promoting self-care is to reduce health care expenditures. A national report in Canada
suggests that appropriate self-care activities can decrease the economic burden on formal
health care systems.18 With regard to the financial impact of minor illness, a Canadian
study in the province of Ontario found that 13.2 percent of all visits to physicians in
1989 were for the treatment of colds and flu. The total cost for these conditions were
almost $300 million, taking up 12.5 percent of the provincial government’s payment to
physicians.19 Because colds are a very common type of minor illness in which most
people can self-treat by using OTC medications, this expenditure might be unnecessary.
Temin provides a piece of evidence to this point.20 He determined that 1.65 million
Americans with cold symptoms did not visit a doctor from 1974 to 1989 due to the
5

variety of cough/cold preparations available on the OTC market. It was estimated that
$77 million per year could be saved, including payments for physician services and
government spending on prescription drugs.
Deregulation of medicines – the switching of prescription medicines to non-
prescription status – also can result in health care expenditure reduction.21- 24 An OTC
industry-supported Canadian study measured the economic impact of non-sedating
antihistamines newly available to the OTC market in 1994. It found that the provincial
government of Ontario saved $11.6 million from these drugs switching to OTC status.
Further, consumers were purported to save $4.4 million by reducing the time needed for
visiting doctors and the costs of obtaining prescriptions. The total savings from these
reclassified drugs was therefore $16 million.25
Self-care/self-medication not only has economic benefits to a health care system,
but has advantages to consumers and to health professionals as well. For consumers,
self-care/self-medication can be very convenient. Time can be saved by avoiding doctor
visits. Evans et al cite a consumer study in Britain that the average waiting time in a
doctor’s office is 24 minutes for a patient with an appointment, and 45 minutes for a
patient without an appointment.26 The situation in Canada is likely similar. Moreover,
cheaper prices in comparison to those of prescription medicines are another reason why
people choose OTC products (although this is mainly in effect for those who do not have
insurance coverage). In Canada circa 1998-99, 25 percent of the population (12 years old
and over) did not have any public or private insurance coverage for prescription
medicines.27
For health professionals, promoting self-care/self-medication can decrease
physician workload, and in turn, extend the scope of the pharmacist’s advisory role.
According to results from several American and British studies, physicians agree that a
great number of their daily consultations are associated with minor illnesses that can be
handled by less formalized care.7,21,28-29 Moreover, the increasing numbers of self-
care/self-medication activities provide a great opportunity for pharmacists to offer more
pharmaceutical care to the public. Detailed literature on the pharmacist’s role in self-
care/self-medication is covered later in this chapter (2.4, p.13).
6

2.2.3 Common Types of Minor Illnesses
There is no clear definition of a minor illness. However, generally speaking, a
symptom associated with a short-term, trivial and self-limiting illness is considered a
minor ailment. The kinds of minor illnesses that can occur are rather diverse and are
very common health problems. It has been estimated that 100 to 150 million general
practitioner consultations a year in Britain are for conditions that may be self-
treatable.29 Bissell et al cite a survey that showed over 90 percent of the British
population experienced at least one ailment per person in 1995.30 A Canadian survey
(1991) similarly reported that 88 percent of adults had suffered at least one minor illness
in the previous 12 months.9 In Irigoyen and Mulvihill’s one-year cohort study,31 medical
students reported an average of 4.4 minor illnesses per person per year.
Most studies to determine frequency of symptom presentation allow people to
self-report what they have experienced in a given period of time.4,6,7,32 Several
observation studies have also been conducted in community pharmacies.30,33-34 A few
studies have linked symptoms to variables such as personal experiences and perceived
meaning of symptoms.35,36
The listing of the most frequently occurring minor illnesses for a specific country
is useful for researchers studying self-care/self-medication. In 1991, Canadian Facts
compiled a Consumer Usage and Attitude Study to examine Canadians’ attitudes,
behaviours, and consultation practices when suffering with specific minor ailments.9
This report listed the top eleven minor illnesses. A cold (60 percent of Canadian adults
suffered with at least one in 1990) was the most common illness, followed by headaches
(40 percent), body pain (40 percent), upset stomach (29 percent), and allergies (22
percent). Other ailments included eye irritation/redness (16 percent), skin
irritation/rashes (15 percent) and so on. A survey (1995) prepared by the Reader’s Digest
also listed Canada’s top ten self-limiting conditions: 1) headache (76 percent); 2)
cough/cold (70 percent); 3) sore throat (47 percent); 4) muscle aches/pains (38 percent);
5) sinus congestion (37 percent); 6) indigestion (20 percent); 7) arthritis (16 percent); 8)
insomnia (14 percent); 9) menstrual cramps (13 percent); and 10) allergy/hay fever (12
percent).37
7

2.3 OTC Medication Usage
2.3.1 OTC Medicines and Regulatory Systems
An OTC medicine is a medicine that can be purchased without a prescription
from a physician. When a prescription medicine has been used for a long time and is
considered safe and effective, to have low potential for misuse/abuse, and will pose
minimal problems with average consumer use, manufacturers can apply to have it
deregulated to OTC status. If that status is granted, the medicine may then be sold
without prescription. Once holding this legislative status, certain restrictions are in place
to dictate where the product can be sold. The regulatory systems differ greatly among
nations. In Canada, for example, there are four drug categories (schedule I, II, III, and
Unscheduled) for the conditions of sale. The definitions of each drug category according
to the National Association of Pharmacy Regulatory Authorities (NAPRA) are as
follows:38
Schedule I drugs require a prescription for sale and are provided to the public by the pharmacist following the diagnosis and professional intervention of a prescriber;
Schedule II drugs are available only from the pharmacist and must be retained within an area of the pharmacy where there is no public access and no opportunity for patient self-selection;
Schedule III drugs are to be sold from the self-selection area of the pharmacy which is operated under the direct supervision of the pharmacist;
Unscheduled drugs can be sold without professional supervision. Adequate information is available for the patient to make a safe and effective choice and labelling is deemed sufficient to ensure the appropriate use of the drug. These drugs may be sold from any retail outlet.
Schedules II and III are considered by some to be transition phases. That is, a
drug will ‘pass through these categories on the legislative journey’ from prescription to
unscheduled status (and subsequent retail sale allowed at any location). As of 2003 in
Canada, there were 73 agents in the category of Unscheduled Drugs, 88 agents in
Schedule III, and 176 agents in Schedule II.38
8

The four-category system for controlling the sale of OTC medications is similar
to the Australian system. Many European countries also have an intermediate class
(either pharmacist- or pharmacy-only sales) of medicines. In a few countries (The
Netherlands and Sweden by way of example), OTC medicines are not allowed to be sold
from non-pharmacy outlets.39 Only two categories (prescription and non-prescription)
exist in the United States.40 Different regulatory systems remain an important factor
affecting OTC markets across countries.
2.3.2 OTC Retail Market
OTC products are an essential component of any health care system. According
to a one-year survey in the United States, six of the ten most frequently used drugs,
including the top four, were OTCs.41 In another report, 60 percent of medicines
purchased by consumers were OTCs.42 In fact, OTC products account for the majority of
all medications used in most countries. There were almost 16,800 OTC drugs (the total
number of medicines was 22,000) available on Health Canada’s list of drugs approved
for human use in the year 2000.27 According to the Consumer Healthcare Products
Association, there were more than 100,000 OTC products (approximately 1,000 active
ingredients) available in the United States as of 2001.43 The number of OTC medicines
available in the United States is much higher than any other nation. Consequently, North
America is the leading OTC market in the world; accounting for 31 percent of global
sales of OTC products in 1995. Western Europe ranked second (26 percent), followed by
Japan (16 percent).44
In dollar value, OTC sales comprise from 10 to 30 percent of total medication
sales in various countries (circa 1996), for example, 26 percent in Switzerland; 24
percent in the USA; 20 percent in Britain; 18 percent in Germany; 15 percent in Japan;
and 11 percent in France.45 Reasons for this include differences in health care funding,
cultural health beliefs, and the range of OTC drugs available on the market of each
nation.
In recent years, OTC spending has been increasing in many countries, except in
Japan where people are more likely to use formal medical care rather than self-care.45 In
9

the United States, retail sales of OTC products (excluding Wal-Mart) in 2001 were $17.1
billion, up 2.4 percent over 2000 ($16.7 billion).46 Canadians spent $3.3 billion on the
OTC market in 2001 (20 percent of all drug expenditures) according to a report released
by the Canadian Institute for Health Information.27 In general, OTC drugs cost about
$100 per person per year. The OTC expenditure in 2001 increased 3 percent over the
previous year and has risen by 73.6 percent (from $1.9 billion to $3.3 billion) since
1995.27 According to a market report, $3.6 billion (estimated) in self-care product retail
sales were generated by manufacturers in both 2002 and 2003; the expenditures grew 4.4
percent and 0.2 percent, respectively.47 Factors contributing to this trend are increased
product production, switches from prescription-only status, and rising sales of herbal
remedies. Simple increases in population may also be a factor.
2.3.3 Pharmacy versus Non-Pharmacy Sales
A pharmacy is not the only choice for consumers when buying OTC medicines.
Food stores, supermarkets, mass merchandisers, department stores, and convenience
stores are also options. Analyzing OTC sale patterns from pharmacies and non-
pharmacy outlets is important for understanding market trends and consumer purchase
behaviors. However, there are only a few reports that provide information for both types
of outlets in the U.S. and Canada. Several American surveys (from 1992 to 1998) asked
participants to indicate where they usually purchase their OTC products.13,48-50 Results
show that higher (but varied) percentages of participants (from 46 to 72 percent,
depending on different store options) purchase OTC medicines from drug stores rather
than the other retail outlets. In 1998, another American market report presented the
proportions of OTC sales (for each drug category) accrued in drug stores, food stores,
and mass merchandisers during the previous year.51 For most categories of OTC
products, pharmacies held the major part (at least 40 percent) of the market. The
situation is similar in Canada, but with even a higher proportion of OTC sales from drug
stores. According to ACNielsen in 1997, drug stores shared 79 percent of the consumer
drug category in Canada.52 Based on recent sales data (2003) from ACNielsen’s Market
Track Service, drug stores have a much greater share of sales for most OTC categories
10
than any other channel (grocery stores, mass merchandisers, and convenience stores).53
By way of one example, 55 percent of all stomach remedies were sold from drug stores,
compared with 25 percent sold in grocery stores, and 20 percent sold from mass
merchandisers.
Although clear-cut evidence that pharmacies outpace non-pharmacy outlets in
OTC sales is not available, mainly because many grocery stores and mass merchandisers
now have their own pharmacy departments, a pharmacy still appears to be the chosen
location for consumers to purchase OTC medicines. It is worthwhile to note, however,
that even though the majority of OTC medicines may be sold from pharmacies, such
outlets are facing a challenge by other retailers. Because of the global trend of
encouraging self-medication, more and more medicines are being switched to non-
prescription (U.S.) or unscheduled (Canada) status. Accordingly, it is expected that OTC
sales in non-pharmacy outlets will rise.
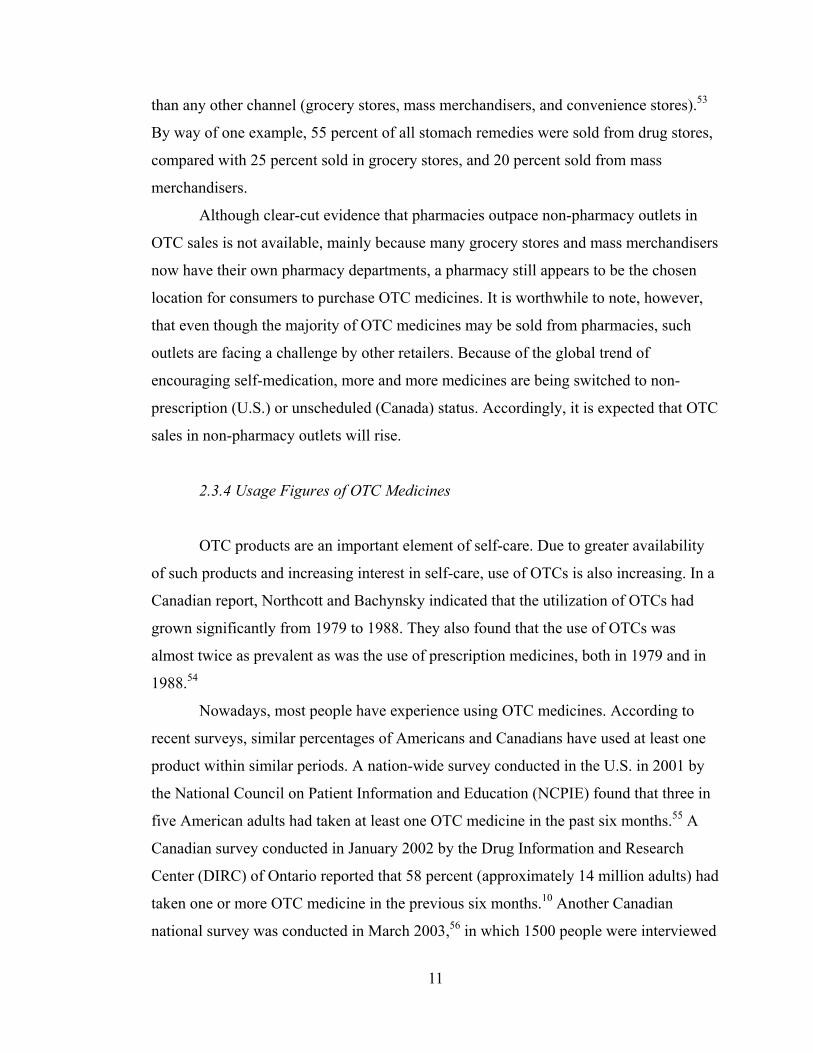
2.3.4 Usage Figures of OTC Medicines
OTC products are an important element of self-care. Due to greater availability
of such products and increasing interest in self-care, use of OTCs is also increasing. In a
Canadian report, Northcott and Bachynsky indicated that the utilization of OTCs had
grown significantly from 1979 to 1988. They also found that the use of OTCs was
almost twice as prevalent as was the use of prescription medicines, both in 1979 and in
1988.54
Nowadays, most people have experience using OTC medicines. According to
recent surveys, similar percentages of Americans and Canadians have used at least one
product within similar periods. A nation-wide survey conducted in the U.S. in 2001 by
the National Council on Patient Information and Education (NCPIE) found that three in
five American adults had taken at least one OTC medicine in the past six months.55 A
Canadian survey conducted in January 2002 by the Drug Information and Research
Center (DIRC) of Ontario reported that 58 percent (approximately 14 million adults) had
taken one or more OTC medicine in the previous six months.10 Another Canadian
national survey was conducted in March 2003,56 in which 1500 people were interviewed
11

by telephone. This report revealed that non-prescription medicine was the most common
type of health product used by the general public – 66 percent of respondents had used
one in the past six months, compared to prescription medicines (59 percent) and to
natural health products (58 percent).
It appears Americans may be more inclined to use OTC medicines than are
Canadians. The NCPIE and DIRC surveys indicate that the average number of different
OTC medicines used within 30 days by Americans (2.2 different products) is higher than
the number used within 30 days by Canadians (1.4 different products).10,55
The categories of OTC products used by consumers are varied and may differ
among countries.9,51,55,57 However, the top ten OTC product categories in American and
Canadian markets are relatively similar. In the United States, cough/cold and related
products were the top sellers in 2003, followed by headache remedies, antacids,
laxatives, first aid products, anti-smoking products, eye care products, pain remedies
(other than headache), foot preparation, and lip remedies.58 A Canadian market report
conducted by ACNielsen indicated the top 10 OTC categories in 2003, in descending
order, were: cough/cold remedies ($259.5 million); internal analgesics ($208.5 million);
vitamins ($142.3 million); antihistamines ($80.1 million); upset stomach remedies ($65
million); dietary aids/nutritional supplements ($62.0 million); products for smoking
cessation ($64.1 million); herbal remedies ($49.9 million); topical wound care/first aid
($46.2 million); and sun protection/tanning ($45.0 million).53 Sales of herbal products
have been identified for potential growth both in Canada and in the U.S.51,59
People choose OTCs to maintain their health and treat minor health problems.
For an industry-sponsored report, Heller noted that 92 percent of Americans were
satisfied with the OTCs they had used in both 1983 and 1992, with 93 percent saying
they would use them again for similar conditions.60 In Segall’s study of more than 500
people in Winnipeg, it was found that 63 percent of respondents had taken at least one
OTC product in the previous two-week period, with 94 percent feeling they were very
effective for their self-limiting conditions.61
12
2.3.5 Demographics of Users
Although most people have used OTCs at some time, the rate of OTC use can
vary with social factors such as gender, age, geographic, social class (education and
income), and health status.62,63 Women appear to have more occasions to use OTC
products and higher consumption rates than men.9,64-69 Young adults are prominent users
of OTCs, exceeding the rate of usage seen in the elderly and children.64,65,68,70 Fisher et
al found that 62.3 percent of OTC consumers ranged from 20 to 44 years old during the
two months of their study in 40 Dublin pharmacies, compared with the 20.3 percent who
were 45 to 65 years old; only 17.4 percent were aged 65 years and over.68 The specific
types of OTC medicines associated with age also may influence usage.65,71,72 For
example, the elderly used more laxatives than youths, while, the opposite trend was
found in the use of analgesics.71 There is also some evidence that people with higher
levels of education, high household income, and upper-class status are more likely to use
OTCs for treating minor illnesses and maintaining their health.9,64,65,71 As well, people
with poor health status seem to use more OTC medicines.73
2.4 Pharmacist’s Role in Self-Care
2.4.1 The Responsibilities of Pharmacists
Pharmacists are increasingly recognized as key players in health care delivery.
Providing information about minor illness treatment and the selection of OTC products
are now recognized as critical duties for pharmacists around the world. The work of
Hassell et al provides an example.74 In this study, 10 pharmacies were chosen, with
interactions between customers and pharmacy staff observed during one week. As well,
44 customers were interviewed by telephone to understand their reasons for their visits
and attitudes toward pharmacy services. Results showed that pharmacy staff played a
very important role in minor symptoms given that 94 percent of events occurred with
advisement. Many participants indicated that pharmacies were their first place to seek
help for treating minor illnesses.
13

In the early beginnings of this field of study, the report of the 1986 Nuffield
Inquiry in Britain supported an extended role for the pharmacist. This role was to reach
beyond the dispensing of drugs to incorporate the provision of advice to clients. It
involved communicating with other health professionals about medications and therapies
and contributing to the provision of more cost-effective health services.75 Pharmacy
organizations have established practice guidelines for pharmacists when dealing with
self-medication. The Fédération Internationale Pharmaceutique (FIP) states several
principles for pharmacists when offering professional care to patients in the self-care
area. The statements of principle are as follows:76
Pharmacists have a professional responsibility to provide sound, unbiased advice and to ensure that self-medication is resorted to only when it is safe and appropriate to do so.
The pharmacist is ideally qualified and placed to advise on the need to consult a prescriber and that advice, because it will be based on expert knowledge, is bound to be better and safer than advice given by a friend or member of that person’s family.
Pharmacists have the necessary knowledge to advise on safe storage of medicines in the home and on safe disposal of medicines once a course of treatment has been completed or, in the case of a medicine, which is obtained for occasional use, when the expiry date has been reached.
Pharmacists can also advise that medicines prescribed for one individual or purchased for the treatment of a specific medical condition should not be used by another person without professional advice first being sought.
Pharmacists have a responsibility to report to the person’s doctor, the manufacturer, and the regulatory authorities for medicines, any relevant
information about an adverse reaction encountered by an individual, which may be associated with a medicine purchased without prescription.
In Canada, Suveges and Allen prepared the groundwork for current standards in
a report entitled Standards of Practice – Non-prescription Drugs to the National
Association of Pharmacy Regulatory Authorities in 1995. This report listed six standards
to guide Canadian pharmacists’ responsibilities concerning OTC medicines, specifically
for Schedule II and III drugs. These standards are as follows:77
14

The pharmacist shall locate non-prescription drugs in the area of the pharmacy consistent with the appropriate drug schedule classification which reflects the level of risk of the drug. The pharmacist shall be available, accessible and approachable to consult with the patient who is seeking to self-medicate with a non-prescription drug. The pharmacist shall interact with the patient to receive and provide information needed when that patient is seeking to self-medicate with a non-prescription drug. The pharmacist shall respect the patient’s right to confidentiality by endeavouring to ensure that pharmacist/patient communication takes place in an area where the discussion cannot be overheard by others. Where continuity of care is an important factor in achieving an optimal therapeutic outcome, the pharmacist shall document the service provided. The pharmacist, and/or the pharmacy manager, shall assemble the human, material and financial resources needed to promote the rational use of non-prescription drugs.
Current guidelines, however, put less emphasis on the medicine’s legislative
category. For instance, National Association of Pharmacy Regulatory Authorities
published the Model Standards of Practice for Canadian Pharmacists in April 2003 and
these are defined as competency elements that transcend drug type.78 For example:
A pharmacist must gather patient information and assess its relevance to patient care.
A pharmacist must identify a patient’s desired therapeutic outcomes.
A pharmacist must identify a patient’s actual and potential drug-related problems.
The most important principle of international or Canadian guidelines is to ensure
that pharmacists help patients to use OTC medicines safely and effectively. To this end,
pharmacists must interview patients to determine symptoms, current disease states, other
medication/treatments that patients previously used or currently take, and patient risk
factors (eg. allergy history or dietary restrictions) when they are consulted about minor
ailments. According to a patient’s situation, pharmacists usually consider one of three
recommendations: provide advice only (without a product); recommend an OTC
medicine or an unmedicated measure or both; or refer the client to appropriate medical
15

personnel.79 If OTC medicines are needed, pharmacists are responsible for suggesting
the most appropriate product for the symptoms and advising patients on proper use.
2.4.2 The Frequency of Consumer-Pharmacist Interaction
A variety of consultations regarding prescription drugs, OTC products, herbal
remedies, and minor illnesses take place in pharmacies. In some reports, the majority of
consultations involve prescription drugs, followed by OTC medicines and minor
illnesses. The ratio of consultations for OTC medicines and prescriptions has been about
1:2.5 in the United States,80 and approximately 1:2 (29 percent versus 60 percent) in
Britain.81 In another American study, results indicate that when people actually ask for
advice, the ratio of OTC type questions (19 percent) is a bit higher than those for
prescriptions (12 percent).82
Although consultations for OTCs might at times be lower than those for
prescription drugs, a tremendous number of OTC consultations still occur every year.
For example, over 15 million OTC interventions took place in Canada in 1993.18
There is interest beyond the total number of OTC sales taking place in a given
pharmacy or country. Of further interest is the percent that involve a pharmacist in the
transaction. Various methods are used to determine the rate of consumer-pharmacist
interaction; a survey is one of the more common. The majority of Americans (55 percent)
and Canadians (58 percent) have indicated they always or often discuss OTC medicines
with their pharmacists.80,83 Forty-two percent of Canadians have asked pharmacists for
advice on their minor illnesses.84 According to Pharmacy Post’s Survey on OTC
Counselling & Recommendations, pharmacists engaged in an average of at least 10 OTC
consultations per day in recent years (12 counselling events in 2002, 14 in 2000, 13 in
1999, 10 in 1998, and 13 in 1997).85 While survey results can provide general
information, they may not be accurate because they are based on estimates made by
pharmacists or consumers.
A diary method may help researchers to obtain more accurate results because
transactions are recorded, either by a pharmacist or an observer on-site. However, this
method also has drawbacks – the validity of results will be affected by the accuracy and
16

consistency of the recorder. Several studies of this type have been done in Canada,
England, and Australia. A Canadian report indicates that pharmacists give advice on
minor illness an average of 2.8 times per day.18 Of all OTC sales that occur in a day,
results have seen high rates for those occurring with advice in England (31 percent) and
in Australia (47.8 percent).86,87
Observing every product sale by independent observers who are not pharmacists
is likely the most reliable method. Most studies of this kind have been conducted in
European countries;68,87,88-91 only a few are available for North America.92,93 The results
are influenced by the scope of the study and the regions involved, among other things.
For example, two British studies show very different results. One-third of OTC sales (33
percent) were advised by members of the pharmacy staff in a small study of six
pharmacies in England,88 while 15 percent were advised sales in a large scale study
involving 225 pharmacies across England, Scotland, and Wales.89 Canada has seen
similar results, but with the location limited to only one city (Saskatoon). In the first
study, the type of product observed (cold and allergy only) and the number of
pharmacies was also limited.92 On average, 13.6 percent of transactions involved
pharmacists. In the second study, 11.6 percent was the extent of involvement, which
involved a wider range of products and more pharmacies.93
According to an Irish report, around 22.3 percent of OTC sales are supported
with verbal counselling.68 A Netherlands study determined 15 percent of OTC sales
occurred with advice.90 Only 10 percent of products sold have been accompanied by a
pharmacist’s advice in Sweden.91
An important aspect of the counselling process involving OTCs is who initiates
the process. Krska and Kennedy asked consumers about their expectations and
experiences when purchasing OTC medicines in the north of Scotland. They found that
70 percent of respondents wanted advice about symptoms or OTC products. As well, six
in ten clients (59 percent) reported that they expected to be asked questions about their
symptoms by pharmacists. Almost half of the customers (46.5 percent) expected to
receive advice about the OTC medicines they bought.94
It appears the rate of consumer-pharmacist interaction is now reasonably well
known. The time taken during counselling has also been determined. In general,
17

consultations on OTC medicines take but a few minutes. The majority of counselling
incidents take up to three minutes in the United States,95 2.5 minutes in England 26 and
1.5 to 2.2 minutes in Canada.96,97
The above information may suggest there is room for pharmacists to contribute
more in the area of self-medication. One situation gaining attention as a factor in the
lower than desirable interactive rates, at least for Schedule II agents, is product requests
by name. For instance, of 1,000 purchase events in ten Australian pharmacies, 72.5
percent of consumers requested a specific product by name; only 23.9 percent asked
pharmacy staff for advice.98 The degree to which advice was received, though, did vary
according to product type. Requests for analgesics and antacids by name were higher
than that seen for respiratory system products, where more consumers consulted with
pharmacists. Product requests by name tend to impede the exchange of professional
information.
Besides requests by name, there are other barriers that may also deter the asking
(or offering) of advice. In order to fulfil their advisory role, pharmacists should attempt
to overcome such barriers.
2.4.3 Barriers to Interaction
Discovering and understanding interactive barriers is important to the profession
because such barriers influence pharmacist performance in providing advice. Many
studies have determined the kinds of barriers that exist in the current environment. In a
1996 workshop held by the Saskatchewan Pharmaceutical Association, Saskatchewan
pharmacists were asked to point out any possible barriers to pharmacists’ offering OTC
counselling.99 Fourteen possible barriers were listed (not in any particular order): 1)
pharmacist workload and interruptions; 2) lack of reimbursement; 3) issues of liability; 4)
patient unwilling to receive advice; 5) physical barriers in the pharmacy between
pharmacist and consumer; 6) inability to get patient information; 7) inadequate staffing;
8) costs and training of staffing; 9) lack of confidence; 10) lack of knowledge; 11) lack
of communication skills; 12) too many products on the market; 13) confidentiality and
18

privacy issues; and 14) noise and confusion in pharmacies. Several common barriers will
now be discussed.
Lack of time is a common barrier, not only for the consumer seeking a
pharmacist’s advice, but also for the community pharmacist undertaking the OTC
consultation. In Krska and Kennedy’s study, over three-fifths of customers said that a
lack of time prevented them from using a pharmacy service for minor illness treatment
and OTC selection.94 Lack of time has ranked as a top barrier by pharmacists in several
studies.100-102 In these, most pharmacists say that they would like more time to do more
counselling on self-medication. There are several reasons that likely lead to this lack of
time. First, pharmacists carry heavy workloads in dispensaries. Rutter et al determined
that dispensing activities accounted for the largest proportion (37 percent) of a typical
pharmacist’s time in Great Britain.103 Second, many pharmacists are concerned about the
business aspect of their community pharmacies. For instance, Bell et al found that many
pharmacists spend significant amounts of time on management and on business-oriented
tasks in their pharmacies.104 Perhaps by extension, when consumers are asked why they
do not consult pharmacists on OTC medicine use, many have said that the pharmacist is
too busy and do not want to bother him/her.105,106
However, in other studies, researchers have found that the time issue is less
important than other factors, such as pharmacists’ attitudes toward self-medication
consultation.107,108 For example, a Canadian survey asked pharmacy owners and
managers to indicate the reasons why they do not counsel patients on OTC medicines
and prescription medicines.107 While 40 percent of respondents stated that a lack of time
was a reason for not providing advice on OTC medicines, only 14.5 percent of the group
indicated this as a factor for prescription medicines. These results suggest that some
pharmacists may not feel their duty to provide OTC advice is as important as the
obligation to advise on prescription medicines.
Pharmacist lack of confidence, knowledge, and/or communication skills can also
quell their advisory role in self-medication. Reports reveal many pharmacists believe
that if they could simply obtain more information/education on OTC products and the
applicable communicative skills, they could engage in more consultations.102,108
19

Even if a given pharmacist was fully qualified and willing to provide OTC
advice, some consumers’ negative attitudes toward receiving advice are barriers. Results
from a Canadian survey showed that “patients do not ask,” a feeling that “counselling is
not required,” and “patients refused counselling” were the top three reasons for
pharmacy owners/managers not advising some patients on OTC medicines.107 In a study
conducted in Scotland, “public expectations to not be questioned” was chosen by ten
participants (of a total of 22 participants) to be the most frequent situation as to why
pharmacists were not providing advice to patients.108 Two Canadian studies which
observed OTC purchases in pharmacies provided consumer input into this issue – most
consumers (145/151) who had not received advice said they in fact did not want it;106
however, only 0.5 percent of advice offered by pharmacists was actually refused.92
A lack of private counselling areas in many pharmacies is a commonly described
barrier.102,104 A private consultation area not only helps both pharmacists and customers
concentrate on their discussion, but it also protects customer privacy. For example,
Harper et al suggest that 75 percent of customers will not go to the pharmacy to ask
advice about an embarrassing itch.109 They also found that customers asked more
questions on symptoms in the private counselling area than did those in front of the
counter.
According to the this evidence, lack of private counselling areas may result in
lost opportunities for counselling.
2.5 Response of the Public to Minor Illness
When people suffer with minor ailments, they tend to choose a subsequent
course of action among three main options. First, they can choose to do nothing. People
today are very busy, so if their minor ailments do not interfere with normal activities,
this may be the response. This is a very common choice for people. Second, they can
choose to self-treat. Reader’s Digest suggests that 79 percent of consumers in Canada
self-medicate in some way,110 whether with an OTC medicine or herbal product. Finally,
a person can opt for professional help, the least common of the three choices when
involving a perceived minor illness.
20

Table 2.1 represents public response to minor illness from five countries. It
appears that, in general, people of different cultures have similar responses to minor
illnesses across years and countries. To explain some of the discrepancy seen with the
comparative Canadian data, it can be noted that prescription medicines was not provided
as an option to respondents, thereby skewing the numbers.
Table 2.1: Actions Taken by People in Response to Minor Illness
Action taken
Australia111
(1979)
%
New Zealand111
(1981)
%
USA111
(1982/83)
%
Britain112
(1987)
%
Canada110
(1995)
%
Britain113
(2000)
%
No action 40 48 37 45 29 46
Home remedy 17 14 9 8 9
OTC product 22 29
35 24 50 25
Prescription in home
3 12 11 13 - 14
Doctor/dentist 6 11 9 13 14 10
2.5.1 Factors Influencing Responses to Minor Illnesses
The action chosen by the public to minor illness will depend on a number of
factors. Such factors include sex, age, socioeconomic status, family structure and
support system, previous experience with symptoms, types of symptoms, potential
embarrassment, time, costs, social/cultural attitudes, and surroundings.32,35,45,61,114-144
Several studies show that females are more likely to seek advice for common
minor ailments from health care professionals than are males.114-117 In Bell et al’s study,
researchers tested gender differences in four treatment options based on a total of twelve
symptoms. Women preferred to consult a health professional (either physician or
pharmacist) for eight of the symptoms given. Men were more likely to self-treat for most
21
symptoms listed, except foot problems.116
Age is a factor in decision-making behaviours. Generally speaking, older people
(≥ 60 years) are more likely to seek advice from their pharmacists or doctors.9,116
Socioeconomic status appears to play a role in predicting illness behaviours.118-
121 Koos found that upper class respondents more frequently felt they required medical
care than did lower class persons.118 This result is supported by another three studies.119-
121 In the United States, Anderson et al analyzed respondents’ actual reactions to 15
minor ailments. They discovered that the proportion of physcian consultations for these
conditions tended to increase as household income, education, and occupational rank
increased.119 Hetherington and Hopkins reported that people with low income are
significantly more “symptom-insensitive” than those of high income.120
Previous experience likely plays a key role in attitudes and behaviours involving
minor illnesses. Several studies have focused on the relationships between prior
experience and illness behaviours for a given symptom. Safer et al reported that patients
with familiar or frequently experienced symptoms (> 11 days) took a much longer time
than did patients with new symptoms (< 3 days) to make decisions.122 In Banks and
Keller’s study, 239 families were randomly selected and then a member of the family
(usually the mother) was interviewed. For a list of symptoms, subjects were asked if
anyone in the family had displayed such symptoms. They were questioned on what
choice of treatment they would make, without considering their previous experience.
Those who had previous symptom experience, though, expressed less anxiety or concern
than those to whom the illnesses were new.35
It is not surprising that people may have different responses when they suffer
different kinds of conditions. Many researchers are interested in understanding reactions
to common symptoms of minor illness. Verbrugge and Ascione analyzed the incidence
of symptoms related to respiratory and musculoskeletal illnesses to see how people
cared for them. For (mainly acute) respiratory symptoms, OTC drugs were chosen more
often than prescription medicines. But for musculoskeletal symptoms (chronic),
prescription medicines became more important than OTC choices. Furthermore, persons
with respiratory symptoms used less formal medical care than did those with
musculoskeletal symptoms.123 Thus, according to Verbrugge and Ascione’s findings,
22

people approach chronic and acute health problems in different ways. Symptoms such as
cold/flu, cough, sore throat, headache, heartburn, constipation, and indigestion are
reported by respondents as disorders that they tend to self-treat.61,32,111,116 However,
when people experience backache, red eyes, depression and chesty cough, they prefer to
consult health professionals, especially physicians.
Access to medical care and cost are issues for many people. Long waiting times
in a doctor’s office and medical insurance coverage may be important reasons for people
to avoid a physician. A Japanese study, for instance, found that Japanese visit a doctor
more frequently than they buy an OTC product for treating minor ailments because of
easier access to medical care. The other reason may be that OTC products are not
covered by medical insurance, whereas prescription medications are reimbursed.45
2.5.2 Information Sources Used
Health professionals, word of mouth (family members and friends), mass media
(health books and advertisements), and product labels are very common sources used by
people when seeking information about minor illnesses or OTC medicines. The Internet
can now be added as a new information source for the public; one report indicated that
10 percent of consumers rely on this source of data.124
For most types of minor illnesses, doctors and pharmacists are the most often
used sources of information. Results from a Canadian survey show that 30 to 80 percent
of respondents for a given illness consult physicians about their conditions, and 20 to 40
percent get information from pharmacists.125 Doctors are seen as a first choice for many
for treating minor illness. A Scottish study found that 68.5 percent of respondents would
see a doctor first for advice.126 In the same study, only 8.2 percent considered
pharmacists as their first port of call for managing their ailments, even lower than family
members (16.3 percent). A study in Hamilton showed that community pharmacists were
the first choice for only 18 percent of a sample population.127 The elderly and parents
who seek advice for their children have not considered pharmacists as the most
important, nor a frequent, source.128,129
23

For others, it is the pharmacist who is approached first. In a study by Bell et al in
Britain, 58.1 percent of participants indicated that they would seek advice from a
pharmacist rather than from a doctor, if symptoms were not serious enough to visit the
doctor. Over 10 percent of participants indicated they would seek a pharmacist’s advice
if short of time for a doctor’s appointment.116 This report also found that men were more
influenced by the recommendations of friends and families than were women.
Griffle found that almost 60 percent of clients rely on the advice of health care
professionals when selecting an OTC product.80 A Canadian OTC industry report (1999)
showed that 22 percent of Canadians sought the advice of a doctor on OTC products; 25
percent said that pharmacists were their primary information source.130 A Canadian
survey conducted in 2001 showed that 65 percent of respondents always/often obtained
OTC information from pharmacists, followed by advertising (63 percent), media reports
(57 percent), word of mouth (53 percent), physicians (34 percent), product labels (20
percent), and the Internet (10 percent).131
Advertisements (including television, newspaper, and magazines) of OTC
medicines are important sources. In an American survey, participants were asked to
indicate which cited information source(s) they had turned to within a six month period.
The top four common sources were advertising or promotion from
TV/newspaper/magazines (49.7 percent), followed by a doctor (47 percent), articles or
information from TV/newspaper/magazines (46 percent) and a pharmacist (38
percent).55 The main role of advertising is to create consumer awareness of OTC
products. Respondents of the industry-sponsored Consumer Usage & Attitude Study in
1991 said that advertising did help them to understand what OTCs were available for
different illnesses.9 Sooksriwong and Leelanitkul found that the majority of Thai
consumers got information about drug names from advertising, including television,
printed matter, and radio. Families and friends were their second source of information
on drug names.132
A product label provides valuable information to OTC users, if the time is taken
to read it. Data from the Consumer Usage & Attitude Study indicated that 91 percent of
Canadians claim to have read the label carefully before using a product for the first
time.9 An American study showed that a similar proportion of Americans (95 percent)
24

read some portions of the labels on OTC products.55 Active ingredients, usage direction,
dosage level, and warnings were the common sections customers claimed to have
read.10,55
Other reports provide less enthusiastic results. A Canadian study reported that 62
percent of participants always read labels; 16 percent often read them; 9 percent were on
record as sometimes; 6 percent as seldom; and 7 percent never read them.83 Comparing
Canadian and American national consumer surveys suggests that most do not read full
information appearing on the package of an OTC product when they buy it for the first
time. For example, only 40 percent of Canadians read active ingredients, followed by the
dosage level (34 percent), the symptom it treats (26 percent), possible side effects (23
percent), directions for usage (18 percent), and warnings (10 percent) when they buy a
product for the first time.10 American data showed that the proportion of readers in each
section were even lower than the Canadian statistics – directions for usage (19 percent),
dosage level (16 percent), symptom it is used for (12 percent), possible side effects of
usage (10 percent), and warnings (7 percent).55 In the American survey, researchers also
found that more Americans would read directions for usage (22 percent) and dosage
level (25 percent) when they take the medicine for the first time, rather than when they
buy it for the first time.
Even though information appearing on the package of an OTC medicine is
limited, most Canadians (90 percent) felt satisfied with it.130
In summary, physicians and pharmacists are the main sources when the public
seek information about minor illnesses and OTC medicines. Advertising and product
labelling also play an important role.
2.5.3 Pharmacist Influence as OTC Consultants on Consumers
Pharmacists have a professional obligation to provide OTC counselling to the
public. Such activity should be evaluated by the profession within the process of quality
assurance. Similarly, how consumers perceive pharmacists in this role is also an
important issue. Information on consumer satisfaction with pharmacists and pharmacy
services in this area is available.133-140
25

An American study provides indirect information about how consumers think of
pharmacists in this role. Gore and Madhavan surveyed 3,000 Americans on the
credibility of four information sources (physicians, pharmacists, family members, and
friends/colleagues) for OTC medicines.141 Only 458 subjects replied to the questionnaire;
response was therefore low at 15.2 percent. The results found that acceptance of both
pharmacist and physician recommendations was high (75 percent and 76 percent,
respectively). Comparatively, slightly over half of respondents usually or sometimes
accepted recommendations from their family members or friends/colleagues.
Participants were also asked to rate these four sources on three dimensions of
credibility – expertise, trustworthiness, and empathy. Pharmacists were rated lower than
physicians on all three dimensions. However, consumers believed that pharmacists were
more expert and trustworthy than were family members or friends/colleagues. On the
dimension of empathy, pharmacists were perceived to embrace the least of this attribute
of the four sources. Therefore, while a reliable source of information, pharmacists may
have to improve upon a humanistic aspect of their interaction with clients.
Several surveys show that pharmacist recommendations have a high acceptance
rate by clients. In an 1995 American survey, pharmacists reported that clients bought
recommended OTCs more than 80 percent of the time.142 In 1998, results from a
telephone survey of 1,008 American adults found that 73 percent would take a
pharmacist’s advice for an OTC product, even if the product differed from the one they
had been using for years. As well, if the product recommended was not highly
advertised, 70 percent of respondents still would accept the advice. If their pharmacist
and friends/families had differing recommendations for an OTC product, 67 percent
would choose the pharmacist’s choice. Further, 59 percent would buy the product
recommended by a pharmacist, even if it was more expensive than the one they usually
bought.50 Results from another American consumer survey showed that most consumers
(98 percent) feel extremely or somewhat satisfied with OTC information given by
pharmacists, and at times, more satisfied than when receiving such information from
physicians.143
In a study conducted in Britain in 2000, Bell et al determined that 19.6 percent of
their respondents were influenced by recommendations of a pharmacist when they
26

purchased OTCs, compared with 14.5 percent by a doctor, and 10.2 percent by an
advertisement.116
2.5.4 Risks of Self-Care/Self-Medication
Although an OTC product becomes available without a prescription because of a
favourable safety profile, its use will not be devoid of all risk. Such risks could include
incorrect self-diagnosis, incorrect choice of therapy, incorrect dosage, occurrence of side
effects, drug interactions, and so on.
Improper use is a major problem with OTC consumption. One U.S. survey
showed that 33 percent of American adults (extrapolated to be 64 million) took more
than the recommended dose of OTC drugs.55 Of these individuals, almost seven in ten
(69 percent) admitted to taking more than the recommended amount at a single time; 63
percent took the next dose sooner than directed and 44 percent ingested more than the
recommended number of doses per day. The findings also suggested that 91 percent of
respondents using higher than the recommended dosages thought it would increase the
effectiveness of the drug.
According to results from a national Canadian survey of similar design, the
situation of incorrect OTC use seems better than that seen for American citizens, but still
of concern.10 Fifteen percent of Canadian adults stated taking more than the number of
recommended doses for a day. It was estimated that nearly five million adults take the
next dose of their OTC products sooner than directed on the label.
Even though OTC medicines are generally safe, they still have side effects.
Caranasos et al found that 18 percent of all hospitalizations resulted from adverse
reactions caused by OTC drugs during a three-year period.144 Litovitz and Manoguerra
determined that from 1985 to 1989, about 670,000 reports related to adverse effects and
overdoses were received by poison control centers in children younger than 6 years
old.145 These cases included analgesics, cough/cold remedies, and gastrointestinal
products.
The potential for OTC medicine-disease interaction may be underestimated by
OTC users. For instance, 70 percent of hypertensive patients surveyed had taken an OTC
27

product during the previous two weeks, while less than 20 percent of these same
individuals were aware that some OTCs could influence their blood pressure.146
Similarly, non-steroidal anti-inflammatory drugs (NSAIDs) can potentially exacerbate
the symptoms of asthma. However, one-third of asthmatic patients interviewed by Lamb
et al still took aspirin or NSAIDs to treat some minor ailments. Only 27 percent of the
asthmatic patients who bought OTCs would think of informing the pharmacist that they
had asthma.147
Prescription-OTC drug interactions exist and OTC users need to realize the
potential for their occurrence. In a paper on the frequency of daily OTC drug use and
clinically significant OTC-prescription drug interactions in the Finnish adult population,
Sihvo et al determined that 4 percent of OTC users (on average) may be potentially hurt
by those interactions.148 The paper highlighted the potential for interactions with
ketoprofen, followed by ibuprofen and acetylsalicylic acid (ASA). Two studies by Honig
and Gillespie found that many OTC drugs has the potential for clinically significant
interactions with other drugs. Their examples of potentially problematic OTC groups
were antacids, H2-blockers, salicylates, NSAIDs, cough/cold/allergy remedies, and anti-
asthma products.149,150
The continuous use of OTCs, the number of OTC medicines used, and the
number of prescription drugs raise the risks for adverse interactions. For perspective,
Andreasen and Damsgaard determined that the subjects of their study took, on average,
4.2 different prescription drugs and 2.5 OTC medicines.72 Batty et al found that 32
percent of in-patients aged 65 years and over continually used OTC medicines during
hospital admission.70
2.5.5 Patronage Motives Associated with Location of Sale
According to business writers, consumer buying strategies typically consist of
four stages, which are rationalized as follows:151
Stage 1 -- Decide how much to buy of each broadly-defined category of goods (for example, convenience, non-convenience) for the relevant planning horizon;
28

Stage 2 -- Decide which store, or combination store, to visit; Stage 3 -- Maximize utility with reference to convenience goods, obtaining demand schedules for each product category or, when brand loyalty exists, for special brand; Stage 4 -- Once in the store, decide which brands to buy and revise decisions made in Stage 3 if this is made convenient by store prices and/or assortment composition (that is, by new information).
Consumers choose not only among goods, but also among various types of stores.
In Canada, when a consumer decides to purchase an OTC medicine, a pharmacy is not
the only option. People also can buy such medicines (depending on the agent) from other
retail outlets such as convenience stores, supermarkets, food stores, and department
stores (and for the latter three, either with or without pharmacy departments). Patronage
motives that can affect store selection are now discussed.
According to several marketing studies, store image is an essential factor in
influencing consumer decisions.152,153 Customer image of a given retail outlet is affected
by their experiences, attitudes, and expectations of that store.154-156 According to
Lindquist’s research, image descriptors include merchandise quality, prices and
characteristics of goods, product selection, retail service provided with goods, store
location, store layout, advertising, sales, reputation, and so on.157
Several studies have attempted to determine patronage motives involving
pharmacies.49,137,158-160 In these studies, participants have been asked to indicate their
primary reasons for using a pharmacy. One British study in 1992 indicated that the
pharmacy being close to home was selected by the majority of participants (43.7
percent), followed by good advice (13.7 percent), prompt service (9.8 percent),
competitive prices (9.3 percent), range of products (8.7 percent), close to work (5.1
percent), close to doctor (4.9 percent), and other (4.8 percent).158 A similar British study
was again done in 1997 and close to home was still the top choice.116 However, more
people selected range of products as their primary reason than those who selected good
advice. As well, close to doctor became a more important reason than competitive prices
and prompt service.
29

In 2002, a similar study was conducted in the U.S.159 Forty-four percent of
Americans chose convenient location as their primary reason for using their regular
pharmacy, followed by price (17 percent), service (13 percent), other convenience (12
percent), and pharmacists/staff (10 percent). Although pharmacists/staff and services
were not the first reasons for selection, they appear to play an important role when
people switch a pharmacy. The same study found that 33 percent of respondents who
had switched pharmacies in the past two years revealed poor service as the main reason
for changing. Bad relations with the pharmacists/staff and high prices were ranked
second and third. Canadian results on pharmacy switches differ somewhat from this
American data. The majority of Canadians who had changed pharmacies in one report
said that location and convenience were the main reasons for switching. When these two
factors were removed, price and pharmacists/staff became more important reasons.160
An American survey conducted in 1995 interviewed 1000 consumers to
determine the importance of each of 11 reasons for drug store patronage.49 Most
participants (87 percent) thought close to home a very important reason. The importance
of knowledgeable staff, competitive prices, fast check out/no lines, good signs, and easy
access/parking space appear in descending order and were chosen as important by more
than half of respondents.
Contemporary pharmacies face challenges in keeping their share of the OTC
market from other competitors such as food stores and mass merchandisers. Consumer
patronage motives from the perspective of pharmacies versus non-pharmacy outlets
deserves attention. Only one study specifically has focused on this direct comparison.
Gore and Thomas conducted a study of this type in 1995. 161 Of the 500 questionnaires
mailed, the usable response rate was 49 percent. In this study, the authors chose 16 store
images and 11 OTC information service attributes to determine their importance for
patronage motives. They also compared average performances of three types of stores –
food store, mass merchandise stores, and pharmacies. Overall, reasonable price was
ranked the most important factor by American consumers when they selected from these
outlets to purchase OTC medicines, followed by quality of products stocked by the store,
open during convenient hours, convenience of store location, availability of a wide
variety of brands, and good store layout for fast and easy shopping. Access to a
30
pharmacist came in eleventh place. However, the importance of these attributes, except
access to a pharmacist, did not show significant statistical differences among the three
types of stores. Pharmacy patrons rated significantly higher importance to the majority
of attributes (15 of 27), especially those relating to OTC information services, than non-
pharmacy patrons. Gore and Thomas, therefore, found that the ability to provide
professional services on the products was one of the obvious advantages for pharmacies.
However, perceptual differences held by the public as they pertain to the products
themselves, between pharmacies and non-pharmacy outlets, is still unknown. It is
unclear whether consumer perceptions of a given product are significantly changed by
the place of purchase.
A Finnish report does provide some insight in this respect.162 In Finland, health
food products are regulated as foods. Unlike medicines, which can be sold only in
pharmacies, health food products are sold without any restriction. Finnish consumers can
easily buy such products anywhere across the country. By way of background, the
authors cite data published by the Finnish Committee on Drug Information and Statistics
of 1991. This data showed that, in 1990, the majority (65 percent of retail sales) of
health food products were purchased from special health food shops, compared to 23
percent from grocery stores and only 7 percent from pharmacies. For their more current
study, the authors were interested in consumer perceptions of pharmacy’s role in the
health food market. It was found that 66 percent of respondents agreed that a pharmacy
is a convenient, reliable, and safe place to purchase health food products, yet only 15
percent bought such products from pharmacies. The majority of users still purchased
health food products from specialty shops. The main reasons were that such shops have
a better assortment and generally have lower prices than pharmacies. Based on this
report, it seemed that consumer preference for purchase location was affected minimally
by the product itself, but rather by image of the store – price, product variety, and the
availability of professional help. The authors concluded:
The public may associate the professional image of pharmacy with every purchase made in the pharmacy setting, regardless of whether the product purchased is a licensed pharmaceutical product. A remarkable health food products market in the pharmacy context may even obscure consumers’ perceptions of the difference between scientifically-tested medicines and
31

health food products. This problem is most obvious in the countries where consumers are used to buying only drug and some appliances closely related to health care from the pharmacy.
With more and more OTC products becoming available in non-pharmacy outlets,
and being sold along with other products such as food items, consumer perceptions of
OTC products can be rise in importance as pharmacists attempt to understand purchase
and usage behaviour.
2.5.6 Consumer Perceptions of OTC Medicines
Consumers can easily and conveniently purchase OTC products from pharmacies
or non-pharmacy outlets. Is there potential for the consuming public to consider such
medicines with less importance than they are due? In an Italian report, five percent of
participants stated that some OTC products (like laxatives) were hardly thought of as
‘drugs’ because they have been advertised almost as a part of “normal life
components”.163 Several studies indicate that consumers perceive prescription medicines
and OTC medicines as differing in safety, strength, and effectiveness. Consumers tend to
consider prescription medicines as more powerful than their OTC counterparts.164,165
One British study collected 1,650 comments on differences involving consumer
perceptions of prescription medicines and of OTC medicines.166 One-third of
respondents thought that prescription medicines were stronger than non-prescription
medicines. OTC medicines were considered to be safer than prescription medicines
because prescriptions may have more (or relatively serious) side effects and were more
likely to be misused.
Although likely outdated, an national survey sponsored by the U.S. FDA (1973)
presented different results.167 This study asked consumers to rate the safety of five
categories of products. Food was rated the safest product. Prescription medicines were in
the second place, followed by cosmetics and toys. Nonprescription medicines were
thought to be the most dangerous products. A nation-wide Canadian survey conducted in
1990 also had similar findings.83 The majority of Canadians (70 percent) believed that
prescription medicines were always/often safe, compared to non-prescription medicines
32

(59 percent) and cosmetics (47 percent). As well, fewer Canadians (5 percent) thought
prescription medicines were seldom/never safe, while 9 percent thought non-prescription
medicines and 13 percent thought cosmetics were seldom/never safe. Moreover,
respondents indicated that non-prescription medicines were less effective than
prescription medicines. Approximately half believed that non-prescription medicines
were always/often effective; 65 percent thought that prescription medicines were
always/often effective.
In summary, the available evidence appears to indicate that consumers do indeed
distinguish differences between OTC and prescription medicines. By extension, a
concern appears to exist whereby the public may not consider medicines available
without prescription as full-fledged ‘medicines’, ones that require a level of vigilance
during use. Location of sale may be a factor in the development of such perceptions.
Impressions held of OTC medicines may be important pre-determinants of actual
behaviour, where failure to consider such agents as important medicines requiring due
care, could expose the public to important drug-related risk.
33

CHAPTER 3: OBJECTIVES
3.1 Objective
The objective of this study was to determine whether citizens of Saskatoon have
different expectations of OTC medicines, based on location of sale.
3.2 Significance of the Study
To the best of our knowledge, this is the first study of this kind within this
context. Gore and Thomas did similar work, but with a focus on the retailer rather than
the medicine.161 They found that the most important attributes for consumers when
choosing retail locations for OTC purchases were reasonable prices, quality products,
convenient hours, and a convenient location. For perspective, access to a pharmacist was
eleventh on a list of a possible 16 store attributes. However, expectations for receiving
professional advice were much higher in pharmacies than food stores or mass
merchandisers. The interests relevant to the research project being proposed here lie with
the medicine itself. In other words, what properties do consumers specifically attribute
to the medicine they are buying in relation to location of sale?
Data from this study will be added to the pool of information federal legislators
currently use to determine which agents can be deregulated to full public access. If the
consuming public treats OTC medicines equally, regardless of place of purchase, then
less concern may be realized at the decision-making table. If, however, it is found that
the consuming public takes more liberties with OTC medicines purchased at a non-
pharmacy outlet, federal legislators may require more evidence from the petitioning
manufacturer that safety will not be compromised as a result of deregulation.
34

3.3 Research Questions
1) Are there differences in public expectations of OTC medicine potency in
relation to place of sale (pharmacy vs. convenience store)?
2) Are there differences in public expectations of OTC medicine safety in
relation to place of sale (pharmacy vs. convenience store)?
3) Are there differences in public expectations of OTC medicine side effects in
relation to place of sale (pharmacy vs. convenience store)?
4) Are there differences in public expectations of OTC medicine effectiveness in
relation to place of sale (pharmacy vs. convenience store)?
5) Are there differences in public expectations for information appearing on
OTC medicine packaging in relation to place of sale (pharmacy vs.
convenience store)?
3.4 Null Hypotheses
Study hypotheses are:
1) There is no difference in public expectations of OTC medicine potency in
relation to place of sale (pharmacy vs. convenience store);
2) There is no difference in public expectations of OTC medicine safety in
relation to place of sale (pharmacy vs. convenience store);
3) There is no difference in public expectations of OTC medicine side effects in
relation to place of sale (pharmacy vs. convenience store);
4) There is no difference in public expectations of OTC medicine effectiveness in
relation to place of sale (pharmacy vs. convenience store);
5) There is no difference in public expectations for information appearing on
OTC medicine packaging in relation to place of sale (pharmacy vs.
convenience store).
35

CHAPTER 4: METHODOLOGY
4.1 Overview
This study was cross-sectional and descriptive in design. Data were gathered
from residences in Saskatoon via a mail survey instrument. The questionnaire consisted
of seven parts: 1) consumer background information about OTC purchase and use; 2)
consumer information-seeking behaviours; 3) consumer experience with common
symptoms and OTC products; 4) consumer impression of OTC medicines; 5) consumer
impression of pharmacists; 6) consumer expectations of OTC medicines sold in
pharmacies and in convenience stores; and 7) demographic characteristics of the sample.
4.2 Population/Sample
The population for this study were the residents of Saskatoon. According to the
2001 Census Report of Statistics Canada, the adult citizens of Saskatoon numbered
around 160,000.195 The Wilson Research Group indicates that, if a population is around
100,000, 382 valid responses would be needed to obtain a 95 percent confidence interval
with ± 5 percent error. If the population was in fact 1,000,000 or over, only 384 valid
responses would be needed.169 The sample size required was confirmed by the Survey
SystemR, a software package for working with survey questionnaires, which indicated
that at least 383 valid responses would be required for ± 5percent error, based on the
current population of Saskatoon.170
Response rate is an important factor in survey methods because it affects the
validity of research results. Mail surveys have lower response rates compared to other
survey methods. Several studies showed that response rates in mail surveys related to
pharmacy research were usually between 15 and 50 percent.39,141,171 In particular, the
36

response rate of consumer surveys is the lowest (generally 10 to 15 percent). Two public
surveys (utilizing two mailings) in the OTC area both had 15.2 percent response
rates.172,173 Accordingly, in order to achieve 383 valid responses, questionnaires were
mailed out to 2,547 adult subjects (18 years and over), assuming a projected response
rate of 15 percent.
Potential sampling frames to obtain subjects were the electoral register, the
telephone book, and health insurance registration. In England, electoral registers are
commonly used as sampling frames by researchers for local authority areas.174
Telephone books are convenient sources but have some biases, such as the chance of
losing persons who do not have phones. In this study, the sampling frame chosen
(simply out of expedience for the study timeline) was the telephone registry with
SaskTel and was obtained from ASDE Survey Sampler Inc of Montreal, Canada. To help
control for male bias in the list, anyone who was 18 years old or above in the selected
household was allowed to fill out the questionnaire. However, this measure may have
reconfigured bias to a more female slant.
4.3 Instrument Development
A questionnaire was developed to gather the data for this study. Previous studies
related to OTC use,10,53,55,58 minor illnesses,9,37 the pharmacist’s advisory role,106,175
consumer satisfaction with pharmacists or pharmacy services,176,177 consumer
perceptions of OTC products,83,164-167 store images,158,161 and demographics of OTC
users 9,62,63 guided its development. References to survey research 178-187 and scale
development 188 formed the basis for designing the questionnaire.
4.3.1 Components and Item Wording of the Questionnaire
Before an initial draft of the questionnaire was done, there were several wording
concerns. Specifically, if an OTC drug had side effects, did the public think that it was
not safe for use? Moreover, if an OTC drug was potent, did that mean it was effective?
As well, the general public might be confused about what constitutes a convenience
37

store and a pharmacy, given that the business pattern of some pharmacies are similar to
that of convenience stores. For example, listings of several pharmacies (such as
Lakeview Pharmacy, Nordon Drugs, and Northumberland Drugs) could be found both
under the categories of pharmacies and convenience stores in the Saskatoon phone book.
Accordingly, pre-testing was conducted to test several wordings that would
potentially be used in the formal survey questionnaire. The “Wording Trial Document”
(see Appendix A) was designed and distributed to the families and friends of 240
pharmacy students who were studying at the College of Pharmacy and Nutrition at the
University of Saskatchewan. Subsequent to the results from the pre-test, an initial draft
of the formal survey questionnaire was designed.
The questionnaire contained seven sections: 1) consumers’ experiences when
buying and using OTC medicines; 2) consumers’ behaviours when they seek
information regarding OTC use; 3) consumers’ experiences with common minor
illnesses and OTC products; 4) the impressions of OTC medicines held by consumers; 5)
the impressions of pharmacists held by consumers; 6) consumers’ expectations of OTC
medicines sold in different places (pharmacy versus convenience store) with eleven
comparator items for each location; and 7) demographic characteristics of the sample.
4.3.1.1 Purchase and Use of OTC Medicines
To determine consumer behaviour of medication use, there were eight questions
related to availability of OTC products, accessibility of pharmacies and convenience
stores, and medication usage. Three questions associated with convenience stores were
initially designed for this study. The other five questions originally appeared in
American (NCPIE) and Canadian (DIRC) consumer surveys.10,55 These questions were
used to not only understand Saskatoon consumers’ behaviour, but also to compare these
behaviours with other national and international data.
38

4.3.1.2 Information-Seeking Behaviour
Because the major information sources used by consumers are well known, the
purpose of this section was to determine the frequencies at which the public reads
product labels and asks advice from doctors and pharmacists. Two questions related to
label reading when buying and using a product for the first time were taken from the
NCPIE survey55 and then modified for this study. Five sub-items for the information
section (such as directions for use and warnings) were also from the NCPIE55 and DIRC
surveys.10
Taylor has reported on reasons why people do not want advice, and why people
want advice but do not ask for it.106 Nine reasons why consumers may choose not to ask
a pharmacist for advice when buying an OTC medicine were used for this section, with
most selected from Taylor’s reason pool and then modified.
4.3.1.3 Minor Symptoms and Common OTC Products
In this section, nine common symptoms and ten types of OTC products were
included. Two surveys have listed the ten most common symptoms experienced by
Canadians.9,37 Nine minor symptoms (such as headache, cold/flu, and heartburn) were
chosen from these reports, and were matched to nine applicable OTC products. A tenth
product was included (stop-smoking products) that did not have a symptom match, to
round out one of the lists to an even ten. Stop-smoking products are on the top ten OTC
sales lists in both Canadian and American markets.53,58
A five-point Likert scale was used to determine the effectiveness of each given
type of OTC product.
The last question asked participants to indicate their current health status. There
were six options, five of which were cited from the NCPIE survey;55 not sure was added
by the researchers.
39

4.3.1.4 Consumer Impressions of OTC Medicines and Pharmacists
There were seven statements (using five-point Likert scales) to measure
consumer impressions of OTC medicines. An attitude study provided background
content and wording for items 1, 2, 3, 4 and 7.10, 55, 175, Items 5 and 6 originally came
from Barnett et al’s attitude study.176
Nine statements were used to determine consumer impressions of pharmacists,
again using five-point Likert scales. Scope and item content was based on two studies
involving pharmacist satisfaction.138,177 Item 6 was taken verbatim from an attitude
study.176
4.3.1.5 Consumer Expectations of OTC Products
Eleven expectations about OTC medicines were included in this section, with a
seven-point Likert scale used to measure differences between the two locations
(pharmacy versus convenience store). According to the literature on consumer
perceptions of OTC medicines, the terms safety, effectiveness, potency, and side effects
were used.83,164-167 These will be deemed collectively as attributes of a clinical nature for
discussion purposes. Furthermore, studies associated with patronage motives show that
quality, price, availability, usage instructions on products, and store services are
important factors for consumers selecting different places to purchase OTC
medicines.158,161 These items were collectively referred to attributes of a merchandising
nature.
4.3.1.6 Demographics
Several demographic characteristics such as age, gender, education level,
household income, and parental status influence consumer behaviour.9,62,63 In this study,
such characteristics were included to assess their influence on consumer behaviours and
expectations.
40

There were five options to assess education level and four for household income.
The options on education level were based on the design from the NCPIE survey55, but
slightly changed for a Saskatoon market. Responder options for household income were
taken from a national survey conducted by Canadian Facts.9
4.3.2 Assessment by Experts
When the first draft of the questionnaire was done, it was evaluated by three
experts. The version provided to the three experts appears in Appendix (B). One expert,
Steven Pray, is a professor of non-prescription products and devices and the author of a
book (Non-Prescription Product Therapeutics) in the United States. The other two
experts came from Britain – Louise Hughes, an expert in minor illness and David John,
an expert in pharmacy practice, including OTC matters. Their task was to evaluate the
item pool to remove items judged to be obscure, unclear, or irrelevant. These items did
not appear, or were revised, on subsequent versions of the questionnaire.
As responses may differ depending on whom the actual user is, the wording – for
yourself or for someone else – was inserted into several questions in Part I and II. The
experts also suggested that consumers might feel it difficult to accurately remember their
consumption in the last six months. Thus, for several questions, the time period of six
months was changed to 30 days. In the section pertaining to consumer impressions of
OTC medicines, several wordings were changed according to experts’ suggestions. For
statement 1, the term several OTC medicines was changed to more than one OTC
medicine. For statement 6, the term higher than was used instead of beyond. The experts
also suggested reversed phrasing to match a couple of items for validity purposes.
Therefore, the statement, Generally, I find prescription medicines to be more effective
than OTC medicine, was added for eventual comparison to Generally, I find OTC
medicines to be less effective than prescription medicines.
In the expectations section, only minor wording was changed. For item 4, the
term a lot of was suggested to replace extensive.
41

4.3.3 Questionnaire Sensitivity
Two focus groups of four consumers each were used to test the ability
(sensitivity) of the questionnaire to meet study objectives. Four customers (two female
and two male) had purchased OTC medicines only from convenience stores and four
(two female and two male) had bought OTC products from both locations. The
questionnaire was administered to each of these eight subjects, with results assessed as
to whether subtle differences in consumer attitudes would indeed be identified by the
device. For this step, volunteers not only were asked to complete questionnaires, but also
were interviewed via telephone. According to these subjects’ input and the results of the
sensitivity test, the questionnaire was revised (detailed changes appear in section 5.1.2).
4.3.4 Pilot Test
With a revised questionnaire, a pilot test was undertaken. A small sub-set of the
population (38 members of the general public) was asked to participate. Subjects
included university students, middle-aged persons, and seniors and were recruited at the
university cafeteria and through the neighbors, friends, and college colleagues of the
researcher. They were required to fill out the questionnaires and to account for the time
it took to complete. Finally, they were asked to provide suggestions and/or concerns
about the questionnaire format and wording. Data from the pilot test were not included
in the main results of the study.
Although there were minimal comments from these volunteers, the questionnaire
was revised again (detailed changes appear in section 5.1.3). This revised version of the
questionnaire was the final questionnaire (see Appendix C) used in the formal survey.
4.4 Instrument Validity and Reliability
Content validity of the questionnaire was addressed by identifying items from the
literature and through assessment by both experts and participants in the pilot test. The
42

reliability of items (internal consistency) in Part IV and Part V of the questionnaire was
assessed using Cronbach’s alpha.188
This study also examined the test-retest reliability of the instrument. In the test-
retest arm, the first 10 percent of respondents who replied during the formal survey were
mailed the same questionnaire a month after receiving their first answered questionnaire.
A financial reward was added to encourage subjects to respond the second time. Gift
certificates from The Bay ($10) were sent to participants to thank them for their help
after receiving their replies. The two sets of results were analyzed descriptively to
determine test-retest reliability.
4.5 Instrument Delivery and Recovery
In order to improve survey return rates, use of an advance letter and follow-up
letters are considered optimal.179,181,182,187 For this study, advance letters (see Appendix
D) were sent to the 2,547 subjects in June 2003, outlining the purpose of the study and
pointing attention to its ‘value’ to the average consumer. A week later, the main mailing
packages were sent. A cover letter (see Appendix E), a questionnaire, and a business
reply envelope (postage applied) were included in each package. The cover letter again
explained the nature of the study and outlined our reasons for asking their input. The
first follow-up letters (see Appendix F) were mailed to all subjects two weeks after the
questionnaires were sent out. The purpose of this step was to thank those who completed
a questionnaire, and to remind those who had not. After another two weeks, the second
follow-up letters (see Appendix G) were mailed only to the subjects who had not yet
replied. A replacement questionnaire and a business reply envelope (postage applied)
also were included. Data collection ended four weeks after the last letter was mailed.
Finally, non-response cards (see Appendix H) were sent to all non-respondents to
identify a minimum of characteristics for assessment of non-response bias. Only 100
non-responders (randomly selected) from all the non-responders received the cards due
to a budget shortfall.
43

4.6 Data Analysis
Descriptive statistical terms such as mean, standard deviation (SD), and
frequency were employed to report the results from individual items of the survey.
One-way ANOVA was used to test for differences in frequencies of store visits,
number of products used, and number of minor illnesses consumers experienced. A
paired t-test was employed to determine the difference in numbers of information
sections on an OTC product’s package that would be read by consumers when buying
and using/giving the product for the first time.
The Wilcoxon Signed Ranks Test, the Mann-Whitney Test and the Kruskal
Wallis Test were used to compare mean score differences in the ten expectation items
for pharmacies versus convenience stores. These three tests were used for the
nonparametric (ordinal) nature of the data.189
The Wilcoxon Signed Ranks Test is the nonparametric alternative to the
dependent t test. In order to reject a null hypothesis (H0) at a given α level, the obtained
T value (from sampling distribution of the T statistic) must be less than or equal to the
critical T value. However, if a sample number (N) is greater than fifty, the obtained T
value must be transformed into a z score and a critical value taken from the normal
distribution. As per the customary use of the term, the z score for this application
indicates how far, and in what direction, that item deviates from its distribution's mean,
expressed in units of its distribution's standard deviation. The z score transformation is
useful when seeking to compare the relative standings of items from distributions with
different means and/or different standard deviations.
The Mann-Whitney Test is the nonparametric alternative to the independent t test.
To make a decision concerning H0, a U value is computed. It must be less than or equal
to the critical U value (from sampling distribution of the U statistic) to reject H0. When
N is greater than twenty, the obtained U value must be transformed into a z score and a
critical value is taken from the normal distribution. In this study, these two tests utilize z
scores due to the sample size incurred. Z scores are a special application of the
transformation rules.
44

The Kruskal Wallis Test is the nonparametric alternative to the one-way
ANOVA. The sampling distribution for this test is a chi-square distribution; therefore,
this test is reported by using χ2.
In order to test the reliability of the instrument, manual calculation and
Cronbach’s alpha were performed on the stability of the questionnaire over time (test-
retest) and on the internal consistency of items, respectively.
All statistics were analyzed using SPSS 12.0 for Windows software, with
statistical significance set at 0.05. To allow global values for select scales to be
calculated, missing data from single items on such scales were replaced by the mean
score for that item. An exception was data missing from Part VI; if this part was
incomplete, all data from that one respondent’s questionnaire would be excluded from
analysis.
4.7 Ethics
Approval from the University of Saskatchewan Advisory Committee on Ethics in
Behavioural Research was obtained on April 3, 2003.
By necessity, the researchers were aware of participants’ names and mailing
addresses. During the three-month study period, the master address list was kept under
lock-and-key in the graduate student office. After completion of the study, the list was
destroyed.
Identification numbers appeared on questionnaires and were used to identify
non-responders for follow-up purposes. In order to protect responder confidentiality,
surveys and demographics were identified only by a participant number and only
aggregate data were reported.
45

CHAPTER 5: RESULTS
5.1 Instrument Development
5.1.1 Item Wording of the Questionnaire
As a preliminary step toward item generation, 240 pharmacy students were asked
in March 2003 to forward a word-interpretation document to their families and friends
on behalf of the researchers. These were handed out during class time at the College of
Pharmacy and Nutrition. A total of 80 completed documents were received by the due
date, for a response rate of 33.3 percent. All respondents had shopped for an OTC
medicine in pharmacies. Only 50 percent had bought an OTC medicine from a
convenience store. The age range of respondents was 17 to 73 years. More than half of
participants (58.8 percent) were females.
Ability to differentiate potential wording on the final questionnaire was the main
intent of this exercise. First, 81.3 percent of respondents felt they could distinguish
between pharmacies and convenience stores within the retail market place. In order to
confirm this, 13 store names were presented and participants were asked to indicate
which ones were convenience stores. Almost every participant thought of Husky Gas
and Food, Mac’s, 7-11, Shell Gas and Food, and Stop’N’Go as convenience stores
(Table 5.1). Thus, it appeared that use of these two terms -- convenience store and
pharmacy – on a questionnaire would not confuse the public. Table 5.2 shows that most
respondents were quite familiar with shopping in these stores.
Respondents would eventually be asked to express their expectations of OTC
medicines across a variety of parameters. To assess the public’s ability to do this in
relation to the concepts selected, meanings of wording-pairs (n = 10) were compared.
46

Table 5.1 Consumer Ability to Distinguish Store-Type
Is this store a convenience store? YES NO TOTAL
Store Name
Number Percent Number Percent Number Percent
Circle Centre Pharmacy 1 1.2 79 98.8 80 100.0Extra Foods 16 20.3 63 79.7 79 100.0Husky Gas and Food 78 97.5 2 2.5 80 100.0IGA Grocery 14 17.5 66 82.5 80 100.0Lakeview Pharmacy 7 8.7 73 91.3 80 100.0Mac’s Stores 76 95.0 4 5.0 80 100.0PharmaSave 9 11.4 70 88.6 79 100.07-11 Stores 78 97.5 2 2.5 80 100.0Safeway Food and Drug 9 11.2 71 88.8 80 100.0Sears Department Store 8 10.0 72 90.0 80 100.0Shell Gas and Food Store 77 96.2 3 3.8 80 100.0Shoppers Drug Mart 13 16.2 67 83.8 80 100.0Stop ‘N’ Go Confectionary 78 97.5 2 2.5 80 100.0
Table 5.2 Consumer Shopping Experiences in Each Outlet
Have you shopped here? YES NO TOTAL
Store Name
Number Percent Number Percent Number Percent
Circle Centre Pharmacy 16 20.1 63 79.9 79 100.0Extra Foods 57 72.2 22 27.8 79 100.0Husky Gas and Food 30 37.5 50 62.5 80 100.0IGA Grocery 65 81.2 15 18.8 80 100.0Lakeview Pharmacy 9 11.2 71 88.8 80 100.0Mac’s Stores 64 80.0 16 20.0 80 100.0PharmaSave 54 67.5 26 32.5 80 100.07-11 Stores 68 85.0 12 15.0 80 100.0Safeway Food and Drug 74 92.5 6 7.5 80 100.0Sears Department Store 70 87.5 10 12.5 80 100.0Shell Gas and Food Store 52 65.0 28 35.0 80 100.0Shoppers Drug Mart 78 97.5 2 2.5 80 100.0Stop ‘N’ Go Confectionary 20 25.0 60 75.0 80 100.0
47

During questionnaire development, effectiveness versus potency and safety
versus side effects were considered by the researchers to potentially pose the most
problems. Of the sample surveyed, more respondents (70.9 percent) believed that the
meaning of effectiveness differed from that of potency; 29.1 percent thought that the
meanings of the two words were similar. For safety versus side effects, nearly three in
five respondents believed that the meanings of these two words were indeed different.
Table 5.3 presents the detailed results. Participants were then asked to explain their
understanding of the meanings of effectiveness versus potency and safety versus side
effects. The majority of respondents complied with this request. The detailed results are
shown in Appendix I. Many respondents thought that effectiveness and potency had
different meanings for two major reasons. First, they believed that potency pertained to
how strong a medicine is, while effectiveness meant how well a medicine works. They
also thought that greater potency did not necessarily mean higher effectiveness. Many
people also thought that the meanings of safety and side effects were different because
drugs could be safe but still have side effects; side effects were not necessarily unsafe. A
few people felt price was synonymous with safety, effectiveness, side effects, and
potency.
Table 5.3 Comparison of Meanings of Each Word-Pairing
Considered to be Similar
Considered to be Different
Total
Pairs of words
N (%) N (%) N (%) Cost vs Price 63 (79.7) 16 (20.3) 79 (100.0) Safety vs Effectiveness 3 (3.7) 77 (96.3) 80 (100.0) Price vs Safety 1 (1.2) 79 (98.8) 80 (100.0) Effectiveness vs Potency 23 (29.1) 56 (70.9) 79 (100.0) Side effect vs Potency 8 (10.1) 71 (89.9) 79 (100.0) Price vs Effectiveness 3 (3.7) 77 (96.3) 80 (100.0) Safety vs Side effect 31 (40.8) 45 (59.2) 76 (100.0) Side effect vs Price 2 (2.5) 78 (97.5) 80 (100.0) Effectiveness vs Side effect 8 (10.0) 72 (90.0) 80 (100.0) Price vs Potency 5 (6.2) 75 (93.8) 80 (100.0)
48

5.1.2 Expectations Scale Pre-Test
The purpose of this activity was to pre-test the scale for question-wording
pertaining specifically to expectations. The average age of the eight participants for this
pre-test was 30 years (range: 21 to 52 years). Two were parents with children under 16.
The majority had university degrees. Their household incomes varied – three
respondents earned less than $20,000 a year; two were in the range of $20,000 to
$39,999; one was at $40,000 to $59,999; and the remaining two exceeded $60,000.
Table 5.4 shows that for the eleven expectation items, there was no significant
difference between expectations on medicine characteristics for the two locations (a
pharmacy versus a convenience store), although differences across items did exist.
Expectations of professional help, for example, was quite different for the two locations.
While a seven-point scale may garner more variability (and be more sensitive) than a
five-point scale, a definitive conclusion on test sensitivity was not possible with the data
obtained. One main hurdle in assessing test sensitivity was the complete lack of existing
data on the scaling required to pick up differences if they did indeed exist.
5.1.3 The Reliability of Questionnaire
To determine the internal reliability of the eight statements purported to reflect
consumer impressions of OTC medicines (Part IV) and the nine statements purported to
reflect consumer impressions of pharmacists (Part V), Cronbach’s alpha was utilized.
Cronbach’s alpha for Part IV was 0.49 and 0.82 for the battery of items in Part V.
Acordingly, modifications were made only to the items of Part IV. The statement “I read
the instruction carefully before taking an OTC medicine for the first time” was removed
and the phrasing of several statements (items 5, 7, and 8) was modified.
49

Table 5.4 Expectations Scalea Pre-Test: Difference in Public Expectations of OTC Medicines for Two Locations (Convenience Store versus Pharmacy)
Items
Convenience store
Mean (SD)
Pharmacy
Mean (SD)
Difference bin
Mean
Z score c
1. I expect a good selection of OTC medicines. 2.00 (0.75) 7.00 (0.00) - 5.00 - 2.56
2. I expect OTC medicines to be effective. 5.87 (1.25) 6.25 (1.04) - 0.38 - 1.00
3. I expect OTC medicines to be safe. 5.63 (2.07) 5.88 (2.10) - 0.25 - 1.00
4. I expect a lot of information on the packages. 5.38 (1.19) 5.75 (0.71) - 0.37 - 1.00
5. I expect OTC medicines to be potent. 4.88 (0.99) 5.00 (1.07) - 0.12 - 1.00
6. I expect OTC medicines to have very few side effects. 4.25 (1.67) 4.37 (1.77) - 0.12 - 1.00
7. I expect to find OTC medicines I have used before. 3.75 (1.75) 6.63 (1.06) - 2.88 - 2.12
8. I expect low prices on OTC medicines. 2.88 (2.10) 4.63 (1.85) - 1.75 - 1.23
9. I expect OTC medicines to be less effective than prescription medicines.
4.50 (2.07) 4.25 (2.38) 0.25 - 1.00
10. I expect professional help. 1.13 (0.35) 6.88 (0.35) - 5.75 - 2.64
11. I expect to find good quality products. 2.75 (1.58) 6.87 (0.35) - 4.12 - 2.54
a.Scale: 1 (Strongly Disagree) to 7 (Strongly Agree) b. The mean score of Convenience Stores minus the mean score of Pharmacies. c. Wilcoxon Signed Ranks Test
5.1.4 Wording Suggestions from Interviewees
The eight participants of the expectations scale pre-test were interviewed as well.
Participants were asked to provide suggestions and identify concerns for the
questionnaire design. Subsequent to such concerns, few changes were made. For
instance, several examples of pharmacy and convenience store outlets were provided
50

within the directions in the hopes of adding clarity when responding. To avoid confusion
about what constitutes an OTC medicine, the passage – OTC medicines in this case do
not include vitamins and herbals – was added to the introductory part of the
questionnaire.
Overall, most respondents thought that the instructions on the questionnaire were
clear and they did not have trouble in answering questions.
5.1.5 Pilot Test
Thirty-eight members of the public were selected from the residents of a
university neighbourhood. These people included students, middle-aged people, and the
elderly. Thirty-four of the 38 went on to participate in this pilot study while four refused.
Overall, all respondents completed their questionnaires within ten minutes and
most felt satisfied with the format and wording. Therefore, only a few changes were
made at this juncture. First, respondents suggested adding examples for OTC medicines.
Because such examples were difficult to fit in the lines of the questionnaire, they were
added in the cover letter sent with it. Second, key words within questions were
capitalized such as PAST SIX MONTHS, FOR ANY REASON, DIFFERENT, BUYING,
USING/GIVING, and FIRST TIME. Finally, one statement -- Generally, I find OTC
medicines to be less effective than prescription medicines – was removed from Part IV.
As well, the wording of Statement 6 in this part was modified – the term OTC medicines
was used instead of “… medicines without a prescription …”.
At this point, the final version of the questionnaire was ready for use in the main
survey.
5.2 Study Results
This survey was conducted from June 27 to September 4, 2003.
51

5.2.1 Response Rate
A total of 2547 advance letters were distributed to subjects. A copy of the
questionnaire was sent with a cover letter to each subject a week later. This group
represented the sample.
A total of 445 questionnaires remained undelivered by the end of data collection.
The reasons for the undelivered mail included address changes (n = 411), incomplete
addresses (n = 7), and deceased persons (n = 27). Therefore, the final sample size was
considered to be 2102. A further 27 subjects informed the researchers that they refused
to participate in this study, but this number was not subtracted from the denominator.
When the data collection period closed, a total of 1296 questionnaires had been
returned. Ninety-four of these questionnaires were incomplete in major sections,
therefore were excluded from data analysis. They were not counted in the response rate
numerator, leaving the total number of valid questionnaires at 1202. Thus, the response
rate of the study was 57.2 percent.
Sixteen questionnaires were received after the closing date; this group did not
include in the data analysis, even though the questionnaires were complete.
5.2.2 Demographics of Subjects
The age range of respondents varied widely from 18 to 97 years, with the
average age being 52.7 years (SD = 16.4). The majority of respondents (n = 719/1189;
60.5 percent) fell within the range of 35 to 64 years. The proportions of males (51.1
percent) and females (48.9 percent) were very similar. Nearly 90 percent of respondents
had completed a basic level of formal education (high school) and there were 32.6
percent of respondents with college/university degrees. Comparing respondents’
household incomes, the researchers found that incomes exceeding $60,000 constituted
the largest group (429/1198; 35.8 percent). Only 12 percent of respondents’ household
incomes (n = 144) were lower than $20,000. Most participants (n = 1033; 86.0 percent)
reported that they were healthy. Just over 70 percent of participants were neither parents
52

nor guardians of children (under 16 years old) at home. The demographic results are
shown in Table 5.5.
Table 5.5 Demographics of the Study Population
Characteristics (number of respondents completing the item) Frequency Percent
Age groups (N = 1189) 18 – 24 25 – 34 35 – 44 45 – 54 55 – 64 65 – 74 75 – 84 85 and over
36 133 226 295 198 155 118 28
3.0 11.2 19.1 24.8 16.6 13.0 9.9 2.4
Gender (N = 1200) Male Female
613 587
51.1 48.9
Education level completed (N= 1198) Less than high school graduate High school graduate Trade/Technical school Some College/University College or University graduate
130 245 237 195 391
10.9 20.5 19.8 16.3 32.6
Household income (N = 1198) Under $20,000 $20,000 to $39,999 $40,000 to 59,999 $60,000 and over
144 276 265 429
12.0 23.1 22.1 35.8
Current health status (N = 1202) Poor Fair Good Very good Excellent Not sure
27 133 442 418 173 9
2.2 11.1 36.8 34.8 14.4 0.7
A parent or guardian of children under 16 at home (N = 1202) Yes No
337 865
28.0 72.0
53

5.2.3 Consumers’ Experiences with Buying and Using Medicines
Participants were asked to indicate whether they were aware OTC purchases
could take place in convenience stores. A very high proportion of respondents (n =
970/1194; 81.2 percent) realized that OTC medicines could indeed be purchased in such
outlets. Analyzing demographic factors (gender, highest education completed, household
income levels, and a parent/guardian of children under 16 years old at home) found
some patterns of public awareness of OTC purchases in convenience stores. Figure 5.1
reveals that more than 80 percent of respondents with relatively high education
(trade/technical school at 85.7 percent; some college/university at 80.4 percent;
university/college graduate at 82.9 percent) were aware of this possibility. Respondents
with high household incomes had the greatest awareness of OTC medicine purchases
being possible from convenience stores (Figure 5.2). Figure 5.3 indicates that young
people also had high awareness. Respondents who were parents/guardians of children
under 16 (86.4 percent) were slightly more aware of this situation than those who were
not (78.5 percent). However, there was no apparent difference in awareness between
males (n = 498/608; 81.9 percent) and females (n = 470/584; 80.5 percent).
0%
20%
40%
60%
80%
100%
Less than high schoolgraduate
High school graduate Trade/Technical school Some College/University University/Collegegraduate
Education Level
Perc
ent o
f Res
pond
ents
Yes No
Figure 5.1 Percentage of Consumers Aware of the Option to Purchase OTC Medicines in Convenience Stores by Education Level
54

0%
20%
40%
60%
80%
100%
Under $20,000 $20,000 to $39,999 $40,000 to $59,999 $60,000 and over
Household Income Level
Perc
ent o
f Res
pond
ents
Yes No
Figure 5.2 Percentage of Consumers Aware of the Option to Purchase OTC Medicines in Convenience Stores by Household Income
0%
20%
40%
60%
80%
100%
18~24 yrs 25~34 yrs 35~44 yrs 45~54 yrs 55~64 yrs 65~74 yrs 75~84 yrs 85 yrs andover
Age Group
Perc
ent o
f Res
pond
ents
Yes No
Figure 5.3 Percentage of Consumers Aware of the Option to Purchase OTC Medicines in Convenience Stores by Age
While most respondents knew that OTC medicines could be purchased in
convenience stores, only 42.2 percent had done so. Pharmacies appeared to be the
location of choice for the majority of respondents, where 96.1 percent (n = 1155/1199)
had purchased them from pharmacies. Figure 5.4 shows the number of consumers who
had purchased OTC medicines in pharmacies and in convenience stores.
55

1155
440 61
632507
0
200
400
600
800
1000
1200
1400
Yes No Cannot recall
Num
ber o
f Res
pond
ents
Pharmacy Convenience store
Figure 5.4 Number of Consumers Who Had Purchased OTC Medicines from Either Location – Pharmacy vs. Convenience Store
As seen in Figure 5.5, slightly more men (45.8 percent; n = 280/612) than
women (38.6 percent; n = 226/586) had bought OTC medicines in convenience stores.
This difference disappeared for pharmacies, where the percentage of male buyers (96.4
percent; n = 590/612) and female buyers (96.2 percent; n = 563/585) were similar.
Figure 5.6 shows that a greater percentage of respondents with higher education had
purchased OTC medicines both from convenience stores and pharmacies when
compared to respondents with low educational levels.
A somewhat greater proportion of respondents who had high household incomes
also had bought such medicines from both locations (see Figure 5.7).
The percentage of consumers purchasing OTC products in convenience stores
decreased with age (see Figure 5.8). Although the same suggestive relationship of age to
purchase could be found in pharmacy patrons, there was only a slight decrease (94.4
percent to 85.7 percent) with advancing age.
In Figure 5.9, a higher percentage of participants who were parents/guardians of
children under 16 years of age (49.0 percent; n = 165/337) bought OTC medicines in
convenience stores when compared to childless households (39.6 percent; n = 342/863).
56

0%
20%
40%
60%
80%
100%
Male Female
Gender
Perc
ent o
f Pes
pond
ents
Pharmacy
Convenience store
Figure 5.5 Percentage of Male and Female Consumers Who Had Purchased OTC
Medicines from Each Location
0%
20%
40%
60%
80%
100%
Less than highschool graduate
High schoolgraduate
Trade/Technicalschool
SomeCollege/University
University/Collegegraduate
Education Level
Perc
ent o
f Res
pond
ents
Pharmacy Convenience store
Figure 5.6 Percentage of Consumers Who Had Purchased OTC Medicines from Each Location by Education Level
0%
20%
40%
60%
80%
100%
Under $20,000 $20,000 to$39,999
$40,000 to$59,999
$60,000 and over
Household Income Level
Perc
ent o
f Res
pond
ents
Pharmacy
Convenience store
Figure 5.7 Percentage of Consumers Who Had Purchased OTC Medicines from Each
Location by Household Income
57

0%
20%
40%
60%
80%
100%
18~24 yrs 25~34 yrs 35~44 yrs 45~54 yrs 55~64 yrs 65~74 yrs 75~84 yrs 85 yrs andover
Age Group
Perc
ent o
f Res
pond
entd
s
Pharmacy Convenience store
Figure 5.8 Percentage of Consumers Who Had Purchased OTC Medicines from Each Location by Age
0%
20%
40%
60%
80%
100%
A parent/guardian Not a parent/guardian
Status
Perc
ent o
f Res
pond
ents
Pharmacy
Convenience store
Figure 5.9 Percentage of Consumers Who Had Purchased OTC Medicines from Each
Location by Parental/Guardian Status
Respondents reported they had made an average of 1.0 OTC purchases from
convenience stores within the past six months, in contrast to an average of 3.1 such
purchases from pharmacies (Table 5.6). To calculate the mean values for each location,
the data from respondents who selected more than two times, but did not go on to
indicate the exact number of visits, were excluded (11 convenience store respondents
and 71 pharmacy respondents).
Thirty-three respondents reported they had purchased OTC medicines at least
three times from convenience stores during this period. A total of 382 respondents had
purchased OTC medicines at least three times from pharmacies, with 47 stating this
58

exceeded ten times within six months. On the other hand, many respondents did not buy
any OTC products from convenience stores (n = 189) nor from pharmacies (n = 80).
Table 5.6 Frequency of OTC Purchases from Either Location Within the Past Six Months
Location N Minimum Maximum Mean SD Convenience stores 485 0 10 1.0 1.3
Pharmacies 1070 0 20 3.1 2.9
One-way ANOVA was performed to determine whether the mean values for
OTC purchases at the two locations were significantly different across demographic
characteristics. The frequency of OTC purchases in convenience stores (Table 5.7) and
pharmacies (Table 5.8) were dependent variables, while gender, education level,
household income, age groups, and parent/guardian status were independent variables.
Table 5.7 indicates there were significant differences in the number of OTC
purchases in convenience stores across age groups.
Post-hoc analysis using the Scheffe test revealed that respondents aged 75 to 84
years purchased OTC medicines in convenience stores significantly more often (1.66
times) than those in other groups: 25 to 34 years (0.88 times); 45 to 54 years (0.89
times); 55 to 64 years (0.89 times); 65 to 74 years (1.05 times) and 35-44 years (1.17
times).
59

Table 5.7 Frequency of OTC Purchases in Convenience Stores Within the Past Six Months According to Demographic Parameters
Variable df SS MS F
Gender Between groups 1 1.40 0.70 0.42 Within groups 472 782.99 1.66
Education level Between groups 4 15.11 3.78 2.30 Within groups 469 769.28 1.64
Household income Between groups 3 12.54 3.13 1.91 Within groups 470 771.85 1.65
Age group Between groups 7 26.71 3.82 2.34* Within groups 466 753.52 1.63
Status as parent/guardian of children (under 16 at home)
Between groups 1 1.76 1.76 1.06 Within groups 472 782.63 1.66
* p < 0.05
According to the ANOVA analysis, significant differences in frequency of OTC
purchases in pharmacies (Table 5.8) existed for the variables household income and
status as a parent/guardian. Respondents without children made less OTC purchases
(2.94 times) in pharmacies than did those who had children at home (3.48 times). With
post-hoc analysis (Scheffe test), the results showed that respondents with lower incomes
(< $20,000 and $20,000 to $39,999) bought OTC medicines significantly less often from
pharmacies (2.59 times and 2.85 times, respectively) than did those with higher incomes
[$40,000 to $59,999 (3.38 times) and > $60,000 (3.33 times)].
60

Table 5.8 Frequency of OTC Purchases in Pharmacies Within the Past Six Months According to Demographic Parameters
Variable df SS MS F Gender
Between groups 1 22.13 11.06 1.36 Within groups 997 8114.21 8.15
Education level Between groups 4 76.19 15.24 1.88 Within groups 994 8060.65 8.12
Household income Between groups 3 104.69 26.17 3.24* Within groups 995 8031.65 8.08
Age group Between groups 7 65.97 9.42 1.16 Within groups 991 7985.09 8.15
Status as parent/guardian of children (under 16 at home)
Between groups 1 59.68 59.68 7.37** Within groups 997 8076.66 8.10
*p < 0.05 **p < 0.001
As depicted in Table 5.9, participants indicated they visited convenience stores
(for any reason) an average of 3.6 times a month (SD = 5.5) and visited pharmacies (for
any reason) an average of 2.2 times a month (SD = 2.5). When calculating the mean of
visit frequency, data from respondents (39 respondents for convenience stores and 30
respondents for pharmacies) who selected more than two times, but did not indicate the
exact number of visits, was excluded.
Within the past 30 days for each respondent, the majority (n = 764; 66.6 percent)
had visited convenience stores; 10 had visited over 30 times. At the same time, 382
respondents (34.5 percent) did not use such stores at all. For pharmacy visits, a high
percentage of respondents (n = 949; 83.5 percent) had visited pharmacies during the past
30 days, with 24 revealing they went to pharmacies at least ten times. Only 188
61

respondents (16.5 percent) had not visited a pharmacy.
Table 5.9 Frequency of Visits to Either Location for Any Reason Within the Past 30 Days
Location N Minimum Maximum Mean SD Convenience stores 1107 0 60 3.6 5.5
Pharmacies 1137 0 30 2.2 2.5
There were no significant differences in pharmacy visits among the subgroups of
gender, education level, household income, age, and status as parents/guardians of
children still at home (see Table 5.10).
Table 5.10 Frequency of Pharmacy Visits Within the Past 30 Days According to Demographic Parameters
Variable df SS MS F Gender
Between groups 1 5.10 2.55 0.40 Within groups 1135 7220.94 6.37
Education level Between groups 4 40.60 8.12 1.28 Within groups 1132 7185.43 6.35
Household income Between groups 3 42.02 10.51 1.66 Within groups 1133 7184.02 6.35
Age group Between groups 7 13.30 1.90 0.30 Within groups 1129 7129.20 6.28
Status as parent/guardian of children (under 16 at home)
Between groups 1 15.24 15.24 2.40 Within groups 1135 7210.80 6.35
62

Table 5.11 shows that significant differences in convenience store visits existed
among the subgroups of each independent variable. Men visited convenience stores
(4.02 times) more times than did women (3.14 times), while parents/guardians of young
children did much more shopping (5.14 times) in convenience stores than did childless
subjects (2.98 times).
Table 5.11 Frequency of Convenience Store Visits Within the Past 30 Days According to Demographic Parameters
Variable df SS MS F Gender
Between groups 1 230.54 115.27 3.86*Within groups 1105 32977.45 29.87
Education level Between groups 4 776.93 155.39 5.28**Within groups 1103 32431.06 29.46
Household income Between groups 3 712.62 178.16 6.04**Within groups 1104 32495.37 29.49
Age group Between groups 7 3582.34 511.76 18.85**Within groups 1100 29505.85 27.14
Status as parent/guardian of children (under 16 at home)
Between groups 1 1028.00 1028.00 35.30**Within groups 1105 32179.99 29.12
*p < 0.05 **p < 0.001
According to the results of post-hoc analysis (Scheffe test), there were significant
differences in frequencies of convenience store visits between the groups of people who
had less than high school (1.61 times) versus those who either had graduated from high
school (3.21 times), trade/technical school (4.62 times), some university/college (3.83
63

times), or university/college (3.73 times). Household income produced significant
differences between the groups of under $20,000 (2.23 times) and $40,000 to $59,999
(4.48 times), as well as between the group under $20,000 (2.23 times) and > $60,000
(4.04 times). Younger respondents shopped in convenience stores more frequently than
older ones (Figure 5.10).
0
2
4
6
8
18~24 yrs 25~34 yrs 35~44 yrs 45~54 yrs 55~64 yrs 65~74 yrs 75~84 yrs 85 yrs andover
Age Group
Stor
e Vi
sits
(tim
es/m
onth
)
Figure 5.10 Frequency of Convenience Store Visits Within the Past 30 Days by Age
Within the context of a 30-day period, an average of 1.6 different OTC medicines
(SD = 1.4) and 1.6 different prescription medicines (SD = 2.0) were taken by the sample
(Table 5.12). When calculating these means, data from respondents (12 for OTC
medicines and 11 for prescription medicines) who selected more than two products, but
did not indicate the exact number of products, was excluded.
Table 5.12 Number of Different Medicines Taken Within the Past 30 Days
Type of medicine N Minimum Maximum Mean SD OTC medicines 1068 0 12 1.6 1.4
Prescription medicines 1187 0 20 1.6 2.0
64

Most respondents (n = 950; 80.5 percent) indicated that they had taken at least
one OTC medicine within the past 30 days; several (n = 43) took more than four
different agents. In contrast, 19.5 percent did not take any OTC medicine within those
same 30 days. For prescription medicines, 61.9 percent of respondents (n = 741) took at
least one during the past 30 days, with 12 percent (n = 94) taking more than four
different medications. However, 38.1 percent of respondents (n = 457) did not take any
prescription medicines within the past 30 days.
Analysis of the mean number of OTC medicines taken, results show there were
no significant differences among subgroups of each demographic variable except gender
(Table 5.13). On average, females used more OTC medicines (1.8) than males did (1.4).
Table 5.13 Number of OTC Medicines Taken Within the Past 30 Days According to Demographic Parameters
Variable df SS MS F Gender
Between groups 1 36.44 18.22 9.06** Within groups 1166 2342.43 2.01
Education level Between groups 4 10.34 2.07 1.01 Within groups 1163 2374.84 2.04
Household income Between groups 3 4.03 1.01 0.49 Within groups 1164 2374.84 2.04
Age group Between groups 7 10.15 1.45 0.71 Within groups 1160 2351.05 2.05
Status as parent/guardian of children (under 16 at home)
Between groups 1 1.47 1.47 0.72 Within groups 1166 2377.41 2.04
**p < 0.001
Unlike the ANOVA results for number of OTC medicines taken, there were
significant differences in the average number of prescription medicines used within the
65

past 30 days across all subgroups of each demographic characteristic, except gender
(Table 5.14). For example, participants who were not parents/guardians of children
under 16 took just over twice as many prescription medicines (1.9) than those who were
parents/guardians of children under 16 (0.8).
Table 5.14 Number of Prescription Medicines Taken Within the Past 30 Days According to Demographic Parameters
Variable df SS MS F Gender
Between groups 1 0.46 0.23 0.06 Within groups 1185 4874.35 4.12
Education level Between groups 4 149.74 29.95 7.49** Within groups 1182 4725.06 4.00
Household income Between groups 3 163.55 40.89 10.26** Within groups 1183 4711.25 3.99
Age group Between groups 7 816.75 116.68 33.80** Within groups 1179 4024.69 3.45
Status as parent/guardian of children (under 16 at home)
Between groups 1 285.81 285.81 73.80** Within groups 1185 4588.99 3.87
**p < 0.001
In order to examine where differences existed, the post-hoc Scheffe Test was
employed. First, for education level, there were significant differences between mean
prescription use for those attaining less than high school (2.4) against the groups of
trade/technical school (1.5), some college/university (1.2), or university/college
graduate (1.2). The difference was also significant between respondents who were high
school graduates (1.8) and those who were university/college graduates (1.2). Figure
5.11 shows that respondents with lower education appeared to take more prescription
66

medicines within the given time period compared to those with higher education.
Second, for household income, significant differences in mean prescription
medicine usage could be seen between respondents with incomes > $60,000 (1.1) and
those under $20,000 (2.1), and in > $60,000 versus $20,000 to $39,999 (1.9). In general,
respondents with high household incomes took fewer prescription medicines than those
with low household incomes (Figure 5.12).
0
0.5
1
1.5
2
2.5
Less than highschool graduate
High schoolgraduate
Trade/Technicalschool
SomeCollege/University
University/Collegegraduate
Education Level
Rx
Take
n
(num
bers
/mon
th)
Figure 5.11 Average Number of Prescription Medicines Taken Within the Past 30 Days
by Education Level
0
0.5
1
1.5
2
2.5
Under $20,000 $20,000 to $39,999 $40,000 to $59,999 $60,000 and over
Household Income Level
Rx
take
n (n
umbe
rs/m
onth
)
Figure 5.12 Average Number of Prescription Medicines Taken Within the Past 30 Days
by Household Income
Finally, significant differences existed between the young (under 35 years; mean
= 0.9) and the middle age group (35 to 64 years; mean = 1.2), as well as the young and
elderly age group (> 65 years; mean = 3.1). Significant differences also were evident
67

between middle age and elderly groups. Overall, older respondents took more
prescription medicines (Figure 5.13).
0
1
2
3
4
18~24 yrs 25~34 yrs 35~44 yrs 45~54 yrs 55~64 yrs 65~74 yrs 75~84 yrs 85 yrs andover
Age Group
Rx
Take
n (n
umbe
rs/m
onth
)
Figure 5.13 Average Number of Prescription Medicines Taken Within the Past 30 Days
by Age
Encountering side effects when taking any medicine can affect medicine-taking
behaviour. When asked about their side effect experiences when taking OTC medicines,
86 respondents reported they could not recall and therefore could not respond. Of those
who could recall (n = 1108) either way, 21.1 percent (n = 234) said they had experienced
side effects when taking OTC medicines. The majority (n = 874; 78.9 percent), though,
had never experienced any side effect from an OTC medicine (see Figure 14).
234
86
874
0
200
400
600
800
1000
Yes No Cannot recall
Experienced a Side Effect
Num
ber o
f Res
pond
ents
Figure 5.14 Consumers Claiming to Have Experienced Side Effect(s) Upon Taking
OTC Medicines
68

5.2.4 Information-Seeking Behaviours
In the process of medication usage, a person will have to buy a product, then use
it once home. There is a possibility that different types of information are needed for
each of these two steps. For example, when buying a product, the agent’s indication for
use would likely be paramount in the mind of the purchaser. Right before taking it for
the first time, the dosing regimen and possible side effects might be more timely.
Table 5.15 shows that, whether buying (76.9 percent) or using/giving (80.0
percent) an OTC product for the first time, a high proportion of respondents would read
the information on the package. Only a few people said that they would not read this
information when buying (n = 49; 4.1 percent) or using/giving (n = 47; 3.9 percent) it for
the first time.
Table 5.15 Consumer Claims for Reading Information on OTC Medicine Packaging When BUYING or USING/GIVING a Product for the First Time
Reading Frequency
BUYING N (%)
USING/GIVING N (%)
No 49 (4.1%) 47 (3.9%) Sometimes 228 (19.0%) 193 (16.1%) Always 923 (76.9%) 957 (80.0%)
First-time purchasing and package reading behaviors are the points of
comparisons represented in Figures 5.15 to 5.19. Figure 5.15 illustrates that higher
percentages of female versus male respondents (81.1 percent and 72.7 percent,
respectively) claimed to always read package information. Figure 5.16 shows
parents/guardians of children under 16 (83.1 percent) as frequent information readers.
Education levels are compared in relation to package reading practice in Figure 5.17.
Approximately 80 percent of respondents in the some university/college (79.5 percent)
or university/college graduation (80.8 percent) groups claimed to always read the
information. Figure 5.18 shows the percentage of income groups who claimed to always
69

read the package, with the $20,000 to $39,999 segment being quite high. For age groups
(Figure 5.19), slightly lower percentages of respondents in the younger groups (18 to 24
years and 25 to 34 years) and the oldest group (> 85 years) read the information when
compared to other age segments.
0%
20%
40%
60%
80%
100%
Male Female
Gender
Perc
ent o
f Res
pond
ents
No Sometimes Alw ays
Figure 5.15 Propensity to Read OTC Medicine Package Information When BUYING a Product for the First Time by Gender
0%
20%
40%
60%
80%
100%
A parent/guardian Not a parent/guardian
Status
Perc
ent o
f Res
pond
ents
No Sometimes Alw ays
Figure 5.16 Propensity to Read OTC Medicine Package Information When BUYING a Product for the First Time by Parent/Guardian Status
70

0%
20%
40%
60%
80%
100%
Less than highschool graduate
High schoolgraduate
Trade/Technicalschool
SomeCollege/University
University/Collegegraduate
Education Level
Perc
ent o
f Res
pond
ents
No Sometimes Alw ays
Figure 5.17 Propensity to Read OTC Medicine Package Information When BUYING a Product for the First Time by Education Level
0%
20%
40%
60%
80%
100%
Under $20,000 $20,000 to $39,999 $40,000 to $59,999 $60,000 and over
Household Income Level
Perc
ent o
f Res
pond
ents
No Sometimes Alw ays
Figure 5.18 Propensity to Read OTC Medicine Package Information When BUYING a Product for the First Time by Household Income
0%
20%
40%
60%
80%
100%
18~24 yrs 25~34 yrs 35~44 yrs 45~54 yrs 55~64 yrs 65~74 yrs 75~84 yrs 85 yrs andover
Age Group
Perc
ent o
f Res
pond
ents
No Sometimes Alw ays
Figure 5.19 Propensity to Read OTC Medicine Package Information When BUYING a Product for the First Time by Age
71

With analyzing respondents’ information reading behaviours when using/giving
an OTC product for the first time, patterns were similar to their behaviours when buying
the product (Figures 5.20, 5.21, 5.22, 5.23, and 5.24).
0%
20%
40%
60%
80%
100%
Male Female
Gender
Perc
ent o
f Res
pond
ents
No Sometimes Alw ays
Figure 5.20 Propensity to Read OTC Medicine Package Information When USING/GIVING a Product for the First Time by Gender
0%
20%
40%
60%
80%
100%
A parent/guardian Not a parent/guardian
Status
Perc
ent o
f Res
pond
ents
No Sometimes Alw ays
Figure 5.21 Propensity to Read OTC Medicine Package Information When USING/GIVING a Product for the First Time by Parent/Guardian Status
72

0%
20%
40%
60%
80%
100%
Less than high schoolgraduate
High school graduate Trade/Technicalschool
SomeCollege/University
University/Collegegraduate
Education Level
Perc
ent o
f Res
pond
ents
No Sometimes Alw ays
Figure 5.22 Propensity to Read OTC Medicine Package Information When
USING/GIVING a Product for the First Time by Education Level
0%
20%
40%
60%
80%
100%
Under $20,000 $20,000 to $39,999 $40,000 to $59,999 $60,000 and over
Household Income Level
Perc
ent o
f Res
pond
ents
No Sometimes Alw ays
Figure 5.23 Propensity to Read OTC Medicine Package Information When USING/GIVING a Product for the First Time by Household Income
0%20%40%60%80%
100%
18~24 yrs 25~34 yrs 35~44 yrs 45~54 yrs 55~64 yrs 65~74 yrs 75~84 yrs 85 yrs andover
Age Group
Perc
ent o
f Res
pond
ents
No Sometimes Alw ays
Figure 5.24 Propensity to Read OTC Medicine Package Information When USING/GIVING a Product for the First Time by Age
73

Regarding the types of information participants would read, six options were
provided on the questionnaire – Directions for use, Symptom(s) it treats, Warnings,
Active ingredient(s), Possible side effects, and Other. Participants were asked to check
all that applied. However, when respondents indicated they did NOT read information
on an OTC medicine’s package, they were not required to answer this question. Table
5.16 shows the details of how many information sections consumers would read when
buying and using/giving the product for the first time. On average, consumers would
read 4.0 sections (SD = 1.3) when they first purchased a specific OTC medicine, and
they would read 3.9 sections (SD = 1.4) when they used the product for themselves or
gave it to someone else for the first time. With paired t-test analysis, there was a
significant difference between the numbers of sections read when buying and
using/giving, although this is likely of little practical importance.
Table 5.16 Claims for Information Sections Read by Consumers When BUYING and USING/GIVING a Product for the First Time
Number of sections selected
BUYING N (%)
USING/GIVING N (%)
One section 54 (4.6%) 104 (9.0%) Two sections 114 (9.8%) 108 (9.3%) Three sections 143 (12.3%) 144 (12.5%) Four sections 283 (24.3%) 272 (23.5%) Five sections 477 (40.9%) 455 (39.4%) Six sections 45 (3.9%) 26 (2.2%) No need to answer 49 (4.2%) 47 (4.1%) Missing data 37 46
With ANOVA analysis for mean sections claimed to be read by consumers when
buying an OTC product for the first time (Table 5.17), there were significant differences
between gender and among education levels. Females would read slightly more sections
(4.2) than males (3.9), while respondents with higher educational levels (some
college/university = 4.3; college/university graduation = 4.2) would read slightly more
74

sections on average than would other educational groups (less than high school
graduation = 3.8; high school graduation = 3.9; and trade/technical school graduation =
3.8).
Table 5.17 Information Sections on an OTC Product Package That Would be Read by Consumers When BUYING a Product for the First Time by Demographic Parameters
Variable df SS MS F Gender
Between groups 1 29.37 14.68 9.55** Within groups 1114 1711.60 1.54
Education level Between groups 4 48.14 9.63 6.31* Within groups 1111 1692.83 1.53
Household income level Between groups 3 3.54 0.88 0.57 Within groups 1112 1736.94 1.56
Age group Between groups 7 20.38 2.91 1.88 Within groups 1108 1696.44 1.55
Status as parent/guardian of children (under 16 at home)
Between groups 1 4.02 4.02 2.58 Within groups 1114 1736.94 1.56
*p < 0.05 **p < 0.001
Statistical analysis with the same test on mean sections read when using/giving
an OTC product for the first time revealed no significant differences among
demographic subgroups except gender (Table 5.18). It appears women would read
slightly more information sections (4.0) than men (3.7).
75

Table 5.18 Information Sections on an OTC Product Package That Would be Read by Consumers When USING/GIVING a Product for the First Time by Demographic Parameters
Variable df SS MS F Gender
Between groups 1 19.66 9.83 5.36* Within groups 1107 2026.79 1.83 Education level
Between groups 4 16.60 3.32 1.80 Within groups 1104 2029.85 1.84
Household income level Between groups 3 5.63 1.41 0.76 Within groups 1105 2040.82 1.85
Age group Between groups 7 24.96 3.57 1.95 Within groups 1101 1993.12 1.83
Status as parent/guardian of children (under 16 at home)
Between groups 1 3.32 3.32 1.80 Within groups 1107 2043.13 1.85
*p < 0.05
For respondents who sometimes/always read information on the package, most of
them would read Directions for use when buying and using/giving an OTC product,
followed by the Symptoms it treats, Warnings, Possible side effects, and Active
ingredients (Table 5.19). Slightly more respondents would read each section (except
Directions for use) when they purchased an OTC medicine for the first time, compared
to first occasion of use/giving the product.
Only a few respondents selected Other aspects that would be read when buying
(n = 66) and using/giving (n = 47) an OTC product. These respondents indicated that
they would like to know Dosage (n = 19 when buying the product; n = 16 when using it),
Cost (n = 18 when buying the product; n = 3 when using it), Expiry date (n = 15 when
buying the product; n = 11 when using it), Age restriction (n = 8 when buying the
product; n = 7 when using it), Manufacturer (n = 3 when buying the product; n = 3 when
76

using it), and Non-medical ingredients (n = 3 when buying the product; n = 2 when
using it).
Table 5.19 Frequency of Each Information Section That Would be Read by Consumers When BUYING and USING/GIVING an OTC Product for the First Time
Information section
Buying Yes No
N (%) N (%)
Using/Giving Yes No
N (%) N (%)
Directions for use 1077 (96.5%) 39 (3.5%) 1085 (97.8%) 24 (2.2%)
The symptoms it treats 993 (87.0%) 123 (11.0%) 903 (81.4%) 206 (18.6%)
Active ingredients 605 (54.2%) 511 (45.8%) 542 (48.9%) 567 (51.1%)
Warnings 900 (80.6%) 216 (19.4%) 870 (78.4%) 239 (21.6%)
Possible side effects 856 (76.7%) 260 (23.3%) 833 (75.1%) 276 (24.9%)
Other 66 (5.9%) 1050 (94.1%) 47 (4.2%) 1062 (95.8%)
Physicians are a common source of OTC-related information. When asked about
this reference, a large number of respondents (n = 357; 29.7 percent) said they
occasionally asked a medical doctor for advice about OTC medicines, 298 respondents
sometimes asked, while 22.7 percent (n = 273) never asked for such advice (Table 5.20).
Table 5.20 Propensity to Ask a Medical Doctor for Advice on OTC Medicines
Frequency Number (N) Percent (%) Always 106 8.8 Usually 167 13.9 Sometimes 298 24.8 Occasionally 357 29.7 Never 273 22.7 Missing data 1 -
77
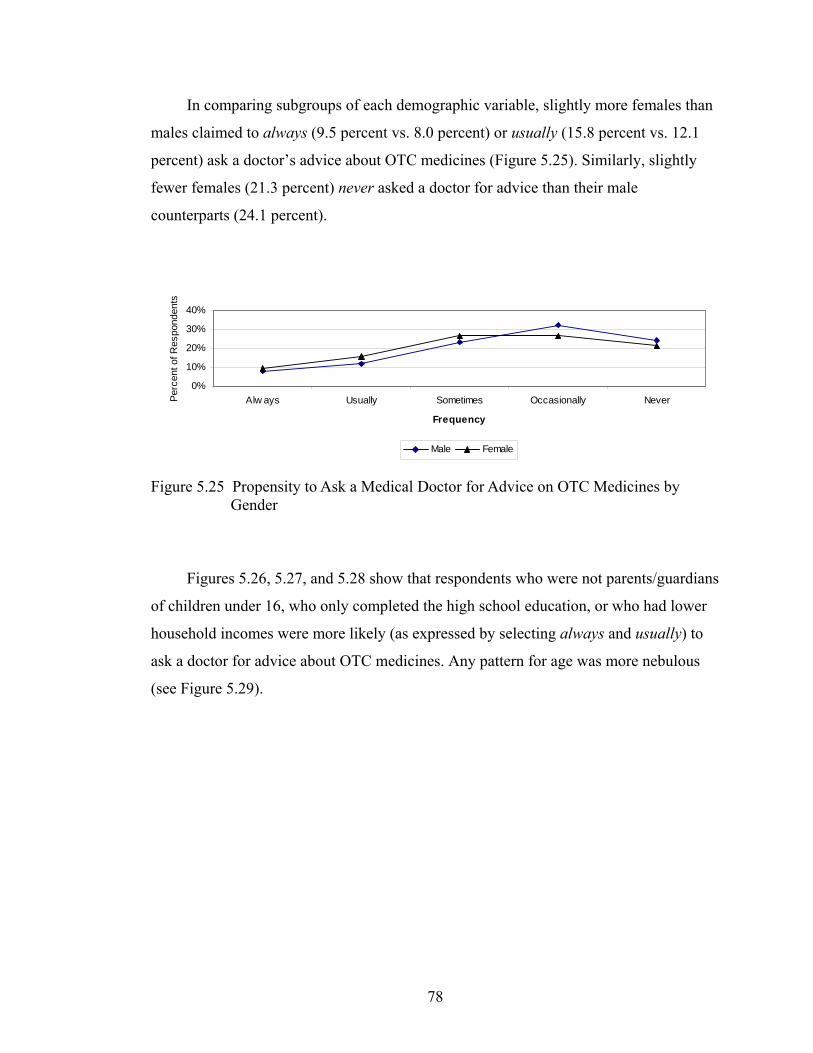
In comparing subgroups of each demographic variable, slightly more females than
males claimed to always (9.5 percent vs. 8.0 percent) or usually (15.8 percent vs. 12.1
percent) ask a doctor’s advice about OTC medicines (Figure 5.25). Similarly, slightly
fewer females (21.3 percent) never asked a doctor for advice than their male
counterparts (24.1 percent).
0%
10%
20%
30%
40%
Alw ays Usually Sometimes Occasionally Never
Frequency
Perc
ent o
f Res
pond
ents
Male Female
Figure 5.25 Propensity to Ask a Medical Doctor for Advice on OTC Medicines by Gender
Figures 5.26, 5.27, and 5.28 show that respondents who were not parents/guardians
of children under 16, who only completed the high school education, or who had lower
household incomes were more likely (as expressed by selecting always and usually) to
ask a doctor for advice about OTC medicines. Any pattern for age was more nebulous
(see Figure 5.29).
78

0%
10%
20%
30%
40%
Alw ays Usually Sometimes Occasionally Never
Frequency
Perc
ent o
f Res
pond
ents
A parent/guardian Not a parent/guardian
Figure 5.26 Propensity to Ask a Medical Doctor for Advice on OTC Medicines by Parent/Guardian Status
0%
10%
20%
30%
40%
Less than high schoolgraduate
High school graduate Trade/Technicalschool
SomeCollege/University
University/Collegegraduate
Education Level
Perc
ent o
f Res
pond
ents
Alw ays Usually Sometimes Occasionally Never
Figure 5.27 Propensity to Ask a Medical Doctor for Advice on OTC Medicines by Education Level
0%
10%
20%
30%
40%
Under $20,000 $20,000 to $39,999 $40,000 to $59,999 $60,000 and over
Household Income Lvel
Perc
ent o
f Res
pond
ents
Alw ays Usually Sometimes Occasionally Never
Figure 5.28 Propensity to Ask a Medical Doctor for Advice on OTC Medicines by Household Income
79

0%
10%
20%
30%
40%
18~24 yrs 25~34 yrs 35~44 yrs 45~54 yrs 55~64 yrs 65~74 yrs 75~84 yrs 85 yrs andover
Age group
Perc
ent o
f Res
pond
ents
Alw ays Usually Sometimes Occasionally Never
Figure 5.29 Propensity to Ask a Medical Doctor for Advice on OTC Medicines by Age
A second common source of information is that of a pharmacist, who commonly
finish in polls as the first or second choice for consumers (along with physicians). For
this survey, the majority of respondents (n = 1037; 86.5 percent) had received advice
from pharmacists regarding OTC medicines. However, nearly one tenth (n = 109; 9.1
percent) said they had never received such advice. Only a few respondents (n = 53; 4.4
percent) did not remember whether they had received advice about OTC medicines from
pharmacists (Table 5.21).
Table 5.21 Percentage of Consumers Who Had Received Advice from Pharmacists Regarding OTC Medicines
Claim of receiving advice from pharmacist
Number (N)
Percent (%)
Yes 1037 90.5 No 109 9.5
As shown in Figures 5.30, 5.31, 5.32 and 5.33, over 80 percent of respondents in
the demographic subgroups of gender, status as a parent/guardian of children under 16,
education level and household income had received advice about OTC medicines from
pharmacists. There were no apparent important differences among these subgroups.
80

However, as seen in Figures 5.34, a lower proportion of respondents in the age group of
18 to 24 years (67.6 percent) had received advice from pharmacists.
0%
20%
40%
60%
80%
100%
Male Female
Gender
Perc
ent o
f Res
pond
ents
Yes No
Figure 5.30 Consumer Receipt of Advice from Pharmacists on OTC Medicines by Gender
0%
20%
40%
60%
80%
100%
A parent/guardian Not a parent/guardian
Status
Perc
ent o
f Res
pond
ents
Yes No
Figure 5.31 Consumer Receipt of Advice from Pharmacists on OTC Medicines by Parent/Guardian Status
81

0%
20%
40%
60%
80%
100%
Less than highschool graduate
High schoolgraduate
Trade/Technicalschool
SomeCollege/University
University/Collegegraduate
Education Level
Perc
ent o
f Res
pond
ents
Yes No
Figure 5.32 Consumer Receipt of Advice from Pharmacists on OTC Medicines by Education Level
0%
20%
40%
60%
80%
100%
Under $20,000 $20,000 to $39,999 $40,000 to $59,999 $60,000 and over
Household Income Level
Perc
ent o
f Res
pond
ents
Yes No
Figure 5.33 Consumer Receipt of Advice from Pharmacists on OTC Medicines by Household Income
0%
20%
40%
60%
80%
100%
18~24 yrs 25~34 yrs 35~44 yrs 45~54 yrs 55~64 yrs 65~74 yrs 75~84 yrs 85 yrs andover
Age Group
Perc
ent o
f Res
pond
ents
Yes No
Figure 5.34 Consumer Receipt of Advice from Pharmacists on OTC Medicines by Age
82

Most respondents (n = 1086; 90.4 percent) would ask pharmacists for advice
when buying an OTC product for the first time: 281 respondents (23.4 percent) always
asked a pharmacist’s advice, while 288 (24.0 percent) usually would ask. Only one-tenth
of respondents (n = 114; 9.5 percent) indicated that they never ask for pharmacists’
advice on OTC medicines (Table 5.22).
Table 5.22 Propensity to Ask Pharmacists for Advice When Buying OTC Medicines for the First Time
Frequency Number (N) Percent (%) Always 281 23.4 Usually 288 24.0 Sometimes 339 28.3 Occasionally 178 14.8 Never 114 9.5 Missing data 2 -
If respondents did not always ask pharmacists for advice when they purchased
OTC products for the first time, they were then asked to indicate the two most important
reasons why they did not always do so. Accordingly, 281 respondents were not required
to answer this question. Another 121 respondents should have answered this section, but
did not. A total of 800 respondents did go on to address this issue, providing a total of
1223 selections. However, nearly half (n = 371; 46.3 percent) provided only one reason,
not two. Table 5.23 presents the frequency for each reason chosen. Of the choices
provided, 569 of the 800 respondents (71.1 percent) selected – I do not have difficulty in
selecting products – as the most frequent response. This was followed distantly by I
generally receive advice from a doctor (n = 198; 24.8 percent) and Pharmacists are too
busy to talk to me (n = 122; 15.3 percent). A lack of trust for pharmacists was not an
important reason for these consumers. Forty-four respondents (5.5 percent) indicated
reasons other than the ones provided. These reasons included: I get product information
83
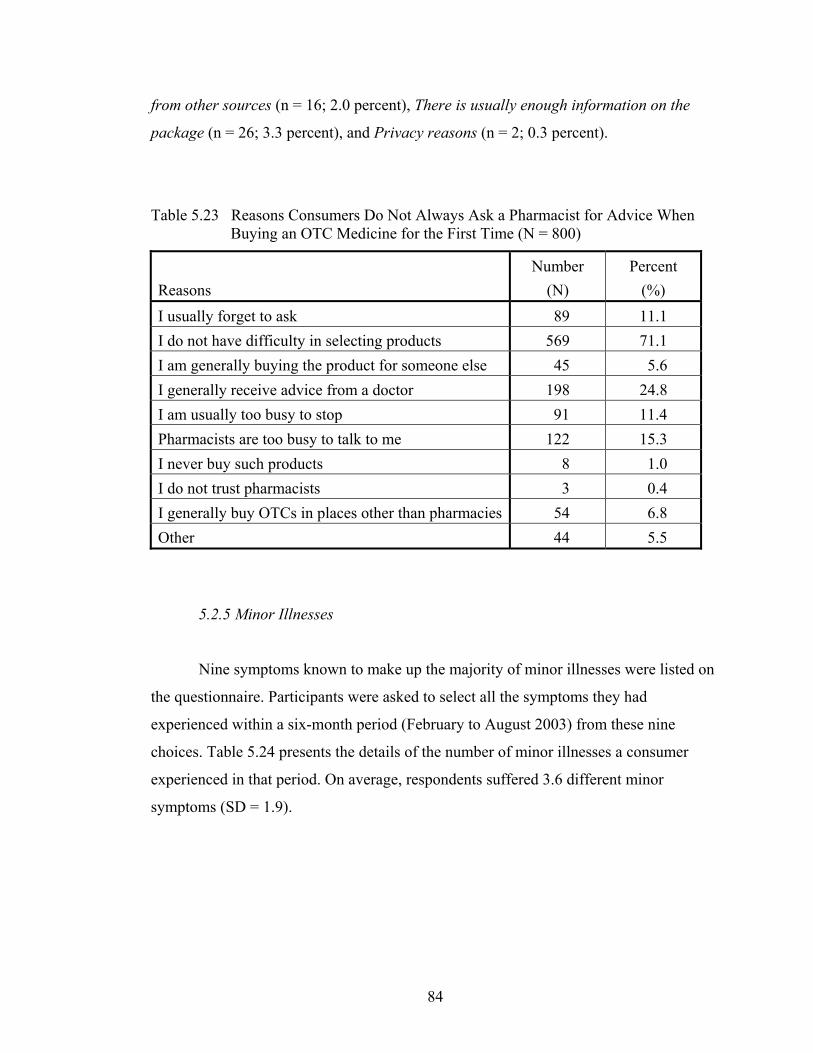
from other sources (n = 16; 2.0 percent), There is usually enough information on the
package (n = 26; 3.3 percent), and Privacy reasons (n = 2; 0.3 percent).
Table 5.23 Reasons Consumers Do Not Always Ask a Pharmacist for Advice When Buying an OTC Medicine for the First Time (N = 800)
Reasons
Number (N)
Percent (%)
I usually forget to ask 89 11.1 I do not have difficulty in selecting products 569 71.1 I am generally buying the product for someone else 45 5.6 I generally receive advice from a doctor 198 24.8 I am usually too busy to stop 91 11.4 Pharmacists are too busy to talk to me 122 15.3 I never buy such products 8 1.0 I do not trust pharmacists 3 0.4 I generally buy OTCs in places other than pharmacies 54 6.8 Other 44 5.5
5.2.5 Minor Illnesses
Nine symptoms known to make up the majority of minor illnesses were listed on
the questionnaire. Participants were asked to select all the symptoms they had
experienced within a six-month period (February to August 2003) from these nine
choices. Table 5.24 presents the details of the number of minor illnesses a consumer
experienced in that period. On average, respondents suffered 3.6 different minor
symptoms (SD = 1.9).
84

Table 5.24 Minor Symptoms Experienced by Respondents Within the Past Six Months
Numbers of minor symptoms Number (N) Percent (%) None 42 3.5 One 115 9.6 Two 203 16.9
Three 234 19.5 Four 231 19.2 Five 179 14.9 Six 100 8.3
Seven 61 5.1 Eight 27 2.2 Nine 10 0.8
With ANOVA analysis (Table 5.25), significant differences were seen between
gender, parent status, and among age groups. Females experienced slightly more minor
symptoms (mean = 3.9; SD = 1.9) than did males (mean = 3.4; SD = 1.9).
Parents/guardians suffered slightly more minor symptoms (mean = 4.0; SD = 1.86) than
those who without children under 16 at home did (mean = 3.5; SD = 1.92). Interestingly,
a trend (Figure 5.35) appeared to be in place where younger respondents suffered more
distinct symptoms than their older counterparts. Respondents in the age group of 18 to
24 years experienced the highest number of different minor symptoms – an average of
5.1 symptoms (SD = 1.8) – in that six-month period, followed by those in the age group
of 25 to 34 years (mean symptoms = 4.3; SD = 2.0), 35 to 44 years (mean = 3.9; SD =
1.9), 45 to 54 years (mean = 3.8; SD = 1.8), 55 to 64 years (mean = 3.5; SD = 1.9), 85
years and over (mean = 3.4; SD = 2.0), and 75 to 84 years (mean = 2.9; SD = 1.7).
Respondents 65 to 74 years suffered the fewest, with an average of 2.9 symptoms (SD =
1.9).
85
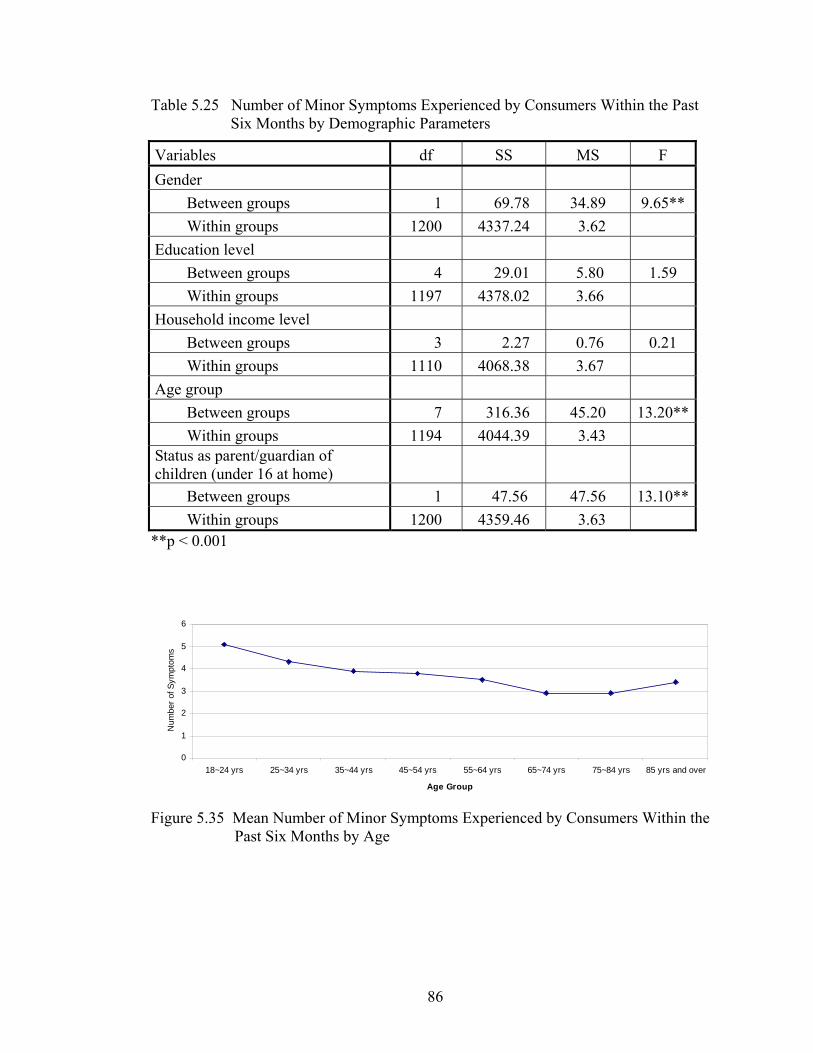
Table 5.25 Number of Minor Symptoms Experienced by Consumers Within the Past Six Months by Demographic Parameters
Variables df SS MS F Gender
Between groups 1 69.78 34.89 9.65** Within groups 1200 4337.24 3.62
Education level Between groups 4 29.01 5.80 1.59 Within groups 1197 4378.02 3.66
Household income level Between groups 3 2.27 0.76 0.21 Within groups 1110 4068.38 3.67
Age group Between groups 7 316.36 45.20 13.20** Within groups 1194 4044.39 3.43
Status as parent/guardian of children (under 16 at home)
Between groups 1 47.56 47.56 13.10** Within groups 1200 4359.46 3.63
**p < 0.001
0
1
2
3
4
5
6
18~24 yrs 25~34 yrs 35~44 yrs 45~54 yrs 55~64 yrs 65~74 yrs 75~84 yrs 85 yrs and over
Age Group
Num
ber o
f Sym
ptom
s
Figure 5.35 Mean Number of Minor Symptoms Experienced by Consumers Within the Past Six Months by Age
86

From February to August 2003, 96.5 percent of respondents (n = 1160/1202)
experienced at least one minor symptom. Of these 1160, 17.1 percent (n = 198) suffered
more than six different minor symptoms during those same six months. Figure 5.36
shows the frequency of each symptom consumers personally had experienced in this
period. Headache (n = 769; 64.0 percent) and muscle pain (n = 728; 60.6 percent) were
the two most common. Nearly half had experienced sore backs (n = 591; 49.2 percent).
As part of a potential seasonal influence, colds/flu were common (n = 553; 46.0 percent)
as were allergies of the nose/eyes (n = 418; 34.8 percent). Constipation was the least
common symptom; only 15.1 percent of respondents (n = 181) experienced this
symptom.
399
591
418366
377
181
769
553
728
0
200
400
600
800
1000
Cold/Flu Headaches Muscleaches
Dry skin Constipation Heartburn Sore back Allergies ofnose/eyes
Diff icultygetting to
sleep
Type of Minor Symptoms
Num
ber o
f Res
pond
ents
Figure 5.36 Frequency of Each Symptom Experienced by Respondents Within the Past Six Months
When comparing symptoms by gender (Figure 5.37), it was determined that more
women experienced headaches (71.0 percent vs 57.1 percent), dry skin (38.8 percent vs
27.6 percent), constipation (20.6 percent vs 9.6 percent), allergies of nose/eyes (37.6
percent vs 32 percent), and difficulty in getting to sleep (34.9 percent vs 26.3 percent)
than did men. In contrast, heartburn was the only symptom where more men than
women had experienced the symptom to any significant difference (34.3 percent vs 28.3
percent). For several symptom complexes, such as colds/flu (46.8 percent vs 45.1
percent), muscle aches (59.1 percent vs 62.0 percent), and sore back (48.9 percent vs
87

49.4 percent), similar proportions of males and females had suffered through them
during the past six months.
0%
20%
40%
60%
80%
Cold/Flu Headaches Muscleaches
Dry skin Constipation Heartburn Sore back Allergies ofthe
nose/eyes
Diff icultygetting to
sleep
Type of Minor Symptoms
Perc
ent o
f Res
pond
ents
Male Female
Figure 5.37 Percentage of Male and Female Respondents Who Experienced Each Symptom
Comparing nine symptoms by age groups, apparent trends were found for four
symptoms (headaches, dry skin, constipation, and difficulty getting to sleep). Figure
5.38 shows that the proportions of consumers who experienced headaches decreased as
age increased. For dry skin, more younger people (18 – 44 years old) suffered from it
more than did others. It was apparent that higher proportions of respondents in the oldest
age groups experienced constipation more often than other groups did. Twenty to thirty-
five percent of respondents in each age group had difficulty in sleeping, except those in
the oldest and youngest groupings. More than the half of respondents in these two
groups (52.8 percent and 53.6 percent, respectively) had sleeping problems.
88
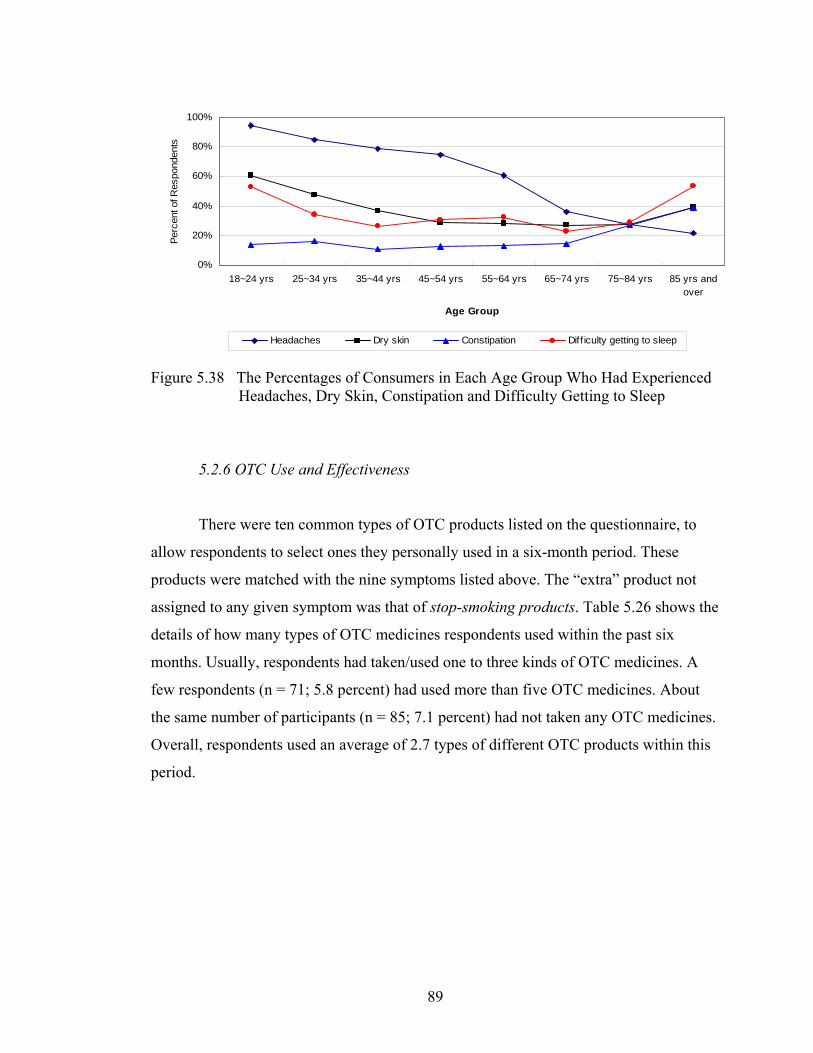
0%
20%
40%
60%
80%
100%
18~24 yrs 25~34 yrs 35~44 yrs 45~54 yrs 55~64 yrs 65~74 yrs 75~84 yrs 85 yrs andover
Age Group
Perc
ent o
f Res
pond
ents
Headaches Dry skin Constipation Diff iculty getting to sleep
Figure 5.38 The Percentages of Consumers in Each Age Group Who Had Experienced Headaches, Dry Skin, Constipation and Difficulty Getting to Sleep
5.2.6 OTC Use and Effectiveness
There were ten common types of OTC products listed on the questionnaire, to
allow respondents to select ones they personally used in a six-month period. These
products were matched with the nine symptoms listed above. The “extra” product not
assigned to any given symptom was that of stop-smoking products. Table 5.26 shows the
details of how many types of OTC medicines respondents used within the past six
months. Usually, respondents had taken/used one to three kinds of OTC medicines. A
few respondents (n = 71; 5.8 percent) had used more than five OTC medicines. About
the same number of participants (n = 85; 7.1 percent) had not taken any OTC medicines.
Overall, respondents used an average of 2.7 types of different OTC products within this
period.
89

Table 5.26 Number of Different Types of OTC Products Used Within the Past Six Months
Numbers of different products Number (N) Percent (%) None 85 7.1 One 211 17.6 Two 296 24.6
Three 263 21.9 Four 171 14.2 Five 105 8.7 Six 40 3.3
Seven 25 2.1 Eight 3 0.2 Nine 3 0.2 Ten 0 0.0
As shown in Table 5.27, pain relievers were the most popular product. They
(78.5 percent) were used at least twice as frequently as the next most commonly used
agents. Cold medicines ranked in second place (38.3 percent), followed by dry skin
products (30.7 percent) and upset stomach remedies (27.1 percent).
Table 5.27 Types of OTC Products Consumers Used Within the Past Six Months
Type of OTC medicines
Have used the medicine Yes No N (%) N (%)
Cold remedies 460 (38.3%) 742 (61.7%) Cough remedies 312 (26.0%) 890 (74.0%) Pain relievers 944 (78.5%) 258 (21.5%) Anti-histamines 314 (26.1%) 888 (73.9%) Sleeping aids 104 (8.7 %) 1098 (91.3%) Stop smoking products 58 (4.8%) 1144 (95.2%) Upset stomach remedies 326 (27.1%) 876 (72.9%) Laxatives 121 (10.1%) 1081 (89.9%) Dry skin products 369 (30.7%) 833 (69.3%) Sore muscle rubs 252 (21.0%) 950 (79.0%)
90

If participants indicated that they had used any medicines on the list within the
past six months, they were then asked their opinions on the effectiveness of that
medicine. The scale used to determine whether the agent worked for them ranged from 1
(strongly disagree) to 5 (strongly agree). For all types of OTC medicines presented,
mean effectiveness scores were above 3. Mean scores for several types were in fact
above 4, such as pain relievers (4.1), antihistamines (4.0), upset stomach remedies (4.0),
and laxatives (4.1). Over 80.0 percent of the users of these types of medicines (pain
relievers = 90.4 percent; antihistamines = 80.9 percent; upset stomach remedies = 84.7
percent; and laxatives = 88.4 percent) reported that they agreed or strongly agreed with
the statement -- I found that the medicine worked for me. Less support was evident for
sleeping aids and stop-smoking products. Further details are shown in Table 5.28.
91

M
ean
(SD
)
3.76
(0.7
)
3.70
(0.9
)
4.11
(0.7
)
4.00
(0.8
)
3.41
(1.1
)
3.11
(1.2
)
4.03
( 0.
7)
4.14
(0.7
)
3.89
(0.7
)
3.78
(0.8
)
Stro
ngly
A
gree
N
(%)
36 (7
.8)
32
(10.
3)
225
(23.
8)
70
(22.
3)
11 (1
0.6)
4 (6
.9)
69 (2
1.2)
33 (2
7.3)
55 (1
4.9)
34 (1
3.5)
A
gree
N
(%)
315
(68.
5)
196
(62.
8)
628
(66.
5)
184
(58.
6)
53 (5
1.0)
23 (3
9.7)
207
(63.
5)
74 (6
1.2)
239
(64.
8)
151
(59.
9)
U
nsur
e N
(%)
80 (1
7.4)
48 (1
5.4)
53 (5
.6)
44 (1
4.0)
17 (1
6.4)
13 (2
2.4)
37 (1
1.4)
9 (7
.5)
53 (1
4.4)
47 (1
8.7)
D
isag
ree
N (%
)
20 (4
.4)
24 (7
.7)
23 (2
.4)
8 (2
.6)
14 (1
3.5)
9 (1
5.5)
11 (3
.4)
2 (1
.7)
18 (4
.9)
15 (5
.9)
Stro
ngly
D
isag
ree
N (%
)
8 (1
.7)
10 (3
.2)
9 (1
.0)
3 (1
.0)
9 (8
.7)
8 (1
3.8)
0 (0
.0)
1 (0
.8)
2 (0
.5)
4 (1
.6)
Tabl
e 5.
28 P
erce
ived
Eff
ectiv
enes
s of E
ach
Type
of O
TC M
edic
ine
Ty
pe o
f Med
icin
e
Col
d re
med
ies
Cou
gh re
med
ies
Pain
relie
vers
Ant
i his
tam
ines
Slee
ping
aid
s
Stop
-sm
okin
g pr
oduc
ts
Ups
et st
omac
h re
med
ies
Laxa
tives
Dry
skin
pro
duct
s
Sore
mus
cle
rubs
Effe
ctiv
enes
s as m
easu
red
by st
atem
ent -
- “I f
ound
that
the
med
icin
e w
orke
d fo
r me.
” Sc
ale:
1 (S
trong
ly d
isag
ree)
to 5
(Stro
ngly
agr
ee).
92

5.2.7 Consumer Impressions of Care Needed When Using OTC Medicines
In this section, seven statements related to OTC medicines were included: four
were worded with a positive slant (statements 2, 5, 6, and 7), while three were
negatively-worded (statements 1, 3, and 4). Participants were asked to quantify their
opinions on each by using a scale from 1 (strongly disagree) to 5 (strongly agree).
Table 5.29 presents the frequency data and mean scores of public opinion for each item.
For statements 2, 5, and 6, a high percentage of respondents either agreed or strongly
agreed that: When taking an OTC medicine, I should be careful with it (95.0 percent);
Taking some prescription medicines with certain OTC medicines can cause problems
(87.7 percent); and It can be dangerous to take certain OTC medicines if I have other
medical conditions (88.7 percent). However, when asked about the statement --
Generally, I find prescription medicines to be more effective than OTC medicines -- only
about half of respondents (56.2 percent) agreed or strongly agreed, with nearly one-third
(31.4 percent) not being sure about their opinions.
Regarding statements with negative wording, 81.2 percent of respondents disagreed
or strongly disagreed with Statement 4 (OTC medicines are safe to take at higher than
recommended doses); less than 10.0 percent agreed or strongly agreed with it. About
half of participants disagreed or strongly disagreed with both of the following
statements: It is generally safe to take more than one OTC medicine at a time (45.9
percent) and OTC medicines rarely cause side effects (52.3 percent). Given the phrasing
of the items, this inversely indicated the need for a degree of care on the part of
medicine users. It should be noted that a sizeable percentage of respondents agreed or
strongly agreed with both these statements (29.0 percent and 21.8 percent, respectively).
93
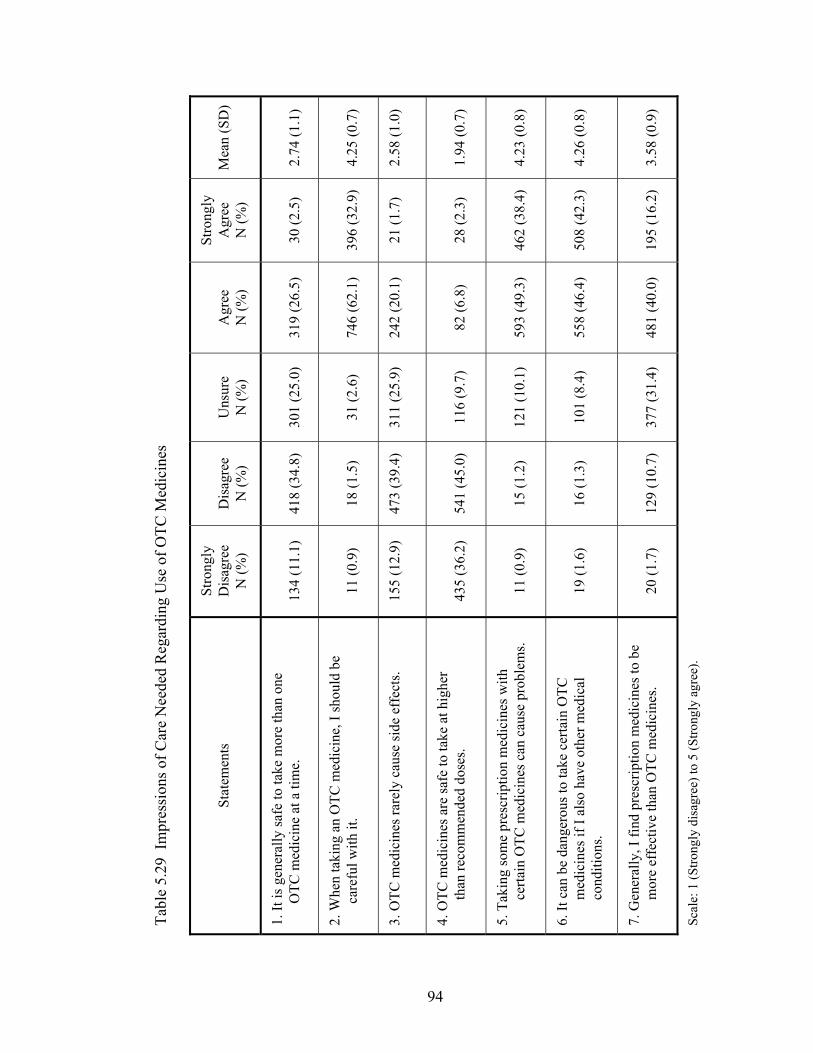
M
ean
(SD
)
2.
74 (1
.1)
4.
25 (0
.7)
2.58
(1.0
)
1.
94 (0
.7)
4.
23 (0
.8)
4.
26 (0
.8)
3.
58 (0
.9)
Stro
ngly
A
gree
N
(%)
30
(2.5
)
39
6 (3
2.9)
21 (1
.7)
28
(2.3
)
46
2 (3
8.4)
50
8 (4
2.3)
19
5 (1
6.2)
A
gree
N
(%)
31
9 (2
6.5)
74
6 (6
2.1)
242
(20.
1)
82
(6.8
)
59
3 (4
9.3)
55
8 (4
6.4)
48
1 (4
0.0)
U
nsur
e N
(%)
30
1 (2
5.0)
31
(2.6
)
311
(25.
9)
11
6 (9
.7)
12
1 (1
0.1)
10
1 (8
.4)
37
7 (3
1.4)
D
isag
ree
N (%
)
41
8 (3
4.8)
18
(1.5
)
473
(39.
4)
54
1 (4
5.0)
15
(1.2
)
16
(1.3
)
12
9 (1
0.7)
Stro
ngly
D
isag
ree
N (%
)
13
4 (1
1.1)
11
(0.9
)
155
(12.
9)
43
5 (3
6.2)
11
(0.9
)
19
(1.6
)
20
(1.7
)
Tabl
e 5.
29 I
mpr
essi
ons o
f Car
e N
eede
d R
egar
ding
Use
of O
TC M
edic
ines
St
atem
ents
1. It
is g
ener
ally
safe
to ta
ke m
ore
than
one
O
TC m
edic
ine
at a
tim
e.
2. W
hen
taki
ng a
n O
TC m
edic
ine,
I sh
ould
be
ca
refu
l with
it.
3. O
TC m
edic
ines
rare
ly c
ause
side
eff
ects
.
4. O
TC m
edic
ines
are
safe
to ta
ke a
t hig
her
than
reco
mm
ende
d do
ses.
5. T
akin
g so
me
pres
crip
tion
med
icin
es w
ith
cer
tain
OTC
med
icin
es c
an c
ause
pro
blem
s.
6. It
can
be
dang
erou
s to
take
cer
tain
OTC
m
edic
ines
if I
also
hav
e ot
her m
edic
al
con
ditio
ns.
7. G
ener
ally
, I fi
nd p
resc
riptio
n m
edic
ines
to b
e
mor
e ef
fect
ive
than
OTC
med
icin
es.
Scal
e: 1
(Stro
ngly
dis
agre
e) to
5 (S
trong
ly a
gree
).
94

Analysis of internal consistency for these seven statements produced a
Cronbach’s alpha of 0.5. Item correlation scores revealed that six statements (statements
1 to 6) had significant relationships with each other. However, statement 7 did not
correlate well with statements 1, 2, 3, and 4. Accordingly, when Statement 7 was
removed, the internal consistency of the remaining items improved (Cronbach’s alpha =
0.6).
To create an overall attitude score to reflect the care required during OTC
medicine usage, a sum score of all statements for each respondent was calculated.
Before assigning such scores, values obtained for statements 1, 3, and 4 were reversed,
while all scores for statement 7 were excluded. For this global attitude score, a minimum
of 6 (if a respondent chose “1” on the scale for all six items) and a maximum of 30 (if a
respondent chose “5” on the scale for all six items) was possible. Higher numbers
represent impressions of increasing care needed. Figure 5.39 shows the frequency of
each global score. The sum scores ranged from 13 to 30, with a mean sum score of 23.5
(SD = 3.1).
13 14 15 16 17 18 19 20 21 22 23 24 25 26 27 28 29 30Sum Score of Six Statements
0
50
100
150
200
Num
ber o
f Res
pond
ents
Figure 5.39 Frequency of Global Scores to Reflect Care Needed During OTC Medicine Use
95
For subsequent analysis, all respondents were separated into two groups on this
issue. Participants whose sum scores were ≥ 24 were arbitrarily called the group that felt
OTC medicine use had high care demands. That said, a score of 24 was the number
which constituted an average of 4 (agree item) for each of six items. Those whose sum
scores were ≤ 12 were (again arbitrarily) considered the group reflecting low care
demands. A score of 12 was the total of an average of 2 (disagree item) for each of 6
items. No respondents fell into the group arbitrarily called low care demands. Nearly
half of respondents (n = 594; 49.4 percent) had impressions that suggested OTC
medicines required some degree of care during their use.
5.2.8 Consumers’ Impressions of Pharmacists
Nine statements were created to determine public impressions of pharmacists,
including five positively-worded statements (items 1, 2, 5, 6, and 7) and four negatively-
worded statements (items 3, 4, 8, and 9). Participants were asked to select a number on a
scale [scale range of 1 (strongly disagree) to 5 (strongly agree)] that best described their
opinion for each statement. Table 5.30 presents the frequency and mean scores for the
responses obtained. Mean scores for each of the five positive statements were high.
Accordingly, most respondents agreed or strongly agreed that: pharmacists were
friendly (n = 1115; 92.8 percent); pharmacists had knowledge to deal with minor
symptoms (n = 1089; 90.6 percent); pharmacists seemed to care about health concerns
(n = 1052; 87.5 percent); and pharmacists usually spent as much time as necessary with
consumers (n = 1003; 83.4 percent). For items negatively-phrased, positive impressions
of pharmacists would manifest with disagreement with the statement. This was seen –
over 90 percent of respondents disagreed/strongly disagreed that: pharmacists were not
trustworthy (n = 1144; 95.2 percent); pharmacists lacked the necessary knowledge to
deal with helping people to select OTC products (n = 1087; 90.4 percent); and
pharmacists seemed unwilling to help (n = 1084; 90.2 percent). However, 15.9 percent
of respondents (n = 191) thought that pharmacists were too busy to help them. Quite a
high number of respondents (n = 163; 13.6 percent) were also not sure that pharmacists
encouraged safe and effective OTC medicine use.
96

M
ean
(SD
)
4.07
(0.7
)
3.96
(0.8
)
1.61
(0.7
)
1.78
(0.9
)
4.15
(0.6
)
4.06
(0.7
)
4.14
(0.6
)
1.78
(0.8
)
2.26
(1.0
)
Stro
ngly
A
gree
N
(%)
262
(21.
8)
242
(20.
1)
10 (0
.8)
16 (1
.3)
288
(24.
0)
292
(24.
3)
301
(25.
0)
17 (1
.4)
31 (2
.6)
A
gree
N
(%)
790
(65.
7)
761
(63.
3)
6 (0
.5)
49 (4
.1)
827
(68.
8)
724
(60.
2)
788
(65.
6)
25 (2
.1)
160
(13.
3)
U
nsur
e N
(%)
121
(10.
1)
111
(9.2
)
42 (3
.5)
53 (4
.4)
65 (5
.4)
163
(13.
6)
97 (8
.1)
73 (6
.1)
145
(12.
1)
D
isag
ree
N (%
)
25 (2
.1)
81 (6
.7)
594
(49.
4)
615
(51.
2)
18 (1
.5)
18 (1
.5)
9 (0
.7)
648
(53.
9)
621
(51.
7)
Stro
ngly
D
isag
ree
N (%
)
4 (0
.3)
7 (0
.6)
550
(45.
8)
469
(39.
0)
4 (0
.3)
5 (0
.4)
7 (0
.6)
439
(36.
5)
245
(20.
4)
Tabl
e 5.
30 C
onsu
mer
s’ Im
pres
sion
s of P
harm
acis
ts (N
= 1
202)
St
atem
ent
1. P
harm
acis
ts se
em to
car
e ab
out m
y he
alth
co
ncer
ns.
2. P
harm
acis
ts u
sual
ly sp
end
as m
uch
time
as
nece
ssar
y w
ith m
e.
3. P
harm
acis
ts a
re n
ot tr
ustw
orth
y.
4. P
harm
acis
ts se
em u
nwill
ing
to h
elp.
5. P
harm
acis
ts a
re fr
iend
ly.
6. P
harm
acis
ts e
ncou
rage
safe
and
eff
ectiv
e
O
TC m
edic
ine
use.
7. P
harm
acis
ts h
ave
the
know
ledg
e to
dea
l
w
ith m
y m
inor
sym
ptom
s.
8. P
harm
acis
ts la
ck th
e kn
owle
dge
nece
ssar
y
to
hel
p m
e se
lect
an
OTC
pro
duct
.
9. P
harm
acis
ts a
re o
ften
too
busy
to h
elp
me.
Scal
e: 1
(Stro
ngly
dis
agre
e) to
5 (S
trong
ly a
gree
).
97

Analysis of internal consistency for the nine statements revealed a Cronbach’s
alpha of 0.8.
For a general impression of pharmacists as viewed by the public, a sum score of
all statements (for each respondent) was calculated. Before doing so, the scores for the
negatively-worded items (statements 3, 4, 8, and 9) were reversed. The frequency of
each sum score is shown in Figure 5.40. A minimum score of 9 (selecting “1” for all
nine items) and a maximum score of 45 (selecting “5” for all nine items) was possible
for this battery of items. The sum scores ranged from 18 to 45, with the mean sum score
being 37.0 (SD = 4.2).
18 22 23 24 25 26 27 28 29 30 31 32 33 34 35 36 37 38 39 40 41 42 43 44 45Sum Score of Nine Statements
0
50
100
150
200
250
Num
ber o
f Res
pond
ents
Figure 5.40 Frequency of Each Sum Score for the Impression of Pharmacists
For subsequent analysis, all respondents were separated into two groups on this
issue. Participants whose sum scores were ≥ 36 were arbitrarily called the group that had
a positive impression of pharmacists. A score of 36 was in fact the number which would
be attained if an average of 4 (agree item) was selected for each of 9 items. Those whose
sum scores were ≤ 18 were placed in the group with a so-called negative impression of
pharmacists. Similarly to the process just described, a score of 18 was the total of an
98

average of 2 (disagree item) for each of 9 items. The majority of respondents (n = 821;
68.3%) had very positive impressions of pharmacists; only one person (0.1%) held the
opposite impression.
5.2.9 Consumer Expectations of OTC Medicines According to Location of Sale
The main section of the questionnaire was designed to differentiate product
attributes according to location of sale (if any in fact exist). Specifically we were
interested in whether the public considers OTC products differently across various
criteria. Respondents were asked to provide their opinions for each of ten product-
specific expectations relative to OTC medicines, based on where that product could be
purchased – in a convenience store or a pharmacy. In other words, for such medicines in
general, does the public expect those found in pharmacies to be more effective, for
example, than their counterparts in convenience stores? Tables 5.31 and 5.32 present
frequency data for each of ten expectations for products purchased at either of the
locations.
Regarding expectations of product attributes for OTC medicines sold from a
convenience store, a majority of respondents expected (defined as selecting somewhat
agree or higher) that such medicines should be safe (83.5 percent), effective (76.2
percent), to come with a lot of information on the package (88.6 percent), and should
have very few side effects when used (65.3 percent). Slightly over half of respondents
(58.1 percent) thought that OTC medicines sold in convenience stores should be less
effective than prescription medicines, but still should be of good quality. The potency of
medicine was an attribute where expectations were less demanding – 54.2 percent of
respondents disagreed that OTC medicines should be potent when sold in convenience
stores. Slightly over 40 percent (40.6) of respondents expected to purchase OTC
medicines with low prices in convenience stores. Only 11.4 percent expected to find a
good selection of products in convenience stores, nor did they expect to have access to
professional help (14.9 percent).
On the other hand, regarding expectations of product attributes for OTC items
sold from a pharmacy, approximately 90.0 percent of respondents expected (defined as
99

selecting somewhat agree or higher) that such medicines should be safe (92.1 percent),
effective (89.0 percent), and to come with a lot of information on the packages (93.8
percent). As well, they felt pharmacies should stock medicines of good quality (97.6
percent). They also expected pharmacies to provide professional help (96.0 percent) and
to carry a variety of OTC products (98.2 percent). Approximately three quarters (71.8
percent) of respondents believed that pharmacies could offer low prices on OTC
medicines. A lower percentage of respondents (68.8 percent) expected that OTC
medicines should have very few side effects. When asked about the potency of OTC
products, only 56.0 percent of respondents somewhat to strongly agreed that such
medicines should be potent; 27.1 percent selected the neutral option on the scale for this
item. Just over half of respondents thought OTC medicines sold in pharmacies should be
less effective than prescription medicines.
100
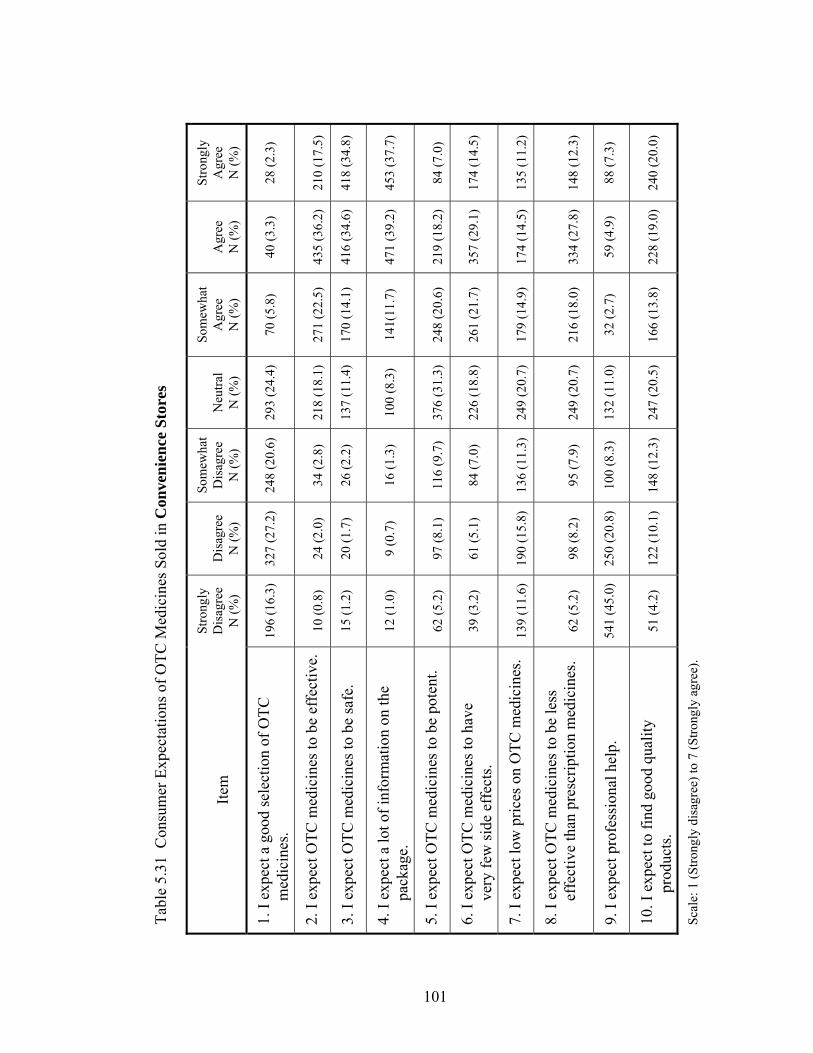
Stro
ngly
A
gree
N
(%)
28 (2
.3)
210
(17.
5)
418
(34.
8)
453
(37.
7)
84 (7
.0)
174
(14.
5)
135
(11.
2)
148
(12.
3)
88 (7
.3)
240
(20.
0)
A
gree
N
(%)
40 (3
.3)
435
(36.
2)
416
(34.
6)
471
(39.
2)
219
(18.
2)
357
(29.
1)
174
(14.
5)
334
(27.
8)
59 (4
.9)
228
(19.
0)
Som
ewha
t A
gree
N
(%)
70 (5
.8)
271
(22.
5)
170
(14.
1)
141(
11.7
)
248
(20.
6)
261
(21.
7)
179
(14.
9)
216
(18.
0)
32 (2
.7)
166
(13.
8)
N
eutra
l N
(%)
293
(24.
4)
218
(18.
1)
137
(11.
4)
100
(8.3
)
376
(31.
3)
226
(18.
8)
249
(20.
7)
249
(20.
7)
132
(11.
0)
247
(20.
5)
Som
ewha
t D
isag
ree
N
(%)
248
(20.
6)
34 (2
.8)
26 (2
.2)
16 (1
.3)
116
(9.7
)
84 (7
.0)
136
(11.
3)
95 (7
.9)
100
(8.3
)
148
(12.
3)
D
isag
ree
N
(%)
327
(27.
2)
24 (2
.0)
20 (1
.7)
9 (0
.7)
97 (8
.1)
61 (5
.1)
190
(15.
8)
98 (8
.2)
250
(20.
8)
122
(10.
1)
Stro
ngly
D
isag
ree
N
(%)
196
(16.
3)
10 (0
.8)
15 (1
.2)
12 (1
.0)
62 (5
.2)
39 (3
.2)
139
(11.
6)
62 (5
.2)
541
(45.
0)
51 (4
.2)
Tab
le 5
.31
Con
sum
er E
xpec
tatio
ns o
f OTC
Med
icin
es S
old
in C
onve
nien
ce S
tore
s
Ite
m
1. I
expe
ct a
goo
d se
lect
ion
of O
TC
m
edic
ines
.
2. I
expe
ct O
TC m
edic
ines
to b
e ef
fect
ive.
3. I
expe
ct O
TC m
edic
ines
to b
e sa
fe.
4. I
expe
ct a
lot o
f inf
orm
atio
n on
the
pa
ckag
e.
5. I
expe
ct O
TC m
edic
ines
to b
e po
tent
.
6. I
expe
ct O
TC m
edic
ines
to h
ave
ve
ry fe
w si
de e
ffec
ts.
7. I
expe
ct lo
w p
rices
on
OTC
med
icin
es.
8. I
expe
ct O
TC m
edic
ines
to b
e le
ss
effe
ctiv
e th
an p
resc
riptio
n m
edic
ines
.
9. I
expe
ct p
rofe
ssio
nal h
elp.
10. I
exp
ect t
o fin
d go
od q
ualit
y
p
rodu
cts.
Scal
e: 1
(Stro
ngly
dis
agre
e) to
7 (S
trong
ly a
gree
).
101

Stro
ngly
A
gree
N
(%)
767
(63.
8)
310
(25.
8)
519
(43.
2)
516
(42.
9)
137
(11.
4)
202
(16.
8)
217
(18.
1)
172
(14.
3)
676
(56.
2)
673
(56.
0)
A
gree
N
(%)
384
(31.
9)
521
(43.
3)
442
(36.
8)
489
(40.
7)
278
(23.
1)
352
(29.
3)
336
(28.
0)
352
(29.
3)
407
(33.
9)
426
(35.
4)
Som
ewha
t A
gree
N
(%)
30 (2
.5)
239
(19.
9)
145
(12.
1)
123
(10.
2)
259
(21.
5)
273
(22.
7)
309
(25.
7)
227
(18.
9)
71 (5
.9)
75 (6
.2)
N
eutra
l N
(%)
20 (
1.7)
123
(10.
2)
70 (5
.8)
59 (4
.9)
326
(27.
1)
206
(17.
1)
247
(20.
5)
210
(17.
5)
36 (3
.0)
23 (1
.9)
Som
ewha
t D
isag
ree
N
(%)
0 (0
.0)
6 (0
.6)
12 (1
.0)
5 (0
.4)
84 (7
.0)
81 (6
.7)
54 (4
.5)
82 (6
.8)
6 (0
.5)
3 (0
.2)
D
isag
ree
N
(%)
1 (0
.1)
2 (0
.2)
7 (0
.6)
5 (0
.4)
71 (5
.9)
61 (5
.1)
23 (1
.9)
103
(8.6
)
2 (0
.2)
1 (0
.1)
Stro
ngly
D
isag
ree
N
(%)
0 (0
.0)
1 (0
.1)
7 (0
.6)
5 (0
.4)
47 (3
.9)
27 (2
.2)
16 (1
.3)
56 (4
.7)
4 (0
.3)
1 (0
.1)
Tabl
e 5.
32 C
onsu
mer
Exp
ecta
tions
of O
TC M
edic
ines
Sol
d in
Pha
rmac
ies
Ite
ms
1. I
expe
ct a
goo
d se
lect
ion
of O
TC
m
edic
ines
.
2. I
expe
ct O
TC m
edic
ines
to b
e ef
fect
ive.
3. I
expe
ct O
TC m
edic
ines
to b
e sa
fe.
4. I
expe
ct a
lot o
f inf
orm
atio
n on
the
pa
ckag
e.
5. I
expe
ct O
TC m
edic
ines
to b
e po
tent
.
6. I
expe
ct O
TC m
edic
ines
to h
ave
ve
ry fe
w si
de e
ffec
ts.
7. I
expe
ct lo
w p
rices
on
OTC
med
icin
es.
8. I
expe
ct O
TC m
edic
ines
to b
e le
ss
effe
ctiv
e th
an p
resc
riptio
n m
edic
ines
.
9. I
expe
ct p
rofe
ssio
nal h
elp.
10. I
exp
ect t
o fin
d go
od q
ualit
y pr
oduc
ts.
Scal
e: 1
(Stro
ngly
dis
agre
e) to
7 (S
trong
ly a
gree
).
102

In Canada, OTC medicines can (to varying degrees) be sold from various retail
outlets. Based on location of sale, consumers may have grown to have different
expectations for the products at each. When comparing respondents’ expectations for
OTC medicines as sold in two different locations (convenience stores versus
pharmacies), the Wilcoxon Signed Ranks Test was employed because the distribution of
each expectation was skewed. Statistically significant differences existed for each of ten
expectations across the two locations (Table 5.33).
The null hypotheses of this study were as follows:
1) There is no difference in public expectations of OTC medicine potency in
relation to place of sale (pharmacy vs. convenience store);
2) There is no difference in public expectations of OTC medicine safety in
relation to place of sale (pharmacy vs. convenience store);
3) There is no difference in public expectations of OTC medicine side effects in
relation to place of sale (pharmacy vs. convenience store);
4) There is no difference in public expectations of OTC medicine effectiveness in
relation to place of sale (pharmacy vs. convenience store);
5) There is no difference in public expectations for information appearing on
OTC medicine packaging in relation to place of sale (pharmacy vs.
convenience store).
Therefore, according to the results shown in Table 5.33, these five hypotheses were all
rejected. However, expectation differences for OTC product potency, safety,
effectiveness, potential for side effects, and package information may not have reached
practical importance.
103

Table 5.33 Difference in Public Expectations of OTC Medicines Between Two Locations: Convenience Stores versus Pharmacies
Item
Convenience
store Mean (SD)
Pharmacy
Mean (SD)
Difference a
in
Mean
Z score b
1. I expect a good selection of OTC medicines. 3.0 (1.44) 6.6 (0.64) - 3.6 - 29.34**
2. I expect OTC medicines to be effective. 5.4 (1.24) 5.8 (0.96) - 0.4 - 14.67**
3. I expect OTC medicines to be safe. 5.8 (1.29) 6.1 (1.05) - 0.3 - 11.82**
4. I expect a lot of information on the packages.
6.0 (1.15) 6.2 (0.95) - 0.2 - 8.51**
5. I expect OTC medicines to be potent. 4.4 (1.52) 4.7 (1.52) - 0.3 - 11.42**
6. I expect OTC medicines to have very few side effects.
5.0 (1.52) 5.1 (1.49) - 0.1 - 5.10**
7. I expect low prices on OTC medicines. 4.0 (1.88) 5.2 (1.31) - 1.2 - 19.15**
8. I expect OTC medicines to be less effective than prescription medicines.
4.7 (1.66) 4.8 (1.67) - 0.1 - 5.40**
9. I expect professional help. 2.5 (1.89) 6.4 (0.86) - 3.9 - 27.93**
10. I expect to find good quality products. 4.7 (1.78) 6.4 (0.75) - 1.7 - 23.77**
**p < 0.001 Scale: 1 (strongly disagree) to 7 (strongly agree) a Mean score of Convenience Stores minus Mean score of Pharmacies b Wilcoxon Signed Ranks Test
104
Further analyses were made in order to examine variables that might influence
consumer expectations. To do this, the mean differences for the ten attributes as they
apply to products both in pharmacies and convenience stores were calculated. Mann-
Whitney and Kruskal-Wallis Test were then employed to compare subgroups for several
variables. The variables chosen for comparison were consumer awareness of product
availability, previous purchase experience, previous product use, side effect history, and
demographic characteristics (eg. gender, age group, education level, and household
income level).
Of all subjects surveyed, some were unaware that OTCs could be purchased in
convenience stores. This awareness (or lack thereof) of product availability in
convenience stores may have relevance to consumer behaviour. In other words, these
consumers may expect agents at those locations to be much weaker or far safer than their
pharmacy counterparts. To assess this, respondents were grouped as either aware (YES
group) or not aware (NO group) that OTC medicines could be purchased from
convenience stores. The two groups had significantly different expectations (Table 5.34).
The differences across all ten expectations were small, however, ranging from 0.09 to
0.57. It should be noted that the mean of difference column, the value reflects a
calculation of the attribute score expected of pharmacies (along the seven-point scale)
minus the score for the same attribute expected in convenience stores. This approach
was taken for all 10 attributes in both the YES and NO columns. Larger values, therefore,
reflect greater expectations for pharmacy-based products over convenience stores. Using
the first attribute (ie, I expect a good selection) as an example, the YES group (at 3.66)
appear to expect more out of pharmacy-based products than the NO group (at 3.48).
Consumers had different history with respect to purchasing OTC medicines from
convenience stores; some had done so while others had not. With these two groups
separated as the point of interest, significant differences were found for five attributes,
namely product effectiveness, safety, package information, potentials of side effects, and
professional help (Table 5.35). There were no significant differences on the other five
items. The differences across the ten attributes ranged from 0.03 to 0.28.
105
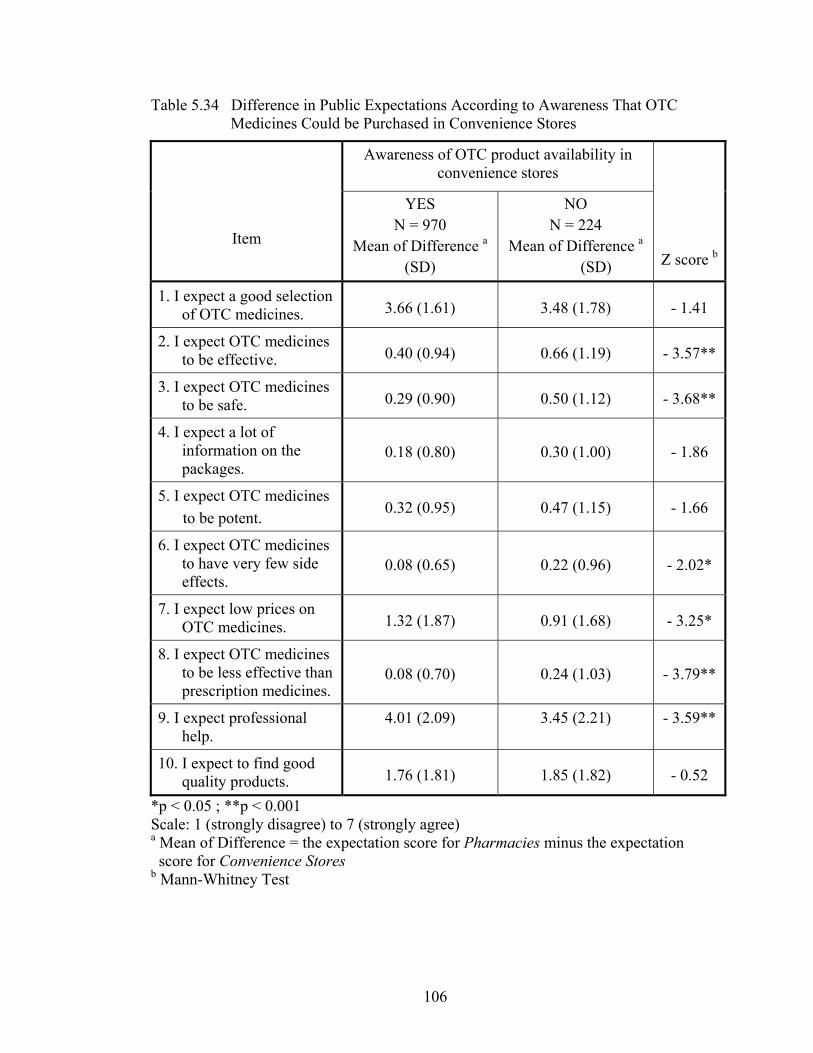
Table 5.34 Difference in Public Expectations According to Awareness That OTC Medicines Could be Purchased in Convenience Stores
Awareness of OTC product availability in convenience stores
Item
YES N = 970
Mean of Difference a
(SD)
NO N = 224
Mean of Difference a
(SD)
Z score b
1. I expect a good selection of OTC medicines. 3.66 (1.61) 3.48 (1.78) - 1.41
2. I expect OTC medicines to be effective. 0.40 (0.94) 0.66 (1.19) - 3.57**
3. I expect OTC medicines to be safe. 0.29 (0.90) 0.50 (1.12) - 3.68**
4. I expect a lot of information on the packages.
0.18 (0.80) 0.30 (1.00) - 1.86
5. I expect OTC medicinesto be potent. 0.32 (0.95) 0.47 (1.15) - 1.66
6. I expect OTC medicines to have very few side effects.
0.08 (0.65) 0.22 (0.96) - 2.02*
7. I expect low prices on OTC medicines. 1.32 (1.87) 0.91 (1.68) - 3.25*
8. I expect OTC medicines to be less effective than prescription medicines.
0.08 (0.70) 0.24 (1.03) - 3.79**
9. I expect professional help.
4.01 (2.09) 3.45 (2.21) - 3.59**
10. I expect to find good quality products. 1.76 (1.81) 1.85 (1.82) - 0.52
*p < 0.05 ; **p < 0.001 Scale: 1 (strongly disagree) to 7 (strongly agree) a Mean of Difference = the expectation score for Pharmacies minus the expectation score for Convenience Stores
b Mann-Whitney Test
106

Table 5.35 Difference in Public Expectations According to Consumer Experience with Purchasing OTCs from a Convenience Store
Consumer Had Purchased OTCs from a Convenience Store
Item
YES N = 507
Mean of Difference a
(SD)
NO N = 632
Mean of Difference a
(SD)
Z score b
1. I expect a good selection of OTC medicines. 3.59 (1.57) 3.63 (1.69) - 0.45
2. I expect OTC medicines to be effective. 0.30 (0.75) 0.58 (1.15) - 3.59**
3. I expect OTC medicines to be safe. 0.22 (0.73) 0.42 (1.09) - 2.57*
4. I expect a lot of information on the packages.
0.12 (0.62) 0.27 (0.96) - 2.0*
5. I expect OTC medicines to be potent. 0.28 (0.87) 0.40 (1.09) - 1.88
6. I expect OTC medicines to have very few side effects.
0.05 (0.61) 0.13 (0.78) - 2.03*
7. I expect low prices on OTC medicines. 1.31 (1.88) 1.16 (1.83) - 1.24
8. I expect OTC medicines to be less effective than prescription medicines.
0.09 (0.61) 0.15 (0.90) - 1.45
9. I expect professional help. 4.05 (2.04) 3.75 (2.17) - 2.30*
10. I expect to find good quality products. 1.80 (1.77) 1.77 (1.85) - 0.61
*p < 0.05 ; **p < 0.001 Scale: 1 (strongly disagree) to 7 (strongly agree) a Mean of Difference = the expectation score for Pharmacies minus the expectation score for Convenience Stores
b Mann-Whitney Test
107

The average number of OTC purchases made from convenience stores within a
six month period was 1.04. Differences in expectations for convenience store products
were examined for participants who purchased OTC products less than two times per six
months from convenience stores and for those who made two or more purchases in the
same time period (Table 5.36). There were no statistically significant differences for
each of the five clinical attributes. Conversely, high frequency OTC buyers from
convenience stores had higher expectations to have a good selection of OTC products
(mean = 3.45) and to get professional help (mean = 2.77) in these locations than did low
frequency buyers (means of 2.88 and 2.17, respectively).
For the next analysis, respondents purchasing OTC medicines from pharmacies
more than four times per six month period were separated from those buying such
products four times or fewer. Table 5.37 reveals that the more frequent buyers in
pharmacies expected more in finding good quality products (mean = 6.55) and in
obtaining professional help (mean = 6.53) in pharmacies than less frequent buyers (mean
of 6.40 and 6.34, respectively). For expectations of the more clinical attributes, there
were also no obvious differences between low and high frequency buyers.
As an extension of the above analysis, results presented earlier indicated that the
average number of different OTC medicines taken within the past 30 days was 1.6.
Therefore, respondents were arbitrarily divided into those who used more than two
different OTC products within this time period and those who used two or fewer
different medicines. Table 5.38 shows that statistically significant difference in these
two groups was found for expectations about low prices. More frequent OTC users
expected a lower price of an OTC product in pharmacies (mean difference = 1.56) than
less frequent OTC users (mean difference = 1.19). For another items, there were no
statistically significant differences between low and high frequency users.
108

Table 5.36 Difference in Public Expectations for OTCs available in Convenience Stores According to Frequency of Purchases Made from Convenience Stores
Item
Expectation Score for Consumers who
Made < 2 Purchases N = 356
Mean (SD)
Expectation Score for Consumers who
Made ≥ 2 Purchases N = 118
Mean (SD)
Z score a
1. I expect a good selection of OTC medicines.
2.88 (1.33)
3.45 (1.59)
-3.34*
2. I expect OTC medicines to be effective.
5.54 (1.08)
5.48 (1.04)
-0.66
3. I expect OTC medicines to be safe.
5.89 (1.16)
5.81 (1.15)
-0.83
4. I expect a lot of information on the packages.
6.01 (1.01)
5.97 (1.04)
-0.35
5. I expect OTC medicines to be potent.
4.43 (1.52)
4.62 (1.48)
-0.95
6. I expect OTC medicines to have very few side effects.
5.08 (1.46)
4.93 (1.51)
-1.03
7. I expect low prices on OTC medicines.
3.85 (1.84)
4.11 (2.02)
-1.26
8. I expect OTC medicines to be less effective than prescription medicines.
4.57 (1.65)
5.00 (1.62)
-2.59*
9. I expect professional help.
2.17 (1.63)
2.77 (2.01)
-2.79*
10. I expect to find good quality products.
4.64 (1.75)
4.75 (1.70)
-0.61
*p < 0.05 Scale: 1 (strongly disagree) to 7 (strongly agree) a Mann-Whitney Test
109

Table 5.37 Difference in Public Expectations for OTCs available in Pharmacies According to Frequency of Purchases Made from Pharmacies
Item
Expectation Scores for Consumers who
Made < 4 OTC Purchases N = 670
Mean (SD)
Expectation Scores for Consumers who
Made > 4 OTC Purchases N = 329
Mean (SD)
Z score a
1. I expect a good selection of OTC medicines.
6.55 (0.65)
6.67 (0.53)
-2.50
2. I expect OTC medicines to be effective.
5.82 (0.94)
5.92 (0.96)
-1.86
3. I expect OTC medicines to be safe.
6.09 (1.05)
6.15 (1.07)
-1.32
4. I expect a lot of information on the packages.
6.16 (0.92)
6.21 (1.02)
-1.70
5. I expect OTC medicines to be potent.
4.68 (1.49)
4.72 (1.56)
-0.69
6. I expect OTC medicines to have very few side effects.
5.11 (1.44)
4.97 (1.56)
-1.03
7. I expect low prices on OTC medicines.
5.19 (1.30)
5.27 (1.22)
-0.72
8. I expect OTC medicines to be less effective than prescription medicines.
4.82 (1.67)
4.82 (1.63)
-0.15
9. I expect professional help.
6.34 (0.94)
6.53 (0.69)
-2.97*
10. I expect to find good quality products.
6.40 (0.78)
6.55 (0.67)
-3.17*
*p < 0.05 Scale: 1 (strongly disagree) to 7 (strongly agree) a Mann-Whitney Test
110

Table 5.38 Difference in Public Expectations According to Frequency in Taking OTC Medicines
Item
Consumers who Took OTC Medicines ≤ 2
Times N = 980
Mean of Difference a (SD)
Consumers who Took OTC Medicines > 2
Times N = 188
Mean of Difference a (SD)
Z score b
1. I expect a good selection of OTC medicines. 3.60 (1.66) 3.88 (1.45) -1.87
2. I expect OTC medicines to be effective. 0.42 (0.97) 0.53 (1.09) -1.12
3. I expect OTC medicines to be safe. 0.31 (0.93) 0.35 (0.99) -0.29
4. I expect a lot of information on the packages.
0.20 (0.81) 0.21 (0.89) -0.53
5. I expect OTC medicines to be potent. 0.34 (0.99) 0.39 (1.01) -0.70
6. I expect OTC medicines to have very few side effects.
0.09 (0.69) 0.13 (0.76) -0.17
7. I expect low prices on OTC medicines. 1.19 (1.84) 1.56 (1.87) -2.70*
8. I expect OTC medicines to be less effective than prescription medicines.
0.11 (0.75) 0.11 (0.68) -0.69
9. I expect professional help. 3.91 (2.12) 4.11 (2.06) -1.31
10. I expect to find good quality products. 1.81 (1.81) 1.75 (1.81) -0.52
*p < 0.05 Scale: 1 (strongly disagree) to 7 (strongly agree) a Mean of Difference = the expectation score for Pharmacies minus the expectation score for Convenience Stores b Mann-Whitney Test
111

Experiencing an undesirable effect when taking any medicine may change how a
person feels about that agent, or even the prescriber of that medicine. If the product was
self-selected, as is often the case with OTC medicines, any change in impressions would
likely be limited to just the agent. When analyzing product expectations in relation to
side effect history, respondents were grouped according to those who had suffered a
self-described side effect from an OTC medicine and those who had not had such an
experience. Those who had suffered with side effects from taking OTC medicines did
not have significantly different expectations on product safety, efficacy, potency, and
potential for side effects in relation to where products were sold (Table 5.39). However,
the two groups did have significantly different expectations for product package
information and professional help if OTC medicines were sold either from pharmacies
and convenience stores. Using the expectation for professional help as an example, those
who had experienced a side effect expected more professional help in comparison to
convenience stores (resulting in a mean difference of 4.27 between the two locations),
while those who hadn’t experienced one showed less separation between pharmacies and
convenience stores (3.86). In other words, the side effect history may have created
higher expectations for pharmacies because these consumers wanted professional help.
Regarding gender, a significantly different expectation was revealed in the area
of package information (Table 5.40). When considering the OTC products sold in either
location, men had lower expectations for package information in relation to retail outlet
(pharmacy mean of 6.04 minus the convenience store mean of 5.91 = 0.13) than did
women (pharmacy mean of 6.32 minus the convenience store mean of 6.03 = 0.29).
Women, therefore, reported a slightly greater discrepancy in what they expected from
either location on this attribute. Two other values (of a merchandising nature) were
significant, while differences according to gender were not seen for clinical attributes
(efficacy, safety, potency, and potential for side effects).
112

Table 5.39 Difference in Public Expectations According to Consumer Side Effect Experience from OTC Use
Consumer Had Experienced a Side Effect
Item
YES N = 234
Mean of Difference a
(SD)
NO N = 874
Mean of Difference a
(SD)
Z score b
1. I expect a good selection of OTC medicines. 3.95 (1.63) 3.52 (1.64) -3.86**
2. I expect OTC medicines to be effective. 0.34 (0.84) 0.47 (1.02) -1.49
3. I expect OTC medicines to be safe. 0.24 (0.71) 0.35 (0.97) -1.47
4. I expect a lot of information on the packages.
0.10 (0.61) 0.23 (0.88) -2.05*
5. I expect OTC medicines to be potent. 0.37 (0.96) 0.34 (1.01) -0.63
6. I expect OTC medicines to have very few side effects.
0.04 (0.56) 0.12 (0.77) -1.17
7. I expect low prices on OTC medicines. 1.48 (1.81) 1.19 (1.87) -2.12*
8. I expect OTC medicines to be less effective than prescription medicines.
0.05 (0.68) 0.12 (0.79) -1.89
9. I expect professional help. 4.27 (2.11) 3.86 (2.10) -3.20*
10. I expect to find good quality products. 1.77 (1.83) 1.76 (1.80) -0.46
*p < 0.05 ; **p < 0.001 Scale: 1 (strongly disagree) to 7 (strongly agree) a Mean of Difference = the expectation score for Pharmacies minus the expectation score for Convenience Stores b Mann-Whitney Test
113

Table 5.40 Difference in Public Expectations According to Gender
Item
Male N = 613
Mean of Difference a
(SD)
Female N = 587
Mean of Difference a
(SD)
Z score b
1. I expect a good selection of OTC medicines.
3.50 (1.61) 3.75 (1.67) -2.94*
2. I expect OTC medicines to be effective.
0.42 (0.95) 0.48 (1.04) -0.68
3. I expect OTC medicines to be safe.
0.27 (0.81) 0.39 (1.07) -1.38
4. I expect a lot of information on the packages.
0.13 (0.70) 0.29 (0.95) -2.78*
5. I expect OTC medicines to be potent.
0.32 (0.93) 0.38 (1.07) -0.26
6. I expect OTC medicines to have very few side effects.
0.06 (0.54) 0.15 (0.87) -1.67
7. I expect low prices on OTC medicines.
1.20 (1.78) 1.27 (1.91) -0.34
8. I expect OTC medicines to be less effective than prescription medicines.
0.07 (0.65) 0.16 (0.89) -1.98
9. I expect professional help.
3.88 (2.07) 3.95 (2.17) -1.33
10. I expect to find good quality products.
1.61 (1.70) 1.97 (1.90) -3.23*
*p < 0.05 Scale: 1 (strongly disagree) to 7 (strongly agree) a Mean of Difference: the expectation score in Pharmacies minus the expectation score in Convenience Stores b Mann-Whitney Test
114
Several variables were analyzed by the Kruskal-Wallis Test to examine the
differences among subgroups because these variables had more than two subgroups. If
statistical significance was shown, a post-hoc (LSD) test was employed to determine
where the differences existed among the groups.
Analyzing differences for ten expectations across income groups showed that
seven of ten attributes had significantly different expectations, based on household
income. Details are shown in Table 5.41. As incomes rose, it appeared to impact most on
expectations for a varied product line and the need for professional help. Expectations
appeared to widen on these attributes, meaning that more would be expected if
purchasing the products in pharmacies than in convenience stores. The opposite appears
to happen for the clinical attributes such as effectiveness, safety, and package
information.
Regarding education level attained, there were eight attributes in which
significantly different expectations appeared across groupings (Table 5.42). There were
similar to the results for income. Specifically, expectations (for pharmacies versus
convenience stores) widened with increasing education for product selection and
professional help, while they contracted for the clinical attributes of effectiveness, safety,
and package information.
Respondent age groups were classified into three age groups (The Young = 18-35
years; Middle Aged = 36-64 years; Old Age = 65 years and over). Significant differences
existed for expectations (based on place of sale) for each of these ten attributes (Table
5.43). Although the mean differences between the locations were small for the clinical
attributes of effectiveness, safety, package information, potency, and potential for side
effects, expectations widened somewhat with increasing age. Conversely, the
expectation of professional help trended towards congruency between locations with
increasing age. In other words, moving from 4.33 to 4.12 to 3.18 suggests that increasing
age narrows expectations for professional help at the two locations. The elderly appear
to see less difference in this aspect across the two retail outlets.
115

C
hi-
Squa
re b
30.6
5**
23.7
2**
15.6
1*
14.5
9*
6.78
12.1
5*
4.87
9.74
*
30.8
9**
1.35
O
ver $
60,0
00
N =
429
M
D a (S
D)
3.86
(1.4
7)
0.33
(0.8
5)
0.18
(0.5
9)
0.12
(0.6
0)
0.24
(0.7
9)
0.05
(0.3
1)
1.37
(1.8
4)
0.04
(0.4
3)
4.33
(1.7
9)
1.81
(1.7
4)
$40,
000
- $5
9,99
9 N
= 2
65
MD
a (SD
)
3.84
(1.5
5)
0.40
(0.9
0)
0.35
(0.9
3)
0.15
(0.7
4)
0.33
(1.0
3)
0.07
(0.7
4)
1.28
(1.7
3)
0.05
(0.7
0)
3.95
(2.1
6)
1.89
(1.8
8)
$20,
000
- $3
9,99
9 N
= 2
76
MD
a (SD
)
3.49
(1.6
2)
0.59
(1.1
5)
0.39
(1.0
9)
0.25
(0.9
9)
0.40
(1.0
4)
0.09
(0.8
6)
1.07
(1.8
8)
0.18
(0.9
0)
3.81
(2.1
5)
1.80
(1.7
1)
U
nder
$20
,000
N
= 1
44
MD
a (S
D)
2.99
(1.9
7)
0.64
(1.2
0)
0.57
(1.2
7)
0.43
(1.1
4)
0.48
(1.1
8)
0.31
(0.9
6)
1.20
(2.0
5)
0.33
(1.1
9)
3.08
(2.3
5)
1.65
(1.9
7)
Tabl
e 5.
41 D
iffer
ence
in P
ublic
Exp
ecta
tions
Acc
ordi
ng to
Hou
seho
ld In
com
e
Ite
m
1. I
expe
ct a
goo
d se
lect
ion
of O
TC m
edic
ines
. 2.
I ex
pect
OTC
med
icin
es to
be
effe
ctiv
e.
3. I
expe
ct O
TC m
edic
ines
to b
e sa
fe.
4. I
expe
ct a
lot o
f inf
orm
atio
n on
the
pack
ages
.
5. I
expe
ct O
TC m
edic
ines
to b
e po
tent
. 6.
I ex
pect
OTC
med
icin
es to
hav
e ve
ry fe
w si
de
eff
ects
.
7. I
expe
ct lo
w p
rices
on
OTC
med
icin
es.
8.
I ex
pect
OTC
med
icin
es to
be
less
eff
ectiv
e th
an
pre
scrip
tion
med
icin
es.
9. I
expe
ct p
rofe
ssio
nal h
elp.
10. I
exp
ect t
o fin
d go
od q
ualit
y pr
oduc
ts.
*p
< 0.
05 ;
**p
< 0.
001
Sca
le: 1
(stro
ngly
dis
agre
e) to
7 (s
trong
ly a
gree
) a M
D =
Mea
n of
Diff
eren
ce (t
he e
xpec
tatio
n sc
ore
in P
harm
acy
min
us th
e ex
pect
atio
n sc
ore
in C
onve
nien
ce S
tore
) b K
rusk
al-W
allis
Tes
t is r
epor
ted
usin
g C
hi-S
quar
e.
116
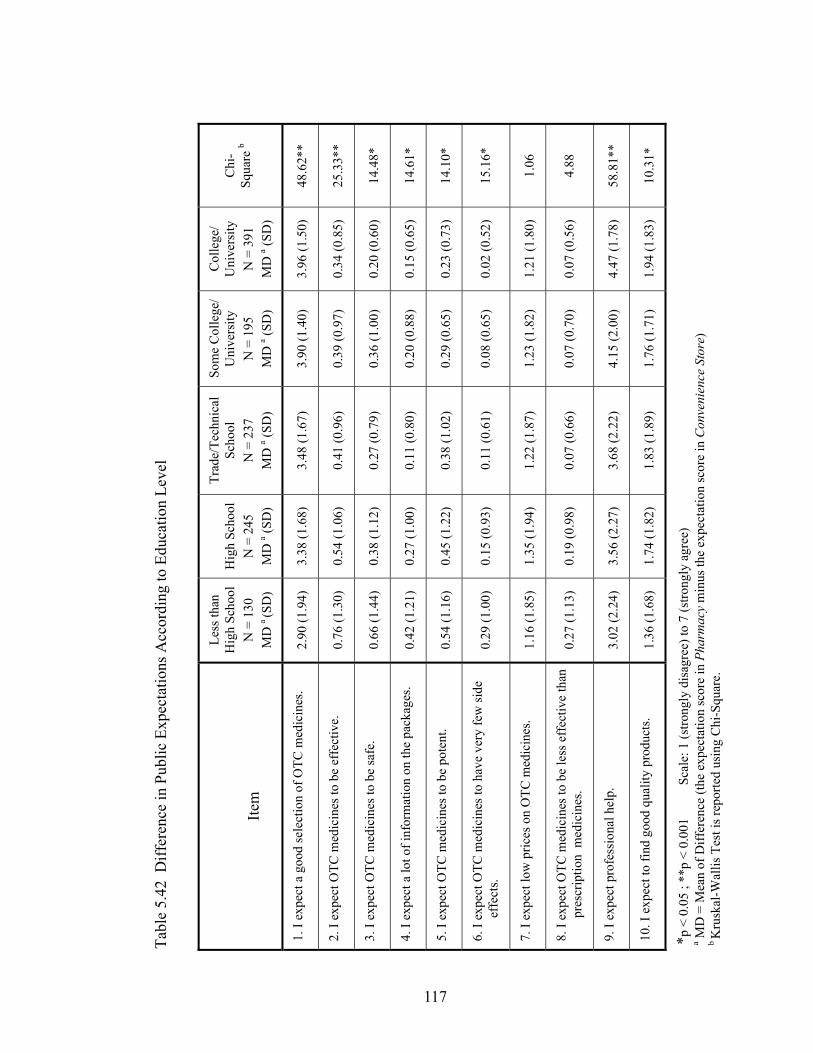
C
hi-
Squa
re b
48.6
2**
25.3
3**
14.4
8*
14.6
1*
14.1
0*
15.1
6*
1.06
4.88
58.8
1**
10.3
1*
Col
lege
/ U
nive
rsity
N
= 3
91
MD
a (SD
)
3.96
(1.5
0)
0.34
(0.8
5)
0.20
(0.6
0)
0.15
(0.6
5)
0.23
(0.7
3)
0.02
(0.5
2)
1.21
(1.8
0)
0.07
(0.5
6)
4.47
(1.7
8)
1.94
(1.8
3)
Som
e C
olle
ge/
Uni
vers
ity
N =
195
M
D a (S
D)
3.90
(1.4
0)
0.39
(0.9
7)
0.36
(1.0
0)
0.20
(0.8
8)
0.29
(0.6
5)
0.08
(0.6
5)
1.23
(1.8
2)
0.07
(0.7
0)
4.15
(2.0
0)
1.76
(1.7
1)
Trad
e/Te
chni
cal
Scho
ol
N =
237
M
D a (S
D)
3.48
(1.6
7)
0.41
(0.9
6)
0.27
(0.7
9)
0.11
(0.8
0)
0.38
(1.0
2)
0.11
(0.6
1)
1.22
(1.8
7)
0.07
(0.6
6)
3.68
(2.2
2)
1.83
(1.8
9)
H
igh
Scho
ol
N =
245
M
D a (S
D)
3.38
(1.6
8)
0.54
(1.0
6)
0.38
(1.1
2)
0.27
(1.0
0)
0.45
(1.2
2)
0.15
(0.9
3)
1.35
(1.9
4)
0.19
(0.9
8)
3.56
(2.2
7)
1.74
(1.8
2)
Less
than
H
igh
Scho
ol
N =
130
M
D a
(SD
)
2.90
(1.9
4)
0.76
(1.3
0)
0.66
(1.4
4)
0.42
(1.2
1)
0.54
(1.1
6)
0.29
(1.0
0)
1.16
(1.8
5)
0.27
(1.1
3)
3.02
(2.2
4)
1.36
(1.6
8)
Tabl
e 5.
42 D
iffer
ence
in P
ublic
Exp
ecta
tions
Acc
ordi
ng to
Edu
catio
n Le
vel
Ite
m
1. I
expe
ct a
goo
d se
lect
ion
of O
TC m
edic
ines
. 2.
I ex
pect
OTC
med
icin
es to
be
effe
ctiv
e.
3. I
expe
ct O
TC m
edic
ines
to b
e sa
fe.
4. I
expe
ct a
lot o
f inf
orm
atio
n on
the
pack
ages
.
5. I
expe
ct O
TC m
edic
ines
to b
e po
tent
. 6.
I ex
pect
OTC
med
icin
es to
hav
e ve
ry fe
w si
de
eff
ects
.
7. I
expe
ct lo
w p
rices
on
OTC
med
icin
es.
8.
I ex
pect
OTC
med
icin
es to
be
less
eff
ectiv
e th
an
pre
scrip
tion
med
icin
es.
9. I
expe
ct p
rofe
ssio
nal h
elp.
10. I
exp
ect t
o fin
d go
od q
ualit
y pr
oduc
ts.
*p
< 0.
05 ;
**p
< 0.
001
Sc
ale:
1 (s
trong
ly d
isag
ree)
to 7
(stro
ngly
agr
ee)
a MD
= M
ean
of D
iffer
ence
(the
exp
ecta
tion
scor
e in
Pha
rmac
y m
inus
the
expe
ctat
ion
scor
e in
Con
veni
ence
Sto
re)
b K
rusk
al-W
allis
Tes
t is r
epor
ted
usin
g C
hi-S
quar
e.
117

C
hi-
Squa
re b
42.9
9**
61.0
2**
35.6
5**
20.0
1**
26.8
4**
13.0
3*
24.8
1**
15.2
8**
52.4
2**
12.1
4*
Old
Age
N
= 3
01
MD
a (SD
)
3.07
(1.8
1)
0.78
(1.2
5)
0.56
(1.2
6)
0.38
(1.1
3)
0.61
(1.3
3)
0.22
(1.0
7)
0.82
(1.7
5)
0.28
(1.7
8)
3.18
(2.2
1)
1.49
(1.7
0)
Mid
dle
Age
d N
= 7
19
MD
a (SD
)
3.85
(1.5
5)
0.36
(0.9
1)
0.25
(0.8
4)
0.15
(0.7
2)
0.26
(0.8
5)
0.08
(0.5
6)
1.33
(1.8
4)
0.07
(0.5
8)
4.12
(2.0
4)
1.87
(1.8
7)
The
You
ng
N =
169
M
D a
(SD
)
3.67
(1.4
7)
0.23
(0.6
9)
0.22
(0.6
6)
0.14
(0.5
9)
0.22
(0.7
4)
0.00
(0.4
5)
1.62
(1.9
2)
0.04
(0.5
9)
4.33
(1.9
6)
1.98
(1.7
0)
Tabl
e 5.
43 D
iffer
ence
in P
ublic
Exp
ecta
tions
Acc
ordi
ng to
Age
Ite
m
1. I
expe
ct a
goo
d se
lect
ion
of O
TC m
edic
ines
. 2.
I ex
pect
OTC
med
icin
es to
be
effe
ctiv
e.
3. I
expe
ct O
TC m
edic
ines
to b
e sa
fe.
4. I
expe
ct a
lot o
f inf
orm
atio
n on
the
pack
ages
.
5. I
expe
ct O
TC m
edic
ines
to b
e po
tent
. 6.
I ex
pect
OTC
med
icin
es to
hav
e ve
ry fe
w si
de e
ffec
ts.
7.
I ex
pect
low
pric
es o
n O
TC m
edic
ines
.
8. I
expe
ct O
TC m
edic
ines
to b
e le
ss e
ffec
tive
than
p
resc
riptio
n m
edic
ines
.
9. I
expe
ct p
rofe
ssio
nal h
elp.
10. I
exp
ect t
o fin
d go
od q
ualit
y pr
oduc
ts.
*p <
0.0
5 ; *
*p <
0.0
01
Sca
le: 1
(stro
ngly
dis
agre
e) to
7 (s
trong
ly a
gree
) Th
e Y
oung
= 1
8 –
34 y
ears
; Mid
dle
Age
d =
35 –
64
year
s; O
ld A
ge =
65
year
s and
ove
r a M
D =
Mea
n of
Diff
eren
ce (t
he e
xpec
tatio
n sc
ore
in P
harm
acy
min
us th
e ex
pect
atio
n sc
ore
in C
onve
nien
ce S
tore
) b K
rusk
al-W
allis
Tes
t is r
epor
ted
usin
g C
hi-S
quar
e.
118
5.3 Test – Retest
In order to assess instrument reliability, a test-retest procedure was undertaken.
Of the 405 respondents who replied to the main questionnaire within the first week of
data recovery, 38 respondents (approximately 10 percent of the group) were randomly
selected to complete a second survey. Questionnaires were sent to the re-testing sample
one month after their first questionnaire was originally mailed. A total of 25 people
completed and returned the second document within a one-month recovery period, for a
response rate of 65.8 percent.
Answers on the two copies of the questionnaire from each respondent were
compared manually, with attention specifically given to whether responses changed
across the two documents. Several questions that were contingent upon a specific time
period, such as purchasing OTC products in the past six months, were excluded. This
was due to the fact the second questionnaire was sent approximately three weeks after
receiving responses to the first document, thus any OTC-related behaviours of this
nature would not be based on the same period of time.
As hoped, demographic data (age, gender, education, etc) pairings across both
documents were exactly the same.
When respondents were asked to indicate their overall health status, 14 (56.0
percent) described themselves by the same status, while 11 (44.0 percent) switched their
response by one unit. The majority (n = 9) switched their health status either from fair to
good or from good to fair. The maximum possible degree of shift was 5 units.
On comparing pairs of responses to each statement regarding impressions of care
needed when using OTC medicines (Table 5.44), a high proportion of respondents (over
80 percent) either did not change their answers or shifted only one unit for each
statement.
The same comparisons were made for statements in Part V – Impressions of
Pharmacists. The results show that a high number of respondents kept the same answer
or at most, altered it slightly for each statement (Table 5.45).
Tables 5.46 and 5.47 show the comparisons of answers for the ten expectations
of OTC medicines, sold either in convenience stores or in pharmacies. The majority of
119

respondents did not change their answers, or shifted only one unit within the scale
provided for each expectation. A few respondents changed their answers by at least three
units along the scale.
Table 5.44 Consistency of Responses for Questions of Part IV – Impressions of Care Needed When Using OTC Medicines (n = 25 pairs)
Degree of shift*
Item None N (%)
One N (%)
Two N (%)
Three N (%)
Four N (%)
1. It is generally safe to take more than one OTC medicine at a time.
17 (68.0%)
4 (16.0%)
4 (16.0%)
0 0
2. When taking an OTC medicine, I should be careful with it. 17
(68.0%)6
(24.0%)2
(8.0%) 0 0
3. OTC medicines rarely cause side effects. 16
(64.0%)8
(32.0%)1
(4.0%) 0 0
4. OTC medicines are safe to take at higher than recommended doses. 13
(52.0%)9
(36.0%)2
(8.0%) 1
(4.0%) 0
5. Taking some prescription medicines with certain OTC medicines can cause problems.
20 (80.0%)
5 (20.0%)
0 0 0
6. It can be dangerous to take certain OTCs if I have other medical conditions.
17 (68.0%)
6 (24.0%)
1 (4.0%)
0 1 (4.0%)
7. Generally, I find prescription medicines to be more effective than OTC medicines.
10 (40.0%)
11 (44.0%)
3 (12.0%)
1 (4.0%)
0
* The maximum possible degree of shift was 4 units
.
120
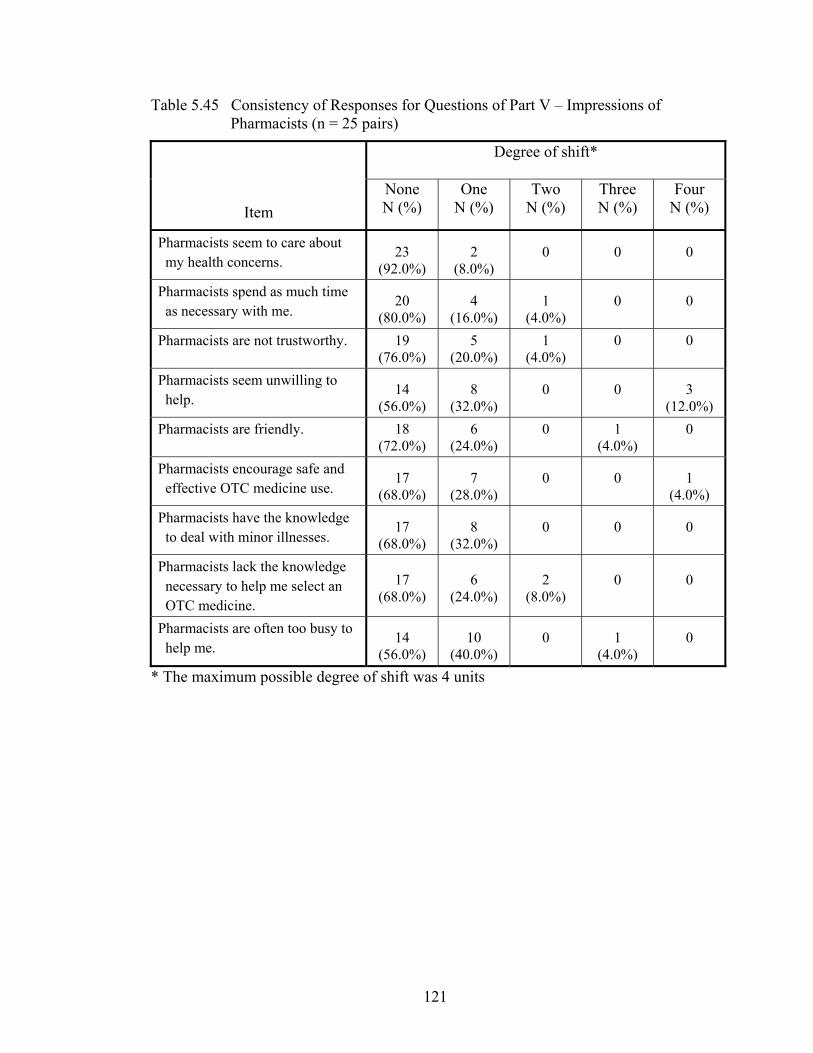
Table 5.45 Consistency of Responses for Questions of Part V – Impressions of Pharmacists (n = 25 pairs)
Degree of shift*
Item None N (%)
One N (%)
Two N (%)
Three N (%)
Four N (%)
Pharmacists seem to care about my health concerns.
23 (92.0%)
2 (8.0%)
0 0 0
Pharmacists spend as much time as necessary with me.
20 (80.0%)
4 (16.0%)
1 (4.0%)
0 0
Pharmacists are not trustworthy. 19 (76.0%)
5 (20.0%)
1 (4.0%)
0 0
Pharmacists seem unwilling to help.
14 (56.0%)
8 (32.0%)
0 0 3 (12.0%)
Pharmacists are friendly. 18 (72.0%)
6 (24.0%)
0 1 (4.0%)
0
Pharmacists encourage safe and effective OTC medicine use.
17 (68.0%)
7 (28.0%)
0 0 1 (4.0%)
Pharmacists have the knowledge to deal with minor illnesses.
17 (68.0%)
8 (32.0%)
0 0 0
Pharmacists lack the knowledge necessary to help me select an OTC medicine.
17 (68.0%)
6 (24.0%)
2 (8.0%)
0 0
Pharmacists are often too busy to help me.
14 (56.0%)
10 (40.0%)
0 1 (4.0%)
0
* The maximum possible degree of shift was 4 units
121

Table 5.46 Consistency of Responses for Questions of Part VI – Expectations of OTC Medicines Sold in Convenience Stores (n = 25 pairs)
Degree of shift*
Item None N (%)
One N (%)
Two N (%)
Three N (%)
Four N (%)
Five N (%)
I expect a good selection of OTC medicines.
12 (48.0%)
10 (40.0%)
2 (8.0%)
1 (4.0%)
0 0
I expect OTC medicines to be effective.
14 (56.0%)
7 (28.0%)
2 (8.0%)
2 (8.0%)
0 0
I expect OTC medicines to be safe.
15 (60.0%)
8 (32.0%)
1 (4.0%)
0 0 1 (4.0%)
I expect a lot of infor- mation on the package.
16 (64.0%)
8 (32.0%)
0 1 (4.0%)
0 0
I expect OTC medicines to be potent.
10 (40.0%)
9 (36.0%)
6 (24.0%)
0 0 0
I expect OTC medicines to have very few side effects.
11 (44.0%)
8 (32.0%)
3 (12.0%)
2 (8.0%)
0 1 (4.0%)
I expect low prices on OTC medicines.
11 (44.0%)
8 (32.0%)
4 (16.0%)
1 (4.0%)
1 (4.0%)
0
I expect OTC medicines to be less effective than prescription medicines.
10 (40.0%)
10 (40.0%)
1 (4.0%)
2 (8.0%)
2 (8.0%)
0
I expect professional help. 17 (68.0%)
4 (16.0%)
2 (8.0%)
1 (4.0%)
0 1 (4.0%)
I expect to find good quality products.
8 (32.0%)
9 (36.0%)
5 (20.0%)
1 (4.0%)
1 (4.0%)
1 (4.0%)
* The maximum possible degree of shift was 6 units
122

Table 5.47 Consistency of Responses for Questions of Part VI – Expectations of OTC Medicines Sold in Pharmacies (n = 25 pairs)
Degree of shift*
Item None N (%)
One N (%)
Two N (%)
Three N (%)
Four N (%)
Five N (%)
I expect a good selection of OTC medicines. 15
(60.0%)10
(40.0%)0 0 0 0
I expect OTC medicines to be effective. 18
(72.0%)6
(24.0%)1
(4.0%) 0 0 0
I expect OTC medicines to be safe. 17
(68.0%)7
(28.0%)1
(4.0%) 0 0 0
I expect a lot of infor- mation on the package. 16
(64.0%)9
(36.0%)0 0 0 0
I expect OTC medicines to be potent. 8
(32.0%)11
(44.0%)6
(24.0%)0 0 0
I expect OTC medicines to have few side effects. 12
(48.0%)9
(36.0%)2
(8.0%) 2
(8.0%) 0 0
I expect low prices on OTC medicines. 12
(48.0%)7
(28.0%)5
(20.0%)0 1
(4.0%) 0
I expect OTC medicines to be less effective than prescription medicines.
10 (40.0%)
12 (48.0%)
0 2 (8.0%)
1 (4.0%)
0
I expect professional help. 15 (60.0%)
9 (36.0%)
1 (4.0%)
0 0 0
I expect to find good quality products. 16
(64.0%)9
(36.0%)0 0 0 0
* The maximum possible degree of shift was 6 units
Over all the sections of the questionnaire, there was a strong degree of similarity
in responses for the paired questions. While congruency ranged from 32 to 92 percent,
depending on the item, an average of 61.6 percent of respondents provided the same
answers from the time of the first questionnaire, to the second completed a few weeks
later. Furthermore, for respondents who shift one unit on the scale, the resultant shift
was usually a matter of degree within their original classification rather than a more
brazen change. Specifically, opinions switched from strongly disagree to disagree (31
123
percent); from disagree to strongly disagree (7 percent); and from strongly agree to
agree (28 percent). Conversely, 16 percent made the more significant jump from agree
to disagree. In general then, respondents’ opinions did not differ to a great extent
between the two tests, even though changes were indeed seen.
5.4 Potential for Non-Response Bias
This assessment was conducted from October 8 to November 8, 2003. One
hundred subjects were randomly selected from the 753 subjects who did not respond
during the main survey. After a one-month allocation for information recovery, a total of
17 documents were returned, for a response rate of 17.0 percent.
Most non-responders (n = 15; 88.2 percent) were aware that OTC medicines
could be purchased in convenience stores; only two did not. When asked about
experiences regarding OTC purchases in convenience stores and pharmacies, all
respondents had purchased OTC medicines from pharmacies. Nine respondents had
purchased OTC products from convenience stores, six had not, while two respondents
could not recall.
Demographic data of participants providing non-responder data are shown in
Table 5.48. The age range was from 22 to 92 years, with the average being 53.3 years
(SD = 19.8).The majority of respondents were in the age groups of 35 to 44 years (n = 6)
and 45 to 54 years (n = 5). The number of male participants (n = 11) was nearly twice
that of females (n = 6).
Given the very low numbers, the quality of data for non-responders is likely
suspect. Differences between responders and non-responders were seen at the lowest and
highest income levels, as well as for gender (males made up a bigger percentage of non-
responders). Otherwise, a reasonable degree of similarity appeared to exist.
124
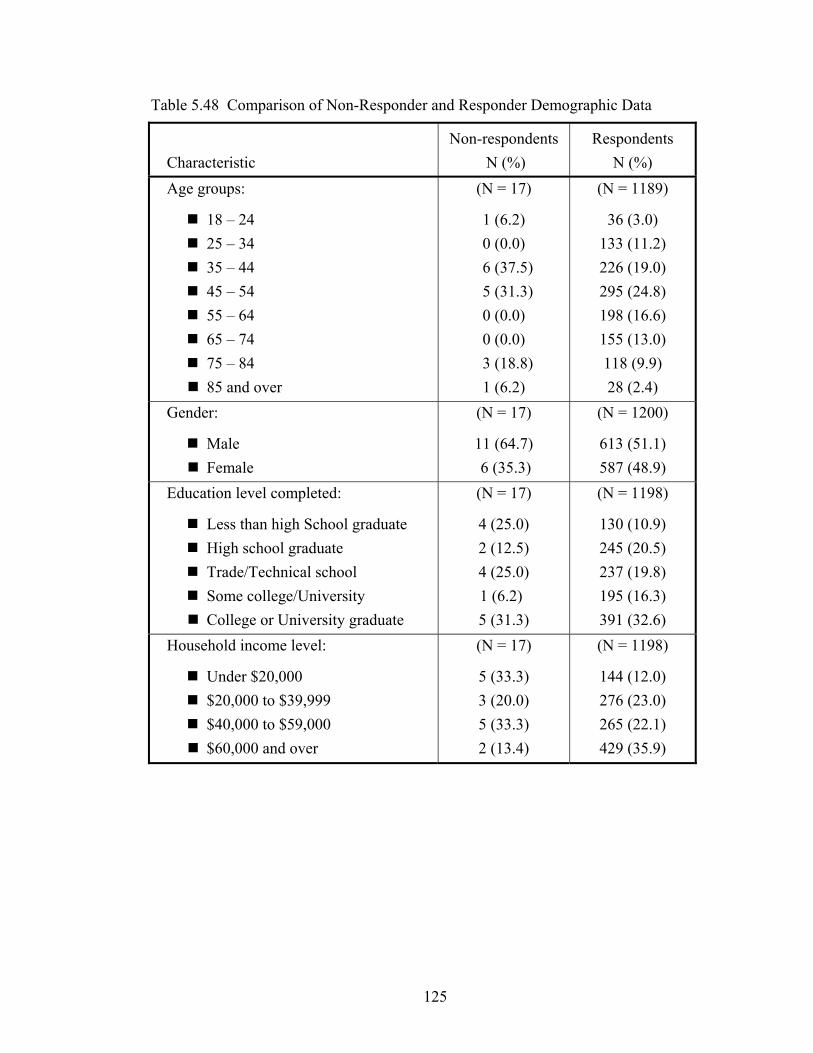
Table 5.48 Comparison of Non-Responder and Responder Demographic Data
Characteristic
Non-respondents N (%)
Respondents N (%)
Age groups:
18 – 24 25 – 34 35 – 44 45 – 54 55 – 64 65 – 74 75 – 84 85 and over
(N = 17)
1 (6.2) 0 (0.0)
6 (37.5) 5 (31.3) 0 (0.0) 0 (0.0)
3 (18.8) 1 (6.2)
(N = 1189)
36 (3.0) 133 (11.2) 226 (19.0) 295 (24.8) 198 (16.6) 155 (13.0) 118 (9.9) 28 (2.4)
Gender:
Male Female
(N = 17)
11 (64.7) 6 (35.3)
(N = 1200)
613 (51.1) 587 (48.9)
Education level completed:
Less than high School graduate High school graduate Trade/Technical school Some college/University College or University graduate
(N = 17)
4 (25.0) 2 (12.5) 4 (25.0) 1 (6.2) 5 (31.3)
(N = 1198)
130 (10.9) 245 (20.5) 237 (19.8) 195 (16.3) 391 (32.6)
Household income level:
Under $20,000 $20,000 to $39,999 $40,000 to $59,000 $60,000 and over
(N = 17)
5 (33.3) 3 (20.0) 5 (33.3) 2 (13.4)
(N = 1198)
144 (12.0) 276 (23.0) 265 (22.1) 429 (35.9)
125

CHAPTER 6: DISCUSSION
Amidst the rising costs of formalized healthcare in many countries, self-care is
being promoted as a way to save limited financial resources. People are being
encouraged to monitor their own illnesses, undertake lifestyle changes to prevent
diseases and/or maintain their health, and self-treat minor symptoms. Within the broad
arena of self-care, over-the-counter medicines play a crucial role and are a critical
component of a properly functioning healthcare system. People use OTC products to
treat such common minor illnesses as colds, headaches, heartburn, and sore feet. As
governments switch more medicines to OTC status, and with the medicines becoming
ever more potent, public attitudes that shape usage patterns will also become more
important.
Given that consumers can purchase OTC medicines both from pharmacy and
non-pharmacy outlets, the role of pharmacists in ensuring their proper use has been
under some debate for years within the profession. In Canada, a select number of
products are limited to sale from pharmacies in a bid to ensure patient safety. This has
led to questions whether location of sale might influence public attitude to such
medicines. Is there potential for consumers to feel that OTC products purchased in
convenience stores are lesser medicines than ones purchased in a pharmacy? This study
was undertaken to examine whether location of sale impacts on public expectations of
over-the-counter medicines.
6.1 Reliability and Validity of Results
Validity and reliability are important issues for survey research. In this study,
several means were used to improve upon both. A random sample of respondents was
procured using the local phone book as the sampling template. The final response rate
was 57.2 percent. This return rate is relatively high when compared to other studies of
126
similar design.39,141,171-173
A low response rate is obviously a common concern in mail surveys.182 Use of
the pre-notification letter, several follow-ups, and provision of return envelope/postage
appeared to have a positive effect on the response rate in the project. Initially, 33.5
percent of subjects (n = 704) replied to the questionnaire. After subjects received the
first reminder, another 15.3 percent (n = 322) was replied. Sending the second follow-up
with replacement questionnaires led to a further increase of 8.4 percent replies (n = 176).
Outright interest in the subject also cannot be overlooked as a motivating factor in
producing the response rate achieved.
When demographic data from this study and 2003 Saskatoon Census data were
compared, it was concluded that study responders were reasonably similar to the best
data available on the apparent profile of the city’s citizens. Several characteristics such
as income and education levels were on par. Age groups of both data sets were also
similar, except for those aged 18 to 24 years, where only three percent of study
respondents fell into this category versus 16 percent in Census data. More male
respondents replied to the questionnaire than did females (51.1 percent versus 48.9
percent, respectively). In Census data, however, the breakdown of males (48.1 percent)
to females (51.9 percent) was quite similar. It should be noted that females tend to be
more frequent users (and purchasers) of OTC products.9,64-69 This study, however, was
not targeted to the most frequent user in society, but rather the population in general.
There was no obvious bias uncovered with non-responder data, although the
number of replies was low.
Overall, evidence therefore suggests that the survey sample reflected the
population of Saskatoon residents in 2003, and by extension, the data potentially
reflected their behaviours and attitudes towards OTC medicines. The data may be less
useful, however, for depicting the attitudes and behaviours of the average OTC medicine
shopper, given that females constitute a larger proportion of that group.
Although steps were taken to develop data collection tools that would garner
valid results, the extent to which this was achieved remains unknown (see Limitations
below). The results from test-retesting did indicate that participants had similar opinions
within a select group of questions, suggesting at least some stability in answers.
127
6.2 Consumer Expectations of OTC Medicines According to Location of Sale
Although an OTC product becomes available without a prescription due to a
favourable safety profile, it is not without risk. During product selection and use, such
risks include improper diagnosis, incorrect dosage, occurrence of side effects, and so on.
In spite of that, the public seems ready for greater access to medicines. One report, in
fact, found that a small number of consumers were willing to accept considerable risk
with a medicine in order to gain access to it.191
When obtaining an agent to treat a minor illness, consumers choose not only
among different medicines, but also between various types of retail outlets. In Canada,
people can buy such medicines (depending on the agent) from pharmacies, convenience
stores, supermarkets, and department stores. Store image is likely a factor in what a
consumer decides.152,153
Several studies have attempted to determine patronage motives that are
applicable to pharmacies.49,116,158-160,192 In these, participants usually get asked to
indicate their primary reasons for using one pharmacy over another. In one, 44 percent
of Americans chose convenient location as their primary reason for using their regular
pharmacy.159 Another American survey determined the importance of each of 11 reasons
for drug store patronage.49 Most participants (87 percent) thought close to home a very
important reason. The importance of knowledgeable staff, competitive prices, fast check
out/no lines, good signage, and easy access/parking space were chosen as important by
more than half of respondents.
Consumer patronage motives from the perspective of pharmacies versus non-
pharmacy outlets was of interest for the current study. Only one previous report
specifically has focused on this direct comparison.161 In it, the authors chose 16 store
attributes and 11 OTC-information-service attributes to determine their importance for
patronage motives. They also compared average performances of three types of retail
outlets – food stores, mass merchandise stores, and pharmacies. Overall, reasonable
price was ranked the most important factor by American consumers when they selected
between these outlets to purchase OTC medicines. Access to a pharmacist came in
eleventh place. Pharmacy patrons rated significantly higher importance to the majority
128

of attributes (15 of 27), especially those relating to OTC information services, than did
non-pharmacy patrons. Gore and Thomas, therefore, found that the ability to provide
professional services was one of the obvious advantages for pharmacies. However,
perceptual differences held by the public as they pertain to the products themselves,
between pharmacies and non-pharmacy outlets, was not addressed in that report.
Although pharmacies are the most common place for OTC purchases,13,48-50 sales
from non-pharmacy outlets have been allowed for many years. Nearly 20 percent of our
respondents did not realize that such products could be purchased from convenience
stores. Of those that were aware, less than half had done so. Thus, the sample could be
considered as low in experience with regards to what OTC medicines could even be
found within convenience stores. This may have produced an unlevel playing field when
asked for expectations of the two locations.
The available information on medicine perceptions appears to indicate that
consumers distinguish differences between OTC and prescription medicines. At the
same time, a concern appears to exist whereby the public may not consider medicines
available without prescription as full-fledged medicines, ones requiring the same level of
vigilance during use. Location of sale may be a factor in the development of such
perceptions, potentially being a predeterminant of actual behaviour.
In the current study, consumer expectations for OTC medicine potency, safety,
side effect potential, effectiveness, and package information did show statistically
significant differences in relation to place of sale. In other words, for all five attributes of
a clinical nature, the public of Saskatoon would expect OTC medicines to be stronger,
safer, have less potential for side effects, be more effective, and come with more
package information when found in a pharmacy versus a convenience store. This
suggests some value might be anticipated for shoppers who chose their products in
pharmacies. However, for each expectation, the difference between the mean scores for
pharmacy and convenience store was small. On the seven-point Likert scale, the range
was only 0.1 to 0.4. Thus, while reaching statistical significance, such differences may
not be of practical importance.
Conversely, differences in expectations for professional help, price, availability,
and quality of products for the two locations were larger. The range was 1.2 to 3.9 on the
129

seven-point scale. Although no guidelines exist for establishing practical relevance for
this issue (and the scale used), a move of one full unit on the scale might seem
reasonable. It therefore appears that the public has higher expectations for good quality,
a reasonable price, a variety of products, and professional help from pharmacies rather
than from convenience stores. The work of Gore and Thomas also provides similar
results.161
It is of utmost importance to reiterate the scenario that was presented to each
respondent, given what might be perceived as a tenuous argument at best for the
comparison made during this study. For those respondents who knew a product such as
TylenolR could be purchased at either outlet, they may have been dumbfounded to read
that the researchers were asking for expectation differences, knowing that this product
surely would not change in any way at the retail outlet. In their minds, TylenolR (or
BenylinR, or SudafedR, etc) would be TylenolR, regardless of location. Given the scores
found, it does appear that respondents knew location would not affect any clinical
qualities of a product, but that merchandising aspects would indeed be affected. It also
appears clear that professional help could be expected in a pharmacy, but not at a
convenience store. Yet, it was interesting to have found a value of 2.5 (seven-point scale)
within this sample as the expectation for this service in a convenience store. Given that
pharmacists are not employed by convenience stores, the lowest level of expectation (a
score of 1 as strongly disagree) might otherwise have been expected. A score of 2.5
ranges on the verbal anchors somewhere between Disagree and Somewhat Disagree.
Besides the location of purchase itself, several other factors might influence
consumers’ expectations. One such factor was consumers’ past experiences of purchase.
Respondents who had bought OTCs in a convenience store had converging expectations
for clinical qualities of products, whether sold in a pharmacy or in a convenience store.
In other words, these experienced consumers clearly knew that the OTC product would
not change based on where it was sold. The location of sale would not affect their
thoughts about OTC product effectiveness and safety. However, if consumers did not
have any experience with OTC purchases in a convenience store, they appeared to
believe that OTC products which were sold in a convenience store were neither as
130

effective nor safe as ones sold in a pharmacy. Some inclination that they could get
professional help in a convenience store also seemed present.
The results from the present study showed that the two factors – the frequency of
OTC purchase in convenience stores and the frequency of actual OTC use – did not
influence consumer expectations. High-frequency purchasers (making ≥ 2 purchases
within the six-month period) in convenience stores had similar expectations for the
clinical qualities of OTC products as did low-frequency OTC purchasers (those making
< 2 purchases within the six-month period). High-frequency OTC users (used > 2 OTC
medicines within 30 days) and low-frequency OTC users (used ≤ 2 OTC medicines
within 30 days) also had similar expectations about clinical qualities of OTCs at either
location. Although differences of expectations were not shown between groups, it
appeared that these people believed that OTC products were supposed to be effective
and safe, as well as have few side effects. It may be plausible that purchasers have
different dynamics to consider during the purchase process than what is considered by
the actual users of the products.
Impression of the care needed for general OTC product use was considered to be
an important factor. In the present study, all respondents were separated into two
groups – Low-care needed versus High-care needed. However, there was no respondent
categorized to the low-care group. While this prevents any comparisons, it does suggest
our sample felt that due care and attention is needed with these medicines.
When impressions of pharmacists (positive feelings versus negative feelings)
was analyzed, there was only one respondent in a group possessing negative feelings
compared to 824 respondents in the positive feelings group. Making comparisons was,
therefore, not possible, but this result suggests that people felt satisfied with the qualities
exhibited by pharmacists and their role in OTC medicines.
6.3 Minor Illness and Use of OTC Medicines
Two different time periods (six months and 30 days) were used as the context
periods towards obtaining behavioural information relating to OTC medicines and minor
illnesses. Questions concerning frequency of minor illnesses, for example, utilized the
131

six-month period (January to June, 2003), while a 30-day period (June, 2003) was used
to determine recent experiences with OTC purchases and use. Therefore, when the
results of this study are compared with those of other studies, seasonal effects should be
taken into consideration.
Minor illnesses were found to be a common occurrence in Saskatoon. From
January to June 2003, almost every participant had suffered with at least one. On
average, respondents reported they had suffered 3.6 different symptoms during this
period. Pain (headaches, muscle aches, sore backs), cold/flu, and allergies were among
the top in this regard. These results do not differ from other national studies.9,37 Women
were more likely to experience symptoms such as headache, dry skin, and constipation
than men. A previous study also had similar findings.193 Several symptoms such as
headache, constipation, and insomnia were found to be associated with age in the current
study. Verbrugge has also identified that select symptoms are related to age.194
Use of an OTC or prescription medicine at least once in a person’s life can
almost be considered a “given” in North American culture. According to usage data,41,42
OTC medicines are more commonly used by the public (when compared to prescription
medicines). Nation-wide studies done in Canada and the United States provide similar
evidence.55,56 Americans reported rates of 2.2 for OTC medicines and 3.0 for
prescription medicines used within 30 days.55 For elderly citizens living in Ontario, a
quarter of respondents reported using no medicines, while the use of OTC medicines (56
percent) was more prevalent than use of prescription medicines (48 percent).195 Findings
of the present study tend to support that OTC usage is on par with prescription usage. On
average, respondents reported using 1.6 different kinds of OTC medicines and 1.6
different kinds of prescription medicines during a period of one month. These numbers
were slightly higher than national data provided by the 2002 Ontario Drug Information
Resource Center (DIRC) survey, where 1.4 agents were reported for each type of
medicines in a one-month period.10 The DIRC survey was conducted in winter, while the
current study would lead to data generated for the summer months. Dry skin products
were ranked high in popularity by Saskatoon residents. This might be caused by the
climate in Saskatoon and the seasons the study was conducted.
132

Various studies show that females 9,64-69 and young adults 64,65,68,70 are major
OTC users. People with high levels of education and high household incomes also tend
to use more OTC medicines. The results of the present study revealed that women
indeed used more OTC medicines than did men, but the characteristics of age, education,
and household income did not seem to influence OTC usage.
The maximum number of different medicines taken by any one person was 12
for OTC products and 20 for prescription medicines over a 30-day period. If, in fact,
these numbers are accurated, this would be of concern. But, this could also be explained
by respondents not recognizing (or responding incorrectly) to the term “different” in the
question. Others may not have remembered how many types of OTC medicines they
actually had used. If the responses are reflective of the true situation, these respondents
could be subject to risk of adverse drug reactions. Within the six-month period for OTC
product purchases, the maximum number from convenience stores was 10, versus 20
times from pharmacies. However, purchases could have been for someone else as well
as for themselves.
In a related area, about one-quarter (29.0 percent) of participants either Agreed or
Strongly Agreed with the following statement: It is generally safe to take more than one
OTC medicine at a time. While included in the battery of items to determine an overall
measure of care needed when taking such agents, the results above do not necessarily
suggest inappropriate use. While adding negative influence onto their measure of care
value, it is quite reasonable at times to take more than one OTC product. For example, a
person might be taking ASA 81mg for heart risk reduction, an artificial tear for dry eyes,
and loratadine for summer allergies. Results from the Canadian survey also show that
one-third of adults (about 5 million adults) are willing to take more than one OTC
medicine at the same time if they have more than one symptom.10 While more agents
being taken at the same time can increase risk, it is not a forgone conclusion.
Overall in the section directed as measuring care needed, the majority of our
respondents opted for responses that indicated due care was indeed in order. Most
thought, for example, that OTC medicines were not safe to take at higher than
recommended doses, that taking some prescription medicines with certain OTC
medicines could cause problems, and that it can be dangerous to take certain OTC
133

medicines if they also have other medical conditions. Two studies conducted in the
United Sates and United Kingdom had similar findings.55,176
What people say they do versus actual behaviour, though, may not be
consistently the same. For example, according to the present study, most people knew
that it was not safe to take OTC medicines at higher than recommended doses. However,
based on the results of the national survey, 16 percent of Canadian adults had taken
more than the recommended number of pills at a single time.10 This situation was more
commonly seen in adults aged 18 to 24 (31 percent). It also may be of more concern in
the United States, where 33 percent of Americans admitted to having taken more than
the recommended dose of OTC medicines.55
In general, users in the current study felt satisfied with the products they had
used. An industry-sponsored study supports this finding60 as does a report of Health
Canada in 1990.83 Health Canada’s report only listed seven types of OTC medicines; of
those, six can be matched to types of medicines in the current study. Results of both
Health Canada report and this current study showed over 90 percent of people thought
pain relieves were effective, followed by upset stomach remedies (around 84 percent),
and antihistamines (about 80 percent). More respondents in Saskatoon (around 25
percent) had doubts about the effectiveness of cold/cough remedies, compared with
respondents in Canada (16 percent). More Saskatoon respondents (88 percent) thought
laxatives were effective than other Canadians (79 percent).
While sleep aids and stop-smoking products are popular in the marketplace,53
only a few participants in the current study had used them and of these, a high
percentage were not sure whether they were in fact useful.
6.4 Information-Seeking Behaviour
OTC medicine packaging provides information and instructions on how to safely
select, and then use, an agent. It is a very common source of information. A vast
majority of people in Northern Ireland, for example, stated they would always or often
follow the directions on an OTC package.196 Results of the current study find that most
Saskatoon residents claim they would also read such information. Compared with
134

Canadian data circa 1990,83 fewer respondents said that they never read the package
information. This is a positive outcome if it means that, over the past decade, the public
have in fact taken up the challenge of being better healthcare consumers and are taking
more responsibility to care for their own health by reading OTC package instructions.
Findings specific to certain information sections on the packaging points to the
fact that a much higher portion of Saskatoon residents claimed they would read
information than would other Canadians10 or Americans.55 Saskatoonians felt direction
of use was the most important information and almost everyone would read this section,
regardless whether buying or using/giving the medicine for the first time. Information
about active ingredients did not attract the same attention. However, in the national
study, Canadians thought that reading about active ingredients was more important than
reading other sections when they purchased OTC medicines.10
Different information might be needed if the occasion is the first time for the
purchase versus using/giving the medicine. The current work and data from the USA55
indeed supported this notion. When people use/give an OTC medicine for the first time,
they gravitate more to information on direction of use, which may be less important
during the actual purchase.
Doctors and pharmacists were common sources for the public in the current
study when seeking information on OTC medicines, with some preference shown for
pharmacists. Two Canadian reports provide similar results.130,131 Conversely, the reasons
pharmacists might not be called upon for advice was also addressed by the questionnaire.
Of those respondents for where it was applicable to provide this information and who
went on to provide it (n = 800), the vast majority (n = 569) felt they had no difficulty in
selecting a product without pharmacists’ advice, even within the context of a first
purchase. It was somewhat disconcerting that 122 people felt pharmacists were too busy
for such interaction and that being too busy to stop/forgetting to ask accounted for 180 of
such reasons. This data suggests that there may be more demand for information than
what generally takes place in pharmacies. Reasons were also obtained in a study by
Taylor,106 but for that work, responses were not geared toward an initial purchase (as
was the case in the current study), making comparisons difficult. That report, though, did
raise the spectre of consumer hesitation in asking for assistance.
135

6.5 Consumer Impressions of Pharmacists
Pharmacists are a key resource when dealing with OTC products. Overall, most
respondents had very good impressions of pharmacists. Most (over 90 percent) appeared
to trust pharmacists and believed they had the applicable knowledge to help in selecting
OTC products. Slightly fewer respondents (85 percent) were convinced that pharmacists
encourage safe and effective use of OTC medicines.
Most respondents also felt satisfied with pharmacists’ personal traits. They
agreed that pharmacists are friendly, are willing to help and seem to care about their
health concerns. An American study provided similar results; 90 percent of respondents
felt their pharmacists were concerned about their health.138
Lack of time has been identified as the major barrier for pharmacist-consumer
interaction.94,100-102 Over 60 percent of consumers in one report said they would not use
pharmacy services related to OTC selection (and minor illness treatment) because of this
reason.94 For people in Saskatoon at this time, it appeared that lack of time was not a big
concern. Only a small proportion of people (15.9 percent) said pharmacists were often
too busy to help them and most (83.4 percent) said pharmacists usually spend as much
time as necessary with them. The diverging results for these two statements suggest that
participants of this study responded reasonably consistently.
6.6 Limitations
All the weaknesses of survey research using a mailed questionnaire apply to this
study.
Given that the sampling frame for this study was the Saskatoon phone book,
several coverage errors could have occurred. For instance, residencies without home
phone numbers, or those who only use cell phones, would be excluded from the sample.
Residences that have unlisted numbers would also not be captured by this method. If
residents moved after the last phone book was published, addresses appearing in the
phone book would be incorrect. In this survey, 411 questionnaires (16 percent; 411 of
2547) went undelivered for this reason.
136

The gender bias of this sampling frame may have altered the proportion of
Saskatoon residents replying with their opinions. Often, a male name appears in the
phone book to represent the household phone number, especially for families. In order to
attenuate this bias, any adults who lived at that address were allowed to answer the
questionnaire, not just the person whose name appeared on the letter. This point was also
emphasized on the cover letter sent with the questionnaire. While an overly strong
response from females (at the expense of males) was anticipated, a reasonably equal
distribution from both genders was realized.
Social desirability could have affected the accuracy of the results. During study
correspondence, the University of Saskatchewan’s letterhead was utilized and
participants would also have noted the researchers were pharmacy professionals. They
were then asked questions related to pharmacy, especially questions associated with
impressions of pharmacists and the care needed when using medicines. Respondents
may have provided answers with a bias towards what they felt the researchers wanted
and/or to place themselves in the best possible light.
Inconsistent use of standard time periods is another possible limitation. In this
survey, several different periods of time were used, often based on usage in other
surveys. Participants at times were asked questions about their past experiences during a
month, while others were to cover a six-month period. This may have lead to confusion
for respondents. By way of extension, memory decay also would be a potential risk.
Answers often relied on respondent memory and the six-month period may have been
too long for accurate recall, especially for the elderly. Frequency of OTC use/purchase
and shopping, for example, would be particularly susceptible to lack of accurate recall.
In this study, several questions asked participants to think what they would do
during the first use/purchase of an OTC product. As could be expected, it might not be
easy for some responders to enter that mindset, or recall their first use or purchase of a
product that took place some time ago. Thus, when answering such questions, they
might provide answers in general, rather than with specific details that might emerge
when they faced the given situations for the first time.
The fifth question in part II of the questionnaire (Appendix C) may also have
been a difficult one to answer, given that participants were asked to select the two most
137

important reasons (from a list of nine) for why they did not always ask for a
pharmacist’s advice. According to the results, choosing the most important two reasons
may not have been an effective approach. A very high proportion of participants (n =
121/921; 13 percent) did not answer this question and, for those who did answer it (n =
800/921), nearly half (n = 371/800; 46.3 percent) did not go on to select two items. It
may have been wiser to ask participants to check “all that apply” or simply ask them to
select the most important one from the reason pool.
Choice of wording for scales or in sentences may have been problematic.
Although five- and seven-point Likert scales and the option of neutral are commonly
used to determine agreement on various statements in similar studies, wording for the
middle point is controversial. The term – neutral – could have meant a respondent did
not have any opinion on the issue, had an opinion but felt it lay between agreement and
disagreement, or they did not understand the meaning of the statement.
While it did not appear to be an issue during pre-testing, the term potency
seemed to confuse some in the formal study. Around three in ten respondents selected
neutral for this statement for both pharmacy and convenience store. For those who
selected this option, 14 respondents commented that they did not understand the exact
meaning of potency in the context given.
Adjectives such as “good selection”, “very few side effects”, “low prices”, “good
quality” are especially open to interpretation by consumers during questionnaire
completion and may have affected our results. Other terminology open for interpretation
was use of the phrase “for any reason” within the context of visits to a convenience store.
Respondents may not have included the simple act of paying for gasoline as constituting
a visit (under the terms of the questionnaire), thinking that a more formal act of entering
the location for a product purchase would be required. If so, figures on numbers of visits
may have been artificially low.
Given the blurring of lines within the retail environment as to what is truly a
pharmacy or a grocery store, it may be difficult for some to distinguish between the two.
Although results of the pre-test did not reveal any apparent difficulty, it could exist. This
may have affected results that called for comparisons of pharmacies to convenience
stores.
138

Respondents were directed to disregard herbal products and vitamins for this
survey. While it was hoped this would streamline data towards what was considered to
be typical OTC medicines, it may have added confusion for the reader and it is unclear
whether responders were able to disregard out impressions of herbals and vitamins
during completion.
An important limitation was a lack of standard criteria to determine practical
significance in relation to statistical significance. To the best of our knowledge, there is
no study providing guidance on this issue.
6.7 Future Research
Findings from this present study provide initial impressions of how consumers
treat OTC medicines sold in pharmacies and in non-pharmacy outlets, but further
research may be warranted. The study of consumer expectations in relation to place of
sale could be conducted again in a nation-wide survey in Canada. Deregulation of
medicines is of national importance and, therefore, understanding the opinions of
consumers across this country is probably necessary. Moreover, if a similar study can be
conducted again, it may provide useful data to help researchers set up criteria to
determine the practical significance of this issue.
Most studies in this area of pharmacy practice, including the one presented here,
provide a pre-determined list of potential patronage motives, and then ask respondents to
rank them on importance. It is suggested that a format allowing consumers to more
openly and freely identify factors important to them (as they purchase OTC medicines)
be considered.
Further research in this area can focus on special groups of consumers.
According to findings of the present study, past shopping experiences may somewhat
influence consumer attitudes toward OTC medicines. Once an OTC product is classified
into Unscheduled status, it can be sold in a non-pharmacy outlet. Since it can be
expected that the number of drugs of this category will increase in the future, it may be
valuable to conduct more research on the group of consumers who purchase OTC
medicines largely from non-pharmacy outlets.
139

CHAPTER 7: CONCLUSION
If a prescription medicine in Canada is deemed safe enough for non-prescription
status, it will generally move through a cascade of drug schedules of lessening
restrictions based on location of sale. From the most to least restrictive, the entity will
start as Schedule II status (pharmacist-only; behind-the-counter), move down to
Schedule III (pharmacy-only), then finally on to Unscheduled status, upon which it can
be sold in any retail outlet. With respect to Schedule II and III, products are limited to
sale in pharmacies under the assumption that doing so helps to ensure patient safety. As
more and more agents attain OTC status and move to the least restrictive legal category,
concern grows amongst pharmacists and legislators for the vigilance shown by the
public during their use. While it does appear the public perceives non-prescription
medicines to be different than those on prescription, a question was raised as to whether
location of sale imparts any effect on consumer expectations.
On the important clinical aspects applicable to typical OTC agents, this does not
appear to be the case. It seems that a phenomenon coined as the de-medicinization of
OTC products is not in play in Saskatoon; location of sale does not appear to influence
consumers’ expectations of OTC medicines along clinical attributes. This finding may
prove useful to legislators involved in the deregulation of medicines. Specifically, it
appears a concern that people will treat these medicines differently just because they are
sold from non-pharmacy locations may be unfounded.
In Saskatoon, most residents were aware that OTC medicines could be purchased
in convenience stores, although most still showed preference for making purchases in
pharmacies. This may be due to different expectations for this outlet – the public may
expect that pharmacies can provide professional help, as well as offer good quality,
lower prices, and a greater variety of products. Furthermore, Saskatoon residents appear
to have healthy attitudes for OTC medicines and realize care is needed when they use
such
140

products. While generally safe, the public also appears ready to ask pharmacists for
assistance if the need so arises.
141

REFERENCES
1. Lunde I. Self-care: What is it? J Soc Admin Pharm 1990; 7: 150-5. 2. Horder J and Horder E. Illness in general practice. Practitioner 1954; 173: 177-87. 3. Lader S. A survey of the incidence of self-medication. Practitioner 1965; 194: 132-
6. 4. Roghmann KJ and Haggerty RJ. The diary as a research instrument in the study of
health and illness behavior. Med Care 1972; 10: 143-63. 5. Freer CB. Self-care: A health diary study. Med Care 1980; 18: 853-61. 6. Knapp DA, Knapp DE. Decision-making and self-medication. Am J Hosp Pharm
1972; 29: 1004-12. 7. Dunnell K and Cartwright A. Medicine takers, prescribers and hoarders. London:
Routledge and Kegan Paul; 1972. 8. Jefferys M, Brotherston JH, Cartwright A. Consumption of medicines on a
working class housing estate. Br J Prev Soc Med 1960; 14: 64-76. 9. Anonymous. Consumer Usage and Attitude Study- - Volume 1. Toronto: Canadian
Facts; 1991. 10. Decima Research. OTC habits and practices: the attitudes and beliefs about over-
the-counter medicines. Ottawa: Drug Information and Research Center (DIRC); 2002.
11. Anonymous. Canadian’s self-care product industry. Ottawa: Nonprescription Drug
Manufacturers Association of Canada; 2001. 12. Anonymous. Spending on prescribed drugs reaches $12.3 billion. Canadian
Institute for Health Information, March 2002. Available at: http://secure.cihi.ca/ cihiweb/dispPage.jsp?cw_page=media_24apr2002_e. Accessed May 30, 2006.
13. Anonymous. Exclusive survey: What consumers are thinking about OTCs. Drug
Store News 1995; Jun: S2. 14. Taylor J. Trends in self-medication. Winnipeg: Annual Meeting of the Canadian
Pharmacists Association; 2002. 15. Bradley C and Blenkinsopp A. The future of self-medication. BMJ 1996; 312: 835-
7.
142
16. Brass E. Changing the status of drugs from prescription to over-the-counter availability. NEJM 2001; 345: 810-6.
17. Anonymous. The distribution of self-medication products in Canada. Ottawa:
Nonprescription Drug Manufacturers Association of Canada; 1990. 18. Loh E, Waruszynski B, Poston J. Cost saving associated with community
pharmacist interventions in Canada: A preliminary economic evaluation of the CPhIS data. Can Pharm J 1996; 129 (1): 43-7, 52-5.
19. Weinkauf DJ and Rowland GC. Patient conditions at the primary care level: A
commentary on resource allocation. Ont Med Rev 1992; 1: 11-15, 61. 20. Temin P. Realized benefits from switching drugs. J Law Econ 1982; 35: 351-69. 21. Vickery DM. A medical perspective. Drug Info J 1985; 19: 155-8. 22. Oster G, Huse DM, Delta TE et al. The risks and benefits of an Rx-to-OTC switch:
The case of over-the-counter H2-blockers. Med Care 1990; 28: 834-52. 23. Hammarström B, Wessling A, Nilsson JLG. Pharmaceutical care for patients with
skin diseases − A campaign year at Swedish pharmacies. J Clin Pharm Ther 1995; 20: 327-34.
24. Oster G, Huse DM, Delta TE et al. The benefits and risks of over-the-counter
availability of nicotine polacrilex (“Nicotine Gum”). Med Care 1996; 34: 389-402. 25. Anderson M, Bolton C, Morgan S, Tremblett K. The economics of self-medication
in Canada. Queen’s Health Policy. Kingston: Queen’s University 1995. Available at: http://www.ndmac.ca/index.cfm?fuseaction=main.DspSubPage&PageID =12&SubPageID=832&fkMainPage=12. Accessed April 30, 2006
26. Evans SW, John DN, Bloor MJ, Luscombe DK. Use of non-prescription advice
offered to the public by community pharmacists. Int J Pharm Pract 1997; 5: 16-25. 27. Anonymous. Health care in Canada 2002. Medicating illness: drug use and cost in
Canada. Canadian Institute for Health Information 2002: 78-89. 28. Reinstein JA. Marketing medicines for self-medication. J Pharm Mark Manage
1996; 10 (2/3): 31-8. 29. Anonymous. Over-the-counter drugs (editorial). Lancet 1994; 343: 1374-5. 30. Bissell P, Ward PR, Noyce PR. Variation within community pharmacy: 2.
Responding to the presentation of symptoms. J Soc Admin Pharm 1997; 14: 105-15.
143
31. Irigoyen MM and Mulvihill MN. The epidemiology of minor illnesses among medical students. J Med Educ 1983; 58: 768-71.
32. Wilkinson IF, Darby DN, Mant A. Self-care and self-medication: An evaluation of
individuals’ health care decisions. Med Care 1987; 25: 965-77. 33. Smith FJ and Salkind MR. Presentation of clinical symptoms to community
pharmacists in London. J Soc Admin Pharm 1990; 7: 221-4. 34. Benjamin H, Motawi A, Smith F. Community pharmacists and primary health care
in Alexandria. J Soc Admin Pharm 1995; 12: 3-11. 35. Banks FR and Keller MD. Symptom experience and health action. Med Care 1971;
9: 498-502. 36. Jones RA, Wiese HJ, Moore RW, Haley JV. On the perceived meaning of
symptoms. Med Care 1981; 19: 710-7. 37. Anonymous. The role of self-care in the treatment of illness: A profile of the
Canadian self-care health product user. Nonprescription Drug Manufacturers Association of Canada 2004. Available at: http://www.ndmac.ca/index.cfm? fuseaction=main.DspSubPage&PageID=10&SubPageID=944&fkMainPage=10. Accessed: April 30, 2006.
38. Anonymous. National Drug Schedules: Outline of the schedules. National
Association of Pharmacy Regulatory Authorities. Available at: http://www.napra.ca/docs/0/92/112/154/139.asp#schI. Accessed: August 25, 2005.
39. Gore MR and Thomas III J. Nonprescription informational services in pharmacies
and alternative stores: Implications for a third class of drugs. J Soc Admin Pharm 1995; 12: 86-99.
40. Martin S. Is a third class of drugs in pharmacy’s future? Am Pharm 1991; NS31
(4): 36-40. 41. Kaufman DW, Kelly JP, Rosenberg L et al. Recent pattern of medication use in the
ambulatory adult population of the United States. JAMA 2002; 287: 337-44. 42. DePinto K. Not ready to counsel: Students need more OTC know-how, J&J/Merck
finds. Drug Topics 1997; Dec 8: 76-9. 43. Anonymous. OTC facts and figures. Consumer Healthcare Products Association.
Available at: http://www.chpa-info.org/ChpaPortal/PressRoom/ Statistics/ OTCFactsand Figures.htm. Accessed May 30, 2006.
144

44. Miceli DL. Pharmaceutical/intermediates 97: A favorable outlook for OTCs. CMR Focus Report 1997, Sept, FR34-5.
45. Akaho EI, Kawasaki C, Uchinashi M. A proposal to improve the medical
insurance and drug information systems in Japan. J Soc Admin Pharm 2001; 18: 200-9.
46. Anonymous. Drug retail sales (1964-2005). Consumer Healthcare Products
Association. Available at: http://www.chpa- info.org/ChpaPortal/PressRoom/ Statistics/OTCRetailSales.htm. Accessed May 30, 2006. 47. Anonymous. Drug expenditures in Canada 1985-2003. Canadian Institute for
Health Information. June, 2004 Available at: http://secure.cihi.ca/cihiweb/ dispPage.jsp?cw_page=PG_283_E&cw_topic=283&cw_rel=AR_80_E. Accessed May 30, 2006.
48. Carbray RT. Impact of a pharmacist’s choice of OTCs. Pharm Times 1992; Nov:
124-5. 49. Maline N. How well do you know your consumer? Drug Store News 1995; Jun:
101-13. 50. Smith EA. Power of persuasion: R.Ph.s influence OTC choices for consumers,
survey finds. Drug Topics 1998; Jul 6: 41. 51. Anonymous. OTCs overview, part 5. (selling over the counter drugs at drugstores)
Drug Store News 1998; May: 1-3 52. Anonymous. Self-medication digest: Bring consumers to the drug store.
Nonprescription Drug Manufacturers Association of Canada1998. Available at: http://www.ndmac.ca/index.cfm?fuseaction=main.dspSubPage&PageID=10&SubPageID=774. Accessed May 30, 2006.
53. Anonymous. 2004 OTC market report. Pharm Post 2004; Apr: 15-33. 54. Northcott HC and Bachynsky JA. Concurrent utilization of chiropractic,
prescription medicines, nonprescription medicines and alternative health care. Soc Sci Med 1993; 37: 431-5.
55. Harris Interactive Inc. Attitudes and beliefs about the use of over the counter
medicines: a dose of reality- a national survey of consumers and health professionals. National Council on Patient Information and Education. (NCPIE); January 2002.
145

56. Decima Research. Public option survey on key issues pertaining to post-market surveillance of marketed health product products in Canada. Ottawa: Health Canada; December 2003.
57. Anonymous. Drug market track. Pharm Post 2001; Mar: 25. 58. Anonymous. OTC sales by category 2002-2005. Consumer Healthcare Products
Association. Available at: http://www.chpainfo.org/ChpaPortal/PressRoom/ Statistics/OTCSalesbyCategory.htm. Accessed May 30, 2006. 59. ACNielsen. OTC market report. Pharm Post 2000; Mar: 41. 60. Heller H. Research Corp. Self-medication in the ‘90s: Practices and perceptions.
Washington, DC: Nonprescription Drug Manufacturers Association; 1992. 61. Segall A. A community survey of self-medication activities. Med Care 1990; 28:
301-10 62. Rabin DL. Use of medicines: A review of prescribed and non-prescribed medicine
use. Med Care Rev 1972; 29: 668-99. 63. Benrimoj SI and Chua SS. Predictors of nonprescription medicine use. J Pharm
Mark Manage 1990; 5 (1): 3-27. 64. Johnson RE and Pope CR. Health status and social factors in nonprescribed drug
use. Med Care 1983; 21: 225-33. 65. Stoller EP. Prescribed and over-the-counter medicine use by the ambulatory
elderly. Med Care 1988; 26: 1149-57. 66. Chaiton A, Spitzer WO, Roberts RS, Delmore T. Patterns of medical drug use – A
community focus. Can Med Assoc J 1976; 114: 33-7. 67. Bush PJ and Rabin DL. Who’s using nonprescription medicines? Med Care 1976;
14: 1014-23. 68. Fisher CM, Corrigan OI, Henman MC. A study of community pharmacy practice:
3. Non-prescribed medicines sales and counseling. J Soc Admin Pharm 1991; 8: 69-75.
69. Christopher LJ, Crooks G, Kilgallon B et al. A pharmacy-based survey of self-
medication. Pharm J 1979; 223: 152-3. 70. Batty GM, Oborne CA, Swift CG, Jackson SHD. The use of over-the-counter
medicine by elderly medical in-patients. Postgrad Med J 1997; 73: 720-22.
146

71. Stoehr GP, Ganguli M, Seaberg EC et al. Over-the-counter medication use in an older rural community: The MoVIES project. J Am Geriatr Soc 1997; 45: 158-65.
72. Andreasen BF and Damsgaard EMS. The consumption of drugs by 75-year-old
individuals living in their own homes. Eur J Pharmacol 2000; 56: 501-9. 73. Itterman RD, Johnson JA, Taylor JG. Health status and self-medication patterns in
Alberta, Canada – Results from a population health survey. J Soc Admin Pharm 2003; 20: 43-52.
74. Hassell K, Noyce PR, Rogers A, et al. A pathway to the GP: The pharmaceutical
‘consultation’ as a first port of call in primary health care. Family Pract 1997; 14: 498-502.
75. The Nuffield Foundation. A report to the Nuffield Foundation 1986. Pharm J 1986;
236: 348-55. 76. Anonymous. Statement of principle: Self-care including self-medication – The
professional role of the pharmacist. Netherlands: International Pharmaceutical Federation; 1996.
77. Allen BE and Suveges LG. Standards of practice – Nonprescription drugs.
National Association of Pharmacy Regulatory Authorities; 1995. 78. Anonymous. Model Standards of Practice for Canadian Pharmacists. National
Association of Pharmacy Regulatory Authorities; 2003. 79. Harding G, Nettleton S, Taylor K. Sociology for pharmacists: An introduction.
Hong Kong: Macmillan Academic and Professional LTD; 1990. 80. Griffle KG. Consumers, R.Ph.s, and M.D.s share views on OTCs. Drug Topics
1995; Sept 18: 52-4. 81. Hassell K, Noyce P, Rogers A et al. Advice provided in British community
pharmacies: What people want and what they get. J Health Serv Res Policy 1998; 3: 219-25.
82. DeSimone E, Peterson C, Carlstedt B. Pharmacist-patient interaction and patient
expectations. Am J Pharm Educ 1977; 41: 167-71. 83. Decima Research. Attitude, Perceptions and Behaviour Relating to Ethical
Medicines: A Research Report to the Department of National Health and Welfare. Ottawa: Drugs Directorate, Health Protection Branch, Department of National Health and Welfare; 1990.
147

84. Ryan S. Canadian pharmacies service study: The willingness of consumers to pay a fee for private consultation with their pharmacist on both prescriptions and OTC products. Don Mills, ON: Upjohn Company; 1984.
85. Anonymous. Survey on OTC counselling & recommendations. Pharm Post 2003;
Apr: 65. 86. Phelan MJ and Jepson MH. The advisory role of the general practice pharmacist.
Pharm J 1980; 224: 584-8. 87. Blythe T and Armstrong B. Clinical pharmacy in retail pharmacies: A survey of
requests made by retail pharmacy clients. Aust J Pharm Sci 1977; 6 (3): 91-5. 88. Anonymous. Most pharmacists give good advice. Chem Drug 1984; 222: 857. 89. Hardisty B. Do assistants take the pharmacists’ role in counter-prescribing? Chem
Drug 1982; 218: 804-5, 808. 90. Blom A and Rens J. Information about over the counter medication: The role of
the pharmacy. Patient Educ Couns 1989; 14: 181-9. 91. Marklund B, Karlsson G, Bengtsson C. The advisory service of pharmacies as an
activity of its own and as part of collaboration with primary health care services. J Soc Admin Pharm 1990; 7: 111-6.
92. Taylor J and Suveges L. Selection of cough, cold, and allergy products: Rate of
consumer-pharmacist interaction. J Soc Admin Pharm 1992; 9; 59-65. 93. Taylor J and Suveges L. Frequency of consumer-pharmacist interaction during the
selection of nonprescription medications. Can Pharm J 1994; 127 (7): 17-30. 94. Krska J and Kennedy E. Expectations and experiences of customers purchasing
over-the-counter medicines in pharmacies in the north of Scotland. Pharm J 1996; 256: 354-6.
95. Wroblewski J. How to improve your communication skills. Drug Topics 1982; Oct
18: 45-9. 96. Rantucci M and Segal H. Over-the-counter Medication: Outcome and effectiveness
of patient counselling. J Soc Admin Pharm 1986; 3: 81-91. 97. Taylor J and Suveges L. Got a minute? Timing the selection process during the
purchase of cough, cold and allergic rhinitis products. Can Pharm J 1991; 124 (10): 507, 510-511, 526.
148
98. Stewart K, Garde T, Benrimoj S. Over-the-counter medication sales in community pharmacy: Direct product requests and symptom presentation. Aust J Pharm 1985; 66: 979-82.
99. Report from Panacea Workshop – SPhA Conference 96. Regina: Saskatchewan
Pharmaceutical Association; 1996. 100. Anonymous. Community pharmacists and self-medication: Results of a national
survey of community pharmacist’s attitudes. Ottawa: ABM Research; 1992. 101. Eng HJ, McCormick WC, Kimberlin CL. First year’s experience with the Florida
pharmacist self-care consultant law: The pharmacist perspective. J Pharm Mark Manage 1990; 4 (3): 15-32.
102. Hendry F. Time, Staff needed for OTC counseling. Pharm Post 1996; Mar: 27. 103. Rutter PM, Hunt AJ, Darracott R, Jones IF. A subjective study of how community
pharmacists in Great Britain spend their time. J Soc Admin Pharm 1998; 15: 252-61.
104. Bell HM, McElney JC, Hughes CM, Woods A. A qualitative investigation of the
attitudes and opinions of community pharmacists to pharmaceutical care. J Soc Admin Pharm 1998; 15: 284-95.
105. Smith G and Einarson T. Survey of consumer users of a statewide drug
information service. Am J Hosp Pharm 1985; 42: 1557-61. 106. Taylor J. Reasons consumers do not ask for advice on non-prescription medicines
in pharmacies. Int J Pharm Pract 1994; 2: 209-14. 107. Anonymous. Community Pharmacy in Canada -- The 1996 Pharmacy Business
Trends Report. Toronto: Pharm Post; 1996. 108. Krska J and Kennedy E. An audit of responding to symptoms in community
pharmacy. Int J Pharm Pract 1996; 4: 129-35. 109. Harper R, Harding G, Savage I, et al. Consultation areas in community pharmacies:
An evaluation. Pharm J 1998; 261: 947-50. 110. Anonymous. Roper health study. Reader’s Digest; 1995. 111. Gross PF. The economics of alternative types of health care: The benefits and risks
of self-care and less government regulation. J Soc Admin Pharm 1990; 7: 190-8.
149

112. Anonymous. Everyday Health Care: Highlights of a consumer study of self-medication in Great Britain. London: The Proprietary Association of Great Britain; 1987.
113. Moss C and Kennedy J. Encourage self-care in a primary care setting. Available at:
http://www.medicine-chest.co.uk. Accessed May 30, 2006 114. Wyke S, Hunt K, Ford G. Gender differences in consulting a general practitioner
for common symptoms of minor illness. Soc Sci Med 1998; 46: 901-6. 115. Corney RH. Sex differences in general practice attendance and help seeking for
minor illness. J Psychosom Res 1990; 34: 525-34. 116. Bell HM, McElnay JC, Hughes CM. Societal perspectives on the role of the
community pharmacist and community-based pharmaceutical services. J Soc Admin Pharm 2000; 17: 119-28.
117. Evans SW and John DN. Who would the public ask for advice on selected
symptoms? Pham J 1997; 259 (Supp): R41. 118. Koos EL. The Health of Regionville. New York: Hafner Publishing Company, Inc.;
1967. 119. Anderson R, Anderson O, Smedby B. Perception of and response to symptoms of
illness in Sweden and the United States. Med Care 1968; 6: 18-30. 120. Hetherington RW and Hopkins CE. Symptom sensitivity: Its social and cultural
correlates. Health Serv Res 1969; 4: 63-75. 121. Ludwig EG and Gibson G. Self perception of sickness and the seeking of medical
care. J Health Soc Behav 1969; 10: 125-33. 122. Safer MA, Tharps QJ, Jackson TC, Leventhal H. Determinations of three stages of
delay in seeking care at a medical clinic. Med Care 1979; 17: 11-29. 123. Verbrugge LM and Ascione FJ. Exploring the iceberg: Common symptoms and
how people care for them. Med Care 1987; 6: 539-69. 124. Anonymous. 2000 survey on OTC counselling & recommendations. Pharm Post
2001; Mar: 62. 125. Anonymous. Consumer information resources in self-care. Nonprescription Drug
Manufacturers Association of Canada. Available at http://www.ndmac.ca/publicat/smd9911.html. Accessed: May 30, 2006.
150

126. Morrow N, Hargie O, Woodman C. Consumer perceptions of and attitudes to the advice-giving role of community pharmacists. Pharm J 1993; 251: 25-7.
127. Hamilton A. An evaluation of the extended role of the community pharmacists in
rural areas of the west of Ireland. J Soc Admin Pharm 1998; 15: 42-9. 128. Smith M and Sharp T. A study of pharmacists’ involvement in drug use by the
elderly. Drug Intell Clin Pharm 1984; 18: 525-9. 129. Bryant B and Mason H. Nonprescription drug use among hospitalized pediatric
patients. Am J Hosp Pharm 1983; 40: 1669-73. 130. ACNielsen. HealthVision 1999. Ottawa: Nonprescription Drug Manufacturers
Association of Canada; 1999. 131. Wood V. OTC knowledge from spectrum of sources. Pharm Post 2002; Apr: 67. 132. Sooksrpwong C and Leelanikul S. Perspectives on self-medication practices in
Thailand. J Soc Admin Pharm 2001; 18: 75-80. 133. Benrimoj SI and Reisenwitz TH. Consumer satisfaction with over-the-counter
products in pharmacy and non-pharmacy students. J Pharm Mark Manage 1986; 1 (1): 69-77.
134. Briesacher B and Corey R. Patient satisfaction with the pharmaceutical services at
independent and chain pharmacies. Am J Health Syst Pharm 1997; 54: 531-6. 135. Morrison A and Wertheimer AI. Evaluation of studies investigating the
effectiveness of pharmacists’ clinical services. Am J Health Syst Pharm 2001; 58: 569-77.
136. Johnson JA, Coons SJ, Hays RD. The structure of satisfaction with pharmacy
services. Med Care 1998; 36: 244-50. 137. Ried LD, Wang F, Young H, Awiphan R. Patients’ satisfaction and their
perception on the pharmacist. J Am Pharm Assoc 1999, 39: 835-42. 138. Cerulli J. Patients’ perceptions of independent community pharmacists. J Am
Pharm Assoc 2002; 42: 279-82. 139. Kucukaralan S and Schommer JC. Patients’ expectations and their satisfaction with
pharmacy services. J Am Pharm Assoc 2002; 42: 489-96. 140. Johnson KA, Parker JP, McCombs JS, Cody M. The Kaiser permanents/USC
patient consultation study: Patient satisfaction with pharmaceutical services. Am J Health Syst Pharm 1998; 55: 2621-9.
151

141. Gore P and Madhavan S. Credibility of the sources of information for non-prescription medicines. J Soc Admin Pharm 1993; 10: 109-122.
142. Anonymous. An OTC trend advisory: Pharmacists recommend Robitussin, Tylenol,
and Benadryl most. Am Drug 1995; Jul: 19-25. 143. Gannon K. Patients content with OTC information from R.Ph.s. Drug Topics 1990;
Mar: 26-7. 144. Caranasos GJ, Stewart RB, Cluff LE. Drug-induced illness leading to
hospitalization. JAMA 1974; 228: 713-7. 145. Litovitz T and Manoguerra A. Comparison of pediatric poisoning hazards: An
analysis of 3.8 million exposure incidents: a report from the American Association of Poison Control Centers. Pediatrics 1992; 89: 999-1006.
146. Chua SS, Benrimoj SI, Stewart K et al. Usage of non-prescription medications by
hypertensive patients. J Soc Admin Pharm 1991; 8: 33-45. 147. Lamb C and Cantrill JA. Asthma patients’ usage of over-the-counter medicines
and complementary remedies. Pharm J 1995; 254: 802-4. 148. Sihvo S, Klaukka T, Martikainen J et al. Frequency of daily over-the-counter drug
use and clinically significant over-the-counter – prescription drug interactions in the Finnish adult population. Eur J Clin Pharmacol 2000; 56: 495-9.
149. Honig PK and Gillespie BK. Drug interactions between prescribed and over-the-
counter medication. Drug Saf 1995; 13: 296-303. 150. Honig PK and Gillespie BK. Clinical significance of pharmacokinetic drug
interactions with over-the-counter (OTC) drugs. Clin Pharmacokinet 1998; 35: 167-71.
151. Pellegrini L and Reddy SK. Retail and marketing channels: Economic and
marketing perspectives on producer-distributor relationships. London and New York: Routledge; 1989.
152. Zimmer MR and Golden LL. Impressions of retail stores: A content analysis of
consumer images. J Retail 1988; 64 (3):265-93. 153. Lessig PV. Consumer store images and store loyalties. J Mark 1973; 37 (Oct): 72-4. 154. Kunkel JH and Berry LL. A behavioral concept of retail images. J Mark 1968; 32
(Oct): 21-7.
152

155. Korgaonkar PK, Lund D, Price B. A structural equations approach toward examination of store attitude and store patronage behavior. J Retail 1985; 61 (2): 39-60.
156. Doyle P and Fenwick I. How store image affects shopping habits in grocery chains.
J Retail 1975; 50 (4): 39-52. 157. Lindquist JD. Meaning of image: A survey of empirical and hypothetical evidences.
J Retail 1974-75; 50 (4): 29-38. 158. McElnay JC, Nicholl AJ, Grainger-Rousseau TJ. Role of community pharmacist-
survey of public opinion in North Ireland. Int J Pharm Pract 1993; 2: 95-100. 159. Stergachis A, Maine LL, Brown L. The 2001 national pharmacy consumer survey.
J Am Pharm Assoc. 2002; 42: 568-76. 160. Anonymous. The Ratiopharm CFP report on pharmacy services: Consumers’
perception of pharmacy. Mississauga, ON, Canada: Ratiopharm Inc.; 2004. 161. Gore MR and Thomas III J. Store image as a predictor of store patronage for
nonprescription medication purchases: A multiattribute model approach. J Pharm Mark Manage 1995; 10 (1): 45-68.
162. Airaksinen M, Ahonen R, Enlund H. Pharmacy in the health food products market:
Consumer experiences from Finland. J Pharm Mark Manage 1994; 8 (1): 207-21. 163. Servizio di Informazione e di Education Sanitaria, Farmacie Comunali Italiane.
What information for the patient? Large scale pilot study on experimental package inserts giving information on prescribed and over the counter drugs. BMJ 1990; 301: 1261-5.
164. Hassell K, Rogers A, Noyce P. Community pharmacy as a primary health and self-
care resource: A framework for understanding pharmacy utilization. Health Soc Care Community 2000; 8 (1): 40-9.
165. Uddenberg N. Medications as a cultural phenomenon. J Soc Admin Pharm 1990; 7:
179-83. 166. Smith FJ and Martin C. OTC medicines: A survey of the view of consumers.
Pharm J 1998; 261: R23. 167. Simon ME and Kuehl PG. FDA listens: A survey of consumer opinion on the
safety of medicines. FDA Consum 1973; 7 (4): 6-9. 168. Population of census metropolitan areas. Statistics Canada; July 2002.
153

169. Confidence levels and sample size. Wilson Research Group. Available at: http://www.wilsonresearch.com/main/sample.html Accessed May 30, 2006
170. Sample size calculator. The Survey System. Available at:
http://www.surveysystem.com. Accessed May 30, 2006 171. Thomas III J and Shefcheck SL. Consumers’ perceptions of access to medications
and attitudes toward regulatory options. J Soc Admin Pharm 1998; 15: 149-63. 172. Anonymous. 2000 survey on OTC counselling & recommendations. Pharm Post
2001; Mar: 42 173. Gore P, Madhavan S, McClung G et al. Consumer involvement in nonprescription
medicine purchase decision. J Health Care Mark 1994; 14 (2): 17-23. 174. Smith F. Health services research methods in pharmacy: Survey research: (1)
Design, samples and response. Int J Pharm Pract 1997; 5: 152-66. 175. Bradley CP, Riaz A, Tobias RS, Riley D. Patient attitudes to over-the-counter
drugs and possible professional responses to self-medication. Family Pract 1998; 15: 44-50.
176. Barnett CW, Hopkins WA, Nykamp D, Braden L. Marketing the pharmacist’s role
in over-the-counter drug product selection. J Pharm Mark Manage 1988; 3 (2): 77-85.
177. MacKeigan LD and Larson LN. Development and validation of an instrument to
measure patient satisfaction with pharmacy services. Med Care 1989; 27: 522-36. 178. Mangione TW. Mail surveys: Improving the quality. London: SAGE Publications;
1995. 179. Linsky AS. Stimulating responses to mailed questionnaires: A review. Public Opin
Q 1975; 39: 82-101. 180. Roberts RE, McCrory OF, Forthofer RN. Further evidence on using a deadline to
stimulate responses to a mail survey. Public Opin Q 1978; 42: 407-10. 181. House JS, Gerber W, McMichael AJ. Increasing mail questionnaire response: A
controlled replication and extension. Public Opin Q 1977; 41: 95-9. 182. Kanuk L and Berenson C. Mail surveys and response rates: A literature review. J
Mark Res 1975; 12: 440-53. 183. Kimball AE. Increasing the rate of return in mail surveys. J Mark 1961; 25: 63-5.
154

184. McCrohan KF and Lowe LS. A cost/benefit approach to postage used on mail questionnaires. J Mark 1981;45: 130-3.
185. Pressley MM and Tullar WL. A factor interactive investigation of mail survey
response rates from a commercial population. J Mark Res 1977; 14: 108-11. 186. Vocino T. Three variables in stimulating responses to mailed questionnaires. J
Mark 1977; 41: 76-7. 187. Yammarino FJ, Skinner SJ, Childers TL. Understanding mail survey response
behavior. Public Opin Q 1991; 55: 613-39. 188. Dawis RV. Scale construction. J Couns Psychol 1987; 34(4): 481-9. 189. Couch JV. Fundamentals of statistics for the behavioral sciences 2nd edition. New
York: West Publishing Company; 1987. 190. Salant P and Dillman D. How to conduct your own survey. New York: Wiley &
Sons; 1994. 191. Alexander G, Mohajir N, Meltzer D. Consumers’ perceptions about risk of and
access to nonprescription medications. J Am Pharm Assoc 2005; 45: 363-70.
192. Porteous T, Bond C, Hannaford P, Sinclair H. How and why are non-prescription analgesics used in Scotland? Family Pract 2005; 22: 78-85.
193. Hammond EC. Some preliminary findings on physical complaints from a
prospective study of 1,064,004 man and women. Am J Public Health 1964; 54:11-23.
194. Verbrugge LM. Triggers of symptoms and health care. Soc Sci Med 1985; 20:
855-76.
195. Ballantyne P, Clarke P, Marshman J et al. Use of prescribed and non-prescribed medicines by the elderly: Implications for who chooses, who pays and who monitors the risks of medicines. Int J Pharm Pract 2005; 13: 133-40.
196. Wazaify M, Shields E, Hughes C, McElnay J. Societal perspectives on over-the-
counter (OTC) medicines. Family Pract 2005; 22: 170-76.
155

APPENDICES
156
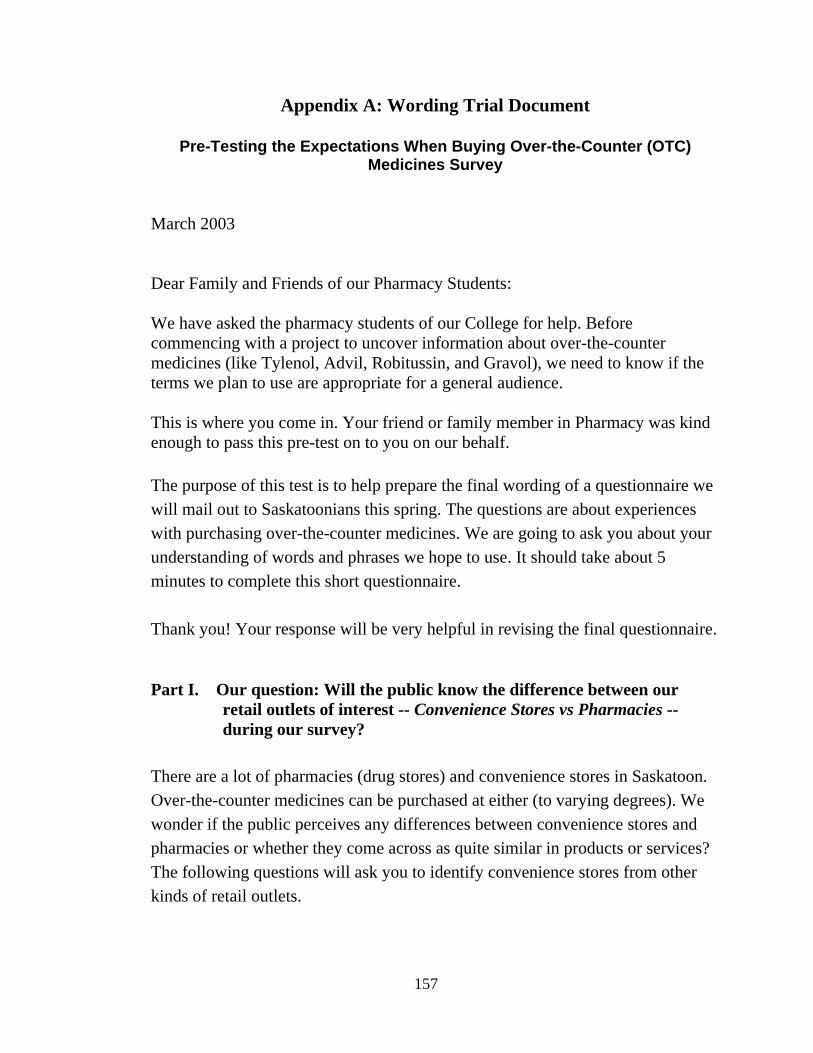
Appendix A: Wording Trial Document
Pre-Testing the Expectations When Buying Over-the-Counter (OTC) Medicines Survey
March 2003 Dear Family and Friends of our Pharmacy Students: We have asked the pharmacy students of our College for help. Before commencing with a project to uncover information about over-the-counter medicines (like Tylenol, Advil, Robitussin, and Gravol), we need to know if the terms we plan to use are appropriate for a general audience. This is where you come in. Your friend or family member in Pharmacy was kind enough to pass this pre-test on to you on our behalf. The purpose of this test is to help prepare the final wording of a questionnaire we will mail out to Saskatoonians this spring. The questions are about experiences with purchasing over-the-counter medicines. We are going to ask you about your understanding of words and phrases we hope to use. It should take about 5 minutes to complete this short questionnaire. Thank you! Your response will be very helpful in revising the final questionnaire. Part I. Our question: Will the public know the difference between our
retail outlets of interest -- Convenience Stores vs Pharmacies -- during our survey?
There are a lot of pharmacies (drug stores) and convenience stores in Saskatoon. Over-the-counter medicines can be purchased at either (to varying degrees). We wonder if the public perceives any differences between convenience stores and pharmacies or whether they come across as quite similar in products or services? The following questions will ask you to identify convenience stores from other kinds of retail outlets.
157

1. First, do you feel there is a clear difference between convenience stores and pharmacies with regard to products or services?
YES NO NOT SURE
2. The following is a list of retail outlets in Saskatoon. Please answer (by circling
YES or NO) to which you feel are so-called convenience stores AND whether you have ever shopped at the store in question.
Store Names Is this a “Convenience Store”? Have you shopped there?
Circle Centre Pharmacy YES NO YES NO
Extra Foods YES NO YES NO
Husky Gas and Food YES NO YES NO
IGA Grocery YES NO YES NO
Lakeview Pharmacy YES NO YES NO
Mac’s Stores YES NO YES NO
PharmaSave YES NO YES NO
7- Eleven YES NO YES NO
Safeway Food and Drug YES NO YES NO
Sears Department Store YES NO YES NO
Shell Gas and Food Store YES NO YES NO
Shoppers Drug Mart YES NO YES NO
Stop’N’Go Confectionary YES NO YES NO
158

Part II. Our question: Will the public be comfortable with the medicine-related terms we are planning to use?
3. In this part, please consider the meanings of the following pairs of words that can be associated with medicines. In the left column below are the word pairings. To you, are the terms in each pair SIMILAR or DIFFERENT? Please circle your response in the column on the right. Terms Are the meanings similar or different?
i) Cost and Price SIMILAR DIFFERENT
ii) Safety and Effectiveness SIMILAR DIFFERENT
iii) Price and Safety SIMILAR DIFFERENT
iv) Effectiveness and Potency SIMILAR DIFFERENT If you can, could you tell us why you chose the response you did for
effectiveness and potency?
______________________________________________________
______________________________________________________
______________________________________________________
v) Side Effect and Potency SIMILAR DIFFERENT
vi) Price and Effectiveness SIMILAR DIFFERENT
vii) Safety and Side Effect SIMILAR DIFFERENT
If you can, could you tell us why you chose the response you did for safety and side effect?
_____________________________________________________
_____________________________________________________
_____________________________________________________
159

Terms Are the meanings similar or different?
viii) Side Effect and Price SIMILAR DIFFERENT
ix) Effectiveness and Side Effect SIMILAR DIFFERENT
x) Price and Potency SIMILAR DIFFERENT
Part III. Now, a few questions of a personal nature to help us prepare for the survey this spring. 4. Have you ever purchased an over-the-counter medicine in a pharmacy? Check one box.
YES
NO
5. Have you ever purchased an over-the-counter medicine in a convenience store? Check one box.
YES
NO
6. The year in which you were born was ____________
7. Your gender: Male
Female
160

8. Would you be interested in participating in a 5-minute telephone interview in the next 3 weeks to discuss shopping experiences involving such medicines?
NO
YES If yes, please leave your name (Print) _________________
And telephone number _____________________________
Thank you for completing this questionnaire. Please seal it in the envelope provided and have the pharmacy student drop it off at the General Office of the College of Pharmacy and Nutrition. If you have any questions, please feel free to contact Helen Lo (M.Sc. student) at 966-6346. I am working under the supervision of Jeff Taylor at 966-5328.
161

Appendix B: a Working Version of the Questionnaire
Your Expectations when Buying Over-The-Counter Medicines:
A Survey of Saskatoon Residents
Thank you for agreeing to complete this survey. Our goal is to improve upon the care people receive when using over-the-counter (OTC) medicines. Part I ⎯ In Saskatchewan, people can buy OTC medicines in places such as pharmacies and convenience stores (like 7-11 and Mac’s). We would now like to ask a few general questions about these medicines. There are no right or wrong responses; we are just interested in your experiences.
1. Were you aware that such products could be purchased in convenience stores? Check one box.
Yes No
2. Have you ever purchased an OTC product in a convenience store? Check one box.
Yes If yes, how many times did you buy OTC medicines from convenience stores in the past six months? Check one box.
No None
1 time 2 times More than 2 times→ Please indicate how
many times:____ Can’t recall
Can’t recall
3. Have you ever purchased an OTC product in a pharmacy? Check one box.
Yes No
Can’t recall
If yes, how many times did you buy OTC medicines from pharmacies in the past six months? Check one box. None 1 time 2 times More than 2 times→ Please indicate how
many times:_____ Can’t recall
162

4. How many times did you visit a pharmacy FOR ANY REASON in the past 30 days? Check one box.
None
1 time
2 times
More than 2 times → Please indicate how many times:__________
Can’t recall
5. How many times did you visit a convenience store FOR ANY REASON in the past 30
days? Check one box.
None
1 time
2 times
More than 2 times → Please indicate how many times:__________
Can’t recall
6. In the past 30 days, how many different OTC medicines have you taken? Check one box.
None
One
Two
More than two → Please indicate how many different OTC medicines:______
Can’t recall
7. In the past 30 days, how many different prescription medicines have you taken? Check
one box.
None
One
Two
More than two → Please indicate how many different prescription medicines: __
Can’t recall
163

8. Have you ever experienced a negative reaction or side effect from taking an OTC medicine? Check one box.
Yes No Can’t recall
Part II ⎯ The next few questions relate to where and how you might seek information regarding OTC medicines.
9. Do you read the information on an OTC medicine’s package when BUYING a product
for the first time?
If yes, when you look at the package, including the front, back, and sides, what information do you read?
Directions for use
The symptoms it treats
Active ingredient(s)
Warnings (about using it with other drugs or conditions)
Possible side effects
Other________________________________________
No
Yes 10. Do you read the information on an OTC medicine’s package when USING a product
for the first time?
If yes, when you look at the package, including the front, back, and sides, what information do you read?
Directions for use
The symptoms it treats
Active ingredient(s)
Warnings (about using it with other drugs or conditions)
Possible side effects
Other________________________________________
No
Yes
164

11. In general, do you ASK a medical doctor for advice when you need an OTC medicine? Check one box.
Always Usually Sometimes Occasionally
Never
12. Have you ever RECEIVED advice from a pharmacist regarding an OTC medicine? Check one box.
Yes No Can’t recall
13. Do you generally ASK a pharmacist for advice when buying an OTC medicine? Check
one box.
Always Usually If you have NOT asked a pharmacist for advice when buying
an OTC product, why not? Please check the two most important reasons to you.
___ I usually forget to ask
___ I do not have difficulty in selecting products
___ I am generally buying the product for someone else
___ I have used the medicines before with good results
___ I generally receive advice from a doctor
___ I am usually too busy to stop
___ Pharmacists are too busy to talk to me
___ I never buy such products
___ I do not trust pharmacists
___ I generally buy OTCs in places other than pharmacies
___ Other:_____________________________________ _____________________________________ _____________________________________
Sometimes Occasionally Never
165

Part III ⎯ The next few questions deal with common symptoms and product effectiveness. 14. Over the past SIX months, have you personally experienced any of the following
symptoms? Check all that apply.
A cold or flu Dry skin A headache Constipation Muscle aches Heartburn Allergies of the nose and/or eyes A sore back Difficulty getting to sleep
15. Please indicate whether or not you have used any of the following types of OTC products over the past SIX months? If yes, please go to the column on the right to circle the number for how effective you found the medicine (based on your experiences).
Types (1) Cold remedies
(2) Cough remedies
(3) Pain relievers
(4) Antihistamines
(5) Sleeping aids
(6) Stop-smoking patch
(7) Upset stomach
remedies
(8) Laxatives
(9) Dry skin lotions
(10) Sore muscle rubs
Please indicate which you have used
NO YES
⇒ ⇒ ↓
⇒ ⇒ ↓
⇒ ⇒ ↓
⇒ ⇒ ↓
⇒ ⇒ ↓
⇒ ⇒ ↓
⇒ ⇒ ↓
⇒ ⇒ ↓
⇒ ⇒ ↓
⇒ ⇒
I found that the medicine works for me Strongly Strongly Disagree Disagree Unsure Agree Agree 1 2 3 4 5 1 2 3 4 5 1 2 3 4 5 1 2 3 4 5 1 2 3 4 5 1 2 3 4 5 1 2 3 4 5 1 2 3 4 5 1 2 3 4 5
1 2 3 4 5
166

16. Overall, how would you rate your current health?
Excellent Fair Very good Poor Good Not sure
Part IV ⎯ OTC medicines are quite popular. We are interested in your impressions of these medicines. For this section, there are 8 statements below. For each one, please circle the number at the right that best describes your opinion. The scales range from 1 (strongly disagree) to 5 (strongly agree).
Statements
1. It is generally safe to take several OTC medicines at a time.
2. When using an OTC medicine, you should be careful with it.
Please 3. OTC medicines rarely cause side effects.
4. I read the instructions carefully before taking an OTC medicine for the first time.
5. Generally, I find OTC medicines to be less effective than prescription medicines.
6. If I can buy medicines without a prescription,
that means they are safe to use beyond recommended doses.
In your opinion
Strongly StronglyDisagree Disagree Unsure Agree Agree
1 2 3 4 5
1 2 3 4 5 1 2 3 4 5 1 2 3 4 5 1 2 3 4 5
1 2 3 4 5
1 2 3 4 5 1 2 3 4 5
7. Use of some prescription medicines with certain OTC medicines can cause problems.
8. It can be dangerous to use certain OTC medicines if you also have certain medical conditions.
167
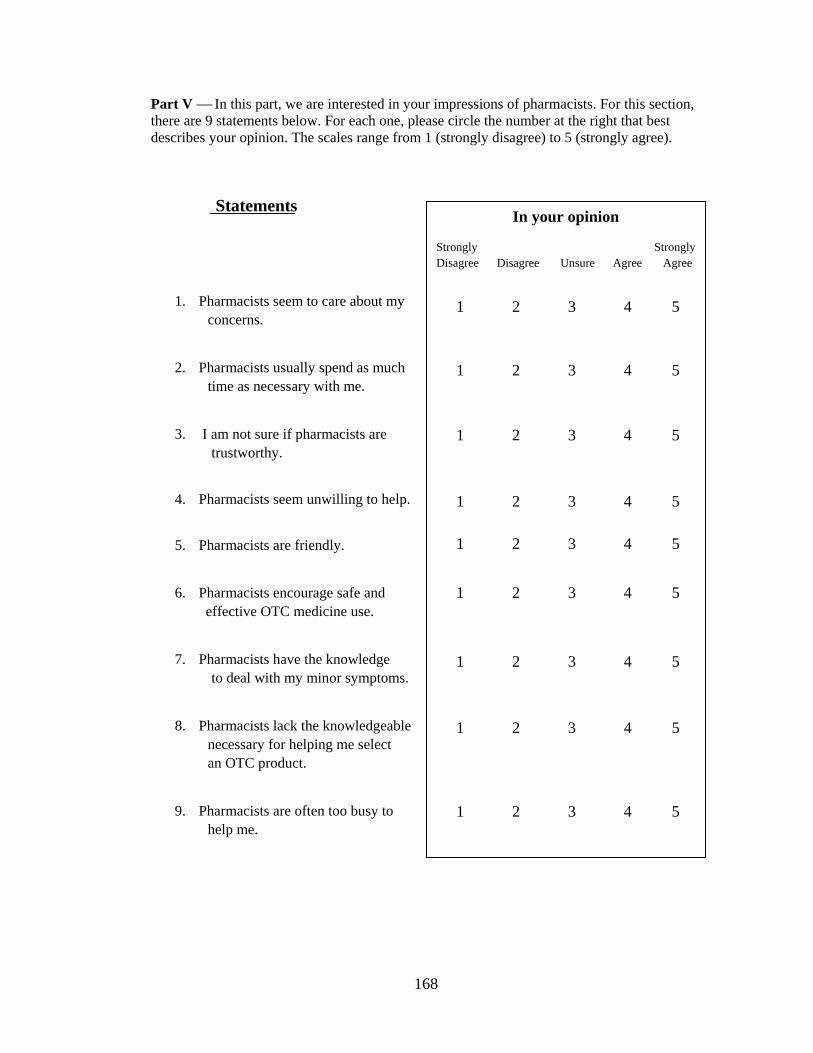
Part V ⎯ In this part, we are interested in your impressions of pharmacists. For this section, there are 9 statements below. For each one, please circle the number at the right that best describes your opinion. The scales range from 1 (strongly disagree) to 5 (strongly agree).
Statements
In your opinion
Strongly StronglyDisagree Disagree Unsure Agree Agree
1 2 3 4 5 1 2 3 4 5
1 2 3 4 5
1 2 3 4 5 1 2 3 4 5 1 2 3 4 5
1 2 3 4 5 1 2 3 4 5
1 2 3 4 5
1. Pharmacists seem to care about my concerns.
2. Pharmacists usually spend as much time as necessary with me.
3. I am not sure if pharmacists are trustworthy.
4. Pharmacists seem unwilling to help.
5. Pharmacists are friendly.
6. Pharmacists encourage safe and
effective OTC medicine use.
7. Pharmacists have the knowledge to deal with my minor symptoms.
8. Pharmacists lack the knowledgeable necessary for helping me select an OTC product.
9. Pharmacists are often too busy to help me.
168

Part VI ⎯ In Canada, people can buy OTC medicines in many places. We are interested in two such places – pharmacies and convenience stores (like 7-11R and Mac’sR) and your expectations of each. We will be asking you to compare these two locations. If you have purchased OTC medicines from both locations, or even just one, please continue with the survey. If you have never purchased an OTC product from either, we would still like to know what you might expect and also ask that you continue with the survey. On the next page, there will be two columns on the right – one for OTC medicines sold in a convenience store and one for OTC medicines sold in pharmacies. For each question, please circle a number from each column, regarding what you would expect as a customer at each location. The scales range from 1 (strongly disagree) to 7 (strongly agree). AS AN EXAMPLE, if you feel strongly that short line-ups at the check-out would be desirable at both locations, you would select a high number under both columns ...
Item In a convenience store In a pharmacy
Strongly Strongly Strongly Strongly Disagree Neutral Agree Disagree Neutral Agree
I expect no line-ups at the 1 2 3 4 5 6 7 1 2 3 4 5 6 7 check-out area
FOR THIS SAME EXAMPLE, if what you expect differs at each location, you might have
done something like this …
In a convenience store In a pharmacy
Strongly Strongly Strongly Strongly
Disagree Neutral Agree Disagree Neutral Agree
I expect no line-ups at the 1 2 3 4 5 6 7 1 2 3 4 5 6 7 check-out area Please proceed …
169

Now, here are the items to consider: Please select a number in EACH column
Items
1. I expect a good selection of OTC medicines. 2. I expect OTC medicines to be effective. 3. I expect OTC medicines to be safe. 4. I expect extensive infor-
mation on the package. 5. I expect OTC medicines to be potent. 6. I expect OTC medicines to have very few side effects.
7. I expect to find OTC medicines
In a convenience store Strongly StronglyDisagree Neutral Agree
1 2 3 4 5 6 7
1 2 3 4 5 6 7
1 2 3 4 5 6 7
1 2 3 4 5 6 7
1 2 3 4 5 6 7
1 2 3 4 5 6 7
1 2 3 4 5 6 7
1 2 3 4 5 6 7
1 2 3 4 5 6 7
1 2 3 4 5 6 7
1 2 3 4 5 6 7
In a pharmacy Strongly StronglyDisagree Neutral Agree
1 2 3 4 5 6 7
1 2 3 4 5 6 7
1 2 3 4 5 6 7
1 2 3 4 5 6 7
1 2 3 4 5 6 7
1 2 3 4 5 6 7
1 2 3 4 5 6 7
1 2 3 4 5 6 7
1 2 3 4 5 6 7
1 2 3 4 5 6 7
1 2 3 4 5 6 7
I have used before.
8. I expect low prices on OTC medicines.
9. I expect OTC medicines to be less effective than prescription medicines.
10. I expect professional help. 11. I expect to find good quality
products.
170
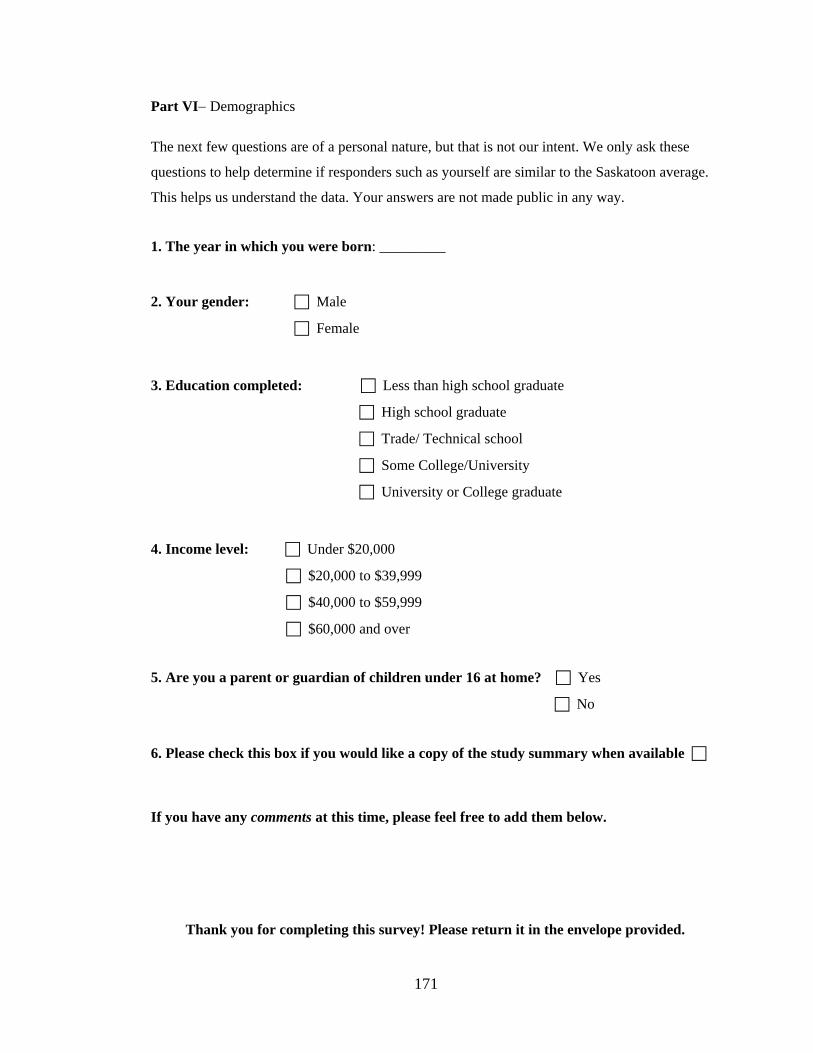
Part VI− Demographics The next few questions are of a personal nature, but that is not our intent. We only ask these
questions to help determine if responders such as yourself are similar to the Saskatoon average.
This helps us understand the data. Your answers are not made public in any way.
1. The year in which you were born: _________
2. Your gender: Male
Female
3. Education completed: Less than high school graduate
High school graduate
Trade/ Technical school
Some College/University
University or College graduate
4. Income level: Under $20,000
$20,000 to $39,999
$40,000 to $59,999
$60,000 and over
5. Are you a parent or guardian of children under 16 at home? Yes
No
6. Please check this box if you would like a copy of the study summary when available If you have any comments at this time, please feel free to add them below.
Thank you for completing this survey! Please return it in the envelope provided.
171

Appendix C: The Final Version of the Questionnaire
Your Expectations when Buying Over-The-Counter Medicines:
A Survey of Saskatoon Residents
Thank you for agreeing to complete this survey. Our goal is to improve upon the care people receive when using over-the-counter (OTC) medicines. Part I ⎯ In Saskatchewan, people can buy OTC medicines in places such as pharmacies (like Shoppers Drug Mart, Safeway Pharmacy, The Medicine Shoppe, PharmaSave etc.) and convenience stores (like 7-11 and Mac’s). We would now like to ask a few general questions about these medicines. There are no right or wrong responses; we are just interested in your experiences. Note: OTC medicines in this case do not include vitamins and herbals. 1. Before reading the attached letter, were you aware that OTC products could be
purchased in convenience stores? Check one box.
Yes No
2. Have you ever purchased (for yourself or for someone else) an OTC product in a
convenience store? Check one box.
If yes, how many times did you buy OTC medicines from convenience stores in the PAST SIX MONTHS? Check one box.
Yes No Can’t recall
None
1 time 2 times
More than 2 times→ Please indicate how many times:____
Can’t recall
3. Have you ever purchased (for yourself or for someone else) an OTC product in a
pharmacy? Check one box.
Yes No
Can’t recall
If yes, how many times did you buy OTC medicines from pharmacies in the PAST SIX MONTHS? Check one box. None 1 time 2 times More than 2 times→ Please indicate how many
times:_____ Can’t recall
172

4. How many times did you visit a pharmacy FOR ANY REASON in the past 30 days? Check one box.
None
1 time
2 times
More than 2 times → Please indicate how many times:__________
Can’t recall
5. How many times did you visit a convenience store FOR ANY REASON in the past 30
days? Check one box.
None
1 time
2 times
More than 2 times → Please indicate how many times:__________
Can’t recall
6. In the past 30 days, how many DIFFERENT OTC medicines have you personally taken
(or used)? Check one box.
None
One
Two
More than two → Please indicate how many different OTC medicines:______
Can’t recall
7. In the past 30 days, how many DIFFERENT prescription medicines have you personally
taken (or used)? Check one box.
None
One
Two
More than two → Please indicate how many different prescription
medicines:_____
Can’t recall
173

8. Have you ever experienced a side effect from taking an OTC medicine? Check one box.
Yes No Can’t recall
Part II ⎯ The next few questions relate to where and how you might seek information regarding OTC medicines.
1. Do you read the information on an OTC medicine’s package when BUYING a product
for the FIRST TIME (whether for yourself or another person)?
No
Sometimes If so, when you look at the package, including the front, back, and sides, what information do you read? Check all that apply.
Directions for use The symptoms it treats Active ingredient(s) Warnings (about using it with other drugs or
conditions) Possible side effects
Other________________________________
Always 2. Do you read the information on an OTC medicine’s package when USING or GIVING a
product for the FIRST TIME?
No Sometimes Always
If so, when you look at the package, including the front, back, and sides, what information do you read? Check all that apply.
Directions for use The symptoms it treats Active ingredient(s) Warnings (about using it with other drugs or
conditions) Possible side effects
Other______________________________
174

3. In general, do you ASK a medical doctor for advice (whether for yourself or another person) when you need an OTC medicine? Check one box.
Always Usually Sometimes Occasionally
Never
4. Have you ever RECEIVED advice from a pharmacist (whether for yourself or another person) regarding an OTC medicine? Check one box.
Yes No Can’t recall
5. Do you generally ASK a pharmacist for advice (whether for yourself or another person)
when buying an OTC medicine for the FIRST TIME? Check one box.
Always
Usually If you do NOT always ask a pharmacist for advice when buying an OTC product, why not? Please check the TWO reasons most important to you.
___ I usually forget to ask
___ I do not have difficulty in selecting products
___ I am generally buying the product for someone else
___ I generally receive advice from a doctor
___ I am usually too busy to stop
___ Pharmacists are too busy to talk to me
___ I never buy such products
___ I do not trust pharmacists
___ I generally buy OTCs in places other than
pharmacies
___ Other:__________________________________
Sometimes
Occasionally
Never
175

Part III ⎯ The next few questions deal with common symptoms and product effectiveness. 1. Over the past SIX months, have you personally experienced any of the following
symptoms? Check all that apply.
A cold or flu Dry skin A sore back A headache Constipation Allergies of the nose and/or eyes Muscle aches Heartburn Difficulty getting to sleep
2. Please indicate whether or not you have personally used any of the following types of
OTC products over the past SIX months? If yes, please go to the columns on the right to circle the number for how effective you found the medicine (based on your experiences).
Types
(1) Cold remedies
(2) Cough remedies
I found that the medicine worked for me Strongly Strongly Disagree Disagree Unsure Agree Agree
1 2 3 4 5
1 2 3 4 5
1 2 3 4 5
1 2 3 4 5
1 2 3 4 5
1 2 3 4 5
1 2 3 4 5 1 2 3 4 5
1 2 3 4 5
1 2 3 4 5
(3) Pain relievers (4) Antihistamines (5) Sleeping aids (6) Stop-smoking
products (7) Upset stomach
remedies (8) Laxatives (9) Dry skin
products (10) Sore muscle
Please indicate which you have used
NO YES
⇒ ⇒ ↓
⇒ ⇒ ↓
⇒ ⇒ ↓
⇒ ⇒ ↓
⇒ ⇒ ↓
⇒ ⇒ ↓
⇒ ⇒ ↓
⇒ ⇒ ↓
⇒ ⇒ ↓
⇒ ⇒
rubs
176

3. Overall, how would you rate your current health? Check one box.
Excellent Fair Very good Poor Good Not sure Part IV ⎯ We are interested in your impressions of OTC medicines. For this section, there are 7 statements below. For each one, please circle the number at the right that best describes your opinion. The scales range from 1 (strongly disagree) to 5 (strongly agree). As stated before, OTC medicines in this case do not include vitamins and herbals.
Statements
1. It is generally safe to take more than one OTC medicine at a time.
2. When taking an OTC medicine, I should be careful with it.
Please
In your opinion
Strongly StronglyDisagree Disagree Unsure Agree Agree
1 2 3 4 5
1 2 3 4 5 1 2 3 4 5
1 2 3 4 5 1 2 3 4 5
1 2 3 4 5
1 2 3 4 5
3. OTC medicines rarely cause side effects.
4. OTC medicines are safe to take at higher
than recommended doses.
5. Taking some prescription medicines with certain OTC medicines can cause
problems.
6. It can be dangerous to take certain OTC medicines if I also have other medical conditions.
7. Generally, I find prescription medicines to
be more effective than OTC medicines.
177
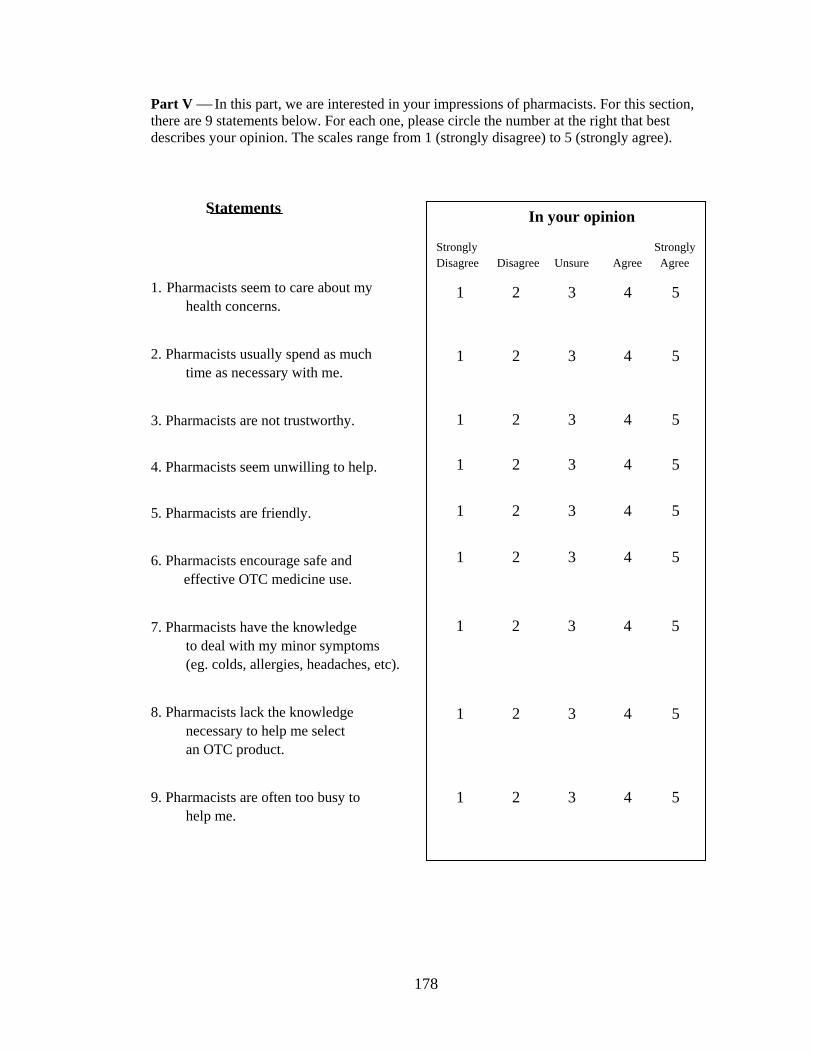
Part V ⎯ In this part, we are interested in your impressions of pharmacists. For this section, there are 9 statements below. For each one, please circle the number at the right that best describes your opinion. The scales range from 1 (strongly disagree) to 5 (strongly agree).
Statements In your opinion
Strongly StronglyDisagree Disagree Unsure Agree Agree
1 2 3 4 5 1 2 3 4 5
1 2 3 4 5
1 2 3 4 5 1 2 3 4 5 1 2 3 4 5 1 2 3 4 5 1 2 3 4 5
1 2 3 4 5
1. Pharmacists seem to care about my
health concerns.
2. Pharmacists usually spend as much
time as necessary with me.
3. Pharmacists are not trustworthy.
4. Pharmacists seem unwilling to help.
5. Pharmacists are friendly.
6. Pharmacists encourage safe and effective OTC medicine use.
7. Pharmacists have the knowledge
to deal with my minor symptoms (eg. colds, allergies, headaches, etc).
8. Pharmacists lack the knowledge
necessary to help me select an OTC product.
9. Pharmacists are often too busy to
help me.
178

Part VI ⎯ In Canada, people can buy OTC medicines in many places. We are interested in two such places – pharmacies and convenience stores (like 7-11R and Mac’sR) and your expectations of each. We will be asking you to compare these two locations. If you have purchased OTC medicines from both locations, or even just one, please continue with the survey. If you have never purchased an OTC product from either, we would still like to know what you might expect and also ask that you continue with the survey. On the next page, there will be two columns on the right – one for OTC medicines sold in a convenience store and one for OTC medicines sold in pharmacies. For each question, please circle a number from each column, regarding what you would expect as a customer at each location. The scales range from 1 (strongly disagree) to 7 (strongly agree). AS AN EXAMPLE, if you feel strongly that short line-ups at the check-out would be desirable at both locations, you would select a high number under both columns ...
Item In a convenience store In a pharmacy
Strongly Strongly Strongly Strongly Disagree Neutral Agree Disagree Neutral Agree
I expect no line-ups at the 1 2 3 4 5 6 7 1 2 3 4 5 6 7 check-out area FOR THIS SAME EXAMPLE, if what you expect differs at each location, you might have
done something like this …
In a convenience store In a pharmacy
Strongly Strongly Strongly Strongly Disagree Neutral Agree Disagree Neutral Agree
I expect no line-ups at the 1 2 3 4 5 6 7 1 2 3 4 5 6 7 check-out area
179

Now, here are the items to consider (please think about OTC medicines in general, not any specific one) :
Please select a number in EACH column
Items
1. I expect a good selection of OTC medicines. 2. I expect OTC medicines to be effective. 3. I expect OTC medicines to be safe. 4. I expect a lot of information on the package. 5. I expect OTC medicines to be potent. 6. I expect OTC medicines to have very few side effects.
7. I expect low prices on
OTC medicines.
8. I expect OTC medicines to be less effective than prescription medicines.
9. I expect professional help. 10. I expect to find good quality
In a convenience store Strongly StronglyDisagree Neutral Agree
1 2 3 4 5 6 7
1 2 3 4 5 6 7
1 2 3 4 5 6 7
1 2 3 4 5 6 7
1 2 3 4 5 6 7
1 2 3 4 5 6 7
1 2 3 4 5 6 7
1 2 3 4 5 6 7
1 2 3 4 5 6 7
1 2 3 4 5 6 7
In a pharmacy Strongly StronglyDisagree Neutral Agree
1 2 3 4 5 6 7
1 2 3 4 5 6 7
1 2 3 4 5 6 7
1 2 3 4 5 6 7
1 2 3 4 5 6 7
1 2 3 4 5 6 7
1 2 3 4 5 6 7
1 2 3 4 5 6 7
1 2 3 4 5 6 7
1 2 3 4 5 6 7
products.
180

Part VII− Demographics The next few questions are of a personal nature, but we do not mean to pry into personal matters.
We only ask these questions to help determine if responders such as yourself are similar to the
Saskatoon average. This may help us to understand the data. Your answers are not made public
in any way.
1. The year in which you were born: _________
2. Your gender: Male
Female
3. Education completed (check one box): Less than high school graduate
High school graduate
Trade/ Technical school
Some College/University
University or College graduate
4. Household income level (check one box): Under $20,000
$20,000 to $39,999
$40,000 to $59,999
$60,000 and over
5. Are you a parent or guardian of children under 16 at home? Yes
No
Please check this box if you would like a copy of the study summary when available If you have any comments at this time, please feel free to add them to the back cover. Thank you for completing this survey! Please return it in the envelope provided.
181
Appendix D: The Advance Letter [First Name] [Last Name] [Address] Saskatoon SK [Postal Code] Dear Sir or Madam: Please allow me to introduce myself. My name is Helen Lo and I am a student at the University of Saskatchewan, College of Pharmacy and Nutrition. I am writing to you for your future help in a project involving medicines. The purpose of my study is to determine whether citizens of our city have different expectations of non-prescription medicines, the ones you can buy without seeing your doctor (like TylenolR, BenylinR, GravolR, and RolaidsR). These are also called over-the-counter (OTC) medicines and are used for common ailments like colds, heartburn, and headaches. My specific interest lies in where these products are purchased in Saskatoon and whether location of sale is an issue. How did I get your name and why have you been selected? We are all concerned about our privacy these days (as we should be). For this project, I simply went to the Saskatoon phone book and chose each name (and address) in a strictly random basis. This method is used by scientists for this type of research to get a good cross-section of opinions within a city. My letter today is just to inform you of my intentions. The actual questionnaire is being sent next week. I am interested in what you feel about this issue and hope you see some value in completing it. If you have the time and would like to help out, it will take about 10 minutes. It asks about some of your past experiences buying medicines, what you might expect in general, then asks some questions about yourself to help me understand the findings. Even if you rarely or never use such products, we would still like your feedback. Thank you for your time. I will be writing again in a week. Sincerely, Helen Lo, BSP Masters Student College of Pharmacy and Nutrition University of Saskatchewan
182

Appendix E: The Cover Letter
[Date] [First Name] [Last Name] [Address] Saskatoon SK [Postal Code] Dear [Title] [Name]: About a week ago, you should have received a letter from me asking for your help with a University project regarding common medicines. Thank you for taking the time to read on. We know you are busy with your own responsibilities let alone attending to a request from someone you do not know! We will mention again that your household was randomly chosen from names in the phone book. This method is used to get a good cross-section of opinions from Saskatoonians. Anyone over 18 years of age at your residence can complete this survey. The purpose of our study is to determine whether citizens of our city have different expectations of non-prescription medicines, the ones you can buy without seeing your doctor (like TylenolR, BenylinR, GravolR, and RolaidsR). These are also called over-the-counter (OTC) medicines. Such medicines are used to relieve symptoms of minor illnesses like colds, allergies, headaches, heartburn, skin rashes, sore feet, etc. Our specific interest lies in where these products are purchased in Saskatoon and whether location of sale is an issue. Even if you rarely or never use such products, we would still like your feedback. Our letter today contains the questionnaire we mentioned. If you have the time and would like to help out, please continue. It takes about 10 minutes to fill out. It asks about some of your past experiences buying medicines, what you might expect in general, asks you to make several comparisons, then asks some questions about yourself simply to help us understand the findings.
183

Once completed, please return the questionnaire in the stamped reply envelope provided. It would be great to receive your reply by July 16, 2003. Participating in this study is strictly voluntary. We wished we could say the benefits to you will be great, but that is not the case. You will, however, be helping with a project we feel is important to understand the sale of medicines that are used for a lot of common conditions. Any information you do provide will be kept confidential. There is a code on your questionnaire – it is used to help identify those who have responded. We hope to also send a gentle reminder in a few weeks to those who might still consider completing one. Please note – your name never appears on the questionnaire. As is University policy for the protection of survey respondents, all returned documents are stored by the researcher at the University of Saskatchewan under lock and key for five years. Mailing lists with any personal addresses are destroyed at the end of the mailing period. Information collected will be used to produce a Master’s thesis and will be described in what is called anonymous and aggregate form. What this means is that personal information such as names never get used in any way. If you have any questions concerning the study, please feel free to ask at any point. This study has been approved on ethical grounds by the University of Saskatchewan Behavioural Sciences Research Ethics Board on April 3, 2003. Any questions regarding your rights as a participant may be addressed to that committee through the Office of Research Services (966-2084). Again, thanks for your consideration and time. Sincerely, Helen Lo, BSP Jeff Taylor, Ph.D. M.Sc. Student Supervisor College of Pharmacy and Nutrition College of Pharmacy and Nutrition University of Saskatchewan University of Saskatchewan 966-6346 966-5328
184

Appendix F: The First Follow-Up Letter [Date] [First Name] [Last Name] [Address] Saskatoon SK [Postal Code] Dear Sir or Madam: About two week ago, a questionnaire concerning the location of over-the-counter (OTC) product sale in Saskatoon was mailed to your household. We hope you found the topic was interesting and important. If you have already returned the questionnaire, thank you very much for your time; we know you are busy! Information that you and others provide will be used to help develop solutions for problems identified. If not yet filled out, it is hoped you find a few minutes over the next few days for this. Once again, anyone over 18 years of age at your residence can complete the questionnaire. Your participation is entirely voluntary but we feel it is essential to the quality of the study. Please note that all information will be kept confidential. If you did not receive a letter containing the questionnaire or have misplaced it, please contact Helen Lo at 966-6346 and another will be sent out right away. Again, thanks for your assistance. Sincerely, Helen Lo, BSP Jeff Taylor, Ph.D. M.Sc. Student Supervisor College of Pharmacy and Nutrition College of Pharmacy and Nutrition University of Saskatchewan University of Saskatchewan
185
Appendix G: The Second Follow-Up Letter
[Date] [First Name] [Last Name] [Address] Saskatoon SK [Postal Code] Dear [Title] [Name]: Recently a questionnaire concerning what we fell to be an important issue was sent to you. The topic involved your expectations of over-the-counter (OTC) medicines. Unfortunately, we have not yet received your response. However, if it was just mailed, we thank you and please disregard this letter. Since the size of this study is limited, your input is very important to its success. We understand that your time is valuable, but once again ask if you or anyone over 18 years of age at your residence could take a few minutes over the next few days to complete the enclosed questionnaire. The extra copy of the questionnaire is included in the event you did not receive it or it has been misplaced. Please note that all information will be kept confidential. If you have any questions regarding this matter, please contact Helen Lo at 966-6346. Again, thanks for your assistance. Sincerely, Helen Lo, BSP Jeff Taylor, Ph.D. M.Sc. Student Supervisor College of Pharmacy and Nutrition College of Pharmacy and Nutrition University of Saskatchewan University of Saskatchewan
186

Appendix H: The Non-Response Card
[Date] Dear [Title] [Name]: Please accept our apology for this final letter. We totally understand your wish not to participate in our OTC medicine project. Mail surveys are not for everyone and can be a real bother! IF you could find a minute to provide the following information, however, that would even help. If you do so, please make sure to tear off your name and address and just send back the bottom portion. We have no need to know who the return letter was sent by. Thanks for your consideration. Sincerely, Helen Lo, BSP Jeff Taylor, Ph.D. M.Sc. Student Supervisor
--------------------------------------------------------------------------------------------------- Over-the-counter (OTC) Medicine Study
1. Are you aware that OTC products can be purchased in convenience stores?
Yes
No
2. Have you ever purchased (for yourself or for someone else) an OTC product in a convenience store?
Yes
No
Can’t recall
3. Have you ever purchased (for yourself or for someone else) an OTC product in a pharmacy?
Yes
No
Can’t recall
4. Birth year: 19_______
5. Gender: Female
Male
6. Education: Some high school
High school diploma
Trade/Technical school
Some university
University/College degree
7. Income level: Under $20,000
$20,000 to $ 39,999
$ 40,000 to 59,999
$60,000 and over
187

Appendix I: Comments Section of the Word Trial Document
1. The reasons why respondents thought the meanings of these two words (Effectiveness
versus Potency) were different (N = 49).
Number Reasons
27 Potency means how strong a medicine is. (Strength)
Effectiveness means how well a medicine works.
9 Higher the potency does not mean higher effectiveness.
The strength of medication doesn’t necessarily make it effect.
Products do not need to be potent to be effect.
1 Prior education
1 Potency has to do with drug concentration; effectiveness has to do with the degree to which the aliment is improved.
1 Effectiveness may indicate appropriateness whereas potency indicates only the strength of the drug.
1 Effectiveness depends on health conditions. It is not necessary to be related with potency.
1 Potency is not always giving effectiveness, it is only indicates likelihood of something.
1 Effectiveness- how well it works; potency- how toxic it might be.
1 Something can be effective with a low potency.
1 Effectiveness- how well it works; potency- how much is in the drug.
1 Potency implies effectiveness is a short period of time; effectiveness can be achieved by different means and consists of a result from an action.
1 Potency refers to the amount of drug that has an effect of the dose administered. Effectiveness is the level of the therapeutic response.
1 Effectiveness is how well a drug works. Potency is the concentration before which it becomes toxic.
1 It depends on weight/age for how potent a drug is.
1 Because a drug can be potent without being effective.
188

2. The reasons why respondents thought the meanings of these two words (Effectiveness versus Potency) were similar (N = 18).
Number Reasons
7 How potent something is will affect how effective it is.
3 The more potent the drug the more effective it will be.
1 If something is effective, you may also say that it is potent.
1 Potency refers to how strong something is (ie. how “effective” it is ) on an external entity.
1 The potency has a lot to do with effectiveness.
1 One would assume that the potency will directly affect the effectiveness.
1 If a drug is not potent enough to do the job expected, then it is not effective.
1 Effectiveness is how well a drug works; potency is how much is needed for it to be effective.
1 Because of something to work, depending on what it is, it needs to be strong.
1 Effectiveness means how quickly and how well it will work. Potency will have direct effect and effectiveness.
189

3. The reasons why respondents thought the meanings of these two words (Safety versus Side Effect) were different (N = 34).
Number Reasons
6 Safety is whether or not it is health for a particular patient to be taken.
Side effect is certain risk or effect that you can experience when taking the drug.
7 Drug can be safe but still have side effect.
Side effects are not necessarily unsafe.
2 There are expected side effects of medicines that do not necessarily correlate with safety of medicines.
1 Safety is how dangerous it is, side effects can be safe or dangerous.
3 Side effects are not always a safety issue.
1 Safety means no danger; side effect – what can happen, not necessarily dangerous.
1 Side effects indicate effects aside from the medicinal effect of the drug; safety can also be compromised by the medicinal effect itself.
1 Safety is whether the product is harmful or not; side effect is possible reactions of the drug.
2 Safety is positive and side effect could mean negative.
4 These terms are opposites. If something is safe, it should have few side effects.
1 Safety refers to national standards, toxic dose, quality control, substance, and preparation purity. Side effect is a consequence that may or may not occur in people taking a drug which is a complication of the systemic or local mechanisms of action but not a complication of a “toxic” amount.
2 Side effects are the undesired responses a drug has; safety refers to the proper way a drug should be taken.
2 Safety- how safe is the medicine; side effect- what the medication will do or effect the body eg. drowsiness.
1 Safety has to do with whether something will harm you; Side effects can be harmful but don’t have to be.
190

4. The reasons why respondents thought the meanings of these two words (Safety versus Side Effect) were similar (N = 26).
Number Reasons
1 Side effects can cause health concerns for some people.
1 Side effects can tell you how safe the product is, whether it react with other products.
4 A drug with too many side effects is not safe (or the safety of it decreases).
2 Safety –is it safe; side effect- what could happen.
1 Safety is how your body reacts to something.
1 Some side effects are non-life threatening, so those drugs would be safe even with side effects.
1 Because you want to be safe, at the same time you want to know the side effects.
1 If a product is not safe, the side effects could be deadly! Must be considerate at all times.
1 Safety refers to any risks that may occur.
1 I think something with no side effects could be considered safe.
1 Side effects might affect your health.
1 Depending upon the side effects, it could have a lot to do with its safety.
1 Both terms are that what you can expect from drug.
1 Safety and side effect- precautions for taking drugs.
2 Depending on a drug, the more side effects the drug has, the more unsafe it may be.
2 Side effects are the risks associated with a drug.
1 Safety refers to if it will harm you or harm a particular age group (ie. children). Side effects refer to symptoms caused negatively to an individual taking the medicine.
3 Side effect may have a lot to do with the safety of the drug.
191

155