consumption
DESCRIPTION
ConsumptionTRANSCRIPT

Consumption
Consumption is a major concept in economics and is also studied by many other social sciences. Economists are particularly interested in the relationship between consumption and income, and therefore in economics the consumption function plays a major role.
Different schools of economists define production and consumption differently. According to mainstream economists, only the final purchase of goods and services by individuals constitutes consumption, while other types of expenditure — in particular, fixed investment, intermediate consumption, and government spending — are placed in separate categories (See consumer choice). Other economists define consumption much more broadly, as the aggregate of all economic activity that does not entail the design, production and marketing of goods and services
Behavioral Economics and Consumption
The Keynesian consumption function is also known as the absolute income hypothesis, as it only bases consumption on current income and ignores potential future income (or lack of). Criticism of this assumption lead to the development of Milton Friedman's permanent income hypothesis and Franco Modigliani's life cycle hypothesis. More recent theoretical approaches are based on behavioral economics and suggest that a number of behavioral principles can be taken as microeconomic foundations for a behaviorally-based aggregate consumption function.
Consumption and Household Production
Consumption is defined in part by comparison to production. In the tradition of the Columbia School of Household Economics also known as the New Home Economics commercial consumption has to be analyzed in the context of household production. Opportunity cost of time affects the cost of home-produced substitutes and therefore demand for commercial goods and services. The elasticity of demand for consumption goods is also a function of who performs chores in households and how their spouses compensate them for opportunity costs of home production
Different schools of economists define production and consumption differently. According to mainstream economists, only the final purchase of goods and services by individuals constitutes consumption, while other types of expenditure — in particular, fixed investment, intermediate consumption, and government spending — are placed in separate categories (See consumer choice). Other economists define consumption much more broadly, as the aggregate of all economic activity that does not entail the design, production and marketing of goods and services (e.g. the selection, adoption, use, disposal and recycling of goods and services).
Consumption can also be measured by a variety of different ways such as energy in energy economics metrics.

Our prehistoric ancestors spent much of their waking hours foraging for and consuming food, an instinct that obviously paid off. Today this instinct is no less powerful, but for billions of us it’s satisfied in the minutes it takes to swing by the store and pop a meal in the microwave. With our physical needs sated and time on our hands, increasingly we’re finding psychological outlets for this drive, by seeking out and consuming concepts.
Conceptual consumption strongly influences physical consumption. Keeping up with the Joneses is an obvious example. The SUV in the driveway is only partly about the need for transport; the concept consumed is status. Dozens of studies tease out the many ways in which concepts influence people’s consumption, independent of the physical thing being consumed. Here are just three of the classes of conceptual consumption that we and others have identified.
Consuming expectations.
People’s expectation about the value of what they’re consuming profoundly affects their experience. We know that people have favorite beverage brands, for instance, but in blind taste tests they frequently can’t tell one from another: The value that marketers attach to the brand, rather than the drink’s flavor, is often what truly adds to the taste experience. Recent brain-imaging studies show that when people believe they’re drinking expensive wine, their reward circuitry is more active than when they think they’re drinking cheap wine—even when the wines are identical. Similarly, when people believe they’re taking cheap painkillers, they experience less relief than when they take the same but higher-priced pills.
Consuming goals.
Pursuing a goal can be a powerful trigger for consumption. At a convenience store where the average purchase was $4, researchers gave some customers coupons that offered $1 off any purchase of $6, and others coupons that offered $1 off any purchase of at least $2. Customers who received the coupon that required a $6 purchase increased their spending in an effort to receive their dollar off; more interestingly, those customers who received the coupon that required only a $2 purchase to receive the dollar off actually decreased their spending from their typical $4, though of course they would have received their dollar off had they spent $4. Consuming the specific goal implied by the coupon—receiving a savings on a purchase of a designated amount—trumped people’s initial inclinations. Customers who received the $2 coupon left the store with fewer items than they had intended to buy.
Consuming memories.
One study of how memories influence consumption explored the phenomenon whereby people who have truly enjoyed an experience, such as a special evening out, sometimes prefer not to repeat it. We might expect that they would want to experience such an evening again; but by forgoing repeat visits, they are preserving their ability to consume the pure memory—the concept—of that evening forever, without the risk of polluting it with a less-special evening.
So concepts not only can influence people to consume more physical stuff, but also can encourage them to consume less. Offering people a chance to trade undesirable physical

consumption for conceptual consumption is one way to help them make wiser choices. In Sacramento, for example, if people use less energy than their neighbors, they get a smiley face on their utility bill (or two if they’re really good)—a tactic that has reduced energy use in the district and is now being employed in Chicago, Seattle, and eight other cities. In this case, people forgo energy consumption in order to consume the concept of being greener than their neighbors.
We suggest that examining people’s motivations through the lens of conceptual consumption can help policy makers, marketers, and managers craft incentives to drive desired behavior—for better or for worse.
The Importance of Consumption
Every time you purchase food at the drive-thru or pull out your debit or credit card to buy something, you are adding to consumption. Consumption is one of the bigger concepts in economics and is extremely important because it helps determine the growth and success of the economy. Businesses can open up and offer all kinds of great products, but if we don't purchase or consume their products, they won't stay in business very long! If they don't stay in business, many of us won't have jobs and the income to buy goods and services.
Definition
Consumption can be defined in different ways, but is usually best described as the final purchase of goods and services by individuals. The purchase of a new pair of shoes, a hamburger at the fast food restaurant, or the service of getting your house cleaned are all examples of consumption. It is also often referred to as consumer spending. Many topics in economics explore how the income of families and individuals affects consumption and spending habits.
Theories
There are many different theories on income and consumption behavior, and we will focus on some of the more mainstream concepts in consumption theory.
Keynesian Theory and Real Income
One of the most popular and well-known theories is the Keynesian theory (offered by John Maynard Keynes). This theory states that current real income is the most important determinant of consumption in the short run. Simply said, you spend according to how much income you have coming in. This is the basis for most consumption theory.
The term 'real' that is used in describing income refers to how your income is affected by inflation, or the natural rise in prices of goods and services. So to elaborate, if your income went up 5% in a year, but the price of goods or inflation went up 5% also, your real income remained flat. You can't really buy or consume any more goods than you could before.
States Affecting Consumption
So what else do economists believe affects consumption and your decision to purchase products and services, besides your real income?
Prices - If prices are higher, then a person's total level of consumption will be lower, because consuming will use up a higher percentage of a person's income.
Taxes - As taxes on goods and services (sales taxes) rise, people may not be able to afford as much as they used to and as a result will consume less. The income tax rates you pay also affect your ability and decision to consume. Higher tax rates lead to less disposable income, which is money you have left over for spending and savings after you pay taxes.
Saving - People generally have two things they can do with their money. They can save or they can spend. The more money people save, the less they have to consume in the short-run.
Consumer Confidence - If people are worried about the economy or their own future income, they may delay making purchases in order to provide some safety and extra cash for future expenses. They will save or delay their consumption until they feel better about what lies ahead.
Meaning of Consumption and their Classification
By consumption we mean the satisfaction of our want by the use of commodities and services. When we use a commodity, we really use its want satisfying quality of utility. For example when we take a glass of water to quench our thirst we are said to consume water. When we are sitting on chair in the office, we are consuming the chairs. A person is sick, he calls in a Doctor, and he has consumed the Doctor’s services. Thus, taking a glass of water means it is actual consumption of water but in case of chair and Doctor’s Services, consumption refer to utilization of chair of Doctor’s services, consumption refer to utilization of chair of Doctor’s services.
Therefore consumption can be defined as.
1. To make use of any commodity of service for the satisfaction of our wants is called consumption.
2. Consumption means destruction of utility.
Types of consumption:
Consumption is known as Direct of Final consumption when the goods satisfy human wants directly and immediately. E.g. taking of meals, use of furniture. On the other hand, consumption is called indirect or productive consumption when the goods are not meant for final consumption but for producing other goods which will satisfy human wants, e.g. use of fertilizer in agriculture.
Importance of Consumption:
1. The consumption is very importance as it is the beginning as well as the end of all economic activities. A man feels desire and then the makes an effort to satisfy it when the effort has been made the result is the satisfaction of the want. Thus want is the beginning and satisfaction the end of our economic activity.
2. The production, as an economic activity depends upon consumption. Producer is taking production of a certain good because it is going to be consumed by the consumer. Therefore consumption determines the production.
3. The intensity of consumption of particular goods determines the price in a market. Thus consumption also influences the exchange activity. The existence of exchange in an economy is due to consumption only.
4. Distribution, i.e. sharing of incomes to landlords, capitalist labour and organizer is also influenced by consumption. Consumption indicates standard of living and standard of living determines the efficiency. Efficiency determines the share in the national income
The 3 types of news consumption & how they differ
Talking Points MemoThe general manager of personalized news aggregator News.me, Jake Levine, lays out his theory of three distinct types of news consumption, each with a different community and pattern:
There’s world news or national news, which people usually get from large publishers like the New York Times or CNN. The typical behavior here is a daily headline scan and the occasional deep dive into one or two stories of interest. The community at play here is your city, your democracy, your world.
Then there’s a type of news that is more specific to a person’s interests — ESPN.com for sports, Mediagazer for media, Techmeme / Hacker News for technology, for example. … With this type of news you want to be aware of the major stories throughout the day, and will likely jump into a few of articles for the full story.
Then there’s highly personalized news. This requires the most significant effort from the user. … With this type of news, you’re aware of all of the day’s major stories, and likely reading with the intent of sharing back out to the people you care about. You read the news as a means to participate in the community that’s most important to you.”
I asked Levine to elaborate by email. He cited data on how often News.me subscribers open their daily email news digest and then which stories they click on. The digest contains the first and third types of news as defined above — a handful of editor’s-choice top stories, and a handful of the best stories shared by friends.
The first type, general-interest top news, draws mixed interest from News.me subscribers. Adding top world and national news to the News.me daily digest created a big boost

in the number of people who bothered to open the emails (“Hey, that’s interesting!”), but “incredibly low click-through rates” on the headlines (“but not that interesting”).
“What we learned,” Levine told me, “is that people have a desire to be made aware of these big big stories, but most don’t really want to read them. A headline and 1-2 sentences is enough.”
The personalized type of news (filtered based on what a user’s Twitter or Facebook friends have shared) is much more engaging, Levine said, with more than 30 percent of readers clicking on at least one headline link.
Personal Consumption Expenditures (PCE), or the PCE price index, is a statistic compiled and released quarterly by the U.S. Bureau of Economic Analysis (BEA) that synthesizes a host of data, chief among them the U.S. Producer and Consumer Price indices.
How it works/Example:
The PCE price index measures the price fluctuations and related consumer behavior for all domestic consumption of durable and non-durable goods and services targeted toward individuals and households. The PCE "core index", however, excludes the more volatile components of food and energy.
Personal consumption is divided into two key categories: goods and services. The category of "goods" is further broken down into "durable" goods, which are big-ticket items (refrigerators, television sets, cars, mobile phones, etc.) that will last more than three years, and "non-durable" goods that are more transitory (e.g., cosmetics, fuel, clothing, etc.).
Why it Matters:
PCE not only measures underlying inflationary pressures, it also reflects whether the consumer is doing his or her part to propel economic growth.
Because three-fourths of Gross Domestic Product (GDP) is consumer spending, the PCE report is a useful tool for investors to analyze the overall state and direction of the economy.
For more on the PCE and GDP, read: Understanding Economic Indicators: Gross Domestic Product.
what households, not businesses, do. This involves expenditure on goods and services, such as petrol, shopping and a new fridge. However, consumption can be split down further into durable and non-durable purchases.
Durable purchases are those that are going to last a long time - often years! These include items like cars, cookers, and televisions. Fridges, cookers, washing machines etc. are all durable goods.

Non-durable purchases are those that only last for a short period of time and are 'used up'. A good example of this is going to the shops to buy food and drink.
1) Cost of Credit
If credit becomes difficult, mainly through expense of interest rates, some households may postpone their credit financed purchases. There will be a reduction in consumption until circumstances change, i.e. accumulate more savings, or a fall in interest rates
2) Assets
Most households appear to have target levels of assets/wealth at each stage of their life cycle. If assets fall unexpectedly, households will increase their saving and reduce consumption. This works in reverse for situations like a sudden increase in wealth.
3) Disposable Income
Disposable income (income is often expressed as 'Y') is income after taxes. It is the amount of total income that can be spent with reasonable freedom by the household. Thus, disposable income is total income minus taxes (and sometimes also regarded as including other fixed payments, such as mortgage repayments). It is that income which can be 'disposed of' with near freedom.
4) Expectations
Individuals' attitudes to the functionality of the economy effects the level of aggregate expenditure. For example, households increase purchases of consumer durables if they believe interest rates will remain low or job security improves, etc. Expectations are the source of both business and household economic indicators. Strictly speaking, an expectation is a leading economic indicator, since it predicts changes in an economy and changes occur before corresponding changes in the economy.
A leading indicator is an economic statistic that suggests transactions in the future. For example, building permits suggest construction activity in the near term, and hence the hiring of construction workers and purchases of building materials. Purchases of raw materials by manufacturing industries ordinarily suggest a level of likely production. Increases in either suggest increased activity; decreases suggest decreases in near-term activity. Stock prices fit this category because high prices for corporate stocks create the impression of wealth that spurs consumption.
A coinciding indicator ordinarily indicates activity at the time. It is often a defining characteristic of the economy such as payroll or sales volume.
A lagging indicator is a statistic that ordinarily follows economic changes. Unemployment rates are a prime example; decisions by most employers to hire workers follow increases in activity and the parallel decision to lay off workers follows decreases in activity.

5) Taxation
A change in the level of taxation on income (income tax) will reduce the amount of disposable income available. Because of this, C could fall. However, if an equal or greater sum were given out in benefits to households, particularly to unemployed, then consumption could even rise. It is important to note that an increase in taxation will not necessarily cause a contraction in consumption. Further, if taxation and benefits were used to redistribute income/wealth from richer to poorer households, consumption might rise. This is because less wealthy households are more likely to spend a greater proportion of their disposable income than extremely rich individuals.
1) Cost of Credit
If credit becomes difficult, mainly through expense of interest rates, some households may postpone their credit financed purchases. There will be a reduction in consumption until circumstances change, i.e. accumulate more savings, or a fall in interest rates
2) Assets
Most households appear to have target levels of assets/wealth at each stage of their life cycle. If assets fall unexpectedly, households will increase their saving and reduce consumption. This works in reverse for situations like a sudden increase in wealth.
3) Disposable Income
Disposable income (income is often expressed as 'Y') is income after taxes. It is the amount of total income that can be spent with reasonable freedom by the household. Thus, disposable income is total income minus taxes (and sometimes also regarded as including other fixed payments, such as mortgage repayments). It is that income which can be 'disposed of' with near freedom.
4) Expectations
Individuals' attitudes to the functionality of the economy effects the level of aggregate expenditure. For example, households increase purchases of consumer durables if they believe interest rates will remain low or job security improves, etc. Expectations are the source of both business and household economic indicators. Strictly speaking, an expectation is a leading economic indicator, since it predicts changes in an economy and changes occur before corresponding changes in the economy.
A leading indicator is an economic statistic that suggests transactions in the future. For example, building permits suggest construction activity in the near term, and hence the hiring of construction workers and purchases of building materials. Purchases of raw materials by manufacturing industries ordinarily suggest a level of likely production. Increases in either suggest increased activity; decreases suggest decreases in near-term activity. Stock prices fit this

category because high prices for corporate stocks create the impression of wealth that spurs consumption.
A coinciding indicator ordinarily indicates activity at the time. It is often a defining characteristic of the economy such as payroll or sales volume.
A lagging indicator is a statistic that ordinarily follows economic changes. Unemployment rates are a prime example; decisions by most employers to hire workers follow increases in activity and the parallel decision to lay off workers follows decreases in activity.
5) Taxation
A change in the level of taxation on income (income tax) will reduce the amount of disposable income available. Because of this, C could fall. However, if an equal or greater sum were given out in benefits to households, particularly to unemployed, then consumption could even rise. It is important to note that an increase in taxation will not necessarily cause a contraction in consumption. Further, if taxation and benefits were used to redistribute income/wealth from richer to poorer households, consumption might rise. This is because less wealthy households are more likely to spend a greater proportion of their disposable income than extremely rich individuals.
Consumption varies between about 40-60% of total expenditure depending on what type of economy you are in, and the period in the economic cycle it is currently at.
Consumption Function: Meaning, determinants and importance.Consumption, in economics, the use of goods and services by households. Consumption is distinct from consumption expenditure, which is the purchase of goods and services for use by households. Consumption differs from consumption expenditure primarily because durable goods, such as automobiles, generate an expenditure mainly in the period when they are purchased, but they generate “consumption services” (for example, an automobile provides transportation services) until they are replaced or scrapped.
CONSUMPTION FUNCTION:A mathematical relation between consumption and income by the household sector. The consumption function can be stated as an equation, usually a simple linear equation, or as a diagram designated as the consumption line. This function captures the consumption-income relation that forms one of the key building blocks for Keynesian economics. The two key parameters of the consumption function are the intercept term, which indicates autonomous consumption, and the slope, which is the marginal propensity to consume and indicates induced consumption. Aggregate expenditures used in Keynesian economics are derived by adding investment, government purchases, and net exports to the consumption function.

The consumption function is the starting point in the Keynesian economics analysis of equilibrium output determination. It captures the fundamental psychological law put forth by John Maynard Keynes that consumption expenditures by the household sector depend on income and than only a portion of additional income is used for consumption.This function is presented either as a mathematical equation, most often as a simple linear equation, or as the graphical consumption line. In either form, consumption is measured by consumption expenditures and income is measured as disposable income, national income, or occasionally gross domestic product.The primary purpose of the consumption function the basic consumption-income relation for the household sector, which is the foundation of the aggregate expenditures line used in Keynesian economics.The consumption function makes it easy to divide consumption into two basic types. Autonomous consumption is the intercept term. Induced consumption is the slope. Of no small importance, the slope of the consumption function is also the marginal propensity to consume (MPC).
First, The EquationThe consumption function can represented in a general form as:
C = f(Y)
where: C is consumption expenditures, Y is income (national or disposable), and f is the notation for a generic, unspecified functional form.Depending on the analysis, the actual functional form of the equation can be linear, with a constant slope, or curvilinear, with a changing slope. The most common form is linear, such as the one presented here:
C = a + bY
where: C is consumption expenditures, Y is income (national or disposable), a is the intercept, and b is the slope.The two key parameters that characterize the consumption function are slope and intercept.
Slope: The slope of the consumption function (b) measures the change in consumption resulting from a change in income. If income changes by $1, then consumption changes by $b. This slope is generally assumed and empirically documented to be greater than zero, but less than one (0 < b < 1). It is conceptually identified as induced consumption and the marginal propensity to consume (MPC).
Intercept: The intercept of the consumption function (a) measures the amount of consumption undertaken if income is zero. If income is zero, then consumption is $a. The intercept is generally assumed and empirically documented to be positive (0 < a). It is conceptually identified as autonomous consumption.

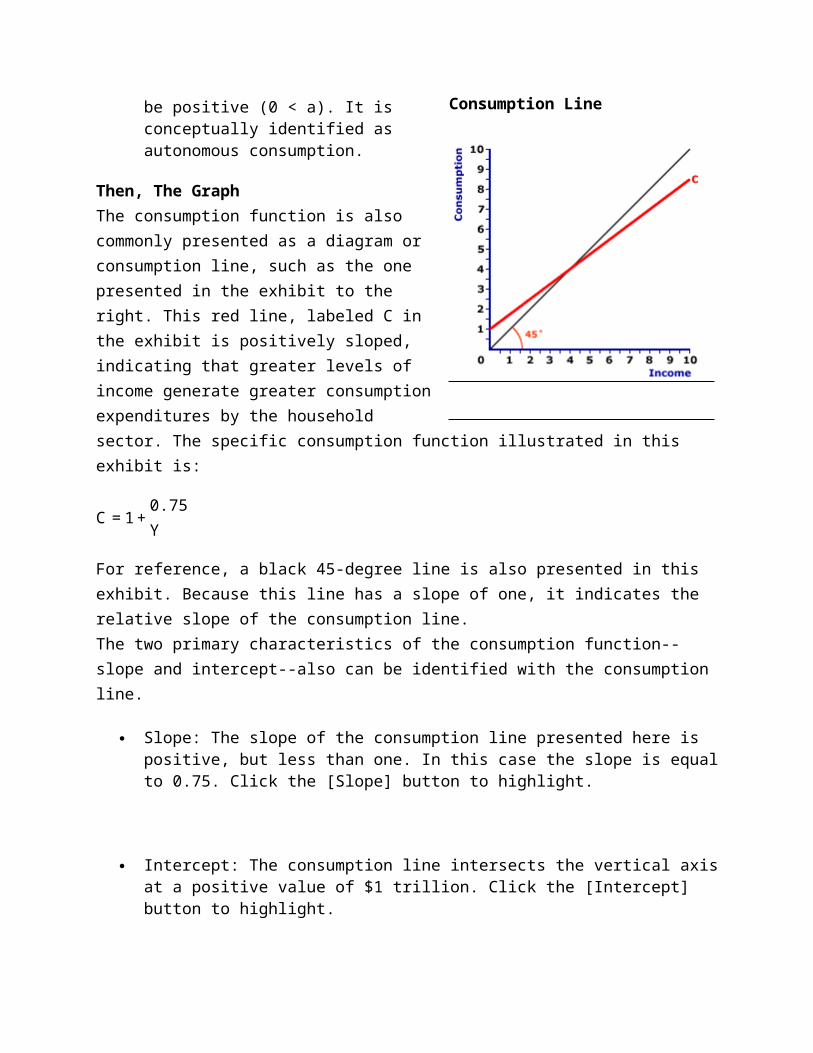
Then, The GraphThe consumption function is also commonly presented as a diagram or consumption line, such as the one presented in the exhibit to the right. This red line, labeled C in the exhibit is positively sloped, indicating that greater levels of income generate greater consumption expenditures by the household sector. The specific consumption function illustrated in this exhibit is:
C = 1 + 0.75Y
For reference, a black 45-degree line is also presented in this exhibit. Because this line has a slope of one, it indicates the relative slope of the consumption line.The two primary characteristics of the consumption function--slope and intercept--also can be identified with the consumption line.
Slope: The slope of the consumption line presented here is positive, but less than one. In this case the slope is equal to 0.75. Click the [Slope] button to highlight.
Intercept: The consumption line intersects the vertical axis at a positive value of $1 trillion. Click the [Intercept] button to highlight.
And Other FactorsThe consumption function captures the relation between consumption and income. However, income is not the only factor influencing consumption.
C = f(Y, OF)
where: C is consumption expenditures, Y is income (national or disposable), and now OF is specified as other factors affecting consumption. These other factors, officially referred to as consumption expenditures determinants, include a range of influences. Some of the more notable consumption determinants are consumer confidence, interest rates, and wealth.Consumer confidence is the general optimism or pessimism the household sector has about the state of the economy. More optimism means more consumption. Interest rates affect the cost of borrowing the funds used to purchase durable goods. Higher interest rates mean less consumption. Wealth is the financial and physical assets owned by the household sector. More financial wealth means more consumption, while more physical assets mean less consumption.These determinants cause consumption expenditures to change even though income does not change. Or another way of stating this, determinants cause consumption expenditures to change at every level of income.
Consumption Line
For a linear consumption function, this change is reflected by a change in the intercept term (a). For a consumption line, the change is seen as an upward or downward shift.
Determinants Of The Consumption Function Or Propensity To ConsumeThere are a number of factors both subjective and objective which determine the position of consumption function. The factors or causes of shifts in consumption function are as fellows.
(I) Subjective Factors:(i) Psychological characteristics of human nature:
The subjective factors affecting propensity to consume are internal to the economic system. The subjective factors include characteristics human nature: The subjective factors affecting propensity to consume are internal to the economic system. The subjective factors include characteristics of human nature, social practices which lead households to refrain or activate to spending out of their incomes. For example, religious belief of the people towards spending, their foresight, attitude towards life, level of education, etc. etc., directly affect propensity to consume or determine the slope and position of the consumptions curve. The subjective factors do not undergo a material change over a short period of time. These remain constant in the short run.
(II) Objective Factors:The objective factors are external to economic system. They undergo rapid changes and bring market shifts in the consumption function. The main objective factors are as under:(1) Level of Real Income. Level of real income is the-basic factor which determines community’s propensity to consume. When real income of the community increases, consumption expenditure also increases but by a Smaller amount. The consumption function shifts upward.(2) Distribution of Wealth: If there is unequal distribution of wealth in a country, the consumption function will also be unequal. People with low income group have high propensity to consume and rich people low propensity to consume. An equal distribution of wealth raises the propensity to consume.(3) Expectation of Changes in Price. If people expect that prices are going to rise in near future, they hasten to spend large sum out of a given income in order to get benefit of low prices. That is what actually, happened just after the promulgation of first Martial Law in our country. So we can say that when priCes are expected to be high in future, the propensity to consume increases or the consumption function shifts upward. When they are expected to be low, the propensity to consume decreases or the consumption function shifts downward. .(4) Changes in Fiscal Policy: Taxes also play an important part in influencing the propensity to consume. If the nature of taxes is such that they directly affect the poor people and redUce their

incomes, then the propensity to consume is high and if rich persons are not taxed at a progressive rate and they accumulate more wealth, then the propensity to consume is low.(5) Changes in the Rate of Interest: A change in the rate of interest exercises influence on the propensity to consume. When the interest rate is raised, it generally induces people to decrease expenditure and save more for lending purposes, On the other hand, when the interest rate is reduced, it usually encourages expenditure as lending then becomes less attractive. So we conclude that an increase in the rate of interest generally reduces propensity to consume or shifts ,the consumption function downward and a fall in the rate of interest usually helps to the increase of propensity to. consume or shifts the consumption function upward.(6), Availability of Goods: Propensity to consume is also affected by the availability of consumption goods. If the goods are available in abundance, then the propensity to consume increases. If they are scarce and are priced very high, then the propensity to consume will decline.(7) Credit Facilities: If cheap credit facilities are available in the country, the consumption function will move upward.(8) Higher Living Standard: If the real income of the people increases in•the country and people adopt the use of new products like television, washing machines, refrigerators, cars, etc., etc., the consumption function is high.(9) Stock of Liquid Assets: If the consumers have greater amounts of liquid assets, there will be more desire for the households to spend out of disposable income. The consumption function shifts upward and vice versa.(10) Consumer Indebtedness: In case the consumers are heavily indebted and they pay bigger monthly installments to repay the debt, then propensity•to consume is low or the consumption function shifts downward and vice versa.11) Windfall gains: If there are unexpected gains due to stock market boom in the economy, it tends to shift the consumption function upward. They are windfall gains.The unexpected losses in the stock market lead to the downward shifting of the consumption curve.(12) Demographic factors: The consumption function is also influenced by demographic factors like size of family, occupation’s, place of residence etc. Persons living in cities, for instance, spend more than those living in rural areas.(13) Attitude towards saving: If a community is consumption oriented, there will be less • saving in the country. The consumption function shifts upward. In case, people save more and spend less, then the consumption function will shift downward.
(14) Demonstration effect. If people are easily influenced by advertisements on radio and television and seeing pattern of living of the rich neighbours, the level of total consumption will go up.How to raise the propensity to consume: The propensity’ to consume can be raised by (1) transferring •wealth from rich to the poor (2) increased wages (3) provision of cheap end easy credit facilities (4) Advertisements (5) Development of means of transport (6) Urbanization and through advertisement.
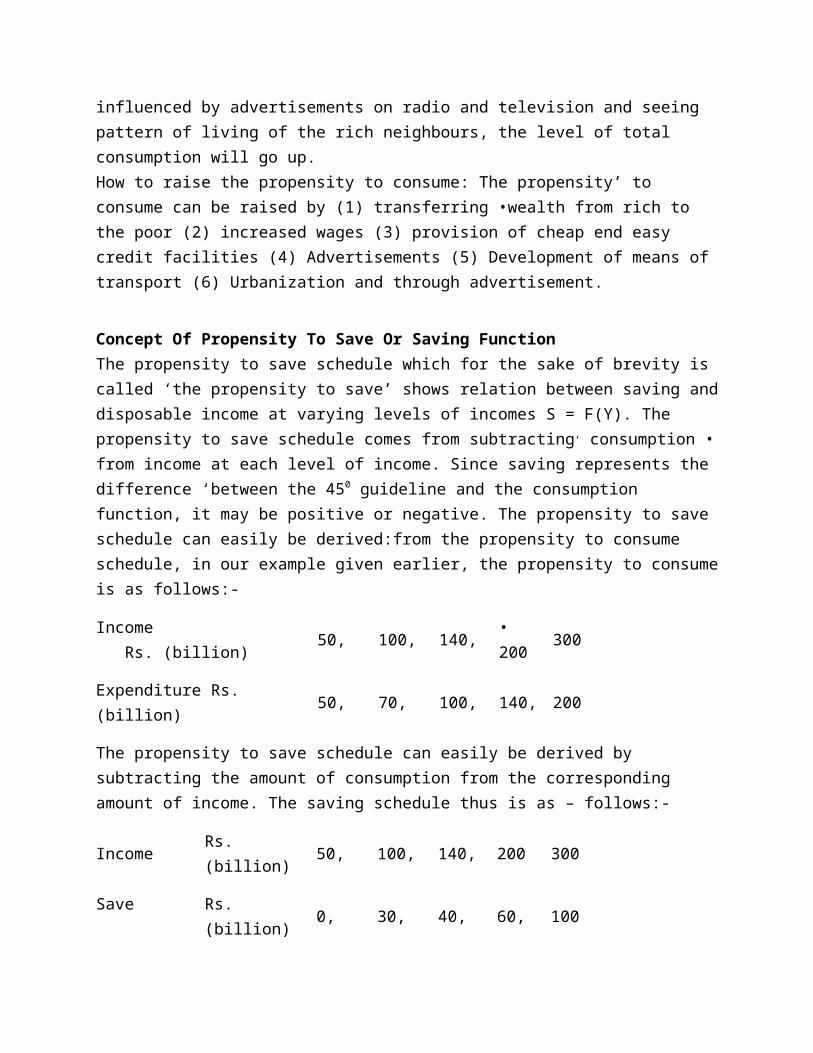
Concept Of Propensity To Save Or Saving FunctionThe propensity to save schedule which for the sake of brevity is called ‘the propensity to save’ shows relation between saving and disposable income at varying levels of incomes S = F(Y). The propensity to save schedule comes from subtracting, consumption • from income at each level of income. Since saving represents the difference ‘between the 450 guideline and the consumption function, it may be positive or negative. The propensity to save schedule can easily be derived:from the propensity to consume schedule, in our example given earlier, the propensity to consume is as follows:-
Income Rs. (billion) 50, 100, 140, • 200 300
Expenditure Rs. (billion) 50, 70, 100, 140, 200
The propensity to save schedule can easily be derived by subtracting the amount of consumption from the corresponding amount of income. The saving schedule thus is as – follows:-
Income Rs. (billion) 50, 100, 140, 200 300
Save Rs. (billion) 0, 30, 40, 60, 100
Concepts of propensity to save.There are two concepts of propensity to save:(i) Average propensity to save. (ii) Marginal propensity to save.(i) Average propensity to save: Average propensity to save is the percentage of income saved at a given level of income (APS). The average propensity to save at any point can be found by dividing saving by income. For instance, if the disposable income is Rs. 100 billion and expenditure Rs. 80 billion on consumption goods, then the saving win be equal to Rs. 20 billion. The average propensity to save will be = .2. The average propensity to save .can also be found by subtracting average propensity to consume from 1. In the above example, the average propensity to consume is80 •- .8. So the average propensity to save will be 1 – .8 = .21000(ii) Marginal Propensity to save: Marginal propensity to save is the ratio of change in
saving to change in income. The MPS measures the change in savinggenerated by a change in income.
MPS – Change in saving
Change in incomeIt is also found out by substracting marginal propensity to consume form I. Thus MPS= I – MPC. The concepts of propensity to save and marginal propensity to save areillustrated below:
Importance of the Consumption FunctionImportance of the Consumption function Consumption function is not to be considered merely a subject of study and analysis. It has a great theoretical and practical importance. All countries want to remove unemployment from their midst, raise their national income and enjoy prosperity. For this purpose a policy of planned economic development is essential. In the formulation of this policy, consumption function plays a very useful role.
Consumption function is not to be considered merely a subject of study and analysis. It has a great theoretical and practical importance. All countries want to remove unemployment from their midst, raise their national income and enjoy prosperity. For this purpose a policy of planned economic development is essential. In the formulation of this policy, consumption function plays a very useful role.We briefly discuss below the importance of consumption from various points of view:
1. Important Tool of Macro-economic Analysis. Consumption function is an important tool of macro-economic analysis given to us by Keynes. Without the consumption function, we would not have been able to find a determinate link between changes in investment and the resultant changes in income of a country. From this point of view, for the macro-economic theory, the consumption function is as important a tool as the demand and supply functions is in the theory of firm and the industry.
2. The Value of the Multiplier. From the consumption function, we derive the value of the multiplier, which as we have known are equal to1/ 1-mpc. Here MPC is marginal propensity to consume. Since marginal propensity to consume is less than unity, an initial injection of purchasing power into the income stream leads to a multiple expansion of total income in a peculiar way. That is, original' injection of money into the economy leads to several successive increments of income in the course of responding 10 the increase in original purchasing power. The multiplier gives us a quantitative link between changes in investment and changes in income. If, for example, the
marginal propensity to consume is f, we know that the multiplier will be 4 so that if investment increases by say, Rs.-1,000, national income will rise by Rs.-4,000. Even before Keynes, the economists knew that changes in investment bring about changes in income but by how much and through which process was not clear, till Keynes gave us tools of consumption function and the multiplier
.3. Invalidates Say's Law. Consumption function helps to invalidate Say's Law which said that supply creates its own demand. Since marginal propensity to consume is less than unity, the whole of the income is not spent on the output produced. According to Say's Law, general over-production in the country is not possible since supply is supposed to create its own demand. This law may hold good in the long run, but not in the short run. In the long run, the market forces establish equilibrium automatically so that demand may be equated to supply. But no such automatic adjustment is possible in the short run. Hence, for some time there may occur general overproduction. According to Say's Law, an act of producing is simultaneously an act of creating proportional effective demand. There is no doubt production creates value equal to itself but that value is not wholly spent then and there. Since marginal propensity to consume is less than unity, the classical law of markets does not hold good, because the entire output cannot be taken off the market or the entire income is not spent. We knew that marginal propensity to consume is less than unity, i.e., as income increases, consumption increases less than increase in income. Hence, supply, far from creating its own demand, exceeds demand and creates a glut in the market which means general overproduction and mass unemployment.4. Shows Crucial Importance of Investment. Consumption function also underlines the crucial importance of investment. Because propensity to consume is stable, employment can be created only by increasing investment. Consumption function tells us that people spend proportionately less than the increase in their income. Therefore, it becomes necessary to fill the gap between income and consumption by increasing investment; otherwise it will not be profitable to increase output and employment. We also know that consumption function is more or less stable. Hence, it is instability of investment which is responsible for fluctuations in income and employment in a country. It is, therefore, clear that investment plays a vital role in increasing income and employment in a country. If propensity of consumption could also increase, income and employment could be increased even without increasing investment. But, since consumption function is stable, investment is the crucial and initiating determinant of the levels of income and employment.5. Explains the Declining Marginal Efficiency of Capital. Consumption function explains the declining marginal efficiency of capital. Since consumption function does not increase which could raise the level of consumption expenditure, the prospective yield of capital assets falls. Once the demand for capital goods decreases, the marginal productivity of capital cannot rise unless the
marginal propensity to consume rises. Thus, the fall in the marginal productivity could be checked, if the marginal propensity to consume could be increased. Hence, the marginal efficiency tends to decline because the demand for goods is discouraged on account of the marginal propensity to consume not rising or the marginal propensity to save not falling. It is the stability of the marginal propensity to consume which explains the declining marginal efficiency of capital.6. Explain the Turning Points of the Business Cycle. Consumption the turning points of the business cycle. The trade cycle takes the downward course because the marginal propensity to consume is less than unity, i.e the people do not spend proportionately more as their income increases similarly, the consumption function explains the upturn of the business cycle. This is due to the fact that since consumption is stable, people are unable to cut down their consumption expenditure to the full extent of a decrease in their income. It shows the danger of permanent over-saving gap and thus explains the secular decline in the marginal efficiency of capital.Thus, consumption function occupies a very important place in the theory of employment.
What are the Variants of Consumption Function?By Pragati Ghosh
Different types of Consumption Function are listed below:
1. Short-Run Consumption Function:
In short run, consumption expenditure is not a simple proportion of income. It is not zero when income is zero. In other words, a consumer has to incur some expenditure on consumption even when his income is zero.
This expenditure, known as the subsistence or autonomous consumption (Ca), is must for every individual to meet the minimum basic needs irrespective of the level of income enjoyed. Expenditure incurred on consumption over and above Ca bears a proportional relationship with the disposable income (Yd ). A typical consumption function of this type is referred to as a non- proportional consumption function and is given as:
C = Ca + b.Yd
Where, C = consumption expenditure,
Ca = autonomous consumption expenditure,
b = a positive constant,
Yd = consumers’ disposable income, which is equal to the excess of income over Net Direct Taxes (direct taxes less transfer payments). [Direct taxes (T) refer to personal taxes such as income tax paid and transfer payments (R) refer to unilateral transactions such as old-age pensions received by the individuals. Net Direct Taxes are thus equal to T-R.] = Y – (T – R)
= Income consumers feel free to dispose off any way they like.
Graphically, the relationship in equation (4.1) is portrayed as in Figure 4.1. Disposable Income Yd is measured on horizontal axis and consumption expenditure (C) on vertical axis. When Yd is zero, C is Ca. In a two sector model, disposable income, Yd = Y, as tax and transfer payments are nonexistent due to absence of government sector.
The graph is a straight line with an intercept on the vertical axis. For the consumption function in question. Average Propensity to Consume (APC) can be defined as the consumption expenditure incurred per unit of income, i.e.,
APC = Consumption expenditure (C) / Income (Y)

Thus, APC = b, when Y =∞; and APC > b, when Y has finite values. In general, APC ≥ b
In like manner. Marginal Propensity to Consume (MPC), defined as an increase in the consumption expenditure per unit increase in income of the consumers, can be expressed as
MPC = Increase in consumption expenditure (∆C) / Increase in income (∆Y)
= ∆C / ∆Y or dC / dY
MPC can thus be obtained for this consumption function through simple differentiation of C with respect to Y.
MPC = dC / dY
= 0 + b
= b
Alternatively, let initial and final levels of consumption be C1 and C2 at income levels of Yl and Y2 respectively. Then,
C1 = Ca + bY1 and
C2 = Ca + bY2
Subtracting,
C2 - C1 = b (Y2 – Y1)
∆C = b ∆Y
∆C / ∆Y = b
= MPC.
For this consumption function, therefore,
APC ≥ MPC. (From equations 4.2 and 4.3)
2. Long-Run Consumption Function or Proportional Consumption Function:
In the long run, consumption expenditure is proportional to the income of the consumers. It may be given as:
C = bY
Consumption expenditure, in this case, is zero when income is zero. Average and marginal propensities can be shown to be identical for this type of consumption function.
APC = C/Y
= bY / Y = b
In like manner,
MPC = ∆C / ∆Y = b
The autonomous consumption (Ca) in this case is zero. This type of consumption function relates to the long-run tendency of consumption expenditure (Fig. 4.2).
3. Non-Linear Consumption Function:
This type of consumption function is quasi-linear (partly linear and partly non-linear). It represents pattern of consumption in advanced countries or of affluent sections. The algebraic expression may take the following form:
C = Ca+ bY + cY2
None of the APC and MPC is constant. Each one is a function of income. For instance,
APC = Ca/Y + b + cY
MPC = b + 2cY
MPC is a linear function of Y while APC is a parabolic function of it. Fig. 4.3 portrays the nature of the curve represented by equation 4.7.
Consumption FunctionAAA |
DEFINITION of 'Consumption Function'
The consumption function is a mathematical formula laid out by famed economist John Maynard Keynes. The formula was designed to show the relationship between real disposable income and consumer spending, the latter variable being what Keynes considered the most important determinant of short-term demand in an economy.
The consumption function is represented as:
Where:C = Consumer spendingA = Autonomous consumption, or the level of consumption that would still exist even if income was $0M = Marginal propensity to consume, which is the ratio of consumption changes to income changesD = Real disposable income
'Consumption Function'
The consumption function is shown here to be linear, but that is dependent on the variable "M" (marginal propensity to consume) staying the same. In fact, consumers tend to spend a smaller percentage of their disposable income as it rises, creating a curved effect at higher income levels.
Refine Your Financial VocabularyGain the Financial Knowledge You Need to Succeed. Investopedia’s FREE Term of the Day helps you gain a better understanding of all things financial with technical and easy-to-understand explanations. Click here to begin developing your financial language with this daily newsletter.
consumption, in economics, the use of goods and services by households. Consumption is distinct from consumption expenditure, which is the purchase of goods and services for use by households. Consumption differs from consumption expenditure primarily because durable goods, such as automobiles, generate an expenditure mainly in the period when they are purchased, but they generate “consumption services” (for example, an automobile provides transportation services) until they are replaced or scrapped. (See consumer good.)

Neoclassical (mainstream) economists generally consider consumption to be the final purpose of economic activity, and thus the level of consumption per person is viewed as a ... (100 of 2,643 words)
Consumption and the business cycle
Private consumption expenditure accounts for about two-thirds of gross domestic product (GDP) in most developed countries, with the remaining one-third accounted for by business and government expenditures and net exports. A substantial portion of government expenditure (e.g., spending on public health programs) is also considered to be consumption expenditure, as it provides a service that consumers value.
In national income accounting, private consumption expenditure is divided into three broad categories: expenditures for services, for durable goods, and for nondurable goods. Durable goods are generally defined as those whose expected lifetime is greater than three years, ... (100 of 2,643 words)
INTRODUCTION
Spending money to tout one's success is not a now phenomenon. The desire to conspicuously consume dates back to tribal times when men possessed women and slaves as trophies of their status (Vablen 1912). Since that time, although the players and what is consumed have changed, the game of ostentatious ownership has remained essentially the same, with the winners being awarded status, prestige and honor. Early in the game, only the aristocratic elite could play. Yet as societies became industrialized, players of achieved wealth, or the nouveau rich, followed by those of moderate and even negligible success entered the game. Some argue that flagrant consumptive behavior is the unfortunate result of capitalism (Veblen 1912, Marx 1848 Galbraith 1984, Toynbee 1973, Stanfield and Stanfield 1980), while others note that material ownership helps us to define who we are (Goffman 1952, Belk 1988, Solomon 1983, McCracken 1987, Levy 1959).
McCracken (1987) notes that "conspicuous and competitive consumption are especially important to the study of the history of consumption because they play such an important role in the growth of a consumer society' (p. 50). Further, he suggests that by studying overt displays of wealth both between and within social groups, we may better understand what has propelled Western societies headlong into their present preoccupation with material possessions.
The purpose of this paper is to demonstrate how modern American conspicuous consumption has developed through time and over societies. First, three theories of conspicuous consumption are briefly reviewed. Then, a periodization scheme is used to explain and compare traditional, achieving, affluent (Mason 1981) and post-affluent societies as they relate to conspicuous consumption. Finally, an analysis of marketing's response to conspicuous consumption along with discussion of some more recent explanations of this unique consumption behavior are incorporated in this presentation.
THEORETICAL BACKGROUND
Several themes have boon proposed as to why people feel the need to conspicuously consume. The earliest of which was put forth by Thorstein Veblen in his book The Theory of the Leisure Class, first published in 1899. According to Veblen (1912), the strength of one's reputation is in direct relationship to the amount of money possessed and displayed; i.e., the basis "of gaining and retaining a good name, are leisure and conspicuous consumption" (p. a4). He theorizes that "pecuniary strength" confers not only "invidious distinction', but also honor, prestige, and esteem within the community. To Veblen, lavish spending was "symptomatic of the superfluous life-style of the rich. Wearing diamond-studded jewelry and overindulging in luxurious foods and alcohol ... were prerequisites of men of gentle breeding" whose lavish spending "redounded to their glory" (Diggins 1978, p.17). Above all, as Veblen notes, the objects of conspicuous consumption must be wasteful, or possess no useful value, in order to reflect credibly on one's reputation (1912, pp. 97-8).
Modernized Vablen's work, Duesenberry (1967) developed his own theory which he labeled the "demonstration" or 'bandwagon' effect. In essence, this effect is an attempt to "keep up with the Joneses" in order to preserve one's self-esteem (McCormick 1983). A reverse theory of the bandwagon effect, also expressive of modern day consumptive behavior, is the 'snob" effect (Mason, 1981). This theory states that people preoccupied with social status reject products that are perceived to be possessed by the common populace. Thus, the 'snob" consumer seeks to purchase products which have limited availability. This type of exclusive consumption guarantees a measure of social prestige (Mason 1981, p.128).
Think Consumption Is The 'Engine' Of Our Economy?
Have you heard that the economy is like a car? It’s the most popular analogy in financial reporting and political discourse. The American people are repeatedly told by financial pundits and politicians that consumption is an “engine” that “drives” economic growth because it makes up 70% of GDP. One notable Nobel-winning economics pundit with a penchant for bizarre growth theories even recently noted that an economy can be “based on purchases of yachts, luxury cars, and the services of personal trainers and celebrity chefs.” Conversely, other economists including Nobel-winner Joseph Stiglitz claim that our economy is stuck in “first gear” due to inequality: too much income is concentrated among too few rich people who tend to save larger share of their income and thus have a lower “marginal propensity to consume”. The Keynesian message is clear: if you want to put the economic pedal to the metal, get out there and consume!
Not so fast, Speed Racer. The systematic failure by Keynesian economists and pundits to distinguish between consuming and producing value is the single most damaging fallacy in popular economic thinking. This past Christmas, we produced a playful video called “Deck the Halls with Macro Follies” exploring the history of this popular myth. If the economy were a car, consumer preferences would surely be the steering wheel, but real savings and investment would be the engine that drives it forward.
A History of Macro Follies

The historical record on economic growth conflicts with this consumption doctrine. Economic growth (booms) and declines (bust) have always been led by changes in business and durable goods investment, while final consumer goods spending has been relatively stable through the business cycle. Booms and busts in financial markets, heavy industry and housing have always been leading indicators of recession and recovery. The dot-com boom and bust, the Great Depression and our current crisis all exhibit the pattern.
For example, during our past two decades of booms and busts, investment collapsed first, bringing employment down with it. Consumption spending actually increased throughout the 2001 recession (financed, in part, by artificially easy credit) even as employment was falling along with investment. During our continuing crisis, consumption spending returned to its all-time high in 2011–yet investment to this day remains at decade lows, producing the worst recovery in growth and employment since the Great Depression. Labor force participation hasn’t been this low since the 1980s. But why?
As John Stuart Mill put it two centuries ago, “the demand for commodities is not the demand for labor.” Consumer demand does not necessarily translate into increased employment. That’s because “consumers” don’t employ people. Businesses do. Since new hires are a risky and costly investment with unknown future returns, employers must rely on their expectations about the future and weigh those decision very carefully. As economic historian Robert Higgs’ pioneering work on the Great Depression suggests, increased uncertainty can depress job growth even in the face of booming consumption. As recent years have demonstrated, consumer demand that appears to be driven by temporary or unsustainable policies is unlikely to induce businesses to hire.
The past several decades in America have been marked by a collapse of real savings encouraged by artificially easy credit from the Fed, along with explosive growth in government spending. All these combined to bring about a debt-fueled spending binge, with disastrous consequences.
Increased investment drives economic growth, while retrenched investment leads to recession and reduced employment–and it always has. Those who blame our stagnation on a lack of consumer demand rely on a toxic brew of dubious data and dangerous theory.
Before I Can Consume, I Must Produce for Others
By definition, GDP is a summary of final sales for new goods and services and not of all economic activity. Raw materials, intermediate goods and labor costs, which comprise the bulk of business spending are not treated in GDP, but are rather rolled up in the final sale price of the “consumer” spending. Only capital equipment, net inventory changes and purchase of newly constructed homes constitute “investment” according to GDP. This framing of the data makes the “consumption drives the economy” a foregone conclusion. But this is circular reasoning.
Where do these “consumers” get their money to spend? Before we can consume, we need to produce and earn a paycheck. And paychecks have to flow to productive — that is value-creating — behavior, or value is simply being transferred and destroyed. Our various demands as

consumers are enabled by our supply as workers/producers for others. That’s the classical “Law of Markets”, often referred to as Say’s Law, in a nutshell.
For employees, those paychecks are income, but for the employers, wages represent most business’ single largest expense. Yet GDP does not treat employee wages or materials as “investment spending” — even though any business owner regards salaries as the most important and largest investment that they make. Instead, employee wages appear in GDP data as consumption when income is spent on final goods like food, clothing, gadgets, and vacations. Moreover, since GDP is an accounting summary, it adds consumption and investment spending together. But this summarizing masks the fact that these two activities are actually in opposition in the short run. In order to invest more today, we have to save more and consume less. As a result, GDP in-and-of-itself reveals nothing about what grows an economy; at best, it demonstrates how large the economy is and whether it’s growing or shrinking.
Digging below the surface of GDP reveals a structure of value-adding production far more complex than the simplistic analysis given by most media reports. According to government data, more than 70% of Americans earn their incomes from employment in domestic business. Yet the retail sector of our economy, for example, only contributed 6% of GDP. Bureau of Labor Statistics (BLS) data on employment show that only about 11% of employed Americans work in “sales and related occupations”. That leaves a great deal of economic activity and employment to the “business to business” sector, which composes most of the real economy.
Most of the value-adding activities occurred between a vast structure of businesses and workers starting with raw materials and blueprints and coming together over months (sometimes years when R&D is included) before a final sale can be made. At each stage, the activity is funded not by current “consumer spending” but through a combination of new investment and savings such as each company’s reinvested earnings. The farther from a final good a business’s output is, the more it relies on credit markets and the more it is subject to distortions on the savings and investment side. And since employment is spread across this time structure with relatively few working in final retail stage, savings and investment changes have dramatic impacts on employment.
Organic Growth
My wife Lisa and I have personal experience with dynamics that the top-down Keynesian view ignores. Several years ago we launched a side-business designing, manufacturing and selling reusable all-in-one cloth diapers to moms interested in saving money and cutting down on trash. We called them “weehuggers”.
To start the business, we got a small capital contribution from my brother-in-law in exchange for equity in the company. These savings were put to use buying the raw materials, designing the diaper prints, hiring sets of skilled people both to sew the diapers and to build the website. Designing, testing and producing the product and website took over a year. Almost none of that activity was included in GDP for that year, except through the “consumer spending” of people we paid. Throughout this stage, no “product” existed for others to demand or for us to sell and generate income. The time Lisa and I spent building the company was also a very real form of
investment itself. This so-called “sweat equity” is just as much of an investment as a financial contribution.