consumption of antimicrobial agents in thailand in 2017
TRANSCRIPT

Consumption ofantimicrobial agentsin Thailand in 2017
version 1 (Including export)

Consumptionof antimicrobial agents
in Thailand in 2017First report
Thai working group on Health Policy and Systems Research on antimicrobial resistance (HPSR-AMR)1
HEALTH SYSTEMS RESEARCH INSTITUTE
1 This publication is also supported by the Food and Agriculture Organization of the United Nations.
version 1 (Including export)

Consumption of antimicrobial agents in Thailand in 2017First report
Produced by : Thai working group on Health Policy and Systems Research on antimicrobial resistance (HPSR-AMR)
Editor : International Health Policy Program, Ministry of Public Health, Thailand
Published by : Food and Drug Administration, and International Health Policy Program, Ministry of Public Health, Thailand
Address : International Health Policy Program Ministry of Public Health, Thailand Tiwanon Rd. Nonthaburi 11000, Thailand Phone: +66 (0) 2590-2366-7 Fax: +66 (0) 2590-2385
Any use of data from the Thailand surveillance of antimicrobial consumption 2017 should include specific reference to this report.
Suggested citation: Thai Working Group on Health Policy and Systems Research on Antimicrobial Resistance (HPSR-AMR), 2018. Consumption of antimicrobial agents in Thailand in 2017. ISBN : 978-974-244-406-8
This report is available at www.ihppthaigov.net, www.fda.moph.go.th, www.thaiahpa.com, http://afvc.dld.go.th
Correspondence : Any correspondence relating to this report should be sent by e-mail to : [email protected]
Layout : International Health Policy Program, Ministry of Public Health, Thailand
Print : The Graphico Systems Co.,Ltd. 119/138 Moo 11, The Terrace, Soi Tiwanon 3,Tiwanon Rd., Talad khuan, Muang Nonthaburi, Nonthaburi 11000
First published : December 2018
Consumption of antimicrobial agents in Thailand in 2017

Acknowledgements
Thailand Surveillance of Antimicrobial Consumption (SAC) is locally initiated and established. It receives
financial supports from various partners, in particular the World Health Organization South-East Asia,
the United States Agency for International Development, the Food and Agriculture Organization of the United
Nations (FAO), World Health Organization Country Cooperation Strategy (WHO-CCS) which is a multi-funding
platform contributed by World Health Organization, Thai Health Promotion Foundation, National Health Security
Office and Health Systems Research Institute.
We acknowledge supports by a number of colleagues - Suwit Wibulpolprasert, Suriya Wongkongkathep,
Walaiporn Patcharanaruemol, Chutima Akaleephan, Pansak Pramokchon, Nithima Sumpradit, Sukanya Numsawat,
Raththar Benchapalanont, Sudarat Damrongwatanapokin, Wantanee Kalpravidh, Kachen Wongsathapornchai,
Pennapa Matayompong, Orratai Waleewong, Klara Tisocki, Richard Brown, Dennis Carroll, Daniel Schar,
Katinka de Balogh, Ronello Abila, Animal Health Products Association and Thai Feed Mill Association.
Arno Muller, Hege Salvesen Blix, Birgitte Borck Høg, Laura Mie Jensen, Fraser Broadfoot, Gunilla Skoog Ståhlgren, Kari Grave and Christina Greko are acknowledged for their independent external peer review of the methodology
applied by Thailand SAC and their invaluable advice to this report.
Supon Limwattananon and Anond Kulthanmanusorn are acknowledged for their internal peer review, data
verification and invaluable comments to the report.
The funding for the publication of this report is made possible by FAO and WHO-CCS and is greatly
appreciated.
Staff members of International Health Policy Program, Parinda Seneerattanaprayul, Tibet Issaramalai and
Oranat Rueangna are greatly appreciated for the support in completing this report.
Finally, Viroj Tangcharoensathien is especially acknowledged for his inspiration, encouragement, guidance
and kind supervision.
Consumption of antimicrobial agents in Thailand in 2017

About the Health Policy and Systems Research on Antimicrobial Resistance
The “Thai Working Group on Health Policy and Systems Research on Antimicrobial Resistance (HPSR-AMR)”
is a network of multi-disciplinary and multi-sectoral researchers using the One Health approach to strengthen
and sustain the existing monitoring and evaluation of the National Strategic Plan on Antimicrobial Resistance
(2017-2021) (NSP-AMR) platforms, and develop other essential platforms where needed. We naturally evolved
from the working group of Development on Thailand Surveillance of Antimicrobial Consumption (Thailand SAC)
in humans and animals since the mid-2015, well before the advent of the NSP-AMR (2017-2021). The initial
goal of the Thailand SAC working group is to establish a sustainable system for monitoring the trend of
antimicrobial consumption in humans and animals, which is comparable with international good practice
(in particular the European Surveillance of Antimicrobial Consumption Network (ESAC-Net) and European
Surveillance of Veterinary Antimicrobial Consumption (ESVAC)) and supports policy decisions for optimizing
consumption (1). Later, the working group was expanded to cover health systems and policy research related
to Antimicrobial Resistance (AMR). There are more than 50 researchers from several institutes to form a unique
trust-based collaboration for the benefit of the country; the International Health Policy Program (IHPP) of the
Ministry of Public Health (MOPH) is the convener, coordinator and supporter which secures funding, conducts
researches and ensures policy uptakes through its social network and long-standing exemplary institutional
records and reputation among institutes involved in HPSR-AMR.
Addressing AMR requires multi-sectoral, multi-disciplinary researchers to work together. Mutual respect and
recognition, team work and trust building are essential ingredients to build and sustain the research team.
We fully applied trust-based working relations across different stakeholders who all had mutual respect for
each other (2). We also focused on team building through empowerment so that all partners grew together in
a non-exploitative manner. Full engagement and ownership of the research and uptake process will ensure
commitment and long-term sustainability. An effective interface between evidence and policy decision-making
is critical to address AMR. Based on its track record, IHPP is in a strong strategic position to ensure research
uptake by multi-sectoral policy makers (1).
i Consumption of antimicrobial agents in Thailand in 2017

CU : Chulalongkorn UniversityDMSC : Department of Medical Sciences, Ministry of Public HealthFDA : Food and Drug Administration, Ministry of Public HealthIHPP : International Health Policy Program, Ministry of Public HealthKU : Kasetsart UniversityKKU : Khon Kaen University
KMUTT : King Mongkut’s University of Technology ThonburiMDES : Ministry of Digital Economy and SocietyMOAC : Ministry of Agriculture and CooperativesMU : Mahidol UniversityPSU : Prince of Songkla UniversitySU : Silpakorn University
HUMAN ANIMAL
ENVIRONMENT
Department of Fisheries, MOAC
Department of Agriculture, MOAC
Faculty of VeterinaryScience, MU
Thai Feed Mill Association
Animal Health Products Association
Faculty of Pharmaceutical Science, CU, SU, KKU, PSU
Faculty of Engineering, CU
Faculty of Engineering, KMUTT
Faculty of Agriculture at Kamphaeng Saen, KU
Faculty of Medicine Siriraj Hospital, MU
National Statistical Office, MDES
Department of Livestock Development, MOAC
Food and Drug Administration
Department of Medical Sciences
InternationalHealth Policy
Program
Multi-stakeholder engagement in developing the Thai Working Group on Health Policyand Systems Research on Antimicrobial Resistance using the One Health approach.
About the report
This is the first report on the surveillance of antimicrobial consumption in both humans and animals in Thailand.
It provides baseline data in 2017 to monitor the NSP-AMR (2017-2021) goals, which are set at a 20% and
30% reduction of antimicrobial consumption in humans and animals, respectively. This report in veterinary
antimicrobials focuses primarily on food-producing animals, excluding consumption in companion animals, for
capturing the volume and value of imports and the local manufacture of all medicines including human and
veterinary antimicrobials. This is legally mandated by article 85 of the 1987 Drug Act to Thai Food and Drug
Administration (FDA); for which all pharmaceutical operators shall submit an annual report of the volume and
value of antimicrobials it processes by March of the following year; this annual report covers all medicines
licensed to them including antimicrobials. In order to ensure accuracy, peer reviews by external and internal
experts were conducted not only in the methodology but also in the results and analysis of this report.
The results were reported to the national steering committee on AMR at the end of 2018 (accepting the
limitations of data that include exportation).
Consumption of antimicrobial agents in Thailand in 2017 ii

List of Contents
Page
1. Summary 1 1.1 Key findings 2
1.2 Concluding remarks 3
2. Introduction 5
3. Methods 9 3.1 Numerator 10
3.1.1 Data sources 10
3.1.2 Drug Classification 12
3.1.3 Inclusion criteria for antimicrobial consumption in Thailand SAC 12
3.1.4 Limitations 12
3.2 Denominator 13
3.2.1 Human population 13
3.2.2 Animal population 13
3.2.2.1 Population correction unit modified by Thailand (PCUThailand
) 13
3.2.2.2 Calculation of PCU 13
3.2.2.3 Animal species and categories included in the PCUThailand
14
3.2.3 Limitations 15
3.3 Analysis and reporting of the data (Unit of measurement) 16
3.3.1 Human antimicrobials 16
3.3.2 Veterinary antimicrobials 16
3.4 Validation, data integrity of the annual report 17
3.4.1 Limitations 17
3.5 Summary of included data sources/types 18
4 Results 19 4.1 Human antimicrobials 20
4.1.1 Total consumption of human antimicrobials (DDD/1,000 inhabitants/day) 20
4.1.2 Consumption of targeted human antimicrobial groups 21
1. Core set 21
1.1 Consumption of antibacterials for systemic use (ATC group J01) 21
in DDD/1,000 inhabitants/day
1.2 Consumption of antibiotics for alimentary tract and metabolism 24
(ATC group A07AA) in DDD/1,000 inhabitants/day
1.3 Consumption of Nitroimidazole derivatives (ATC group P01AB) 24
in DDD/1,000 inhabitants/day
Consumption of antimicrobial agents in Thailand in 2017

List of Contents
Page
2. Optional list 25
2.1 Consumption of antimycotics and antifungals for systemic use 25
(ATC groups J02 & D01BA) in DDD/1,000 inhabitants/day
2.2 Consumption of antivirals for systemic use (ATC group J05) 25
in DDD/1,000 inhabitants/day
2.3 Consumption of drugs for treatment of tuberculosis (ATC group J04A) 27
in DDD/1,000 inhabitants/day
2.4 Consumption of antimalarials (ATC group P01B) in DDD/1,000 inhabitants/day 28
4.1.3 Consumption by critically important antibiotics (WHO) by level ATC 3/4/5 28
4.2 Veterinary antimicrobials 30
4.2.1 Total national consumption per population-corrected unit for food-producing animals, 30
by antimicrobial class
4.2.2 Consumption by WHO critically important antimicrobials 33
4.2.3 Consumption of veterinary antimicrobial agents for food-producing animals 34
by route administration
4.3 Consumption of Critically Important Antimicrobials in humans and animals 36
Annex 1 Terminology 38Annex 2 Methods used for calculation of numbers of food-producing animals 39Annex 3 Statistics of annual report and Market Authorization in 2017 41Annex 4 WHO list of critically important antimicrobials (CIAs) for human medicine 43Annex 5 The calculation method in human antimicrobials 45Annex 6 The calculation method in veterinary antimicrobials 46Annex 7 Validation for human antimicrobials 48Annex 8 Validation for veterinary antimicrobials 50Annex 9 Total consumption of veterinary antimicrobials (tonnes) 51Annex 10 All veterinary antimicrobials used as premix for medicated feeding stuff in 52 food-producing animals
Annex 11 Lists of consumption by ATC level 5 (human antimicrobials) 54Annex 12 Lists of consumption by ATCvet level 5 (veterinary antimicrobials) 58Annex 13 Health Policy and Systems Research on antimicrobial resistance working group members 60
References 62
Consumption of antimicrobial agents in Thailand in 2017

List of Figure
Page
Figure 1. Summary of National Strategic Plan on Antimicrobial Resistance (2017-2021) 7
Figure 2. The annual report of Thai FDA included data from import and manufacture level 11
Figure 3. Relative amount of antibacterials consumption for systemic use (ATC group J01) 22
classified by ATC level 3 in Thailand, 2017, expressed as percentages
of the total consumption in DDD
Figure 4. Top ten consumption of antivirals for systemic use (ATC group J05) in Thailand in 2017, 27
expressed as DDD/1,000 inhabitants/day
Figure 5. Proportion of the total consumption of antimicrobials in WHO’s critically important 34
antimicrobials (CIAs) list in food-producing animals, expressed as percentages
of the total consumption in mg in Thailand in 2017
Figure 6. Distribution of consumption of veterinary antimicrobial agents for food-producing animals, 34
in mg per population correction unit modified by Thailand (mg/PCUThailand
),
by pharmaceutical form in Thailand for 2017
Figure 7. Distribution of consumption of WHO highest priority critically important antimicrobials 35
(CIAs) for food-producing animals by five forms of pharmaceutical administration, 2017
Figure A1. Percentages of single and combined targeted antimicrobial drugs consumed 42
in both humans and animals in Thailand, for 2017
Figure A2. Methodology for veterinary consumption calculation 47
Figure A3. Distribution of consumption, in tonnes of active ingredients, divided into tablets 51
(used exclusively in companion animals) and all other pharmaceutical forms
(used mainly in food-producing animals) in Thailand, 2017
Figure A4. Distribution of consumption of WHO highest priority CIAs for veterinary antimicrobials 53
used as premix for medicated feeding stuff in food-producing animals, 2017
Consumption of antimicrobial agents in Thailand in 2017

List of tables
Page
Table 1. Mid-year human population in Thailand, 2017 13
Table 2. Weights used to calculate the population correction unit modified by Thailand (PCUThailand
) 14
Table 3. Number of animals and population correction unit modified by Thailand (PCUThailand
) 15
by animal category included in the calculation, 2017
Table 4. Summary of information on year of data collection, legal basis for collecting data 18
at national level, national data provider, type and sources for consumption data and limitation
Table 5. Consumption, in DDD, of human antimicrobials, population and consumption 20
in DDD/1,000 inhabitants/day, in 2017
Table 6. Consumption of human antimicrobials in Thailand, expressed as DDD/1,000 inhabitants/day, 21
core set and optional list by ATC code; 2017
Table 7. Consumption of antibacterials for systemic use (ATC group J01) 21
by ATC level 3 in Thailand, 2017, expressed as DDD/1,000 inhabitants/day
Table 8. Consumption of antibacterials for systemic use (ATC group J01) 23
by ATC group level 3 and 4 in Thailand, 2017, expressed as DDD/1,000 inhabitants/day
Table 9. Top ten antibacterials for systemic use (ATC group J01), in DDD/1,000 inhabitants/day, 24
analyzed by ATC level 5 in Thailand, in 2017
Table 10. Consumption of antibiotics for alimentary tract and metabolism (ATC group A07AA) 24
in Thailand in 2017, expressed as DDD/1,000 inhabitants/day, analyzed by ATC level 5
Table 11. Consumption of Nitroimidazole derivatives (ATC group P01AB) in Thailand in 2017, 25
expressed as DDD/1,000 inhabitants/day, analyzed by ATC level 5
Table 12. Consumption of antimycotics and antifungals for systemic use (ATC groups J02 and D01BA) 25
in Thailand in 2017, expressed as DDD/1,000 inhabitants/day
Table 13. Consumption of antivirals for systemic use (ATC group J05) in Thailand in 2017, 26
expressed as DDD/1,000 inhabitants/day
Table 14. Consumption of drugs for treatment of tuberculosis (ATC group J04A) in Thailand in 2017, 27
expressed as DDD/1,000 inhabitants/day, by ATC level 5
Table 15. Consumption of antimalarials (ATC group P01B) in Thailand in 2017 28
expressed as DDD/1,000 inhabitants/day
Table 16. Consumption of antimicrobials class listed as the highest and high priority critically 29
important antimicrobials (CIAs) for human medicine, in DDD/1,000 inhabitants/day
in Thailand in 2017
Table 17. Consumption, in tonnes of active ingredient of veterinary antimicrobial drugs marketed 30
mainly for food-producing animals, and population correction unit modified by Thailand
(PCUThailand
) and consumption in mg/PCUThailand
, 2017
Table 18. Consumption of antimicrobial agents by food-producing animals, in mg per population 31
correction unit modified by Thailand (mg/PCUThailand
), of the various veterinary
antimicrobial classes by ATCvet level 3 and level 4 in Thailand in 2017
Consumption of antimicrobial agents in Thailand in 2017

Consumption of antimicrobial agents in Thailand in 2017
List of tables (cont.)
Page
Table 19. Top ten veterinary antimicrobial consumption in food-producing animals, 32
in mg per population correction unit modified by Thailand (mg/PCUThailand
),
of the various veterinary antimicrobial classes by ATC level 5 in Thailand in 2017
Table 20. Consumption of antimicrobials class listed as the critically important antimicrobials (CIAs) 33
for human medicine, in mg per population correction unit modified by Thailand
(mg/PCUThailand
), in food-producing animals in Thailand, 2017
Table 21. Consumption of critically important antibiotics: highest and high priority by humans 36
and food-producing animals, 2017 Thailand
Table A1. Summary of methods used for calculation of numbers of food-producing animals 39
in each species
Table A2. Number of single and combined drugs containing one, two, three and four active ingredients 41
consumed in Thailand, for 2017
Table A3. Antimicrobial classes in WHO Critically Important Antimicrobials mentioned in the report 44
Table A4. Data elements and sources for validating the DDD calculation 48
Table A5. Distribution of overall consumption, in tonnes of active ingredient, divided into tablets 51
(used exclusively in companion animals) and all other pharmaceutical dosage forms
(used mainly in food-producing animals) in Thailand, 2017
Table A6. All veterinary consumption as premix for medicated feeding stuff 52
in food-producing animals, 2017

Consumption of antimicrobial agents in Thailand in 2017 1
Summary
0 1

2 Consumption of antimicrobial agents in Thailand in 2017
1. Summary1.1 Key findings
The Thailand Surveillance of Antimicrobial Consumption (Thailand SAC) was established to monitor the goals
of the National Strategic Plan on Antimicrobial Resistance (2017-2021) (NSP-AMR) which aims to achieve
a 20% and 30% reduction of antimicrobial consumption in humans and animals, respectively. This is the first
national report, and provides baseline data about the consumption of antimicrobials in humans and animals
in 2017.
The antimicrobial consumption data were captured by the Food and Drug Administration’s (FDA) annual
mandatory reporting system; for which a software program had been developed allowing electronic submission
by pharmaceutical importers and manufacturers. The Defined daily dose (DDD) per 1000 inhabitants per day
(DID) and mg of active ingredients (AI) per population correction unit modified by Thailand (mg/PCUThailand
), were
applied as the unit of measurement of antimicrobial consumption in humans and animals, respectively.
The scope of antimicrobials in humans was in line with the recommendations by the World Health Organization’s
(WHO) core list of antimicrobials: antibacterials (ATC Code J01), antibiotics for alimentary tract (A07AA) and
nitroimidazole derivatives for protozoal diseases (P01AB). Thailand SAC also included the WHO optional list of
antimicrobials: antifungals (J02), antimycotics (D01BA), antivirals (J05), antimycobacterials for treatment of
tuberculosis (J04A), and antimalarials (P01B).
On animal consumption, the scope was in line with the World Organisation for Animal Health (OIE) and similar
to that applied by the European Surveillance of Veterinary Antimicrobial Consumption (ESVAC): antimicrobial
agents for intestinal use (QA07AA; QA07AB; QA07AX), antimicrobial agents for intrauterine use (QG01AA;
QG01AE; QG01BA; QG01BE QG51AA; QG51AG), antimicrobial agents for systemic use (QJ01) and
antimicrobial agents for intramammary use (QJ51).
Consumption of human antimicrobials in Thailand in 2017 was 75.68 DDD/1,000 inhabitants/day. Of these,
the antibacterials (J01) group was the highest consumption (69.98% of total), followed by antivirals (J05)
(17.20%) and antifungals (J02) (6.58%). Of the antibacterials for systemic use (ATC group J01), amoxicillin was
the largest consumption in ATC group J01-antibacterial for systemic use, at 15.10 DDD/1,000 inhabitants/day;
followed by ceftriaxone (13.57 DDD/1,000 inhabitants/day); and tetracycline (3.55 DDD/1,000 inhabitants/day),
respectively.
The consumption of veterinary antimicrobials by food-producing animals, expressed as mg/PCUThailand
, was
711.56 mg/PCUThailand
. The largest proportion of veterinary antimicrobial consumption was Penicillins (QJ01C)
(24.93%), Intestinal anti-infective (QA07A) (21.64%) and Sulfonamides and trimethoprim (QJ01E) (17.55%).
At the ATCvet level five, amoxicillin was the largest consumption 174.96 mg/PCUThailand
(24.59%), followed by
halquinol (103.01 mg/PCUThailand
, 14.48%), sulfadimidine (99.51 mg/PCUThailand
, 13.98%), respectively. The top

Consumption of antimicrobial agents in Thailand in 2017 3
ten consumption of veterinary antimicrobials was a total of 621.96 mg/PCUThailand
or 87.40% of total national
consumption by food-producing animals. Policy attention should be given to monitor the appropriate use of
antimicrobials in these top ten, which will contribute to optimizing consumption.
In response to calls for rational use of antimicrobials and preservation of critically important antimicrobial items
as the last resort, this report puts a special focus on the use of antimicrobial classes listed by WHO (5th revision
(http://who.int/foodsafety/cia/en)) as the highest priority critically important antimicrobials (CIAs) for human
medicine. They include Cephalosporins (3rd, 4th and 5th generation), Glycopeptides, Macrolides and ketolides,
Polymyxins and Quinolones. The consumption of this antimicrobial class was 28.82% of total human
antimicrobials and 13.99% of total animal antimicrobials in 2017. Antimicrobials including both the highest
and high priority CIAs recommended to be preserved for humans as the last resort were used in human
consumption at a rate of 43.63 DDD/1,000 inhabitants/day, or 57.65% of total national consumption; and in
animal consumption at a rate of 308.09 mg/PCUThailand
, or 43.30% of total consumption. Immediate policy actions
must be introduced to strengthen antibiotics stewardship such as reclassifying the CIA items to restrict the
distribution and use assuring rational use, and strengthening competencies regarding antibiotic among the
health professionals.
1.2 Concluding remarks
The findings from this first national report on antimicrobial consumption in humans and animals should be
interpreted with care, given the number of limitations of the database. The mandatory reports by importers and
manufacturers are not fully validated for accuracy through on-site verification; which can be over- or under-
reporting due to human errors. Mandatory reporting does not provide export volume, hence the consumption
in this report is over-estimated. Mandatory reporting provides total import and manufacturing where total sales
data are not available. Therefore, the Health Policy and Systems Research on Antimicrobial Resistance
(HPSR-AMR) team has made an assumption that total annual imports and manufacturing are total annual
consumption, assuming the stock is constant in an efficient market. Recognizing these limitations; the Thailand
SAC team is in the process of rectifying these gaps.
Some countries produce Surveillance of Antimicrobial Consumption (SAC) by using national prescription data
and provide breakdown by retail sector, primary care and hospital sector for human consumption and by animal
species. Although efforts are being made to improve electronic submissions with more detail requested on
distributional channels in humans and by animal species in future SAC reports, Thailand currently has these
limitations.
Consumption in 2017 aims for in-country monitoring of optimizing consumption as mandated by NSP-AMR, it
cannot benchmark Thailand with other international peers due to differences in a) data sources, b) human and
animal epidemiology and disease burden, c) health and legal systems in relation to access to antibiotics and
d) food animal production systems and profiles. Any un-careful interpretations lead to unnecessary disputes
which are counter-productive and not the objective of Thailand SAC.

4 Consumption of antimicrobial agents in Thailand in 2017

Consumption of antimicrobial agents in Thailand in 2017 5
Introduction
0 2

6 Consumption of antimicrobial agents in Thailand in 2017
2. IntroductionThe increased trend of antimicrobial resistance (AMR) is recognized as one of the top global threats to human
security, as it causes serious negative health and economic impact on humans, animals and the environment.
Excessive and inappropriate use of antimicrobials is the main driver of the emergence of resistant bacterial
strains. Massive international travel of humans accelerates the spread of AMR. Hence, combating AMR goes
beyond the capacity of a single agency in a country or a nation. It requires inter-country multi-sectoral actions
and global collective efforts using a ‘One Health’ approach.
Substantial evidence indicates AMR causes significant health and economic burdens. Globally, it causes
approximately 700,000 deaths annually. Failing to tackle AMR will cause 10 million deaths by 2050 and the
highest death toll of 4.7 million is forecast for Asia (3). In Thailand, it causes approximately 38,000 deaths
annually and an economic burden of 1,200 million USD (1 USD = 35 Baht) (4).
The NSP-AMR (2017-2021) is the first Thai strategy to address AMR specifically. The Cabinet endorsed the
NSP-AMR on 17 August 2016 and entrusts the mandate for effective cross-sectoral actions based on the One
Health approach. The NSP-AMR goal is to achieve the reduction of morbidity, mortality and economic impacts
due to AMR by 2021. Two out of the five targets of the NSP-AMR are 20% and 30% reduction in antimicrobial
consumption in humans and animals respectively by 2021. To monitor the achievement of this goal, countries
need to develop a monitoring system on antimicrobial consumption in humans and animals and disseminate
this to policy decision-makers and the general public to increase awareness and encourage greater
accountability of government sectors for optimizing consumption. The detail of NSP-AMR is summarized in
figure 1. To achieve these five goals, the NSP-AMR applies six strategic actions. The strategic actions one to
five cover key areas to resolve AMR, whereas strategic action six aims to develop governance mechanisms to
implement and sustain AMR actions in accordance with the NSP-AMR.

Consumption of antimicrobial agents in Thailand in 2017 7
Figure 1. Summary of National Strategic Plan on Antimicrobial Resistance (2017-2021)
To monitor the progress of optimizing the use of antimicrobial agents in humans and animals, as recommended
by the WHO Global Action Plan, countries need to develop a sustainable system, which monitors antimicrobial
consumption (5). To address this call, the Thailand Working Group on HPSR-AMR, coordinated by International
Health Policy Program (IHPP), Ministry of Public Health (MOPH), Thailand was established in 2015. The goal
of this Working Group is to generate evidence on antimicrobial consumption and embed a sustainable
system for the continuous monitoring of the trend of consumption in humans and animals, compare with other
international peers and support policy decision-making for optimizing consumption.
This report is the first annual report of surveillance of antimicrobial consumption in Thailand using 2017
consumption data.
Vision : Reduction of mortality, morbidity and economic impacts from AMRMission : Establish policies and national multi-sectoral mechanisms which support effective and sustained AMR management systemGoals : 1. 50% reduction in AMR morbidity 2. 20% reduction in antimicrobial consumption in humans 3. 30% reduction in antimicrobial consumption in animals 4. 20% increase in public knowledge on AMR and awareness of appropriate use of antimicrobials 5. Capacity of the national AMR management system is increased to level 4 as measured by the WHO’s Joint Extemal Evaluation Tool (JEE) for International Health Regulations (2005)
Strategies : 1. AMR surveillance system using “One Health” approach 2. Regulation of antimicrobial distribution 3. Infection prevention and control and antimicrobial stewardship in humans 4. AMR prevention and control and antimicrobial stewardship in agriculture and companion animals 5. Public knowledge on AMR and awareness of appropriate use of antimicrobials 6. Governance mechanisms to implement and sustain AMR actions

8 Consumption of antimicrobial agents in Thailand in 2017

Consumption of antimicrobial agents in Thailand in 2017 9
Methods
0 3

10 Consumption of antimicrobial agents in Thailand in 2017
3. Methods3.1 Numerator 3.1.1 Data sources
In Thailand, by law, all medicines for human and veterinary use must be registered with the Thai FDA before
production and importation. The Drug Act (1987) classifies most antibiotics as “dangerous drugs” which need
to be dispensed by licensed pharmacists or veterinarians but which legally do not require prescription at
licensed pharmacies. A few important antibiotics are classified as “special control” medicines, which are
prescription-only medicine.
As mandated by the regulations in the 1987 Drug Act, all pharmaceutical importers and manufacturers shall
submit an annual report of the volume and value (either price list or ex-factory price) of the total production
and/or importation of medicines to the Thai FDA by 31 March of the following year. This report should cover
all medicines licensed to them including antimicrobials. Therefore, the annual report database held by the
Thai FDA covers the total consumption of antimicrobials in both human and veterinary drugs, which is based
on total importation and production of antimicrobials in Thailand.
Figure 2 illustrates antimicrobial distribution through channels used by pharmaceutical operators as submitted
in the annual reports to the Thai FDA including import and manufacture levels (6).
However, there are some limitations. The law does not require operators to report the total export, so the total
consumption data also includes volumes which were actually exported. Future regulation will cover exportation
in order to identify the net from total import and manufacturing, so that estimating total national consumption
is possible. Although there is variation in annual stock, in an efficient pharmaceutical market, the stock level
should be constant every year. Therefore, we assume that the total annual volume of import and manufactured
antimicrobials equal total annual consumption. In addition, this consumption data cannot be disaggregated by
target sector or by animal species as it is not mandated by the Drug Act 1987. In the future development of
Thailand SAC, efforts will be given to mandatory reporting of disaggregated data in both human and animal
sectors.

Consumption of antimicrobial agents in Thailand in 2017 11
MANUFACTURE DISTRIBUTIONPRESCRIPTION
DISPENSING USE
Man
ufac
ture
r
Com
mer
cial
farm
(int
egra
ted
farm
ing
syst
em)
Pet
Plan
tH
umanHum
an c
linic
Hum
an h
ospi
tal
Feed
mill
Who
lesa
ler
Ani
mal
hos
pita
l an
d cl
inic
Feed
sto
reDist
ribut
or
Impo
rter
/di
strib
utor
of A
PIIm
port
er/
man
ufac
ture
r of A
PIIm
port
er/
dist
ribut
orof
FP
Impo
rter
of
FP
Man
ufac
ture
r/im
port
er
Dist
ribut
or/
impo
rter
of A
PI
Dist
ribut
or/
impo
rter
/m
anuf
actu
rer o
f FP
Dist
ribut
or/
man
ufac
ture
r of F
P
Dist
ribut
or/
impo
rter
of
FP
Smal
lhol
der/
com
mer
cial
farm
Dru
g st
ore
IMPORT
Thail
and
SAC
Act
ive
phar
mac
eutic
al in
gred
ient
(API
)
Fini
shed
pro
duct
(FP)
, inc
ludi
ng m
edic
ated
pre
mix
Med
icat
ed fe
ed
Somman
ustw
eech
ai A
, et a
l. Bu
lletin
of W
HO. 2
018; 9
6: 1
01-1
09
Figu
re 2
. T
he ann
ual rep
ort o
f Tha
i FDA
includ
ed data fro
m im
port
and man
ufac
ture
leve
l

12 Consumption of antimicrobial agents in Thailand in 2017
3.1.2 Drug Classification
Database in market authorization is categorized by the research term according to the Anatomical Therapeutic Chemical/Anatomical Therapeutic Chemical classification system for veterinary medicinal products (ATC/ATCvet) classification system (7). For the ATC classification system, Defined Daily Dose (DDD) was employed as units of measurement. The ATC/DDD index of 2018 was used.
3.1.3 Inclusion criteria for antimicrobial consumption in Thailand SAC
For international comparison, the scope of antimicrobials included in the Thailand SAC for humans use includes the “core set” and “optional list” as recommended by WHO’s methodology for a global programme on surveillance of antimicrobial consumption version 1.0 (8); it covers veterinary antimicrobials as recommended by OIE listed in the “OIE List of antimicrobial agents of veterinary importance” (9).
i. Human antimicrobials: core set and optional list
Groups of antimicrobial agents ATC codesI. Core set• Antibacterials
• Antibiotics for alimentary tract
• Nitroimidazole derivatives for protozoal diseases
J01
A07AA
P01ABII. Optional list• Antifungals
• Antimycotics
• Antivirals
• Antimycobacterials for treatment of tuberculosis
• Antimalarials
J02
D01BA
J05
J04A
P01B
ii. Veterinary antimicrobials: antimicrobial agents for intestinal use, intrauterine use, systemic use, and intramammary use
Groups of antimicrobial agents ATCvet codesAntimicrobial agents for intestinal use
Antimicrobial agents for intrauterine use
Antimicrobial agents for systemic use
Antimicrobial agents for intramammary use
QA07AA; QA07AB; QA07AX
QG01AA; QG01AE; QG01BA; QG01BE QG51AA; QG51AG
QJ01
QJ51
Note : Dermatological preparations and preparations for sensory organs were excluded from the Thailand SAC as they are mostly used by companion animals.
3.1.4 Limitations
This report dose not cover export and illegal use of unregistered antimicrobials either through illegal imported
or smuggling, manufacturing and sales.

Consumption of antimicrobial agents in Thailand in 2017 13
3.2 Denominator3.2.1 Human population
The mid-year population in Thailand in 2017 was estimated to be around 72,438,300 people (included migrant
populations) (table 1) (10). Human population in Thailand SAC report includes Thai citizens and international
migrants, while visitors and medical tourism who also consume antibiotics but data is unknown.
Table 1. Mid-year human population in Thailand, 2017
Thai populationMigrant population Total
Male Female Total33,664,899 35,372,614 69,037,513 3,400,787 72,438,300
Source : World Bank, World Development Indicator 2017 Migrant population (10)
3.2.2 Animal population
3.2.2.1 Population correction unit modified by Thailand (PCUThailand
)
Thailand has modified the population correction unit (PCU) methodology, which was established as
a denominator for sales data by ESVAC (11). There are certain species of terrestrial food animals raised in
Thailand but not raised in Europe; hence there is no data on the average weight at the time of treatment (Aw)
for Thailand. Therefore, Thailand SAC developed its own AwThailand
for estimating PCUThailand
for certain food
animals not available in the ESVAC Aw; see details in table 2.
3.2.2.2 Calculation of PCU
On the calculation of PCU by ESVAC, the PCU for each animal category is equivalent to the number of livestock
animals multiplied by Aw.
PCU = Number of livestock animals x average weight at the time of treatment (Aw)
For Aw, Thailand refers to the ESVAC references (12). However, ESVAC does not provide Aw of certain
food-producing animals in Thailand, in particular broiler breeders, layer breeders, laying hens, pullets, broiler
duck breeders, broiler ducks, layer ducks, and dry cows. The Aw of these species equals to “final standing
weight in kilogram” of each new animal category in table 2. This estimation has modified the original concept
of PCU, which was previously established by ESVAC. Hence, the subscript “Thailand” is placed under PCU
in PCUThailand
to indicate this modification. To facilitate future international comparison, ESVAC and OIE are
requested to produce Aw for all animal species worldwide in consultation with relevant country experiences.
PCUThailand
= Number of livestock animals x estimated the final standing weight at slaughterhouse (AwThailand
)

14 Consumption of antimicrobial agents in Thailand in 2017
Total PCUThailand
is equivalent to total PCUThailand
Domestic and we assumed that 1 PCUThailand
= 1 kg of animal
biomass. Note that the total PCUThailand
Export and PCUThailand
Import cannot be estimated; national data
adjudicated by DLD in consultation with all relevant partners are only local production.
Table 2. Weights used to calculate the population correction unit modified by Thailand (PCUThailand
)
Animal category
Weight in kgEurostat Thailand
Pigs Breeding pig 240 Eurostat* - Fattening pig 65 Eurostat* -Poultry Broiler breeder 4 - Thailand Broilers 1 Eurostat* - Layer breeders 2 - Thailand Laying hens 2 - Thailand Pullets 1.5 - Thailand Broiler duck breeders 3.5 - Thailand Integrated broiler ducks 3.3 - Thailand Free-market broiler ducks 3.3 - Thailand Integrated layer ducks 2.5 - Thailand Free-market layer ducks 2.5 - ThailandCattle Dairy cows 425 Eurostat* - Dry cows 425 - Thailand Beef cows 425 Eurostat* -
*Source ESVAC (12)
3.2.2.3 Animal species and categories included in the PCUThailand
The four main species including pigs, poultry, cattle and aquatic animals are included in PCUThailand
. For the
number of livestock animals, the data were collected by Department of Livestock Development (DLD).
In aquaculture, the production volume (metric Tonnes) of fish and shrimp provided by the Department of
Fisheries (DOF) were included in the report. Population statistics for animal populations are presented
in table 3.
Source

Consumption of antimicrobial agents in Thailand in 2017 15
Table 3. Number of animals and population correction unit modified by Thailand (PCUThailand
) by animal category
included in the calculation, 2017
Animal category Number of animals/Tonnes PCUThailand
(kg)
Pigs (heads) Breeding pig 1,113,358 267,205,920.0 Fattening pig 18,411,401 1,196,741,065.0Poultry (heads) Broiler breeder 18,100,000 72,400,000.0 Broilers 1,594,494,720 1,594,494,720.0 Layer breeders 719,900 1,439,800.0 Laying hens 55,643,971 111,287,942.0 Pullets 50,247,469 75,371,203.5 Broiler duck breeders 321,300 1,124,550.0 Integrated broiler ducks 32,130,000 106,029,000.0 Free-market broiler ducks 25,077,362 82,755,294.6 Integrated layer ducks 6,507,447 16,268,617.5 Free-market layer ducks 9,847,138 24,617,845.0Cattle (heads) Dairy cows 245,505 104,339,625.0 Dry cows 273,279 116,143,575.0 Beef cows 4,876,228 2,072,396,900.0Aquatic animals (tonnes)* Coastal aquatic animals 417,300 417,300,000.0 Fresh aquatic animals 329,014 329,014,000.0 Total PCUThailand 6,588,930,057.6
*Including only fish and shrimp
3.2.3 Limitations
There were some limitations due to no available data on the 2017 production of aquatic animals. Therefore, we
estimated the total production of aquatic animals in 2017 by the extrapolation of 2014-2016 production of
aquatic animals’ data, already published by DOF.

16 Consumption of antimicrobial agents in Thailand in 2017
3.3 Analysis and reporting of the data (Unit of measurement) 3.3.1 Human antimicrobials
The main indicator applied in this report to express the consumption of antimicrobials in humans by DDD per
1,000 inhabitants per day (DID):
DDD Per 1,000 inhabitants per day (DID) = Defined daily dose (DDD) x 1,000
Mid-year population x 365
Antimicrobial consumption data were collected according to the ATC classification system and DDD
methodology developed by the WHO Collaborating Centre for Drug Statistics Methodology (13). For the
analysis, DDD listed in the ATC Index with DDD 2018 were used (14). For combination antimicrobials used in
humans, which do not provide DDD assignment, Thailand SAC decided to estimate consumption separately
by different single drugs in these combined formulations. Where there are DDD for these combination
medicines, we use WHO Collaborating Center’s reference.
In 2017 in Thailand, the national consumption of both human and veterinary antimicrobials reported by
importers and manufacturers did not disaggregate by retail sector, primary care and hospitals for humans or by
species in the animal sector.
3.3.2 Veterinary antimicrobials
The national consumption data covered consumption of veterinary antimicrobials in food-producing animals,
which included all pharmaceutical dosage forms of veterinary antimicrobials in the dataset, except tablets that
are used almost solely by companion animals. The consumption of veterinary antimicrobials was measured
by milligrams of active ingredient per population correction unit modified by Thailand (mg/PCUThailand
):
milligrams of active ingredient per population correction unit = Amount consumption in tonnes x 109
modified by Thailand (mg/PCUThailand
) PCUThailand
in kilogram
In consultation with DLD and other partners in the animal sector in Thailand, in this report, the term food-
producing species refers to the four main species, which are pigs, poultry, cattle and aquatic animals including
fish and shrimp. The data are presented according to the classes/subclasses as defined by the ATCvet system.
For combination preparations, each active ingredient was reported in the consumption according to the
ATCvet class/subclass name for each single substance. However, the combined drugs were assigned the
ATCvet code as combination drugs in order to reflect the real market authorizations in Thailand.

Consumption of antimicrobial agents in Thailand in 2017 17
3.4 Validation, data integrity of the annual report
In 2017, the pharmaceutical operators submitted production and/or importation data by using an annual
report’s web-based submission tool (e-submission) operated by the Thai FDA. For the validation process,
data were checked by the Thai FDA’s staffs and HPSR-AMR team to identify outliers, mainly by checking the
dosage form, the strength of each product and the calculation of active ingredients. However, this was
the first time for operators to report on antimicrobial consumption in Thailand, so the data does not allow to
cross-check against data in previous years.
To ensure the quality of mandatory reporting, HPSR-AMR initiated a project to develop a tool to assess
the data quality of pharmaceutical operators who are mandated to provide annual reports to Thai FDA.
The purposes of this project were to 1) verify the quality of the data; 2) assess the system that generates these
data; and 3) develop a System Assessment Protocol (SAP) and Data Verification Protocol (DVP) to improve
both data and systems which produce the data. The project selected a certain number of pharmaceutical
operators. The purpose of the SAP was to identify potential challenges to data quality created by the data
management and reporting systems in selected manufacturers and importers. The assessment of the data
management and reporting systems took place in two stages: off-site desk review of documentation
provided by the operator and on-site follow-up assessments. The outcome of this assessment was strengths
and weaknesses for each functional area of the data management and reporting system, while the purpose
of DVP was to trace and verify the data, to cross-check the reported results with other primary data sources
and spot check if a sample of data had been accurately recorded. The data verification was conducted through
in-depth verifications at the selected sites. The visited sites were purposely selected based on their size and
the quality of their reported data. This project contributes to future quality assurance of pharmaceutical
operator’s information systems management, which finally contributes to the accuracy of mandatory reporting
to the Thai FDA which is the Foundation of Thailand SAC. The SAP and DVP will be extended from pilot phase
to larger samples, ensuring data integrity in the annual mandatory report.
Regarding the denominator (PCUThailand
) data, data gathered by the DLD and DOF, reached consensus among
all stakeholders including Thai Feed Mill Association (TFMA), Animal health Products Association (AHPA) and
HPSR-AMR.
3.4.1 Limitations
The selected pharmaceutical operators were aware before the officers came to their sites. Therefore, it may
have allowed them to prepare themselves, resulting in tending to overestimate capabilities.

18 Consumption of antimicrobial agents in Thailand in 2017
3.5 Summary of included data sources/types
Information profile for which Thailand SAC 2017 was generated such as years of data collection, legal basis for
the data collection at national level, systems for distribution of antimicrobial, sources from which the data were
obtained, type of data, and the limitation were described in table 4.
Table 4. Summary of information on year of data collection, legal basis for collecting data at national level,
national data provider, type and sources for consumption data and limitation
Year of data collection 2017Legal basis Mandatory to reportNational data provider Thai FDA for which Thailand SAC systems will be embedded in Thai FDAType of data Consumption dataSources for consumption data Importers (n=185) and manufacturers (n= 148)Limitation Export included which result in high estimation of consumption.
Box 1. Most important technical remarks on interpretation of Thailand SAC
1. Careful interpretation of results in this report is required. As sales data is not available, hence Thailand SAC
assumes stock remains constant across years and that the total production and importation equal total
consumption. This assumption needs verifications. Reports to FDA do not a) cover certain unknown size
of illegal importation and production of finished products, b) provide export volume, c) conduct on-site
verification of potential under-reporting and inaccuracy, and d) verify the potential double counting.
All these limitations can result in either over- or under-estimate of total consumption. HPSR-AMR recognizes
these limitations and decides that they will be gradually overcome in future reports.
2. This report provides 2017 baseline for monitoring progress to achieve 20% and 30% reduction in
antimicrobial consumption in humans and animals.
3. Consumption in 2017 cannot benchmark Thailand with other international peers due to differences in
a) data sources, b) human and animal epidemiology and disease burden, c) health and legal systems in
relation to access to antibiotics and d) food animal production systems. Any careless interpretations lead
to unnecessary disputes which are counter-productive and not the objective of Thailand SAC.

Consumption of antimicrobial agents in Thailand in 2017 19
Results
0 4

20 Consumption of antimicrobial agents in Thailand in 2017
4. Results4.1 Human antimicrobials4.1.1 Total consumption of human antimicrobials (DDD/1,000 inhabitants/day)
Overall, the consumption of human antimicrobials (within the scope of Thailand SAC) in Thailand in 2017 was
75.68 DDD/1,000 inhabitants/day (table 5). The consumption in each group of human antimicrobials was shown
in table 6. Of these, the antibacterials (J01) group was the highest consumption in humans, with the amount of
52.96 DDD/1,000 inhabitants/day, followed by antivirals (J05) with the amount of 13.02 DDD/1,000 inhabitants/
day and antifungals (J02) with the amount of 4.98 DDD/1,000 inhabitants/day.
Table 5. Consumption, in DDD, of human antimicrobials, population and consumption in DDD/1,000 inhabitants/
day, in 2017
Consumption (DDD) Human population Consumption(DDD/1,000 inhabitants/day)
Thailand 2,001,014,477 72,438,300 75.68
Footnote :
a. Careful interpretation of results in this report is required. As sales data is not available, hence Thailand SAC
assumes stock remains constant across years and that the total production and importation equal total
consumption. This assumption needs verifications. Reports to FDA do not a) cover certain unknown size of
illegal importation and production of finished products, b) provide export volume, c) conduct on-site
verification of potential under-reporting and inaccuracy, and d) verify the potential double counting. All these
limitations can result in either over- or under-estimate of total consumption. HPSR-AMR recognizes these
limitations and decides that they will be gradually overcome in future reports.
b. This report provides 2017 baseline for monitoring progress to achieve 20% and 30% reduction in antimicrobial
consumption in humans and animals.
c. Consumption in 2017 cannot benchmark Thailand with other international peers due to differences in a) data
sources, b) human and animal epidemiology and disease burden, c) health and legal systems in relation to
access to antibiotics and d) food animal production systems and profiles. Any un-careful interpretations
lead to unnecessary disputes which are counter-productive and not the objective of Thailand SAC.

Consumption of antimicrobial agents in Thailand in 2017 21
Table 6. Consumption of human antimicrobials in Thailand, expressed as DDD/1,000 inhabitants/day, core set
and optional list by ATC code, 2017*
Targeted human antimicrobial Consumption (DDD/1,000 inhabitants/day)1. Core set 1.1 Antibacterials (J01) 1.2 Antibiotics for alimentary tract (A07AA) 1.3 Nitroimidazole derivatives for protozoal diseases (P01AB)
52.960.040.58
2. Optional list 2.1 Antifungals (J02) 2.2 Antimycotics (D01BA) 2.3 Antivirals (J05) 2.4 Antimycobacterials for treatment of tuberculosis (J04A) 2.5 Antimalarials (P01B)
4.980.4013.022.221.48
Total consumption 75.68
* Interpretation and use of the data in this table should take into account the limitation described in Box 1 page 18.
4.1.2 Consumption of targeted human antimicrobial groups
1. Core set
1.1 Consumption of antibacterials for systemic use (ATC group J01) in DDD/1,000 inhabitants/day
Of the total consumption of major subgroups of antibacterials for systemic use (ATC level 2 group J01)
in 2017, the most frequently used antibacterials at ATC level 3, expressed as DDD/1,000 inhabitants/day,
was Beta-lactams, Penicillins (21.30), followed by other Beta-lactam antibacterials (15.98), Tetracyclines (6.04)
and Quinolones antibacterials (4.18) (table 7 and figure 3).
Table 7. Consumption of antibacterials for systemic use (ATC group J01) by ATC level 3 in Thailand, 2017,
expressed as DDD/1,000 inhabitants/day*
ATC level 3 Groups of substancesConsumption
(DDD/1,000 inhabitants/day)
J01AJ01BJ01CJ01DJ01EJ01FJ01GJ01MJ01X
Tetracyclines AmphenicolsBeta-lactams, PenicillinsOther beta-lactam antibacterialsSulfonamides and trimethoprimMacrolides, lincosamides and streptograminsAminoglycoside antibacterialsQuinolones antibacterialsOther antibacterials
6.040.1121.3015.981.633.400.254.180.0752.96
* Interpretation and use of the data in this table should take into account the limitation described in Box 1 page 18.
Total (ATC group J01)

22 Consumption of antimicrobial agents in Thailand in 2017
Figure 3. Relative amount of antibacterials consumption for systemic use (ATC group J01) classified by ATC
level 3 in Thailand, 2017, expressed as percentages of the total consumption in DDD
In ATC level 4, Penicillins with extended spectrum (J01CA) was the highest consumption, it was 16.56
DDD/1,000 inhabitants/day, followed by Third-generation Cephalosporins (J01DD) (14.87 DDD/1,000 inhabitants/day)
and Tetracyclines (J01AA) (6.04 DDD/1,000 inhabitants/day) (table 8).
Other antibacterials (J01X) 0.13%
Tetracyclines (J01A) 11.38%
Amphenicols (J01B) 0.20%
Beta-lactams, penicillins (J01C) 40.22%
Quinolones antibacterials (J01M) 7.90%
Aminoglycoside antibacterials (J01G) 0.47%
Macrolides, Lincosamides and streptogramins (J01F) 6.40%
Sulfonamides and trimethoprim (J01E) 3.07%
Other beta-lactam antibacterials (J01D) 30.23%
0.13%
11.38%0.20%
0.47%
3.07%
40.22%30.23%
6.40%7.90%

Consumption of antimicrobial agents in Thailand in 2017 23
Table 8. Consumption of antibacterials for systemic use (ATC group J01) by ATC group level 3 and 4 in Thailand,
2017, expressed as DDD/1,000 inhabitants/day*
ATC group level 3 ATC group level 4 Consumption(DDD/1,000 inhabitants/day)
J01A Tetracyclines J01AA Tetracyclines 6.04J01B Amphenicols J01BA Amphenicols 0.11J01C Beta-lactams,
penicillins 21.30
J01CAJ01CEJ01CFJ01CGJ01CR
Penicillins with extended spectrum Beta-lactamase sensitive penicillinsBeta-lactamase resistant penicillinsBeta-lactamase inhibitorsCombinations of penicillins, incl. beta-lactamase inhibitors
16.560.152.08<0.012.51
J01D Other beta-lactam antibacterials
15.98
J01DBJ01DCJ01DDJ01DEJ01DH
First-generation cephalosporins Second-generation cephalosporinsThird-generation cephalosporinsFourth-generation cephalosporinsCarbapenems
0.740.2814.87<0.010.09
J01E Sulfonamides and trimethoprim
1.63
J01EAJ01EBJ01ECJ01EDJ01EE
Trimethoprim and derivatives Short-acting sulfonamidesIntermediate-acting sulfonamidesLong-acting sulfonamidesCombinations of sulfonamides and trimethoprim, incl. derivatives
<0.010.020.160.021.43
J01F Macrolides, lincosamides and streptogramins
3.40
J01FAJ01FF
MacrolidesLincosamides
2.740.66
J01G Aminoglycoside antibacterials
0.25
J01GAJ01GB
StreptomycinsOther aminoglycosides
0.050.20
J01M Quinolones antibacterials
J01MA Fluoroquinolones 4.18
J01X Other antibacterials 0.07J01XAJ01XBJ01XDJ01XEJ01XX
Glycopeptide antibacterialsPolymyxinsImidazole derivativesNitrofuran derivativesOther antibacterials
0.010.010.030.010.0152.96
* Interpretation and use of the data in this table should take into account the limitation described in Box 1 page 18.
Total (ATC group J01)

24 Consumption of antimicrobial agents in Thailand in 2017
Analysis by ATC level 5, amoxicillin was the largest consumption of antibacterials for systemic use (ATC group J01) in humans in Thailand, at consumption levels of 15.10 DDD/1,000 inhabitants/day, followed by ceftriaxone at 13.57 DDD/1,000 inhabitants/day, and tetracycline at 3.55 DDD/1,000 inhabitants/day (table 9).
Table 9. Top ten antibacterials for systemic use (ATC group J01), in DDD/1,000 inhabitants/day, analyzed by ATC level 5 in Thailand, in 2017*
Rank ATC level 5 Antibacterials for systemic use(ATC group J01)
Consumption(DDD/1,000 inhabitants/day)
1 J01CA04 amoxicillin 15.102 J01DD04 ceftriaxone 13.573 J01AA07 tetracycline 3.554 J01CR02 amoxicillin and enzyme inhibitor 2.465 J01AA02 doxycycline 2.426 J01MA06 norfloxacin 2.077 J01FA06 roxithromycin 1.598 J01CA01 ampicillin 1.469 J01EE01 sulfamethoxazole and trimethoprim 1.4310 J01CF01 dicloxacillin 1.38
45.03
* Interpretation and use of the data in this table should take into account the limitation described in Box 1 page 18.
1.2 Consumption of antibiotics for alimentary tract and metabolism (ATC group A07AA) in DDD/1,000 inhabitants/day
In 2017, consumption of antibiotics for alimentary tract and metabolism (ATC group A07AA) was 0.04 DDD/1,000 inhabitants/day (table 10). In 2017, consumption of nystatin and neomycin were similar, it was 0.02 DDD/1,000 inhabitants/day.
Table 10. Consumption of antibiotics for alimentary tract and metabolism (ATC group A07AA) in Thailand in 2017, expressed as DDD/1,000 inhabitants/day, analyzed by ATC level 5*
Total top ten of consumption
* Interpretation and use of the data in this table should take into account the limitation described in Box 1 page 18.
1.3 Consumption of Nitroimidazole derivatives (ATC group P01AB) in DDD/1,000 inhabitants/day
In 2017, the consumption of substances used to treat protozoal diseases (ATC group P01AB) was 0.58 DDD/1,000 inhabitants/day. The highest consumption of nitroimidazole derivatives drugs in this group was metronidazole, at 0.55 DDD/1,000 inhabitants/day, and small amount of tinidazole at 0.03 DDD/1,000 inhabitants/day.
ATC level 5 Substances Consumption (DDD/1,000 inhabitants/day)A07AA01A07AA02
neomycinnystatin
0.020.020.04Total (ATC group A07AA)

Consumption of antimicrobial agents in Thailand in 2017 25
Table 11. Consumption of Nitroimidazole derivatives (ATC group P01AB) in Thailand in 2017, expressed as
DDD/1,000 inhabitants/day, analyzed by ATC level 5*
* Interpretation and use of the data in this table should take into account the limitation described in Box 1 page 18.
2. Optional list
2.1 Consumption of antimycotics and antifungals for systemic use (ATC groups J02 and D01BA) in
DDD/1,000 inhabitants/day
In 2017, Thailand consumption of antimycotics and antifungals for systemic use (ATC groups J02 & D01BA)
was 5.38 DDD/1,000 inhabitants/day (table 12). Ketoconazole was the most consumed antimycotics and
antifungals for systemic use in Thailand, showing 4.31 DDD/1,000 inhabitants/day. Consumption of other
antimycotics in this group is insignificant.
Table 12. Consumption of antimycotics and antifungals for systemic use (ATC groups J02 and D01BA) in
Thailand in 2017, expressed as DDD/1,000 inhabitants/day*
ATC level 5 Substances Consumption (DDD/1,000 inhabitants/day)P01AB01P01AB02
metronidazoletinidazole
0.550.030.58
ATC level 5 Substances Consumption (DDD/1,000 inhabitants/day)J02AA01J02AB02J02AC01J02AC02J02AC03J02AC04J02AX04J02AX05J02AX06D01BA01D01BA02
amphotericin Bketoconazolefluconazoleitraconazolevoriconazoleposaconazolecaspofunginmicafunginanidulafungingriseofulvinterbinafine
0.014.310.360.290.01<0.01<0.01<0.01<0.010.40<0.015.38
Total (ATC group P01AB)
Total (ATC group J02 and D01BA)
* Interpretation and use of the data in this table should take into account the limitation described in Box 1 page 18.
2.2 Consumption of antivirals for systemic use (ATC group J05) in DDD/1,000 inhabitants/day
In 2017, there were 316,600 people living with HIV/AIDS who are on antiretroviral treatment (15) fully subsidized
by the three public health insurance schemes; and free at point of service. In 2017, the consumption of antivi-
rals for systemic use (ATC group J05) was 13.02 DDD/1,000 inhabitants/day (table 13). Of these, the most
consumed antivirals for systemic use (ATC group J05) in Thailand was efavirenz, observing 3.08 DDD/1,000
inhabitants/day.

26 Consumption of antimicrobial agents in Thailand in 2017
Table 13. Consumption of antivirals for systemic use (ATC group J05) in Thailand in 2017, expressed as
DDD/1,000 inhabitants/day*
ATC level 5 Substances Consumption (DDD/1,000 inhabitants/day)J05AB01J05AB06J05AB09J05AB11J05AB14J05AE08J05AE10J05AF01J05AF02J05AF04J05AF05J05AF06J05AF07J05AF08J05AF09J05AF10J05AF11J05AG01J05AG03J05AG04J05AG05J05AH01J05AH02J05AP01J05AP07J05AP08J05AR10J05AX05J05AX08J05AX09J05AX12
acyclovirganciclovirfamciclovirvalaciclovirvalgancicloviratazanavirdarunavirzidovudinedidanosinestavudinelamivudineabacavir tenofovir disoproxiladefovir dipivoxilemtricitabineentecavirtelbivudinenevirapineefavirenzetravirinerilpivirinezanamiviroseltamivirribavirindaclatasvirsofosbuvirlopinavir and ritonavirinosine pranobexraltegravirmaravirocdolutegravir
0.17<0.01<0.01<0.01<0.010.050.010.82<0.010.152.730.112.160.011.660.090.021.183.08<0.010.19<0.010.040.02<0.01<0.010.52<0.010.01<0.01<0.0113.02Total (ATC group J05)
* Interpretation and use of the data in this table should take into account the limitation described in Box 1 page 18.
Consumption of antimicrobial agents in Thailand in 2017 27
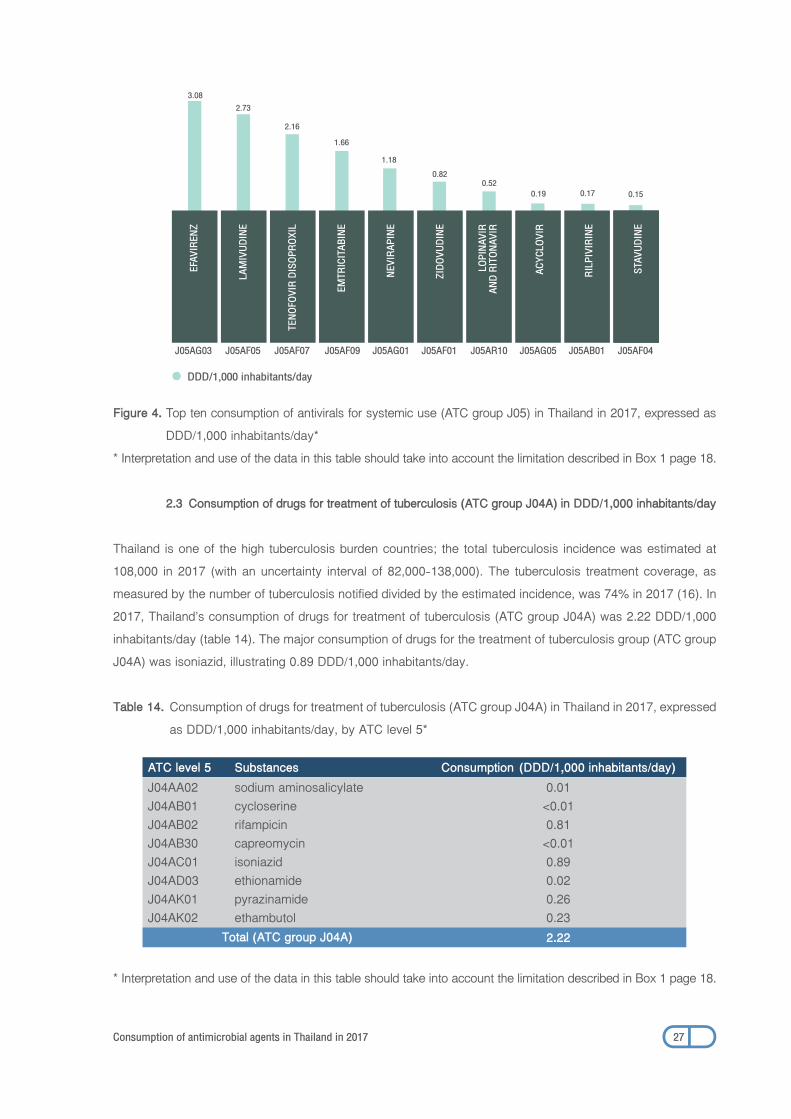
Figure 4. Top ten consumption of antivirals for systemic use (ATC group J05) in Thailand in 2017, expressed as
DDD/1,000 inhabitants/day*
* Interpretation and use of the data in this table should take into account the limitation described in Box 1 page 18.
2.3 Consumption of drugs for treatment of tuberculosis (ATC group J04A) in DDD/1,000 inhabitants/day
Thailand is one of the high tuberculosis burden countries; the total tuberculosis incidence was estimated at
108,000 in 2017 (with an uncertainty interval of 82,000-138,000). The tuberculosis treatment coverage, as
measured by the number of tuberculosis notified divided by the estimated incidence, was 74% in 2017 (16). In
2017, Thailand’s consumption of drugs for treatment of tuberculosis (ATC group J04A) was 2.22 DDD/1,000
inhabitants/day (table 14). The major consumption of drugs for the treatment of tuberculosis group (ATC group
J04A) was isoniazid, illustrating 0.89 DDD/1,000 inhabitants/day.
Table 14. Consumption of drugs for treatment of tuberculosis (ATC group J04A) in Thailand in 2017, expressed
as DDD/1,000 inhabitants/day, by ATC level 5*
* Interpretation and use of the data in this table should take into account the limitation described in Box 1 page 18.
J05AG03 J05AF05 J05AF07 J05AF09 J05AG01 J05AF01 J05AR10 J05AG05 J05AB01 J05AF04
3.082.73
2.161.66
1.180.82
0.19 0.17 0.150.52
DDD/1,000 inhabitants/day
EFAV
IREN
Z
LAM
IVUD
INE
TENO
FOVI
R DI
SOPR
OXIL
EMTR
ICIT
ABIN
E
NEVI
RAPI
NE
ZIDO
VUDI
NE
LOPI
NAVI
RAN
D RI
TONA
VIR
ACYC
LOVI
R
RILP
IVIR
INE
STAV
UDIN
E
ATC level 5 Substances Consumption (DDD/1,000 inhabitants/day)J04AA02J04AB01J04AB02J04AB30J04AC01J04AD03J04AK01J04AK02
sodium aminosalicylatecycloserinerifampicincapreomycinisoniazidethionamidepyrazinamideethambutol
0.01<0.010.81<0.010.890.020.260.232.22Total (ATC group J04A)

28 Consumption of antimicrobial agents in Thailand in 2017
2.4 Consumption of antimalarials (ATC group P01B) in DDD/1,000 inhabitants/day
In 2017, Thailand consumed antimalarials (ATC group P01B) at the amount of 1.48 DDD/1,000 inhabitants/
day (table 15). Of these, chloroquine was the highest consumption in this group, showing 0.75 DDD/1,000
inhabitants/day.
Table 15. Consumption of antimalarials (ATC group P01B) in Thailand in 2017, expressed as DDD/1,000
inhabitants/day*
* Interpretation and use of the data in this table should take into account the limitation described in Box 1 page 18.
4.1.3 Consumption by critically important antibiotics by ATC level 3/4/5
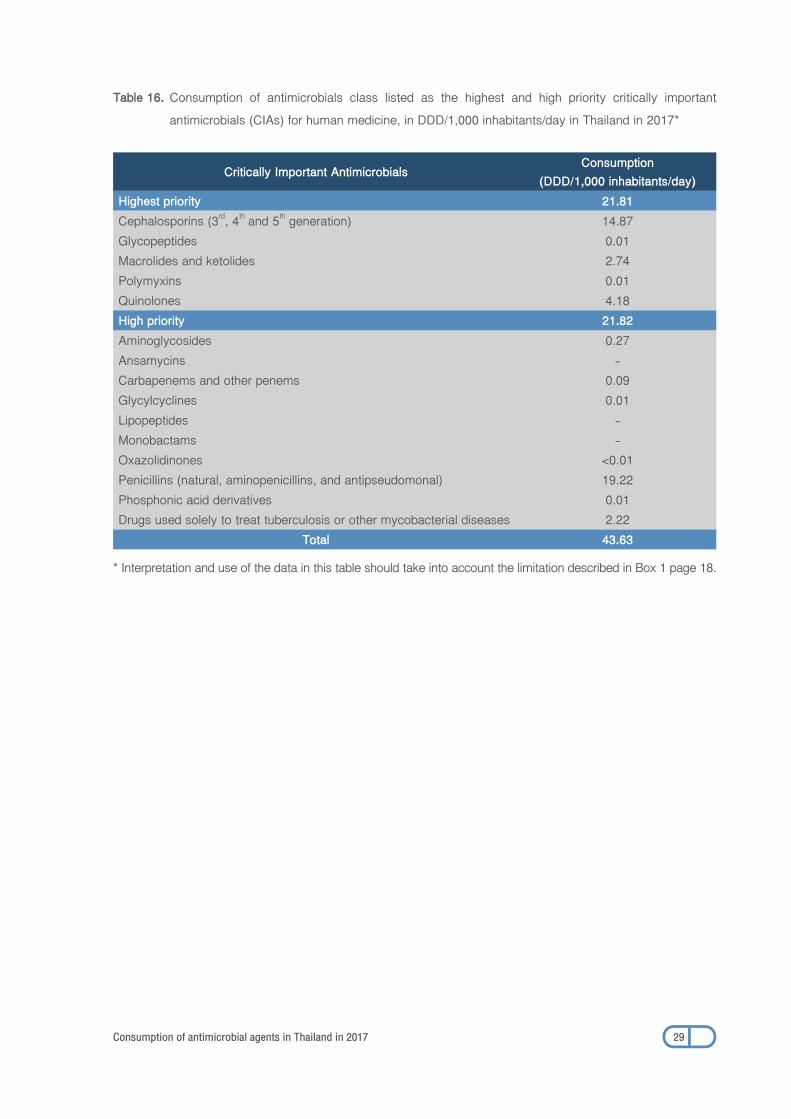
In 2016, WHO has updated the antimicrobials classes list of the CIAs for human medicine (12,17). Detailed
criteria for WHO’s classification of CIAs can be found in annex 4 and table 16. The total consumption of
antimicrobials classes list of the CIAs for human medicine in Thailand was 43.63 DDD/1,000 inhabitants/day.
Of these, the highest priority CIA was 21.81 DDD/1,000 inhabitants/day, while the high priority CIAs consumed
21.82 DDD/1,000 inhabitants/day. See table 16.
On the highest priority CIAs group, in 2017, Cephalosporins (3rd, 4th and 5th generation) (14.87 DDD/1,000
inhabitants/day) was the highest consumption among the highest priority CIAs for human medicine, followed
by Quinolones (4.18 DDD/1,000 inhabitants/day), Macrolides and ketolides (2.74 DDD/1,000 inhabitants/
day), Glycopeptides (0.01 DDD/1,000 inhabitants/day) and Polymyxins (0.01 DDD/1,000 inhabitants/day),
respectively.
Among the high priority critically important antimicrobial group; Penicillins (natural, aminopenicillins and
anti-pseudomonal) had the highest consumption at 19.22 DDD/1,000 inhabitants/day; this was followed
by drugs used solely for the treatment of tuberculosis and other mycobacterial diseases at 2.22 DDD/1,000
inhabitants/day.
ATC level 5 Substances Consumption (DDD/1,000 inhabitants/day)P01BA01P01BA02P01BA03P01BA06P01BC01P01BC02P01BD01P01BF01
chloroquinehydroxychloroquineprimaquineamodiaquinequininemefloquinepyrimethamineartemether and lumefantrine
0.750.190.02<0.010.04<0.010.48<0.011.48Total (ATC group P01B)
Consumption of antimicrobial agents in Thailand in 2017 29
Table 16. Consumption of antimicrobials class listed as the highest and high priority critically important
antimicrobials (CIAs) for human medicine, in DDD/1,000 inhabitants/day in Thailand in 2017*
Critically Important AntimicrobialsConsumption
(DDD/1,000 inhabitants/day)Highest priority 21.81Cephalosporins (3rd, 4th and 5th generation) 14.87Glycopeptides 0.01Macrolides and ketolides 2.74Polymyxins 0.01Quinolones 4.18High priority 21.82Aminoglycosides 0.27Ansamycins -Carbapenems and other penems 0.09Glycylcyclines 0.01Lipopeptides -Monobactams -Oxazolidinones <0.01Penicillins (natural, aminopenicillins, and antipseudomonal) 19.22Phosphonic acid derivatives 0.01Drugs used solely to treat tuberculosis or other mycobacterial diseases 2.22
Total 43.63
* Interpretation and use of the data in this table should take into account the limitation described in Box 1 page 18.

30 Consumption of antimicrobial agents in Thailand in 2017
4.2 Veterinary antimicrobials4.2.1 Total national consumption per population-corrected unit for food-producing animals, by antimicrobial class
The consumption of veterinary antimicrobial agents for food-producing animals, expressed as mg consumption
per population correction unit modified by Thailand (PCUThailand
), was 711.56 mg/PCUThailand
. The consumption
patterns of the antimicrobial classes are shown in table 17. Of the national consumption of veterinary
antimicrobials in 2017, the largest amount, expressed as mg/PCUThailand
, was Penicillins (QJ01C) (177.42 mg/
PCUThailand
, 24.93%), followed by Intestinal antiinfectives (QA07A) (154.00 mg/PCUThailand
, 21.64%), and
Sulfonamides and Trimethoprim (QJ01E) (124.89 mg/PCUThailand
, 17.55%), respectively. Overall, these three
classes contributed to 64.12% of total national consumption in Thailand.
Table 17. Consumption, in tonnes of active ingredient of veterinary antimicrobial drugs marketed mainly for
food-producing animals, and population correction unit modified by Thailand (PCUThailand
) and
consumption in mg/PCUThailand
, 2017
Consumption (tonnes) forfood-producing animals
PCUThailand
(1,000 tonnes)Total national consumption
mg/PCUThailand
Thailand 4,688.41 6,588.93 711.56
Footnote:
a. Careful interpretation of results in this report is required. As sales data is not available, hence Thailand SAC
assumes stock remains constant across years and that the total production and importation equal total
consumption. This assumption needs verifications. Reports to FDA do not a) cover certain unknown size
of illegal importation and production of finished products, b) provide export volume, c) conduct on-site
verification of potential under-reporting and inaccuracy, and d) verify the potential double counting. All these
limitations can result in either over- or under-estimate of total consumption. HPSR-AMR recognizes these
limitations and decides that they will be gradually overcome in future reports.
b. This report provides 2017 baseline for monitoring progress to achieve 20% and 30% reduction in antimicrobial
consumption in humans and animals.
c Consumption in 2017 cannot benchmark Thailand with other international peers due to differences in a) data
sources, b) human and animal epidemiology and disease burden, c) health and legal systems in relation to
access to antibiotics and d) food animal production systems and profiles. Any un-careful interpretations
lead to unnecessary disputes which are counter-productive and not the objective of Thailand SAC.

Consumption of antimicrobial agents in Thailand in 2017 31
Table 18. Consumption of antimicrobial agents by food-producing animals, in mg per population correction unit
modified by Thailand (mg/PCUThailand
), of the various veterinary antimicrobial classes by ATCvet
level 3 and level 4 in Thailand in 2017*
Consumption(mg/PCU
Thailand)
QA07A Intestinal antiinfectives 154.00QA07AA Antibiotics 50.99QA07AX Other intestinal antiinfectives 103.01
QG51A Antiinfectives and antiseptics for intrauterine use
QG51AA Antibacterials <0.01
QJ01A Tetracyclines QJ01AA Tetracyclines 110.14QJ01B Amphenicols QJ01BA Amphenicols 0.01QJ01C Beta-lactam
antibacterials, Penicillins 177.42
QJ01CA Penicillins with extended spectrum 175.25QJ01CE Beta-lactamase sensitive Penicillins 2.04QJ01CF Beta-lactamase resistant Penicillins <0.01QJ01CR Combinations of Penicillins, incl.
beta-lactamase inhibitors0.13
QJ01D Other Beta-lactamantibacterials
0.98
QJ01DC Second-generation Cephalosporins <0.01QJ01DD Third-generation Cephalosporins 0.22QJ01DE Fourth-generation Cephalosporins 0.76
QJ01E Sulfonamides andTrimethoprim
124.89
QJ01EA Trimethoprim and derivatives 21.99QJ01EQ Sulfonamides 102.90
QJ01F Macrolides, Lincosamidesand Streptogramins
58.30
QJ01FA Macrolides 54.67QJ01FF Lincosamides 3.64
QJ01G Aminoglycosidesantibacterials
22.61
QJ01GA Streptomycins 1.97QJ01GB Other aminoglycosides 20.64
QJ01M Quinolone and Quinoxaline antibacterials
QJ01MA Fluoroquinolones 10.85
QJ01X Other antibacterials 52.30QJ01XQ Pleuromutilins 48.54QJ01XX Other antibacterials 3.76
QJ51A Tetracyclines for intramammary use
QJ51AA Tetracyclines <0.01
ATC group level 3 ATC group level 4

32 Consumption of antimicrobial agents in Thailand in 2017
Consumption(mg/PCU
Thailand)
QJ51C Beta-lactam antibacterials, Penicillins for intramammary use
0.05
QJ51CA Penicillins with extended spectrum 0.02QJ51CF Beta-lactamase resistant penicillins 0.03
QJ51D Other beta-lactam antibacterials, Penicillins for intramammary use
<0.01
QJ51DB First-generation cephalosporins <0.01QJ51DE Fourth-generation cephalosporins <0.01
QJ51G Aminoglycoside antibacterials for intramammary use
QJ51GB Other aminoglycosides <0.01
Total 711.56
* Interpretation and use of the data in this table should take into account the limitation described in Box 1 page 18.
Of the total consumption of all classes, amoxicillin was the largest veterinary antimicrobial used in food-
producing animals in Thailand, (174.96 mg/PCUThailand
, 24.59%), followed by halquinol (103.01 mg/PCUThailand
,
14.48%), sulfadimidine (99.51 mg/PCUThailand
, 13.98%), respectively. The top ten consumption in table 19 was
621.96 mg/PCUThailand
which was 87.40% of total national consumption by food-producing animals. Policy
attention should be given to monitor the appropriate use in these top ten ATCvet level 5 will contribute to
optimizing of consumption.
Table 19. Top ten veterinary antimicrobial consumption in food-producing animals, in mg per population
correction unit modified by Thailand (mg/PCUThailand
), of the various veterinary antimicrobial
classes by ATC level 5 in Thailand in 2017*
Rank ATCvet level 5 Veterinary antimicrobial drugsConsumption(mg/PCU
Thailand)
1 QJ01CA04 amoxicillin 174.962 QA07AX91 halquinol 103.013 QJ01EQ03 sulfadimidine 99.514 QJ01AA03 chlortetracycline 58.195 QJ01XQ01 tiamulin 48.546 QJ01AA02 doxycycline 39.317 QA07AA10 colistin 33.058 QJ01FA91 tilmicosin 23.769 QJ01EA01 trimethoprim 21.9910 QJ01GB03 gentamicin 19.64
621.96
* Interpretation and use of the data in this table should take into account the limitation described in Box 1 page 18.
Total top ten veterinary antimicrobial consumption
ATC group level 3 ATC group level 4

Consumption of antimicrobial agents in Thailand in 2017 33
4.2.2 Consumption by WHO critically important antimicrobials
Throughout this report, there is a special focus on antimicrobials classes listed in the WHO list (5th revision
(http://who.int/foodsafety/cia/en)) (15) of CIAs for human medicine. Detailed criteria for WHO’s classification of
highest priority CIAs can be found in annex 4. The total consumption of these antimicrobial classes in the CIAs
list in Thailand by food-producing animals was 308.09 mg/PCUThailand
(43.30% of the total national consumption
of veterinary antimicrobial in 2017). Of these, the consumption of the highest priority CIA by food-producing
animals was 99.55 mg/PCUThailand
, (13.99% of total national consumption) while the high priority CIA consumed
208.54 mg/PCUThailand
(29.31% of total national consumption). The proportion of consumption, in mg/PCUThailand
,
of these classes/subclasses in Thailand is shown in figure 5.
On the highest priority CIAs group, the consumption (mg/PCUThailand
) of 3rd and 4th generation Cephalosporins,
Macrolides, Polymyxins, and Fluoroquinolones accounted for 0.98 mg/PCUThailand
(0.14%), 54.67 mg/PCUThailand
(7.68%), 33.05 mg/PCUThailand
(4.64%) and 10.85 mg/PCUThailand
(1.53%), of the total consumption in Thailand in
2017, respectively.
Table 20. Consumption of antimicrobials class listed as the critically important antimicrobials (CIAs) for human
medicine, in mg per population correction unit modified by Thailand (mg/PCUThailand
), in food-producing
animals in Thailand, 2017*
Groups of substances Consumption (mg/PCUThailand
)
Highest priority 99.55Cephalosporins (3rd, 4th and 5th generation) 0.98Glycopeptides -Macrolides and ketolides 54.67Polymyxins (colistin) 33.05Fluoroquinolones 10.85High priority 208.54Aminoglycosides 29.56Ansamycins -Carbapenems and other penems -Glycylcyclines -Lipopeptides -Monobactams -Oxazolidinones -Penicillins (natural, aminopenicillins, and antipseudomonal) 177.47Phosphonic acid derivatives 1.51Drugs used solely to treat tuberculosis or other mycobacterial diseases -Total 308.09
* Interpretation and use of the data in this table should take into account the limitation described in Box 1 page 18.

34 Consumption of antimicrobial agents in Thailand in 2017
Figure 5. Proportion of the total consumption of antimicrobials in WHO’s critically important antimicrobials (CIAs) list in food-producing animals, expressed as percentages of the total consumption in mg in Thailand in 2017 4.2.3 Consumption of veterinary antimicrobial agents for food-producing animals by route administration
The consumption of veterinary antimicrobial agents for food-producing animals stratified by pharmaceutical forms is shown in figure 6.
Figure 6. Distribution of consumption of veterinary antimicrobial agents for food-producing animals, in mg per population correction unit modified by Thailand (mg/PCU
Thailand), by pharmaceutical form in Thailand
for 2017
52.12%
5.32%0.01%<0.01%
24.07%
18.48%Premix
Oral powderInjection
Intramammary prep.
OhersOral solution
Phosphonic acid derivatives(Fosfomycin) 0.21%
Penicillins 24.94%
Aminoglycosides 4.15%
Non CIA 56.70%
Polymyxins(Colistin) 4.65%
3rd and 4th Generation Cephalosporins 0.14%Fluoroquinolones 1.53%
Macrolides and ketolides 7.68% 56.70% 24.94%
4.15%
7.68%
4.65% 0.14%1.53%
0.21%

Consumption of antimicrobial agents in Thailand in 2017 35
The consumption (mg/PCUThailand
) of medicated premixes accounted for 52.12% of the total national consumption of veterinary antimicrobial, while 24.07% were in oral powders, 18.48% oral solutions, 5.32% injection, 0.01% as intramammary preparations and less than 0.01% was others including oral pastes, vaginal tablets and intrauterine preparations.
The consumption of CIAs by pharmaceutical form in Thailand was shown in figure 7 where a great variation was noted. A majority, 87.73% of Polymyxins (colistin) and 65.31% of Macrolides and ketolides consumption were through medicated premix. Third and fourth generation of Cephalosporins were almost solely administered through injection of individual animal (99.91%), while 82.99% of Quinolones was administered through oral
solution.
Figure 7. Distribution of consumption of WHO highest priority CIAs for food-producing animals by five forms of
pharmaceutical administration, 2017
87.73%
82.99%65.31%
2.15%
32.25%
12.03%
0.29%0.02%
4.96%
12.22%
0.05% 0.09%
99.91%
Polymyxins (Colistin)
Quinolones Macrolides and ketolides
3rd and 4th generation Cephalosporins
Injection Oral powder Premix
Injection Oral powderOral solution Premix
Injection Oral powderOral solution Premix
Injection Intramammary prep.

36 Consumption of antimicrobial agents in Thailand in 2017
4.3 Consumption of critically important antimicrobials in humans and animals
Alarmingly, the preserved items for humans as a last resort was used in human consumption at a rate of 43.63
DDD/1,000 inhabitants/day, or 57.65% of total national consumption; and 308.09 mg per PCUThailand
, or 43.30%
of total consumption in the animal sector.
Table 21. Consumption of critically important antibiotics: highest and high priority by humans and food-producing
animals, 2017 Thailand*
Human consumption DDD/1,000 inhabitants/day %• Highest priority CIA 21.81 28.82%• High priority CIA 21.82 28.83%Total CIA use by human sector 43.63 57.65%Total national consumption in human 75.68
Consumption in food producing animals mg /PCUThailand %• Highest priority CIA 99.55 13.99%• High priority CIA 208.54 29.31%Total CIA used by animal sector 308.09 43.30%Total national consumption in animal 711.56
* Interpretation and use of the data in this table should take into account the limitation described in Box 1 page 18.

Consumption of antimicrobial agents in Thailand in 2017 37
Annex
0 5

38 Consumption of antimicrobial agents in Thailand in 2017
Annex 1 TerminologyAcronyms
AI Active ingredient
AMR Antimicrobial Resistance
AMU Antimicrobial Use
API Active Pharmaceutical Ingredient
ATC Anatomical Therapeutic Chemical
ATCvet Anatomical Therapeutic Chemical classification system for veterinary medicinal products
Aw Average weight at the time of treatment
CIA Critically Important Antimicrobials
DDD Defined Daily Dose
DID Defined Daily Doses/1000 inhabitants/day
DLD Department of Livestock Development
DOF Department of Fisheries
ESAC-Net European Surveillance of Antimicrobial Consumption Network
ESVAC European Surveillance of Veterinary Antimicrobial Consumption
FAO Food and Agricultural Organization
FDA Food and Drug Administration
GDP Gross Domestic product
HPSR-AMR Health Policy and Systems Research on Antimicrobial Resistance
IHPP International Health Policy Program
MOAC Ministry of Agriculture and Cooperatives
MOPH Ministry of Public Health
NSP-AMR National Strategic Plan on Antimicrobial Resistance
OIE World Organization for Animal Health
PCU Population correction unit
Thailand SAC Thailand Surveillance of Antimicrobial Consumption
VMPs Veterinary Medicinal Products
WHO World Health Organization
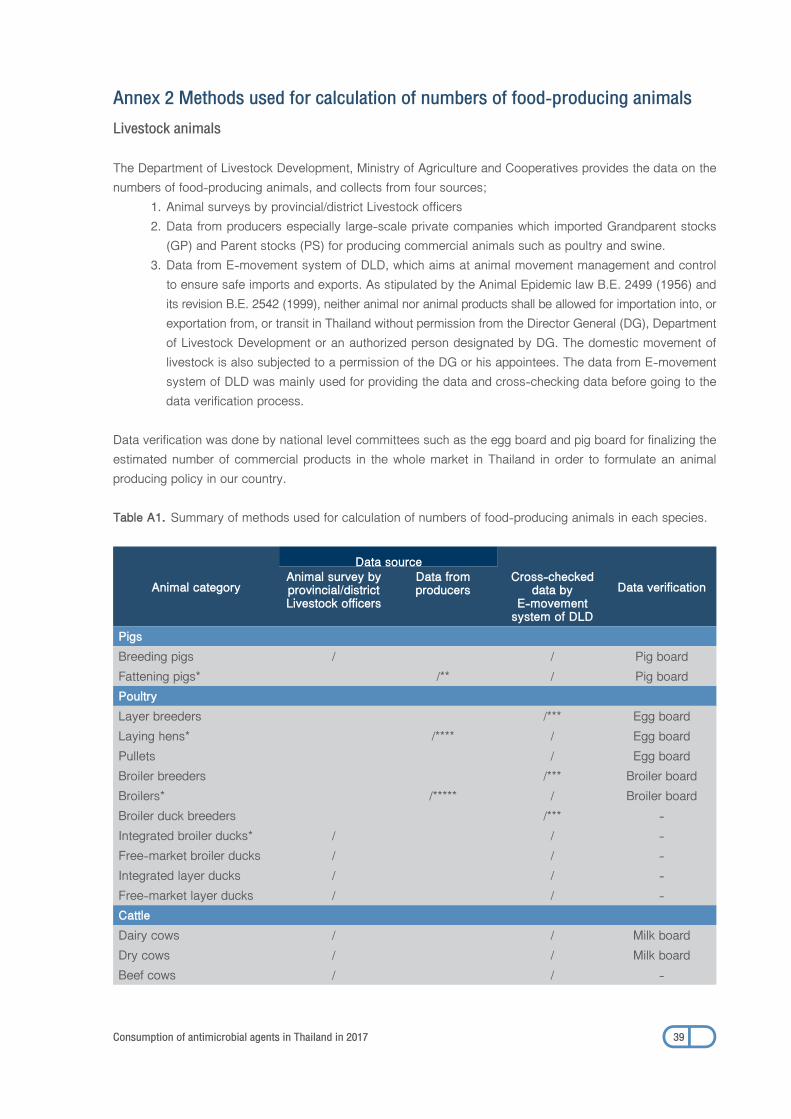
Consumption of antimicrobial agents in Thailand in 2017 39
Annex 2 Methods used for calculation of numbers of food-producing animalsLivestock animals
The Department of Livestock Development, Ministry of Agriculture and Cooperatives provides the data on the numbers of food-producing animals, and collects from four sources; 1. Animal surveys by provincial/district Livestock officers 2. Data from producers especially large-scale private companies which imported Grandparent stocks (GP) and Parent stocks (PS) for producing commercial animals such as poultry and swine. 3. Data from E-movement system of DLD, which aims at animal movement management and control to ensure safe imports and exports. As stipulated by the Animal Epidemic law B.E. 2499 (1956) and its revision B.E. 2542 (1999), neither animal nor animal products shall be allowed for importation into, or exportation from, or transit in Thailand without permission from the Director General (DG), Department of Livestock Development or an authorized person designated by DG. The domestic movement of livestock is also subjected to a permission of the DG or his appointees. The data from E-movement system of DLD was mainly used for providing the data and cross-checking data before going to the data verification process.
Data verification was done by national level committees such as the egg board and pig board for finalizing the estimated number of commercial products in the whole market in Thailand in order to formulate an animal producing policy in our country.
Table A1. Summary of methods used for calculation of numbers of food-producing animals in each species.
Animal categoryAnimal survey byprovincial/districtLivestock officers
Data fromproducers
Cross-checked data by
E-movement system of DLD
Data verification
PigsBreeding pigs / / Pig boardFattening pigs* /** / Pig boardPoultryLayer breeders /*** Egg boardLaying hens* /**** / Egg boardPullets / Egg boardBroiler breeders /*** Broiler boardBroilers* /***** / Broiler boardBroiler duck breeders /*** -Integrated broiler ducks* / / -Free-market broiler ducks / / -Integrated layer ducks / / -Free-market layer ducks / / -CattleDairy cows / / Milk boardDry cows / / Milk boardBeef cows / / -
Data source

40 Consumption of antimicrobial agents in Thailand in 2017
*Variations from Government policies, economic conditions, disease situation
**Number of fattening pigs = number of breeders x 19.8 piglets/sow/year (9 survival piglets /sow x 2.2 litters/year)
***Importing data on numbers of Grandparent stocks (GP) & Parent stocks (PS)
****Number of laying hens = number of breeders x 90 chicks/hen/year x 95% survival rate during brooding
period x 95% survival rate during growing period x Estimate number of laying hen/year (52 weeks)
*****Number of broiler chickens = Number of breeders x 129 chicks/hen/year x 95% survival rate during
growing period
Aquatics animals
Data about production of aquatic animals were published by Fisheries Development Policy and Strategy
Division, DOF. The data collection methods are as follows:
1. Production of aquatic animals of registered farms were reported by provincial fisheries office.
2. Sampling from listing survey farms, which include information of farm (e.g. capacity, species
and type).
3. Survey sampling was done by using stratified sampling method (species and type are strata).
They randomly select the farms in each stratum using systematic random sampling (10 percent of total number
of farms in each stratum) to estimate the total production of aquatic animals.
Aquatic animals including in this report Scientific nameNile tilapia Oreochromis niloticusCommon carp Cyprinus carpioCommon silver barb Barbonymus gonionotusSnakeskin gourami Trichogaster pectoralisHybrid catfish Clarias microcephalus, C.gariepinnusStriped snake-head fish Channa striataStriped catfish Pangasius hypopthalmusGiant freshwater prawn Macrobrachium rosenbergiiOther fishes (not indicated)Other aquatic animals: Softshell turtle Pelodiscus sinensisFrog Haplobatrachus rugulosus

Consumption of antimicrobial agents in Thailand in 2017 41
Annex 3 Statistics of annual report and Market Authorization in 2017
Statistics of annual report in 2017 only for targeted antimicrobials
Type of report List of products No. of drug import licensee (N=188)
No. of drug produce licensee (N=150)
Annual report Antimicrobials operators that have already submittedannual report to Thai FDAby 31 March 2018
185(98.40%)
148(98.67%)
Statistics of Market Authorization in 2017
Antimicrobials No. of marketauthorization
No. of reported market authorization
No. of analyzed market authorization
Human antimicrobials 4,062 2,180 2,172*Veterinary antimicrobials 1,634 948 948Total 5,696 3,128 3,120
*8 market authorizations have no ATC/DDD (single drug/combined drug).
The proportion between single and combined drugs containing one, two, three and four active ingredients
in reported market authorization
The proportion of the total consumption in 2017 of combined drugs containing three or more active ingredients
in both humans and animals was relatively low. Of these pharmaceutical forms, 84.62%, 4.68%, 9.52%,
0.99% and 0.19% were single drugs, combined drugs containing one, two, three and four active ingredients,
respectively.
Table A2. Number of single and combined drugs containing one, two, three and four active ingredients
consumed in Thailand, for 2017
Antimicrobials1
antimicrobial ingredient
2antimicrobial ingredients
3antimicrobial ingredients
4antimicrobial ingredients
Total
Humanantimicrobials
1,830 132 186 19 5 2,172
Veterinaryantimicrobials
810 14 111 12 1 948
Total 2,640 146 297 31 6 3,120
Type of licensing
Combined targeted antimicrobial drugsSingletargeted
antimicrobial drugs

42 Consumption of antimicrobial agents in Thailand in 2017
Figure A1. Percentages of single and combined targeted antimicrobial drugs consumed in both humans and
animals in Thailand, 2017
Single targeted antimicrobial drugs Combined targeted antimicrobial drugs
84.62%
15.38%

Consumption of antimicrobial agents in Thailand in 2017 43
Annex 4 WHO list of critically important antimicrobials (CIAs) for human medicine
WHO has produced a list of ‘Critically Important Antimicrobials for Human Medicine’ since 2005 and the
updated WHO list of CIA was announced in 2017. Regarding the most updated list in 2017, all antimicrobials
currently used for human medicine are prioritized to assist in addressing AMR and promote the prudent use
in both human and veterinary medicine (15).
WHO criteria for including antimicrobial substances in critically important antimicrobials require that two
parameters are fulfilled (WHO, 2017):
1. The antimicrobial class is the sole, or one of limited available therapies, to treat serious bacterial
infections in people.
2. The antimicrobial class is used to treat infections in people caused by either: (1) bacteria that may
be transmitted to humans from non-human sources, or (2) bacteria that may acquire resistance
genes from non human sources.
Three prioritization criteria are used to categorize antimicrobial substances in the critically important
antimicrobials into two groups; Highest Priority CIA and High Priority CIA (WHO, 2017):
1. High absolute number of people, or high proportion of use in patients with serious infections in health-
care settings affected by bacterial diseases for which the antimicrobial class is the sole or one of
few alternatives to treat serious infections in humans.
2. High frequency of use of the antimicrobial class for any indication in human medicine, or high
proportion of use in patients with serious infections in health-care settings, since use may favour
selection of resistance in both settings.
3. The antimicrobial class is used to treat infections in people for whom there is evidence of transmission
of resistant bacteria (e.g. non-typhoidal Salmonella and Campylobacter spp.) or resistance genes
(high for E. coli and Enterococcus spp.) from non-human sources.
The highest and high priority of WHO list of CIAs in human medicine was captured to identify antimicrobial
classes that are highlighted in the report (table A3).

44 Consumption of antimicrobial agents in Thailand in 2017
Table A3. Antimicrobial classes in WHO Critically Important Antimicrobials mentioned in the report
WHO classification Antimicrobial class
Highest priority Critically Important Antimicrobials Cephalosporins (3rd, 4th and 5th generations)
Glycopeptides
Macrolides and ketolides
Polymyxins
Quinolones
High priority Critically Important Antimicrobials Aminoglycosides
Ansamycins
Carbapenems and other penems
Glycylcyclines
Lipopeptides
Monobactams
Oxazolidinones
Penicillins (natural, aminopenicillins, and antipseudomonal)
Phosphonic acid derivatives
Drugs used solely to treat tuberculosis or othermycobacterial diseases

Consumption of antimicrobial agents in Thailand in 2017 45
Annex 5 The calculation method in human antimicrobials
Antimicrobial consumption in humans was measured in DDD/1,000 inhabitants/day using the following
calculation formula.
DDD per 1,000 inhabitants per day (DID) = Defined daily dose (DDD) x 1,000
Mid-year population x 365
DDD or defined daily dose is a measurement of drug utilization. DDD is the average adult dose per day of a
drug for its main indication. DDD may not reflect the recommended dose for a particular patient or group of
patients and it depends on patient characteristics such as age, weight, ethnicity, type and severity of disease
as well as pharmacokinetics considerations.
The number of DDD (DDDs) equals the overall consumption of a particular drug in a specific time period divided
by its DDD. This unit of utilizations allows consumption trends monitoring and comparison among different
groups of the population, because it is independent from price, value of money, pack size, and strength of drug.
Steps to calculate DDD/1000 inhabitants/day
1. The important data elements required for calculation are WHO/ATC/DDD, standardized strength,
standardized strength unit, WHO defined route of administration (to assign DDD) and manufacturing
and importing quantities reported to the Thai FDA for the year 2017.
2. Calculated active ingredient (AI) from the reported manufacturing and importing quantities using
standardized strength of drug. There are three calculation situations corresponding to different
dosage forms. For example:
a. amoxycillin 500 mg/capsule reported quantities = 100,000 capsules
AI = 500 mg x 100,000 capsules = 50,000,000 mg
b. amoxycillin suspension 125 mg/5 ml reported quantities = 8,600 bottles (60 ml each)
AI = (125 mg / 5 ml) x (8,600 bottles x 60 ml) = 12,900,000 mg
c. lincomycin injection 300 mg/ml reported quantities 7,000 vials (2 ml each)
AI = 300 mg x (7,000 vials x 2 ml) = 4,200,000 mg
3. Calculate number of DDD (DDDs) from AI divided by DDD of each drug. For example AI of
amoxycillin = 50,000,000 mg, and oral amoxycillin’s DDD = 1 g. The same measurement unit of
AI and DDD is required.
4. Calculate DDD/1,000 inhabitants/day by each level of ATC of targeted antimicrobial drugs.
5. For combined drugs, there are two different calculation methods. First, for those combined drugs with
DDD of the combination, DDDs were calculated using combination DDD. For example, a combination
of sulfamethoxazole and trimethoprim 400 mg/80 mg in each tablet has its combination DDD = 4
tablets, and 20,000 tablets were manufactured. DDDs = 20,000 tablets/4 tablets = 5,000 DDDs.
Second, in case of no DDD assigned for the combination, DDDs were calculated using DDD of each
single drug in the combination. For example, combination of lamivudine 150 mg (DDD = 0.3 g), and
zidovudine 300 mg (DDD = 0.6 g) reported 5,000 tablets manufacturing.

46 Consumption of antimicrobial agents in Thailand in 2017
Annex 6 The calculation method in veterinary antimicrobials
Methodology for veterinary consumption calculation
Before processing data from the database of the FDA, the integrity and completeness of the data must be
achieved first. In this study, there were two sources of data, registration database and annual reports. The first
one included essential information on veterinary medicinal products (VMPs) for calculation such as active
pharmaceutical ingredient (API), the amount of API, strength unit the amount of a finished product,
pharmaceutical dosage form, and ATC vet code. As for annual reports, the type of pack size, pack size,
number of packs, and quantity of import or manufacture were compulsorily reported and electronically
recorded. Part of the information from both of sources was retrieved.
Prior to the calculation process, the data from both the sources were mapped into two single Excel worksheets
depending on the type of VMP: single VMP (sVMP), the VMP that contains only one antimicrobial API; or
combination cVMP), the VMP that contains at least one antimicrobial API. Then, the calculation process was
performed using Microsoft Excel version 2013. Generally, the steps of calculation were as follows:
1. Check for unit agreement. This step was to identify the unit agreement between strength unit and
pack size in terms of solids (milligram, gram, or kilogram) or liquids (milliliter or liter).
2. Calculate the amount of API using the following formula:
Amount of API =
Strength x Quantity of import or manufacture
Strength unit
3. Adjust unit. In this calculation, the amount of API was calculated and converted into grams.
4. Subtract the amount of APIs from out-of-scope VMP (oVMP) and tablets. Some out-of-scope
pharmaceutical dosage forms (dermatological preparations and preparations for sensory organs)
needed to be excluded due to their insignificance in terms of antimicrobial consumption or primary
use in companion animals (tablets).
5. Subtract the amount of API from non-target ATC vet codes. For cVMP, many cVMPs contained
non-antimicrobial APIs or APIs that were already included in another code such as clavulanic acid.
The results were the amount of target API (tAPI).
After the process had been finished, the data were classified and presented into two aspects: pharmaceutical
dosage form and ATC vet code. Furthermore, as both the aspects originated from the same source of data, the
total amount of tAPI calculated must have been balanced. If any irregularity was detected, it needed to be
addressed and rectified to make all sheets balanced as they should.

Consumption of antimicrobial agents in Thailand in 2017 47
Figure A2. Methodology for veterinary consumption calculation
Verification
Calculation process
Data processing and presentation
Annual reportsRegistration database
MappingMaster file
sVMP
API from tablets
osVMP
sVMP
ocVMP
Non-target API
tAPI of sVMP
Dosage form aspect ATC vet code aspect
tAPItAPI 1 tAPI 2
tAPI 3 tAPI 4
tAPI of cVMP
Total tAPI
Total mg/PCU
PCU
Injection Oral solution
Premix Intramammary
Oral powder Others
ATC vet code level 3- QA07A- QG51A- QJ01A- QJ01B- QJ01C- Other codes
ATC vet code level 4- QA07AA- QG51AX- QG51AA- QJ01AA- QJ01BA- Other codes
ATC vet code level 5- QA07AA01- QA07AA10- QA07AA93- QA07AX91- QG51AA05- Other codes
Internal checking
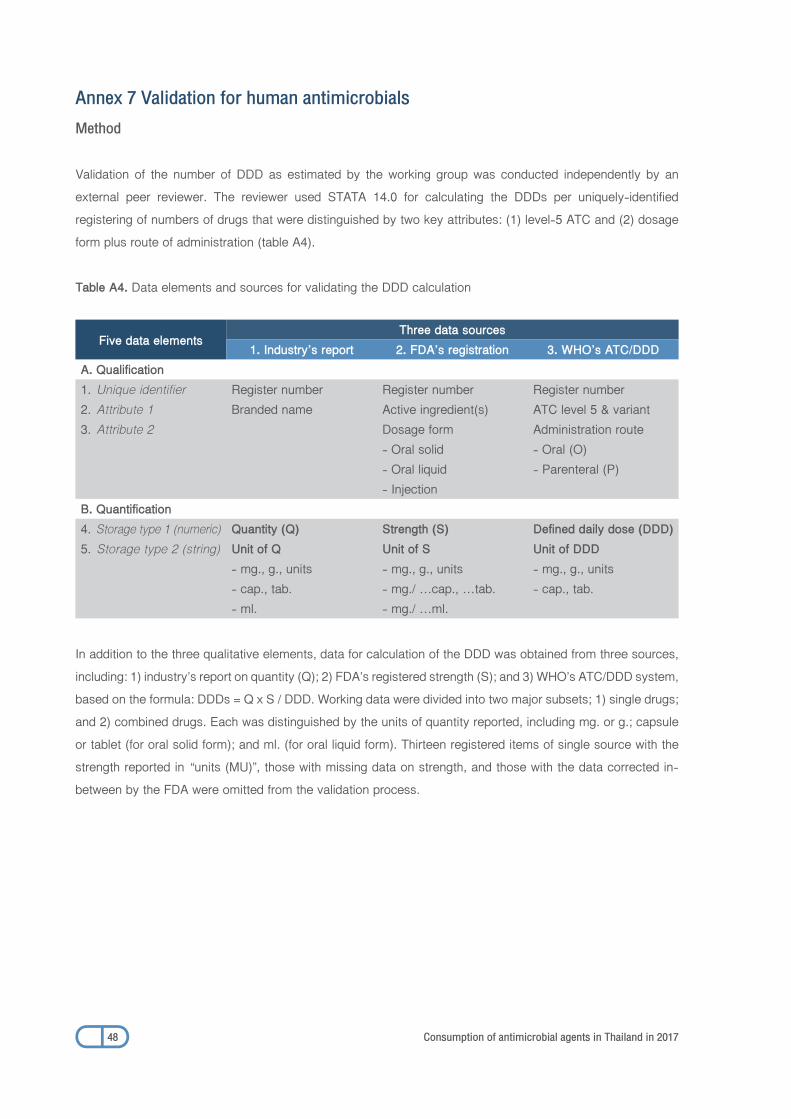
48 Consumption of antimicrobial agents in Thailand in 2017
Annex 7 Validation for human antimicrobialsMethod
Validation of the number of DDD as estimated by the working group was conducted independently by an
external peer reviewer. The reviewer used STATA 14.0 for calculating the DDDs per uniquely-identified
registering of numbers of drugs that were distinguished by two key attributes: (1) level-5 ATC and (2) dosage
form plus route of administration (table A4).
Table A4. Data elements and sources for validating the DDD calculation
Five data elementsThree data sources
1. Industry’s report 2. FDA’s registration 3. WHO’s ATC/DDDA. Qualification1. Unique identifier Register number Register number Register number2. Attribute 1 Branded name Active ingredient(s) ATC level 5 & variant3. Attribute 2 Dosage form Administration route
- Oral solid - Oral (O)- Oral liquid - Parenteral (P)- Injection
B. Quantification4. Storage type 1 (numeric) Quantity (Q) Strength (S) Defined daily dose (DDD)5. Storage type 2 (string) Unit of Q Unit of S Unit of DDD
- mg., g., units - mg., g., units - mg., g., units- cap., tab. - mg./ …cap., …tab. - cap., tab.- ml. - mg./ …ml.
In addition to the three qualitative elements, data for calculation of the DDD was obtained from three sources,
including: 1) industry’s report on quantity (Q); 2) FDA’s registered strength (S); and 3) WHO’s ATC/DDD system,
based on the formula: DDDs = Q x S / DDD. Working data were divided into two major subsets; 1) single drugs;
and 2) combined drugs. Each was distinguished by the units of quantity reported, including mg. or g.; capsule
or tablet (for oral solid form); and ml. (for oral liquid form). Thirteen registered items of single source with the
strength reported in “units (MU)”, those with missing data on strength, and those with the data corrected in-
between by the FDA were omitted from the validation process.

Consumption of antimicrobial agents in Thailand in 2017 49
Finding
A total of 2,316 and 408 registered items of single and combined drugs respectively was subject to the
validation. Of 229, 1,676, and 398 items of single drugs reported the quantity in mg or g, capsules or tablets
and ml, respectively; 9, 1, and 2 items were found to have discrepancy in the DDD through validation by the
external review process. For the combined drugs, 298 items with DDD available for the overall ATC; 0, 0,
and 2 items of those reported the quantity in mg. or g., capsules or tablets, and ml, respectively were found to
have a DDD discrepancy. Out of 109 items of the combined drugs with separate DDD of the first ATC; 1 of 11,
28 of 85, and 0 of 9 items were found to have the DDD discrepancy for those reported the quantity in mg or g,
capsules or tablets, and ml, respectively. Out of 76 items of the combined drugs with separate DDD of the
second ATC; 0 of 10, 9 of 57, and 0 of 8 items were found the DDD discrepancy for those reported the
quantity in mg or g, capsules or tablets and ml, respectively. A total of 24 items of the combined drugs with
separate DDD of the third ATC reported the quantity in capsules or tablets, of which six items were found to
have the DDD discrepancy. For three items with the fourth ATC of combined drugs with separate DDD,
all strength data were missing, hence none were validated.
The external reviewer advised the priority need for conventions of ATC/DDD for unconventional ATC/DDD,
standardization for strength and strength units and aggregation levels of the DDD calculation for further
development.

50 Consumption of antimicrobial agents in Thailand in 2017
Annex 8 Validation for veterinary antimicrobialsMethod
Validation on the consumption of antimicrobial agents used in animals as estimated by the working group
was conducted independently by an external peer reviewer. The reviewer used Stata 13.1 for calculating the
quantity of active ingredients per uniquely identified register numbers of drugs that were distinguished by
two key attributes: 1) level-5 ATC; and (2) dosage form plus route of administration. In addition to the two
qualitative elements, data for calculation of the number of active ingredients was obtained from two sources
including: 1) industry’s report on quantity (Q); and 2) FDA’s registered strength (S) based on the formula:
total AIs = Q x S. Working data were divided into two major subsets: 1) single drugs; and 2) combined drugs.
First of all, the process started with eligible criteria in which all ineligible drugs were removed. Then the unit of
drug strength, the size of product package, and the import quantity of each record were reviewed. All items
with mismatched units were checked individually and all incorrected data were verified. Afterwards, the
quantity of active ingredients per register numbers and total consumption were calculated and compared
with the result calculated by the working group. Then, unequal results were reviewed individually. Lastly,
the list of incorrect results and total number of consumption were informed to the working group.
Finding
A total of 1,019 registered items of single drugs were subjected to the validation. Two items of single drugs
were excluded because of ineligible criteria. A total of 58 records had mismatched units, as 5.70% of the
total items. All mismatched records were verified and amended with both external peers and the working
group’s consensus. The pitfalls were incorrect data entries from the FDA and industries. After data
amendments, the 49 of 1,107 items were found to have AI discrepancy from the previous calculation.
However, all differences were less than 1% of the number of calculated AI, between -0.00001% and 0.00001%.
A total of 223 registered items of combined drugs were subjected to the validation. Of 223; 11 items
were excluded because of eligible criteria. A total of 11 had mismatched units, as 5.19% of total items.
All mismatched records were verified and amended with both external peers and the working group’s
consensus. The pitfalls were incorrect data entries from the FDA and industries. After data amendments, the
67 of 1,107 items were found to have AI discrepancy from the previous calculation. However, most were
minor discrepancies; 64 differences were not more than 5% of the number of calculated AI, between -1.83%
and 5.00%. There were three items having high discrepancy because of a wrong formula used, and were 1.42%
of total items. The external reviewer had reported these errors to the working group for recalculation.
The external reviewer advised the working group to: 1) standardize drug strength pattern which should
distinguish between strength and concentration; 2) verify data from both industries’ reports and FDA’s
registration; 3) consider a mismatch of unit patterns in strength, packaging and imported quantity; and 4) note
all amendments systematically for further development.

Consumption of antimicrobial agents in Thailand in 2017 51
Annex 9 Total consumption of veterinary antimicrobials (tonnes)
The overall national consumption data covers the consumption of veterinary antimicrobials for use in food- producing animals (all other pharmaceutical dosage forms) and that of tablets which are exclusively used in companion animals. However, injectable veterinary antimicrobial agents are registered for both food-producing and companion animals and use in companion animals is limited based on the amount of active ingredients; such consumption is included in the statistics for food-producing animals. Overall, consumption of tablets using in companion animals in 2017 represented 0.04 % of the total consumption in tonnes, which accounted for a minor proportion of the total consumption of veterinary antimicrobials in 2017.
Table A5. Distribution of overall consumption, in tonnes of active ingredient, divided into tablets (used exclusively in companion animals) and all other pharmaceutical dosage forms (used mainly in food-producing animals) in Thailand, 2017
Tonnes% of total
consumptionin tonnes
Tonnes% of total
consumptionin tonnes
Total tonnes
Thailand 1.71 0.04 4688.41 99.96 4690.12
Figure A3. Distribution of consumption, in tonnes of active ingredients, divided into tablets (used exclusively in companion animals) and all other pharmaceutical forms (used mainly in food-producing animals) in Thailand, 2017
All other pharmaceuticaldosage formsTablets
Tablets All other pharmaceutical forms
99.96%
0.04%

52 Consumption of antimicrobial agents in Thailand in 2017
Annex 10 All veterinary antimicrobials used as premix for medicated feeding stuff in food-producing animals
Table A6. All veterinary consumption as premix for medicated feeding stuff in food-producing animals, 2017
Rank ATC level 5 Antimicrobial drug Total consumption (tonnes)1 QA07AX91 halquinol 678.722 QJ01AA03 chlortetracycline 380.293 QJ01CA04 amoxicillin 375.474 QJ01XQ01 tiamulin 300.895 QA07AA10 colistin 191.046 QJ01FA91 tilmicosin 148.807 QJ01AA02 doxycycline 134.258 QA07AA93 bacitracin 69.639 QJ01FA90 tylosin 58.3710 QJ01AA06 oxytetracycline 31.2211 QJ01FA93 kitasamycin 24.4012 QJ01FF02 lincomycin 15.0413 QJ01XX01 fosfomycin 9.9714 QJ01EQ03 sulfadimidine 7.1415 QJ01EQ10 sulfadiazine 6.1216 QJ01FA07 josamycin 3.6117 QA07AA96 bambermycin 2.7918 QJ01EA01 trimethoprim 1.8519 QJ01XX04 spectinomycin 1.7620 QJ01CE02 phenoxymethylpenicillin 1.1421 QJ01EQ17 sulfamerazine 0.5122 QJ01GB90 apramycin 0.3023 QJ01FA01 erythromycin 0.0424 QJ01MA90 enrofloxacin 0.0125 QJ01MA98 sarafloxacin <0.0126 QJ01XQ02 valnemulin <0.01
Total 2,443.38

Consumption of antimicrobial agents in Thailand in 2017 53
Figure A4. Distribution of consumption of WHO highest priority CIAs for veterinary antimicrobials used as
premix for medicated feeding stuff in food-producing animals, 2017
82.55%
7.82%
<0.01%
9.63%
Premix for Medicated Feed
Non-highest priority CIA 82.55%Polymyxins(colistin) 7.82%
Fluoroquinolones <0.01%Macrolides 9.63%

54 Consumption of antimicrobial agents in Thailand in 2017
Annex 11 Lists of consumption by ATC level 5 (human antimicrobials)*
Rank ATC level 5 Antimicrobial drugTotal consumption
(DDDs)DID %
1 J01CA04 amoxicillin 399,189,828.25 15.10 19.95%
2 J01DD04 ceftriaxone 358,905,231.75 13.57 17.94%
3 J02AB02 ketoconazole 113,958,190.00 4.31 5.70%
4 J01AA07 tetracycline 93,750,626.50 3.55 4.69%
5 J05AG03 efavirenz 81,536,302.50 3.08 4.07%
6 J05AF05 lamivudine 72,096,324.87 2.73 3.60%
7 J01CR02 amoxicillin and enzyme inhibitor 64,959,098.97 2.46 3.25%
8 J01AA02 doxycycline 63,888,050.00 2.42 3.19%
9 J05AF07 tenofovir disoproxil 57,017,735.51 2.16 2.85%
10 J01MA06 norfloxacin 54,687,807.75 2.07 2.73%
11 J05AF09 emtricitabine 43,908,000.00 1.66 2.19%
12 J01FA06 roxithromycin 42,155,308.33 1.59 2.11%
13 J01CA01 ampicillin 38,670,455.75 1.46 1.93%
14 J01EE01 sulfamethoxazole and trimethoprim 37,833,324.65 1.43 1.89%
15 J01CF01 dicloxacillin 36,573,941.00 1.38 1.83%
16 J01MA02 ciprofloxacin 34,340,130.10 1.30 1.72%
17 J05AG01 nevirapine 31,159,440.00 1.18 1.56%
18 J01DD02 ceftazidime 24,611,839.63 0.93 1.23%
19 J04AC01 isoniazid 23,639,337.50 0.89 1.18%
20 J05AF01 zidovudine 21,689,453.67 0.82 1.08%
21 J04AB02 rifampicin 21,492,317.50 0.81 1.07%
22 P01BA01 chloroquine 19,810,665.50 0.75 0.99%
23 J01CF02 cloxacillin 18,587,523.75 0.70 0.93%
24 J01DB01 cefalexin 16,461,676.50 0.62 0.82%
25 J01FA10 azithromycin 14,709,218.95 0.56 0.74%
26 P01AB01 metronidazole 14,474,322.50 0.55 0.72%
27 J05AR10 lopinavir and ritonavir 13,640,581.50 0.52 0.68%
28 P01BD01 pyrimethamine 12,675,010.00 0.48 0.63%
29 J01FF01 clindamycin 12,293,341.42 0.46 0.61%
30 D01BA01 griseofulvin 10,694,250.00 0.40 0.53%
31 J01MA01 ofloxacin 10,636,731.50 0.40 0.53%
32 J01FA09 clarithromycin 10,442,278.40 0.39 0.52%
33 J02AC01 fluconazole 9,569,516.75 0.36 0.48%
34 J01MA12 levofloxacin 9,548,146.50 0.36 0.48%
35 J02AC02 itraconazole 7,537,904.50 0.29 0.38%
36 J04AK01 pyrazinamide 6,802,062.33 0.26 0.34%

Consumption of antimicrobial agents in Thailand in 2017 55
Rank ATC level 5 Antimicrobial drugTotal consumption
(DDDs)DID %
37 J04AK02 ethambutol 6,175,451.46 0.23 0.31%
38 J01DD16 cefditoren 5,659,995.00 0.21 0.28%
39 P01BA02 hydroxychloroquine 5,057,918.60 0.19 0.25%
40 J01FA01 erythromycin 5,022,144.75 0.19 0.25%
41 J01FF02 lincomycin 4,990,130.00 0.19 0.25%
42 J05AG05 rilpivirine 4,963,140.00 0.19 0.25%
43 J01DC04 cefaclor 4,536,976.38 0.17 0.23%
44 J05AB01 aciclovir 4,469,497.51 0.17 0.22%
45 J01EC02 sulfadiazine 4,215,356.85 0.16 0.21%
46 J01GB03 gentamicin 4,068,397.92 0.15 0.20%
47 J05AF04 stavudine 3,963,358.80 0.15 0.20%
48 J05AF06 abacavir 3,015,943.10 0.11 0.15%
49 J01DC02 cefuroxime 2,939,096.00 0.11 0.15%
50 J01DB04 cefazolin 2,776,015.17 0.10 0.14%
51 J01BA02 thiamphenicol 2,732,578.33 0.10 0.14%
52 J01CE02 phenoxymethyl penicillin 2,603,834.88 0.10 0.13%
53 J01DD08 cefixime 2,378,975.00 0.09 0.12%
54 J05AF10 entecavir 2,285,310.00 0.09 0.11%
55 J01DH02 meropenem 1,838,019.25 0.07 0.09%
56 J01DD15 cefdinir 1,434,247.08 0.05 0.07%
57 J05AE08 atazanavir 1,414,060.00 0.05 0.07%
58 J01AA03 chlortetracycline 1,278,150.00 0.05 0.06%
59 J01GA01 streptomycin 1,219,540.00 0.05 0.06%
60 P01BC01 quinine 1,138,656.93 0.04 0.06%
61 J05AH02 oseltamivir 1,005,355.96 0.04 0.05%
62 J01CE09 procaine benzylpenicillin 995,010.00 0.04 0.05%
63 J01GB04 kanamycin 921,455.73 0.03 0.05%
64 J01MA14 moxifloxacin 869,652.00 0.03 0.04%
65 J01XD01 metronidazole 869,532.67 0.03 0.04%
66 P01AB02 tinidazole 848,624.50 0.03 0.04%
67 J01CR05 piperacillin and enzyme inhibitor 780,973.36 0.03 0.04%
68 J05AF11 telbivudine 607,936.00 0.02 0.03%
69 A07AA02 nystatin 563,359.79 0.02 0.03%
70 P01BA03 primaquine 503,500.00 0.02 0.03%
71 A07AA01 neomycin 485,295.29 0.02 0.02%
72 J05AP01 ribavirin 430,164.00 0.02 0.02%
73 J04AD03 ethionamide 399,166.67 0.02 0.02%
74 J05AE10 darunavir 367,860.00 0.01 0.02%

56 Consumption of antimicrobial agents in Thailand in 2017
Rank ATC level 5 Antimicrobial drugTotal consumption
(DDDs)DID %
75 J01DH03 ertapenem 366,415.00 0.01 0.02%
76 J05AF08 adefovir dipivoxil 362,490.00 0.01 0.02%
77 J01EB02 sulfamethizole 351,146.88 0.01 0.02%
78 J01DD01 cefotaxime 341,448.25 0.01 0.02%
79 J01DD62 cefoperazone, combinations 327,985.63 0.01 0.02%
80 J05AX08 raltegravir 304,530.00 0.01 0.02%
81 J01GB06 amikacin 290,009.00 0.01 0.01%
82 J01XA01 vancomycin 284,142.25 0.01 0.01%
83 J02AA01 amphotericin B 265,450.00 0.01 0.01%
84 J01CE01 benzylpenicillin 248,801.91 0.01 0.01%
85 J01XX01 fosfomycin 239,014.00 0.01 0.01%
86 J01XE01 nitrofurantoin 232,500.00 0.01 0.01%
87 J01MA17 prulifloxacin 225,083.33 0.01 0.01%
88 J01MA21 sitafloxacin 225,000.00 0.01 0.01%
89 J01EB03 sulfadimidine 221,977.50 0.01 0.01%
90 J01AA06 oxytetracycline 221,257.00 0.01 0.01%
91 J01DH51 imipenem and enzyme inhibitor 212,764.50 0.01 0.01%
92 J04AA02 sodium aminosalicylate 211,785.71 0.01 0.01%
93 J01ED05 sulfamethoxypyridazine 200,000.00 0.01 0.01%
94 J01CR01 ampicillin and enzyme inhibitor 165,746.26 0.01 0.01%
95 J01CR04 sultamicillin 163,183.00 0.01 0.01%
96 J01ED07 sulfamerazine 152,768.04 0.01 0.01%
97 J01BA01 chloramphenicol 129,763.33 < 0.01 0.01%
98 J01XB01 colistin 119,117.73 < 0.01 0.01%
99 J01DB05 cefadroxil 118,192.00 < 0.01 0.01%
100 J01AA12 tigecycline 110,000.00 < 0.01 0.01%
101 J02AC03 voriconazole 107,902.50 < 0.01 0.01%
102 J05AB11 valaciclovir 93,413.33 < 0.01 <0.01%
103 J05AG04 etravirine 91,260.00 < 0.01 <0.01%
104 D01BA02 terbinafine 91,042.00 < 0.01 <0.01%
105 J01DC01 cefoxitin 90,150.50 < 0.01 <0.01%
106 J01AA08 minocycline 85,225.00 < 0.01 <0.01%
107 J04AB01 cycloserine 75,583.33 < 0.01 <0.01%
108 J05AP07 daclatasvir 57,596.00 < 0.01 <0.01%
109 J05AF02 didanosine 56,250.00 < 0.01 <0.01%
110 J01DE01 cefepime 52,616.50 < 0.01 <0.01%
111 J01DH05 biapenem 41,205.00 < 0.01 <0.01%
112 J05AX12 dolutegravir 40,500.00 < 0.01 <0.01%

Consumption of antimicrobial agents in Thailand in 2017 57
Rank ATC level 5 Antimicrobial drugTotal consumption
(DDDs)DID %
113 J01DD12 cefoperazone 36,883.75 < 0.01 <0.01%
114 J05AB06 ganciclovir 29,025.00 < 0.01 <0.01%
115 J05AP08 sofosbuvir 28,000.00 < 0.01 <0.01%
116 J05AB09 famciclovir 23,803.50 < 0.01 <0.01%
117 J02AC04 posaconazole 22,974.00 < 0.01 <0.01%
118 J05AB14 valganciclovir 22,350.00 < 0.01 <0.01%
119 J01GB07 netilmicin 14,957.71 < 0.01 <0.01%
120 J01XX08 linezolid 14,640.00 < 0.01 <0.01%
121 J05AX09 maraviroc 12,720.00 < 0.01 <0.01%
122 J01AA04 lymecycline 10,752.00 < 0.01 <0.01%
123 J01CE10 benzathine phenoxymethylpenicillin 10,714.50 < 0.01 <0.01%
124 J01XA02 teicoplanin 8,567.50 < 0.01 <0.01%
125 J02AX05 micafungin 8,400.00 < 0.01 <0.01%
126 J01CG01 sulbactam 7,908.00 < 0.01 <0.01%
127 J05AX05 inosine pranobex 7,400.00 < 0.01 <0.01%
128 J01EA01 trimethoprim 6,000.00 < 0.01 <0.01%
129 J02AX06 anidulafungin 3,600.00 < 0.01 <0.01%
130 J02AX04 caspofungin 894.00 < 0.01 <0.01%
131 J04AB30 capreomycin 470.00 < 0.01 <0.01%
132 J01DC03 cefamandole 166.67 < 0.01 <0.01%
133 P01BA06 amodiaquine 150.00 < 0.01 <0.01%
134 P01BC02 mefloquine 128.00 < 0.01 <0.01%
135 P01BF01 artemether and lumefantrine 1.71 < 0.01 <0.01%
136 J05AH01 zanamivir 1.00 < 0.01 <0.01%
137 J01XX04 spectinomycin 0.67 < 0.01 <0.01%
Total 2,001,014,476.80 75.68 100%
* Interpretation and use of the data in this table should take into account on the limitation as expressed on page 18.
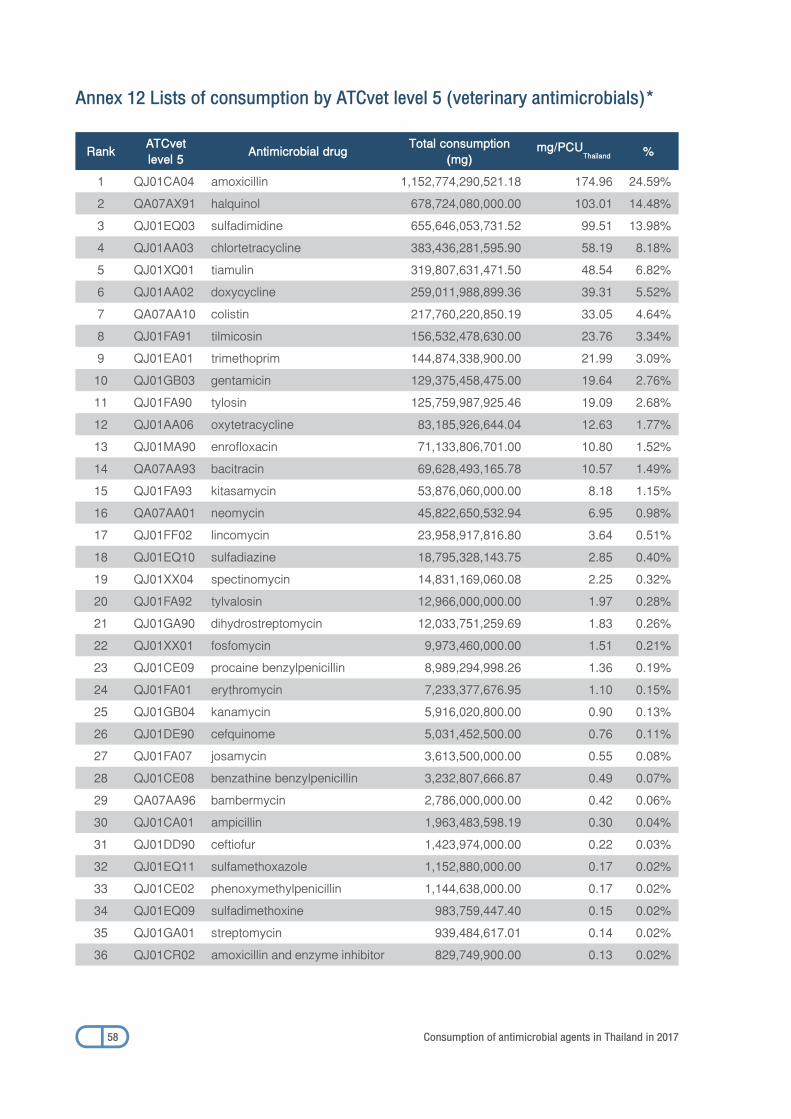
58 Consumption of antimicrobial agents in Thailand in 2017
Annex 12 Lists of consumption by ATCvet level 5 (veterinary antimicrobials)*
Rank ATCvetlevel 5 Antimicrobial drug Total consumption
(mg)mg/PCU
Thailand %
1 QJ01CA04 amoxicillin 1,152,774,290,521.18 174.96 24.59%
2 QA07AX91 halquinol 678,724,080,000.00 103.01 14.48%
3 QJ01EQ03 sulfadimidine 655,646,053,731.52 99.51 13.98%
4 QJ01AA03 chlortetracycline 383,436,281,595.90 58.19 8.18%
5 QJ01XQ01 tiamulin 319,807,631,471.50 48.54 6.82%
6 QJ01AA02 doxycycline 259,011,988,899.36 39.31 5.52%
7 QA07AA10 colistin 217,760,220,850.19 33.05 4.64%
8 QJ01FA91 tilmicosin 156,532,478,630.00 23.76 3.34%
9 QJ01EA01 trimethoprim 144,874,338,900.00 21.99 3.09%
10 QJ01GB03 gentamicin 129,375,458,475.00 19.64 2.76%
11 QJ01FA90 tylosin 125,759,987,925.46 19.09 2.68%
12 QJ01AA06 oxytetracycline 83,185,926,644.04 12.63 1.77%
13 QJ01MA90 enrofloxacin 71,133,806,701.00 10.80 1.52%
14 QA07AA93 bacitracin 69,628,493,165.78 10.57 1.49%
15 QJ01FA93 kitasamycin 53,876,060,000.00 8.18 1.15%
16 QA07AA01 neomycin 45,822,650,532.94 6.95 0.98%
17 QJ01FF02 lincomycin 23,958,917,816.80 3.64 0.51%
18 QJ01EQ10 sulfadiazine 18,795,328,143.75 2.85 0.40%
19 QJ01XX04 spectinomycin 14,831,169,060.08 2.25 0.32%
20 QJ01FA92 tylvalosin 12,966,000,000.00 1.97 0.28%
21 QJ01GA90 dihydrostreptomycin 12,033,751,259.69 1.83 0.26%
22 QJ01XX01 fosfomycin 9,973,460,000.00 1.51 0.21%
23 QJ01CE09 procaine benzylpenicillin 8,989,294,998.26 1.36 0.19%
24 QJ01FA01 erythromycin 7,233,377,676.95 1.10 0.15%
25 QJ01GB04 kanamycin 5,916,020,800.00 0.90 0.13%
26 QJ01DE90 cefquinome 5,031,452,500.00 0.76 0.11%
27 QJ01FA07 josamycin 3,613,500,000.00 0.55 0.08%
28 QJ01CE08 benzathine benzylpenicillin 3,232,807,666.87 0.49 0.07%
29 QA07AA96 bambermycin 2,786,000,000.00 0.42 0.06%
30 QJ01CA01 ampicillin 1,963,483,598.19 0.30 0.04%
31 QJ01DD90 ceftiofur 1,423,974,000.00 0.22 0.03%
32 QJ01EQ11 sulfamethoxazole 1,152,880,000.00 0.17 0.02%
33 QJ01CE02 phenoxymethylpenicillin 1,144,638,000.00 0.17 0.02%
34 QJ01EQ09 sulfadimethoxine 983,759,447.40 0.15 0.02%
35 QJ01GA01 streptomycin 939,484,617.01 0.14 0.02%
36 QJ01CR02 amoxicillin and enzyme inhibitor 829,749,900.00 0.13 0.02%

Consumption of antimicrobial agents in Thailand in 2017 59
Rank ATCvetlevel 5 Antimicrobial drug Total consumption
(mg)mg/PCU
Thailand %
37 QJ01EQ17 sulfamerazine 512,000,000.00 0.08 0.01%
38 QJ01GB90 apramycin 470,480,000.00 0.07 0.01%
39 QJ01EQ13 sulfadoxine 462,660,000.00 0.07 <0.01%
40 QJ01MA93 marbofloxacin 274,198,000.00 0.04 <0.01%
41 QJ01EQ15 sulfamethoxypyridazine 231,712,000.00 0.04 <0.01%
42 QJ51CF02 cloxacillin 216,478,492.16 0.03 <0.01%
43 QJ01GB05 neomycin 208,122,729.83 0.03 <0.01%
44 QJ01EQ16 sulfazuinoxaline 185,270,904.10 0.03 <0.01%
45 QJ01FA94 tulathromycin 129,700,000.00 0.02 <0.01%
46 QJ01MA92 danofloxacin 93,620,000.00 0.01 <0.01%
47 QJ51CA01 ampicillin 81,932,400.00 0.01 <0.01%
48 QJ01FA95 gamithromycin 74,925,000.00 0.01 <0.01%
49 QJ01BA90 florfenicol 74,820,000.00 0.01 <0.01%
50 QJ01CE01 benzylpenicillin 68,146,706.68 0.01 <0.01%
51 QJ01AA07 tetracycline 64,694,000.00 <0.01 <0.01%
52 QJ01EQ18 sulfamonomethoxine 27,697,853.60 <0.01 <0.01%
53 QJ51DB90 cefalonium 27,085,000.00 <0.01 <0.01%
54 QJ01DC02 cefuroxime 14,460,000.00 <0.01 <0.01%
55 QJ51DB01 cefalexin 8,353,330.90 <0.01 <0.01%
56 QJ01FF01 clindamycin 8,007,500.00 <0.01 <0.01%
57 QJ51DE90 cefquinome 5,577,750.00 <0.01 <0.01%
58 QJ51AA07 tetracycline 5,474,887.73 <0.01 <0.01%
59 QJ01EQ07 sulfathiazole 3,985,830.00 <0.01 <0.01%
60 QJ01MA98 sarafloxacin 3,652,000.00 <0.01 <0.01%
61 QJ51DB08 cefapirin 2,619,162.00 <0.01 <0.01%
62 QJ01DD91 cefovecin 2,426,880.00 <0.01 <0.01%
63 QJ01XQ02 valnemulin 2,200,000.00 <0.01 <0.01%
64 QG51AA05 cefapirin 900,000.00 <0.01 <0.01%
65 QJ01XX10 bacitracin 800,539.74 <0.01 <0.01%
66 QJ01FA02 spiramycin 545,440.00 <0.01 <0.01%
67 QJ51GB03 gentamicin 281,867.71 <0.01 <0.01%
68 - ormethoprim 100,000.00 <0.01 <0.01%
69 QJ01CF06 nafcillin 77,870.48 <0.01 <0.01%
70 QJ01CF02 cloxacillin 6,854.33 <0.01 <0.01%
Total 4,688,411,810,528.12 711.56 100%
* Interpretation and use of the data in this table should take into account on the limitation as expressed on page 18.

60 Consumption of antimicrobial agents in Thailand in 2017
Annex 13 Health Policy and Systems Research on antimicrobial resistance working group members
Ministry of Public Health International Health Policy Program
Viroj Tangcharoensathien
Angkana Lekagul
Sunicha Chanvatik
Wanwisa Kaewkhankhaeng
Food and Drug Administration
Varavoot Sermsinsiri
Kritsada Limpananont
Chutamas Luangaroonchai
Pischa Lusanandana
Chaiporn Pumkam
Supapat Kirivan
Sitanan Poonpolsub
Ministry of Agriculture and Cooperatives Department of Livestock Development
Thanida Harintharanon
Sasi Jareonpoj
Bunyoung Suangthamai
Julaporn Srinha
Suchana Sukklad
Natthapong Supimon
Porjai Rattanapanadda
Department of Fisheries
Thitiporn Laoprasert
Chanotit Nakmanoc
Narintha Boonkuang
Jutamas Auewongaree
Suppaluck Chambang
Faculty of Pharmaceutical Sciences, Chulalongkorn University Rungpetch Sakulbumrungsil

Consumption of antimicrobial agents in Thailand in 2017 61
Faculty of Pharmacy, Silpakorn University Inthira Kanchanaphibool
Faculty of Pharmaceutical Sciences, Khon Kaen University Nussaraporn Kessomboon
Faculty of Pharmaceutical Sciences, Prince of Songkla University Khunjira Udomaksorn
Contributors
Faculty of Veterinary Science, Mahidol University Walasinee Moonarmart
Boonrat Chantong
Sarin Suwanpakdee
Anuwat Wiratsudakul
Thai Feed Mill Association Boonyita Rujtikumporn
Wichai Thermphonboon
Chaiwat Suwannatad
Sompong Harnuthaikij
Krisada Rithichaidumrongkul
Yamuna Patthong
Sureemas Nitikanchana
Pranee Pirompud
Pattama Sritiangtrong
Animal Health Products Association Nackanun Chitaroon
Panitan Suwannapetch
Eagaluk Theerakornsakul
Varisara Jirathitivong

62 Consumption of antimicrobial agents in Thailand in 2017
References
1 Tangcharoensathien V, Sattayawutthipong W, Kanjanapimai S, Kanpravidth W, Brown R, Sommanustweechaia
A. Antimicrobial resistance: from global agenda to national strategic plan, Thailand. Bull World Health
Organ 2017;95:599-603.
2 Sommanustweechai A, Tangcharoensathien V, Malathum K, Sumpradit ., Kiatying-Ang sulee N, Janejai N, et al.
Implementing national strategies on antimicrobial resistance in Thailand: potential challenges and
solutions. Public Health 2018;157:142-6.
3 O’Neill J. Review on antimicrobial resistance. Antimicrobial resistance: Tackling a crisis for the health and
wealth of nations 2014.
4 Pumart P, Phodha T, Thamlikitkul V, Riewpaiboon A, Prakongsai P, Limwattananon S. Health and economic
impacts of antimicrobial resistance in Thailand. Journal of Health Systems Research. 2012;6(3):352-360.
5 World Health Organization. Global Action Plan on Antimicrobial Resistance [Internet]. World Health
Organization; 2015 [cited 2018 September 1]. Available from http://apps.who.int/iris/ bitstream/10665/
193736/1/9789241509763_eng.pdf?ua=1.
6 Sommanustweechai A, Chanvatik S, Sermsinsiri V, Sivilaikul S, Patcharanarumolet W, Yeung S, et al.
Antibiotic distribution channels in Thailand: results of key-informant interviews, reviews of drug regulations
and database searches. Bull World Health Organ 2018;96:101-109.
7 WHO Collaborating Centre for Drug Statistics Methodology. ATC index with DDDs 2018. WHO Collaborating
Centre, Oslo
8 World Health Organization. WHO methodology for a global programme on surveillance of antimicrobial
consumption Version 1.
9 World Organisation for Animal Health. OIE List of antimicrobial agents of veterinary importance. May 2015.
10 Tangcharoensathien V, Thwin AA, and Patcharanarumol W. Implementing health insurance for migrants,
Thailand. Bulletin of the World Health Organization 2017;95:146-51.
11 European Medicines Agency. Trends in the sales of veterinary antimicrobial agents in nine European
countries Reporting period: 2005-2009. 15 September 2011.
12 European Medicines Agency. Sales of veterinary antimicrobial agents in 30 European countries in 2015
Trends from 2010 to 2015 Seventh ESVAC report. 30 October 2017.
13 WHO Collaborating Centre for Drug Statistics Methodology. ATC index with DDDs 2018. WHO Collaborating
Centre, Oslo
14 WHO Collaborating Centre for Drug Statistics Methodology. ATC Index with DDDs. Oslo, WHO 2018
[cited 2018 September 1]. Available from: https://www.whocc.no/atc_ddd_index/.
15 People living with HIV, people on ART and treatment gap, 2000-2017. key facts on HIV. [cited 2018
November 27]. Available from https://bit.ly/2P0udMU.
16 WHO 2018. Global tuberculosis report 2018, Geneva, World Health Organization.
17 World Health Organization 2017. WHO list of Critically Important Antimicrobials for Human Medicine
(WHO CIA list), 5th revision of the highest priority critically important antimicrobials (CIAs) for human
medicine [cited 2018 September 1]. Available from: http://who.int/foodsafety/publications/antimicrobials-
fifth/en/.

Consumption of antim
icrobial agents in Thailand in 2017
Consumptionof antimicrobial agents
in Thailand in 2017
Health Policy and Systems Research on antimicrobial resistance (HPSR-AMR)International Health Policy Program, Thailand Ministry of Public Health, Tivanond Road,Muang District, Nonthaburi 11000Telephone + 66 2 590 2366, 590 2367Fax + 66 2 590 2385Website: www.ihppthaigov.net