contaminants in food
TRANSCRIPT
WHO Technical Report Series959
EVALUATION OF CERTAINCONTAMINANTS IN FOOD
Seventy-second report of theJoint FAO/WHO Expert Committee on
Food Additives
Food and AgricultureOrganization of theUnited Nations
World Health Organization
WHO Library Cataloguing-in-Publication Data
Evaluation of certain contaminants in food: seventy-second report of the Joint FAO/WHO Expert Committeeon Food Additives.
(WHO technical report series ; no. 959)
1.Food contamination - analysis. 2.Acrylamide - toxicity. 3.Arsenic - toxicity. 4.Trichothecenes - toxicity.5.Furans - toxicity. 6.Mercury - toxicity. 7.Perchloric acid - toxicity. 8.Risk assessment. I.World Health
Committee on Food Additives. Meeting (72nd: 2010, Rome, Italy). IV.Series.
ISBN 978 92 4 120959 5 (NLM classification: WA 701)
ISSN 0512-3054
© World Health Organization 2011
All rights reserved. Publications of the World Health Organization can be obtained from WHO Press, WorldHealth Organization, 20 Avenue Appia, 1211 Geneva 27, Switzerland (tel.: +41 22 791 3264; fax: +41 22 7914857; e-mail: [email protected]). Requests for permission to reproduce or translate WHO publications—whether for sale or for non-commercial distribution—should be addressed to WHO Press at the above address(fax: +41 22 791 4806; e-mail: [email protected]).
The designations employed and the presentation of the material in this publication do not imply the expressionof any opinion whatsoever on the part of the World Health Organization concerning the legal status of anycountry, territory, city or area or of its authorities, or concerning the delimitation of its frontiers or boundaries.Dotted lines on maps represent approximate border lines for which there may not yet be full agreement.
The mention of specific companies or of certain manufacturers’ products does not imply that they are endorsedor recommended by the World Health Organization in preference to others of a similar nature that are notmentioned. Errors and omissions excepted, the names of proprietary products are distinguished by initialcapital letters.
All reasonable precautions have been taken by the World Health Organization to verify the informationcontained in this publication. However, the published material is being distributed without warranty of any kind,either expressed or implied. The responsibility for the interpretation and use of the material lies with the reader.In no event shall the World Health Organization be liable for damages arising from its use.
This publication contains the collective views of an international group of experts and does not necessarilyrepresent the decisions or the stated policy of the World Health Organization.
Typeset in IndiaPrinted in India
Organization. II.Food and Agriculture Organization of the United Nations. III.Joint FAO/WHO Expert
Contents
1. Introduction1.1 Declarations of interests
2. General considerations2.1 Report from the Third Session of the Codex Committee on
Contaminants in Foods (CCCF) 2.2 Modelling of dose–response data 2.3 Dietary exposure estimates in epidemiological studies
3. Specific contaminants3.1 Acrylamide 3.2 Arsenic 3.3 Deoxynivalenol 3.4 Furan 3.5 Mercury 3.6 Perchlorate
4. Future work
5. Recommendations
Acknowledgement
References
Annex 1 Reports and other documents resulting from previousmeetings of the Joint FAO/WHO Expert Committee on FoodAdditives
Annex 2 Summary of toxicological evaluations
Annex 3 Countries in the 13 GEMS/Food consumption cluster diets
11
3
347
99
21
75
77
79
81
83
99
103
iii
37485564

Seventy-second meeting of the Joint FAO/WHOExpert Committee on Food Additives
Rome, 16–25 February 2010
Members
Professor J. Alexander, Norwegian Institute of Public Health, Oslo, Norway
Ms J. Baines, Population Health Division, Department of Health and Ageing,Canberra, Australia
Dr M. Bolger, Center for Food Safety and Applied Nutrition, Food and DrugAdministration, College Park, MD, United States of America (USA)
Professor J.M. Duxbury, Department of Crop and Soil Sciences, CornellUniversity, Ithaca, NY, USA
Dr J.C. Larsen, National Food Institute, Technical University of Denmark,Søborg, Denmark
Mrs I. Meyland, National Food Institute, Technical University of Denmark,Søborg, Denmark (Vice-Chairperson)
Dr M.V. Rao, Quality Control Department, Department of the President’s Affairs,Al Ain, United Arab Emirates
Professor A.G. Renwick, School of Medicine, University of Southampton,Ulverston, England (Joint Rapporteur)
Dr S. Resnik, Tecnologia de Alimentos, Departamento de Industrias, Facultadde Ciencias Exactas y Naturales, Ciudad Universitaria, Buenos Aires,Argentina (unable to attend)
Dr J. Schlatter, Consumer Protection Directorate, Swiss Federal Office of PublicHealth, Zürich, Switzerland
Dr G.S. Shephard, Programme on Mycotoxins and ExperimentalCarcinogenesis, Medical Research Council, Tygerberg, South Africa (JointRapporteur)
Professor M.C.F. Toledo, Faculdade de Engenharia de Alimentos, UniversidadeEstadual de Campinas, Campinas, Brazil
Professor R. Walker, Ash, Aldershot, Hampshire, England (Chairperson)
v
Secretariat
Dr A. Agudo, Cancer Epidemiology Research Program, Catalan Institute ofOncology, L’Hospitalet de Llobregat, Spain (WHO Temporary Adviser)
Dr S.M. Barlow, Toxicologist, Brighton, East Sussex, England (WHO TemporaryAdviser)
Dr L. Barraj, Exponent, Inc., Washington, DC, USA (WHO Temporary Adviser)
Dr D.C. Bellinger, Harvard Medical School Children’s Hospital, Boston, MA, USA(WHO Temporary Adviser)
Dr D. Benford, Food Standards Agency, London, England (WHO TemporaryAdviser)
Mrs G. Brisco, Nutrition and Consumer Protection Division, Food and AgricultureOrganization of the United Nations, Rome, Italy (FAO Codex Secretariat)
Ir A.S. Bulder, Department of Substances and Integrated Risk Assessment,National Institute for Public Health and the Environment (RIVM), Bilthoven,Netherlands (WHO Temporary Adviser)
Dr C. Carrington, Center for Food Safety and Applied Nutrition, Food and DrugAdministration, College Park, MD, USA (WHO Temporary Adviser)
Dr V. Carolissen-Mackay, Nutrition and Consumer Protection Division, Food andAgriculture Organization of the United Nations, Rome, Italy (FAO CodexSecretariat)
Mrs R. Charrondiere, Nutrition and Consumer Protection Division, Food andAgriculture Organization of the United Nations, Rome, Italy (FAO StaffMember)
Dr V.A. Devesa i Pérez, Laboratorio de Contaminación Metálica, Instituto deAgroquímica y Tecnología de los Alimentos, Valencia, Spain (FAO Expert)
Dr M. DiNovi, Center for Food Safety and Applied Nutrition, Food and DrugAdministration, College Park, MD, USA (FAO Expert)
Dr D.R. Doerge, National Center for Toxicological Research, Food and DrugAdministration, Jefferson, AR, USA (WHO Temporary Adviser)
Ms S.H. Doyran, Secretary, Codex Alimentarius Commission, Nutrition andConsumer Protection Division, Food and Agriculture Organization of theUnited Nations, Rome, Italy (FAO Codex Secretariat)
Mr J. Fawell, Consultant, Flackwell Heath, Buckinghamshire, England (WHOTemporary Adviser)
Mr M. Feeley, Food Directorate, Health Canada, Ottawa, Canada (WHOTemporary Adviser)
Dr T. Guérin, Agence nationale de sécurité sanitaire de l’alimentation, del’environnement et du travail (ANSES), Maisons-Alfort, France (FAOExpert)
vi
Dr K.-E. Hellenäs, National Food Administration, Uppsala, Sweden (FAOExpert)
Dr A. Hirose, Biological Safety Research Center, National Institute of HealthSciences, Tokyo, Japan (WHO Temporary Adviser)
Dr K. Kpodo, Food Chemistry Division, CSIR-Food Research Institute, Accra,Ghana (FAO Expert)
Dr Y. Konishi, Division of Microbiology, National Institute of Health Sciences,Tokyo, Japan (WHO Temporary Adviser)
Dr J.-C. Leblanc, Agence nationale de sécurité sanitaire de l’alimentation, del’environnement et du travail (ANSES), Maisons-Alfort, France (FAOExpert)
Dr U. Mueller, Risk Assessment - Chemical Safety, Food Standards AustraliaNew Zealand, Canberra, Australia (WHO Temporary Adviser)
Professor J. Ng, National Research Centre for Environmental Toxicology, TheUniversity of Queensland, Brisbane, Australia, and Cooperative ResearchCentre for Contamination Assessment and Remediation of the Environment,Adelaide, Australia (WHO Temporary Adviser)
Mr N. Schelling, Technical Secretariat, Ministry of Agriculture, Nature and FoodQuality, The Hague, Netherlands (Assistant to CCCF Chair)
Ms M. Sheffer, Orleans, ON, Canada (WHO Editor)
Professor W. Slob, National Institute for Public Health and the Environment(RIVM), Bilthoven, Netherlands (WHO Temporary Adviser)
Dr A. Tritscher, Department of Food Safety and Zoonoses, World HealthOrganization, Geneva, Switzerland (WHO Joint Secretary)
Dr P. Verger, Department of Food Safety and Zoonoses, World HealthOrganization, Geneva, Switzerland (WHO Staff Member)
Dr M. Weijtens, Food Safety Policy, Ministry of Agriculture, Nature and FoodQuality, The Hague, Netherlands (Chairman of CCCF)
Dr A. Wennberg, Nutrition and Consumer Protection Division, Food andAgriculture Organization of the United Nations, Rome, Italy (FAO JointSecretary)
Professor G.M. Williams, Department of Pathology, New York Medical College,Valhalla, NY, USA (WHO Temporary Adviser)
Professor Y. Wu, National Institute of Nutrition and Food Safety, Chinese Centerfor Disease Control and Prevention, Beijing, China (FAO Expert)
Professor J.W. Yager, Department of Internal Medicine, Epidemiology,University of New Mexico, Albuquerque, NM, USA (WHO TemporaryAdviser)
vii

Joint monographs containing summaries of relevant analytical and technicaldata and toxicological evaluations are available from WHO under the title:
Safety evaluation of certain contaminants in food. WHO Food AdditivesSeries, No. 63
and from FAO under the title:
Safety evaluation of certain contaminants in food. FAO JECFA Monographs 8
viii
1. Introduction
The Joint FAO/WHO Expert Committee on Food Additives (JECFA) metin Rome, Italy, from 16 to 25 February 2010. The meeting, which was ded-icated to the evaluation of certain contaminants in food, was opened byDr Ezzeddine Boutrif, Director of the Nutrition and Consumer ProtectionDivision of the Agriculture and Consumer Protection Department of the Foodand Agriculture Organization of the United Nations (FAO), on behalf of theDirectors General of FAO and the World Health Organization (WHO).Dr Boutrif noted that the work performed by JECFA in the area of the riskassessment of chemicals in food is a cornerstone in the process of providinginternational guidance to ensure that food safety and food quality measuresare based on science. He emphasized that this work remains an important andhigh priority for FAO and WHO. Dr Boutrif also noted the increased impor-tance that was placed on food security and the right to food by the internationalcommunity at the recent World Summit on Food Security, held in November2009. He suggested that a scarce food supply may increase exposure to con-taminants in food and stressed that efforts to increase food production shouldtake into consideration factors aiming to reduce food contamination as far aspossible.
FAO and WHO recently concluded the joint project to update the principlesand methods for the risk assessment of chemicals in food, and Dr Boutrifthanked all those who had contributed to this major accomplishment.
1.1 Declarations of interests
The Secretariat informed the Committee that all experts participating in theseventy-second meeting had completed declaration of interest forms and thatno conflicts had been identified. The following declared interest and potentialconflict was discussed by the Committee: Dr Leila Barraj participated in anindustry-sponsored assessment of acrylamide intake and acrylamide adductlevels based on publicly available data and therefore abstained from discus-sions on this compound.
1

2. General considerations
As a result of the recommendations of the first Joint FAO/WHO Conferenceon Food Additives, held in September 1955 (1), there have been 71 previousmeetings of the Committee (Annex 1). The present meeting was convenedon the basis of a recommendation made at the seventy-first meeting (Annex1, reference 196).
The tasks before the Committee were:
to elaborate further principles for evaluating the safety of contaminantsin food (section 2);
to undertake toxicological evaluations of certain contaminants in food(section 3 and Annex 2).
2.1 Report from the Third Session of the Codex Committee onContaminants in Foods (CCCF)
The Chair of the Codex Committee on Contaminants in Foods (CCCF),Dr Martijn Weijtens, Ministry of Agriculture, Nature and Food Quality,Netherlands, reported on the outcome of the Third Session of the CCCF andhighlighted the importance of the work of JECFA for the development ofinternational food safety standards in the framework of the Codex Alimen-tarius Commission. He underlined the necessity to particularly consideranimal feed contaminants as potential hazards for human health. He alsostressed the relevance of good communication between CCCF and JECFAon requests for evaluations of contaminants in food and on the possible impactof the outcomes of the evaluations. The importance of collecting and sub-mitting representative data on the occurrence of contaminants in food froma variety of sources and geographical areas for evaluation by JECFA was alsodiscussed, and Dr Weijtens indicated that the CCCF Secretariat wouldstrongly support the plan by FAO and WHO to hold a workshop on the matterduring the next session of CCCF, to be held in Izmir, Turkey, on 25–29 April2010.
3
2.2 Modelling of dose–response data
The present meeting used dose–response modelling to evaluate exposure-related effects and to derive a point of departure (POD) for the estimation ofa margin of exposure (MOE) or health-based guidance value. The methodused was based on that employed at the sixty-fourth meeting of the Committee(Annex 1, reference 176). At the present meeting, the Committee proposedand followed the steps given below:
The data are assessed for exposure-related responses.
The biological relevance to human health of responses found in animalstudies is assessed.
In assessment of the data from epidemiological studies, it may be nec-essary to make adjustments to the data that involve both the dose (e.g. totake other sources of exposure into account) and the outcome (e.g. con-version of risk per person-year to risk per person over a lifetime).
A benchmark response (BMR) for the effects to be modelled is selected.The sixty-fourth meeting of the Committee selected a BMR of 10% forcarcinogenicity data from 2-year studies in rodents, but other BMRs maybe more appropriate for epidemiological studies with large numbers ofsubjects, for other quantal end-points or for continuous data.
The mathematical models appropriate for the chosen end-points (con-tinuous or quantal data) are selected.
The models are fitted to the selected data using suitable software (theUnited States Environmental Protection Agency’s [USEPA] benchmarkdose [BMD] software [BMDS] and RIVM’s PROAST have been usedby the Committee in its evaluations).
Results from the models that provide acceptable fits are used for deriva-tion of the POD (e.g. in section 3.4 of this report, when the BMDS wasused for furan, a P-value of >0.1 for the goodness of fit was used to definean acceptable fit). At both the sixty-fourth meeting and the present meet-ing, the lowest lower confidence limit on the benchmark dose (BMDL)from the accepted models was used, except when data from a more robustor better-designed study measuring the same response resulted in lessuncertainty and a slightly higher BMDL (see section 3.4 of this reportfor an example of this).
In the report, the BMR(s) and software used are stated, and the effects selectedfor modelling and the ranges of BMDs and BMDLs estimated by the differentacceptable fits are tabulated.
4
In the monograph, the output of the models is given in tabular and graphicalforms. The table of results shows the model, the P-value of the goodness offit test, the BMD and the BMDL. Ideally, the graph should show results forthe model resulting in the lowest BMDL, the dose–response data with thefitted curve and the confidence intervals at different dose levels and shouldindicate the position of the BMD; the graph should also show the curve forthe lower bound on the BMD and indicate the position of the BMDL (illus-trative examples using BMDS are shown below).
The Committee recognized that use of the lowest BMDL from the acceptedmodels could result in a POD from a less robust data set being used in pref-erence to the BMDL from a better data set that showed a better fit and higherBMDL in the presence of a comparable BMD. The Committee was aware ofdevelopments in combining the outputs of different models to generate anaverage model, the output of which includes all models weighted accordingto their goodness of fit (2).
The Committee recognized that the use of dose–response modelling is a de-veloping field and recommends to the Joint FAO/WHO Secretariat that anexpert working group be established to review progress and develop detailedguidance for the application of the methods most suitable to the work of theCommittee. The working group should, inter alia, address the followingaspects:
the use of constraints when modelling;
the weighting of model outcomes and model averaging;
goodness of fit criteria;
how human data might be used for dose–response modelling to derive aPOD;
presentation of modelling outcomes in JECFA publications.
Example of data tabulation for the monograph
The example chosen for illustrative purposes (Table 1) is the modelling outputfor hepatocellular adenoma and carcinoma for female mice treated with furan(see section 3.4 of this report for details).
5
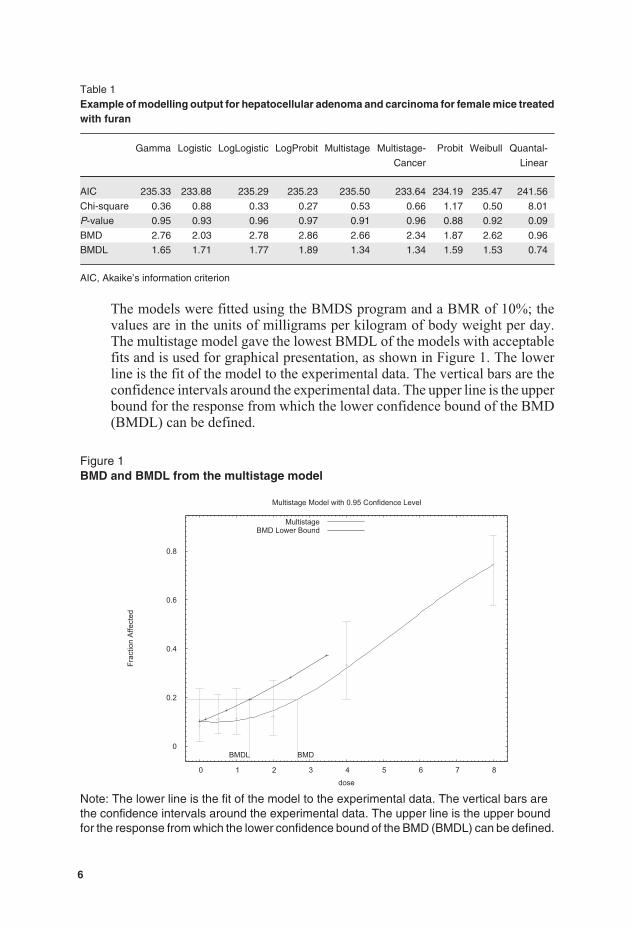
Table 1Example of modelling output for hepatocellular adenoma and carcinoma for female mice treatedwith furan
Gamma Logistic LogLogistic LogProbit Multistage Multistage-
Cancer
Probit Weibull Quantal-
Linear
AIC 235.33 233.88 235.29 235.23 235.50 233.64 234.19 235.47 241.56
Chi-square 0.36 0.88 0.33 0.27 0.53 0.66 1.17 0.50 8.01
P-value 0.95 0.93 0.96 0.97 0.91 0.96 0.88 0.92 0.09
BMD 2.76 2.03 2.78 2.86 2.66 2.34 1.87 2.62 0.96
BMDL 1.65 1.71 1.77 1.89 1.34 1.34 1.59 1.53 0.74
AIC, Akaike’s information criterion
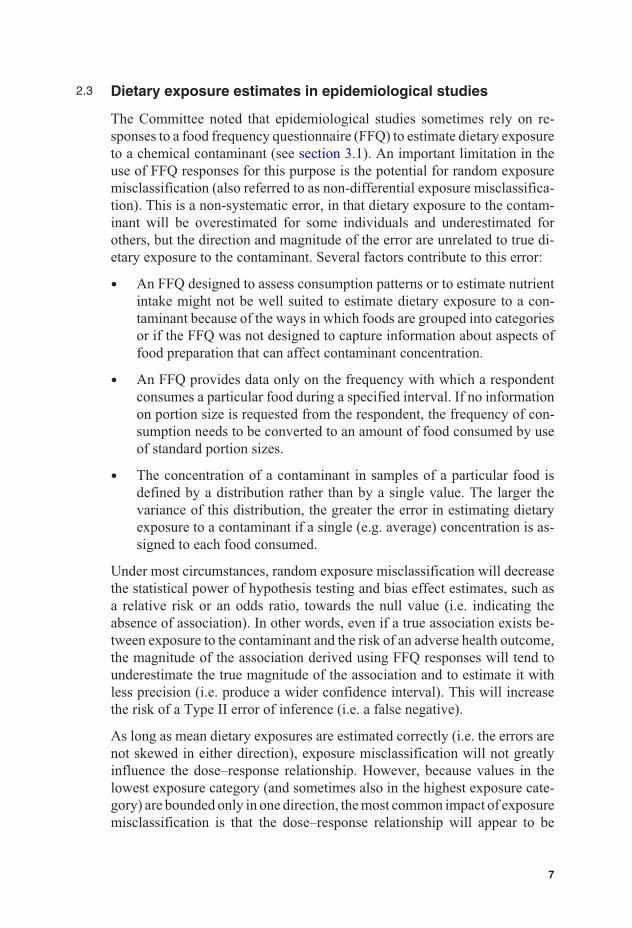
The models were fitted using the BMDS program and a BMR of 10%; thevalues are in the units of milligrams per kilogram of body weight per day.The multistage model gave the lowest BMDL of the models with acceptablefits and is used for graphical presentation, as shown in Figure 1. The lowerline is the fit of the model to the experimental data. The vertical bars are theconfidence intervals around the experimental data. The upper line is the upperbound for the response from which the lower confidence bound of the BMD(BMDL) can be defined.
Figure 1BMD and BMDL from the multistage model
0
0.2
0.4
0.6
0.8
0 1 2 3 4 5 6 7 8
Frac
tion
Affe
cted
dose
Multistage Model with 0.95 Confidence Level
BMDBMDL
MultistageBMD Lower Bound
Note: The lower line is the fit of the model to the experimental data. The vertical bars arethe confidence intervals around the experimental data. The upper line is the upper boundfor the response from which the lower confidence bound of the BMD (BMDL) can be defined.
6
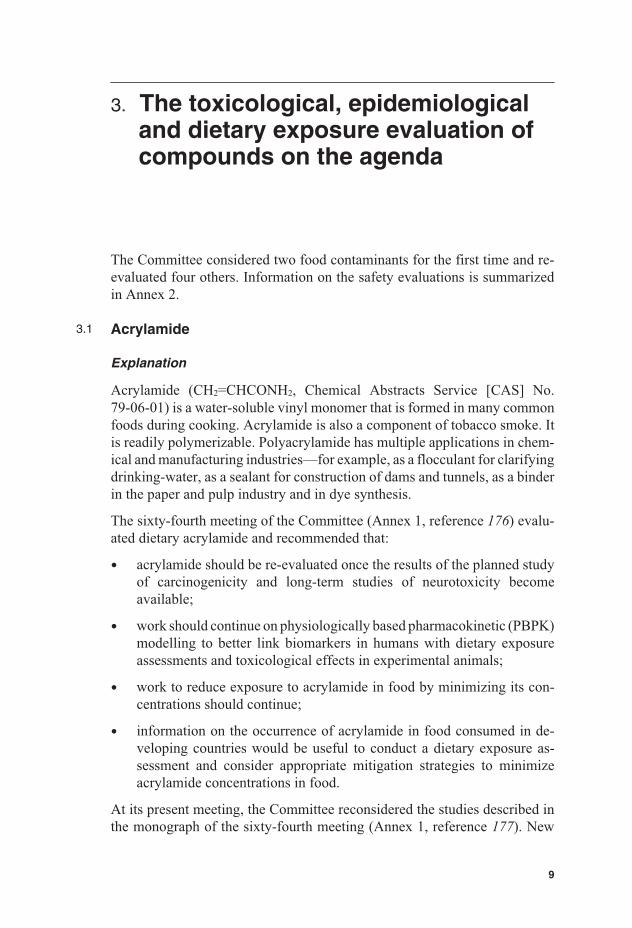
2.3 Dietary exposure estimates in epidemiological studies
The Committee noted that epidemiological studies sometimes rely on re-sponses to a food frequency questionnaire (FFQ) to estimate dietary exposureto a chemical contaminant (see section 3.1). An important limitation in theuse of FFQ responses for this purpose is the potential for random exposuremisclassification (also referred to as non-differential exposure misclassifica-tion). This is a non-systematic error, in that dietary exposure to the contam-inant will be overestimated for some individuals and underestimated forothers, but the direction and magnitude of the error are unrelated to true di-etary exposure to the contaminant. Several factors contribute to this error:
An FFQ designed to assess consumption patterns or to estimate nutrientintake might not be well suited to estimate dietary exposure to a con-taminant because of the ways in which foods are grouped into categoriesor if the FFQ was not designed to capture information about aspects offood preparation that can affect contaminant concentration.
An FFQ provides data only on the frequency with which a respondentconsumes a particular food during a specified interval. If no informationon portion size is requested from the respondent, the frequency of con-sumption needs to be converted to an amount of food consumed by useof standard portion sizes.
The concentration of a contaminant in samples of a particular food isdefined by a distribution rather than by a single value. The larger thevariance of this distribution, the greater the error in estimating dietaryexposure to a contaminant if a single (e.g. average) concentration is as-signed to each food consumed.
Under most circumstances, random exposure misclassification will decreasethe statistical power of hypothesis testing and bias effect estimates, such asa relative risk or an odds ratio, towards the null value (i.e. indicating theabsence of association). In other words, even if a true association exists be-tween exposure to the contaminant and the risk of an adverse health outcome,the magnitude of the association derived using FFQ responses will tend tounderestimate the true magnitude of the association and to estimate it withless precision (i.e. produce a wider confidence interval). This will increasethe risk of a Type II error of inference (i.e. a false negative).
As long as mean dietary exposures are estimated correctly (i.e. the errors arenot skewed in either direction), exposure misclassification will not greatlyinfluence the dose–response relationship. However, because values in thelowest exposure category (and sometimes also in the highest exposure cate-gory) are bounded only in one direction, the most common impact of exposuremisclassification is that the dose–response relationship will appear to be
7

flatter than it really is, particularly at the low end of exposure. Backgroundresponse rates and outcomes for low-dose groups will tend to be overesti-mated, whereas rates at high doses may be underestimated. If the degree towhich exposure misclassification occurs is known, it is possible to representthe potential impact of misclassification on dose–response modelling by con-ducting a bootstrap analysis in which each individual dose is treated as asource of uncertainty.
When evaluating the results of studies in which FFQ responses provided thebasis for estimates of dietary exposure to a contaminant, the extent to whichrandom exposure misclassification might have influenced the conclusionsdrawn must be considered.
8
3. The toxicological, epidemiologicaland dietary exposure evaluation ofcompounds on the agenda
The Committee considered two food contaminants for the first time and re-evaluated four others. Information on the safety evaluations is summarizedin Annex 2.
3.1 Acrylamide
Explanation
Acrylamide (CH2=CHCONH2, Chemical Abstracts Service [CAS] No.79-06-01) is a water-soluble vinyl monomer that is formed in many commonfoods during cooking. Acrylamide is also a component of tobacco smoke. Itis readily polymerizable. Polyacrylamide has multiple applications in chem-ical and manufacturing industries—for example, as a flocculant for clarifyingdrinking-water, as a sealant for construction of dams and tunnels, as a binderin the paper and pulp industry and in dye synthesis.
The sixty-fourth meeting of the Committee (Annex 1, reference 176) evalu-ated dietary acrylamide and recommended that:
acrylamide should be re-evaluated once the results of the planned studyof carcinogenicity and long-term studies of neurotoxicity becomeavailable;
work should continue on physiologically based pharmacokinetic (PBPK)modelling to better link biomarkers in humans with dietary exposureassessments and toxicological effects in experimental animals;
work to reduce exposure to acrylamide in food by minimizing its con-centrations should continue;
information on the occurrence of acrylamide in food consumed in de-veloping countries would be useful to conduct a dietary exposure as-sessment and consider appropriate mitigation strategies to minimizeacrylamide concentrations in food.
At its present meeting, the Committee reconsidered the studies described inthe monograph of the sixty-fourth meeting (Annex 1, reference 177). New
9
information on occurrence and mitigation as well as dietary exposure wasconsidered. Additionally, the Committee considered the recently completedtoxicity studies, which included studies on metabolism, genotoxicity andneurodevelopmental effects following exposure to acrylamide as well aslong-term toxicity and carcinogenicity studies on acrylamide and glycid-amide. There were also many new epidemiological studies available forreview.
Absorption, distribution, metabolism and excretion
Since the metabolism of acrylamide was last reviewed by the Committee atits sixty-fourth meeting, a number of studies have compared acrylamidemetabolism in rodents and humans. Rodents and humans metabolize acryl-amide to a chemically reactive epoxide, glycidamide, in a reaction catalysedby cytochrome P450 2E1 (CYP2E1). In humans, there is considerable vari-ability in the extent of acrylamide conversion to glycidamide. This differenceappears to be related to interindividual variability in the amount of CYP2E1rather than to an enzyme polymorphism. Although there are species differ-ences in hepatic CYP2E1 activity, PBPK modelling suggests only modestdifferences in biotransformation between rats and humans. Glycidamide maybe further metabolized by epoxide hydrolase to glyceramide or by conjuga-tion to glutathione, or it may react with proteins, including haemoglobin, orwith deoxyribonucleic acid (DNA). Acrylamide is extensively conjugatedwith glutathione to form a mercapturic acid, N-acetyl-S-(2-carbamoylethyl)-L-cysteine, in all species examined and is oxidized to its correspondingsulfoxide in humans only. PBPK modelling of acrylamide metabolism anddisposition has provided estimates of internal exposure to both acrylamideand glycidamide that facilitate comparisons of internal dosimetry for use inrisk assessment for neurotoxicity and carcinogenicity.
Toxicological data
Despite overt symptoms of neurotoxicity (i.e. hind limb paralysis) at thehighest oral acrylamide dose tested (44 mg/kg body weight [bw] per day indrinking-water), a short-term study in adult male rats indicated that only mi-nor changes were seen in messenger ribonucleic acid (mRNA) levels of themore than 50 genes directly related to the cholinergic, noradrenergic, gamma-aminobutyric acid–releasing (GABAergic) or glutamatergic neurotransmittersystems in the striatum, substantia nigra or parietal cortex. No evidence ofaxonal, dendritic or neuronal cell body damage or microglial activation wasfound in the forebrain at acrylamide doses below 44 mg/kg bw per day. Inaddition, levels of serotonin, dopamine and their metabolites were essentiallyunchanged in the striatum, substantia nigra or parietal cortex. The motor
10
deficits observed were interpreted as being caused by damage to the brainstem, spinal cord and peripheral neurons.
The effect of orally administered acrylamide on neurodevelopment in ratswas investigated following exposure during gestation and postnatally in twoseparate studies. In one study, food-motivated behaviour, evaluated at 6–12weeks of exposure, was significantly changed only at the highest dose tested(5 mg/kg bw per day).
In a second study in rats, oral acrylamide doses of 7.9 mg/kg bw per day and14.6 mg/kg bw per day caused gait abnormalities in dams from postnatal day(PND) 18 and PND 2, respectively, to PND 21. A corresponding reductionin pup body weight occurred over the same time interval. Histopathologicalchanges were observed in ganglion cells of the trigeminal nerves at doses of7.9 mg/kg bw per day and above. Pups from untreated dams that receivedacrylamide intraperitoneally at a dose of 50 mg/kg bw 3 times a week fromPND 2 to PND 21 showed similar trigeminal nerve lesions. Morphometricdata of the sciatic nerve in dams but not their pups at 14.6 mg/kg bw per dayshowed a significant increase in the number of degenerated small-diameteraxons and myelinated nerves. Similar lesions were found in pups treatedintraperitoneally. All male pups from dams treated at 14.6 mg/kg bwper day and those treated intraperitoneally showed evidence of delayedspermatogenesis.
Significantly increased incidences of neurotoxicity, measured as peripheralnerve (sciatic) axon degeneration by microscopic histopathology, wereobserved in a 2-year bioassay (National Center for Toxicological Research[NCTR]/National Toxicology Program [NTP] of the USA) (3) with F344 ratstreated with acrylamide in drinking-water. The no-observed-adverse-effectlevels (NOAELs) were 0.67 mg/kg bw per day in males and 1.88 mg/kg bwper day in females.
Genotoxicity
In accord with the previously reported findings, the new in vitro genotoxicitystudies indicate that acrylamide in the absence of activation is a weak mutagenbut an effective clastogen. In contrast, glycidamide is a mutagen and clasto-gen. Assays of mutagenicity in vivo have demonstrated that administrationof acrylamide or glycidamide in the drinking-water increases mutant fre-quencies in lymphocyte Hprt and liver and lung cII genes of adult Big Bluemice by inducing primarily guanine:cytosine (G:C) to thymine:adenine(T:A) transversions. Similarly, acrylamide and glycidamide (approximately3–5 mg/kg bw per day) are mutagenic in thyroid, but not liver or mammarygland, of male and female Big Blue rats. In addition, glycidamide, but notacrylamide, was found to be a DNA-reactive mutagen in neonatal Tk mice at
11
Hprt and Tk loci. In mice treated with acrylamide for 28 days, there was alinear increase in the number of micronuclei that achieved significance at6 mg/kg bw per day in erythrocytes and at 4 mg/kg bw per day in reticulocytes.Use of an internal marker of acrylamide exposure, such as concentrations ofhaemoglobin adducts (glycidamide–valine [GA-Val], acrylamide–valine[AA-Val]) or DNA adducts (N7-glycidamide–guanine [N7-GA-Gua]), gavea better fit than the external dose for modelling micronuclei frequency. Thefitted model gave a threshold at adduct levels equivalent to an external doseof 1–2 mg/kg bw per day.
Carcinogenicity
In the recently completed 2-year NCTR/NTP studies in which mice andrats were treated with acrylamide in drinking-water (3), the sites of tumours(thyroid and mammary gland, peritesticular mesothelium) induced in maleand female F344 rats at a dose range up to 2.78 mg/kg bw per day in malesand 4.09 mg/kg bw per day in females were concordant with those found inprevious 2-year studies in rats. Additional tumour sites observed in the newstudy were heart schwannomas and pancreatic islet tumours in males. Anotable absence in the new study was the lack of significantly elevatedincidences of brain and spinal cord tumours of glial origin. The new studyalso reported the tumorigenesis of acrylamide in multiple tissues of male andfemale B6C3F1 mice (lung, Harderian gland, forestomach, mammary, ovary)using the same drinking-water concentrations as used in the rat study. Theachieved acrylamide doses in mice were up to 9.11 mg/kg bw per day formales and 9.97 mg/kg bw per day for females. These findings were furthersupported by results from parallel groups of animals that were treated withequimolar concentrations of glycidamide in drinking-water. Most tumoursites at which the incidence was significantly elevated in rats and mice ex-posed to acrylamide were also significantly increased by glycidamide, withglycidamide-induced tumour incidences being either similar or higher. Theonly exceptions were ovarian benign granulosa cell tumours in female miceand pancreatic adenomas and carcinomas in male rats. Tumours in other tis-sues were observed to be significantly increased in glycidamide-treated ratsand mice, including skin in mice and oral cavity and mononuclear cellleukaemia in rats. The concordance of tumour sites and glycidamide internaldosimetry from PBPK modelling between acrylamide- and glycidamide-treated rodents provides strong support for the hypothesis that glycidamideis the ultimate carcinogenic species derived from metabolism of acrylamide.Additional support for the tumorigenicity of glycidamide, but not acrylamide,was observed in livers of male Tk mice treated neonatally on PNDs 1, 8 and15 and evaluated after 1 year of life.
12
Observations in humans
The updated analyses of workers exposed to acrylamide by inhalation re-vealed considerably lower relative risks for mortality from pancreatic cancerthan in previous analyses of the same cohorts, and the results were not sta-tistically significant. The updated analyses are based upon comparisons withmortality in the general population as well as comparisons of different levelsof acrylamide exposure within the cohort, with control for smoking history.Taken together, in spite of high acrylamide exposure in some workers, resultsfor these two cohorts do not provide support for any relationship betweenacrylamide exposure at the workplace and cancer mortality.
The potential association between dietary exposure to acrylamide and cancerhas been assessed in five prospective studies. Without taking into accountsubgroup analyses (i.e. different histological types of tumours in a particularorgan/site, different stage at diagnosis, stratified analysis by smoking), thesecohorts provided 23 estimates of relative risk for 16 tumour sites. No statis-tically significant associations were found between dietary acrylamide ex-posure and the following cancers: breast (four studies), ovary (two),endometrium (two), prostate (two), urinary bladder, colon and rectum (two),stomach, oesophagus, pancreas, lung (men), brain, oral cavity, pharynx, lar-ynx and thyroid. Statistically significant associations were found in somestudies for some cancers, including renal cell cancer, when adjusted forsmoking and for ovarian and endometrial cancers among non-smokers. Asignificant increase in risk was also reported for cancer of the oral cavity, butthis was restricted to female non-smokers. For lung cancer, there was a sig-nificant inverse association among women; this association was strongeramong non-smokers and for adenocarcinomas. To date, none of these asso-ciations between acrylamide exposure and cancer at particular sites have beenconfirmed.
No association was found between concentrations of the biomarker AA-Valhaemoglobin adduct and prostate cancer in a population-based case–controlstudy. In a prospective study, no association between AA-Val/GA-Val con-centrations and risk of breast cancer in postmenopausal women was found.However, a significantly increased risk was reported in smokers after adjust-ing for duration and intensity of smoking. This effect was even stronger whenthe analysis was restricted to cases with estrogen receptor positive tumours.These associations were found for AA-Val adducts but not for GA-Valadducts.
Overall, the epidemiological studies do not provide any consistent evidencethat occupational exposure or dietary exposure to acrylamide is associatedwith cancer in humans. Although some studies indicate an association withsome tumour types, particularly the hormone-related cancers in women, this
13
needs confirmation. While the epidemiological investigations have notshown an increased cancer risk from acrylamide exposure, the statisticalpower and potential for misclassification of acrylamide dietary exposure inthese studies are of concern. The reviewed studies, including those with arelatively large sample size, had low power (always below 50%) to detect anincreased risk of small magnitude. Data from FFQs, which are used to esti-mate the extent of dietary exposure to acrylamide in population-based studies,have been shown to correlate poorly with biomarkers of acrylamide and gly-cidamide exposure. Dietary exposure estimates derived from FFQs cannotreadily capture the inherent variability of acrylamide concentrations in indi-vidual foods (see section 2.3). Consequently, epidemiological studies that useFFQs have a limited ability to detect an association between the surrogatemeasure of dietary acrylamide exposure and a modest increase in cancer risk.
Analytical methods
Reliable methods for the determination of acrylamide in all relevant foodsare available, as demonstrated both by collaborative validation trials of singlemethods as well as by proficiency tests with a variety of methods. Analyticallaboratories are enabled to demonstrate and maintain measurement qualitythrough the availability of certified reference materials and proficiency test-ing schemes. Isotope-labelled acrylamide for use as an internal standard iscommercially available. A majority of validated and fit-for-purpose methodsare isotope dilution mass spectrometric procedures, most commonly liquidchromatography–tandem mass spectrometry (LC-MS/MS) and, after deriva-tization, gas chromatography with mass spectrometry (GC-MS) or GC-MS/MS. Development of simpler, inexpensive and quick methods (e.g. im-munoassays) has been reported, but validated methods of this type are stillnot available.
Formation during cooking and heat processing
The main route for acrylamide formation in foods is the Maillard reactions.Upon heating, the free amino acid asparagine is decarboxylated and deami-nated to form acrylamide via routes involving initial reaction with reducingsugars or other carbonyl compounds. The Maillard reactions are also respon-sible for the flavour and colours typical of fried foods; unlike acrylamideformation, these processes also involve amino acids other than asparagine.
Other formation mechanisms have been identified; for example, acrylamidecan be formed through pyrolysis of the wheat protein gluten or via initialenzymatic decarboxylation of asparagine in raw potatoes. Although theseroutes are believed to be of minor importance, the degree to which they con-tribute to acrylamide formation in different foods has not yet been thoroughlyinvestigated.
14
Prevention and control
Reduction and control of acrylamide in foods have relied mainly on voluntaryactions by the food industry to reduce the acrylamide levels in their products.Many national authorities provide information to consumers on how to reducethe formation of acrylamide in home cooking; to some extent, dietary adviceis also given. A Code of Practice for the Reduction of Acrylamide in Foodshas recently been adopted by the Codex Alimentarius Commission. TheEuropean Commission, in cooperation with the food industry, has initiatedseveral measures on acrylamide mitigation. These were to a large extent basedon the more extensive “toolbox for acrylamide mitigation” produced by thefood industry.
Although a large and growing number of mitigation methods are being pub-lished, there is still no single method that can efficiently lower the levels ofacrylamide in all foods. The food industry toolbox lists a number of measuresthat may be introduced at the various stages: agronomical, recipe, processingand final preparation. Only a limited number of measures have been imple-mented at an industrial production scale so far, including control of sugarlevels in potatoes, treatment with the enzyme asparaginase, addition ofvarious salts and acids, control of thermal input and cooking profile, andcontrol of moisture and browning in the final product.
Significant mitigation achievements were reported by producers of potatocrisps (USA = chips) and potato chips (USA = french fries) in some countriesduring the first years after the discovery of acrylamide in foods in 2002, butfewer achievements have been reported in recent years. Average acrylamidelevels in German potato crisps produced from stored potatoes were in therange of 800–1000 μg/kg in 2002–2003 and 400–600 μg/kg in 2004–2009.In general, mitigation efforts have had limited success when applied to breadand other cereal products, although significant reductions in acrylamide lev-els have been reported more recently for some specific products. Mitigationafter 2003 has been reported mainly for food types with comparably highacrylamide levels or single products that are at the high end of contaminationwithin their food type. Although this might significantly reduce the exposurefor some individuals or population subgroups, it will have little effect on thedietary exposure for the general population in most countries.
Levels and patterns of contamination in food commodities
At the current meeting, the Committee reviewed data from 31 countries onthe occurrence of acrylamide in different foods analysed between 2004 and2009. The total number of analytical results (single or composite samples)was 12 582, with 61% coming from Europe, 28% from Asia, 9% from NorthAmerica, 1% from the Pacific and 1% from Latin America. No data were
15
received from Africa. The Committee noted that the occurrence data evalu-ated at its present meeting were more comprehensive than the data submittedat the sixty-fourth meeting. Most countries used validated analytical methodsand employed quality control programmes to ensure the reliability of the data.
National mean concentrations of acrylamide in major foods were found torange from 399 to 1202 μg/kg for potato crisps (USA = chips); from 159 to963 μg/kg for potato chips (USA = french fries); from 169 to 518 μg/kg forbiscuits (USA = cookies); from 87 to 459 μg/kg for crispbread and crackers;and from 3 to 68 μg/l for coffee (ready to drink). The Committee noted thatthe mean concentration ranges of acrylamide in the above foods are similarto those considered in its previous evaluation at the sixty-fourth meeting. Incomparing global mean acrylamide levels for commodity groups with thelevels obtained at the sixty-fourth meeting, the Committee noted that acryl-amide levels in rye products had decreased significantly. No significantdifferences were observed for products made from potato, barley, rice, wheat,maize or oats.
Food consumption and dietary exposure assessment
Data on dietary exposure for eight countries were evaluated at this meeting.All regions were represented, except for Africa, for which no dietary exposuredata were available. National dietary exposures were calculated mainly usinga deterministic assessment. The modelling combined national individualconsumption data with mean occurrence data obtained from national moni-toring surveys and with the consumer body weights reported in consumptionsurveys.
Estimates of mean dietary exposures at the national level ranged from 0.2 to1.0 μg/kg bw per day for the general adult population. For adult consumersat the high (95th–97.5th) percentile, the estimates of dietary exposure rangedfrom 0.6 to 1.8 μg/kg bw per day. Based on the few data available for children,it was noted that children had dietary exposures to acrylamide that were abouttwice those of adult consumers when expressed on a body weight basis. TheCommittee noted that these estimates were similar to those used in the as-sessment performed by the sixty-fourth meeting, at which a dietary exposureto acrylamide of 1 μg/kg bw per day was taken to represent the mean for thegeneral population and a dietary exposure of 4 μg/kg bw per day was takento represent consumers with a high dietary exposure.
The major foods contributing to the total mean dietary exposures for mostcountries were potato chips (USA = french fries) (10–60%), potato crisps(USA = chips) (10–22%), bread and rolls/toast (13–34%) and pastry andsweet biscuits (USA = cookies) (10–15%). Generally, other food items con-tributed less than 10% to the total dietary exposures. The Committee noted
16
that these contributions to overall exposures were consistent with the majorcontributing foods identified by the sixty-fourth meeting.
International estimates of dietary exposure were prepared by combining theinternational means of contamination levels reviewed at this meeting withfood consumption data from the Global Environment Monitoring System –Food Contamination Monitoring and Assessment Programme (GEMS/Food)consumption cluster diets (see Annex 3), which differentiate 13 regionaldietary patterns for food commodities (e.g. the consumption of cassava hasbeen combined with mean acrylamide levels taken from cassava, raw/boiled,and from processed cassava products). The Committee noted that these esti-mates were more refined than those prepared at the sixty-fourth meeting,which were based on the then-available five GEMS/Food regional consump-tion diets.
The Committee estimated the international mean dietary exposures to rangebetween 1.1 and 4.8 μg/kg bw per day across the 13 GEMS/Food consump-tion cluster diets, assuming a body weight of 60 kg. Cereals and root- andtuber-based foods were the main contributors to the total dietary exposurecalculations for each cluster diet. Dietary exposures from cereal-based foodsare between about 0.5 and 2.8 μg/kg bw per day. Depending on the patternsof consumption in each cluster, processed foods based on wheat, maize andrice were the main commodities contributing to overall exposure from cereal-based foods. Dietary exposures from roots and tubers ranged from 0.2 to2.2 μg/kg bw per day. Processed potato was the main contributor to overalldietary exposure in most cluster diets. Food commodities based on peas, cas-sava and plantain were also major contributors for some cluster diets, specif-ically clusters A and J. Other GEMS/Food commodities contributed less than10% to the total dietary exposure estimations.
The Committee recognized that it was difficult to have a clear picture ofnational trends in dietary exposures since the last evaluation and noted thatthis was mainly due to the lack of updated dietary exposure data from thecountries evaluated at the previous meeting. Additionally, there were differ-ences in methodologies used in evaluations within a single country forobtaining data on consumption and occurrence. Nevertheless, when compar-ing international dietary exposure data with the occurrence data from thesixty-fourth and the present meetings (overall 18 000 analytical data), nosignificant differences were seen.
The Committee concluded that, overall, no major changes in dietary expo-sures had occurred since the last evaluation. Therefore, based on national andregional estimates, a dietary exposure to acrylamide of 1 μg/kg bw per daycould again be taken to represent the mean for the general population, in-cluding children, and a dietary exposure of 4 μg/kg bw per day could againbe taken to represent consumers with a high dietary exposure.
17
Dose–response analysis
At its sixty-fourth meeting, the Committee noted that the lowest NOAEL fora non-carcinogenic end-point was 0.2 mg/kg bw per day. This end-point wasbased on the induction of morphological nerve changes in rats following ad-ministration of acrylamide in drinking-water. There were no new studies inlaboratory animals in which non-carcinogenic effects were observed at a dosebelow 0.2 mg/kg bw per day.
The Committee considered that the pivotal effects of acrylamide were itsgenotoxicity and carcinogenicity. As expressed in the previous evaluation,the Committee considered that the available epidemiological data were notsuitable for a dose–response analysis. Therefore, the assessment was basedon the available studies in laboratory animals. In the dose–response analysisusing the USEPA BMD software (BMDS version 2.0), the nine differentstatistical models were used to fit the new experimental data in mice and ratsfrom the NCTR/NTP studies (3). Those models resulting in acceptable fits,based on biological and statistical considerations, were selected to derive aBMD and a BMDL for a 10% extra risk of tumours (i.e. a BMD10 and aBMDL10).
This process resulted in a range of BMD10 and BMDL10 values for each end-point considered (Tables 2 and 3). The Committee noted that the BMDL10
values from the NCTR/NTP 2-year bioassay of acrylamide in male and fe-male F344 rats (3) were similar to those reported at the sixty-fourth meetingfor the earlier rat bioassays of carcinogenicity. However, the lowest range ofBMDL10 values was observed for the Harderian gland in B6C3F1 mice treatedwith acrylamide. As humans have no equivalent organ, the significance ofthese benign mouse tumours in the Harderian gland is difficult to interpretwith respect to humans. However, in view of acrylamide being a multisitecarcinogen in rodents, the Committee was unable to discount the effect in theHarderian gland.
The Committee considered it appropriate to use 0.18 mg/kg bw per day (thelowest value in the range of BMDL10 values) for tumours in the Harderiangland of male mice and 0.31 mg/kg bw per day for mammary tumours infemale rats as the PODs.
18
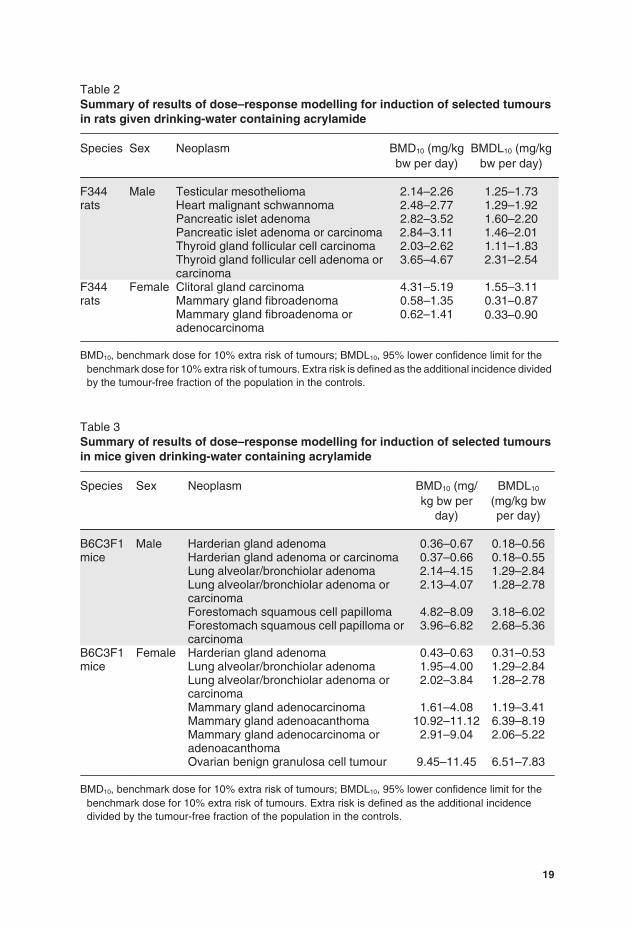
Table 2Summary of results of dose–response modelling for induction of selected tumoursin rats given drinking-water containing acrylamide
Species Sex Neoplasm BMD10 (mg/kgbw per day)
BMDL10 (mg/kgbw per day)
F344rats
Male Testicular mesothelioma 2.14–2.26 1.25–1.73Heart malignant schwannoma 2.48–2.77 1.29–1.92Pancreatic islet adenoma 2.82–3.52 1.60–2.20Pancreatic islet adenoma or carcinoma 2.84–3.11 1.46–2.01Thyroid gland follicular cell carcinoma 2.03–2.62 1.11–1.83Thyroid gland follicular cell adenoma orcarcinoma
3.65–4.67 2.31–2.54
F344rats
Female Clitoral gland carcinoma 4.31–5.19 1.55–3.11Mammary gland fibroadenoma 0.58–1.35 0.31–0.87Mammary gland fibroadenoma oradenocarcinoma
0.62–1.41 0.33–0.90
BMD10, benchmark dose for 10% extra risk of tumours; BMDL10, 95% lower confidence limit for thebenchmark dose for 10% extra risk of tumours. Extra risk is defined as the additional incidence dividedby the tumour-free fraction of the population in the controls.
Table 3Summary of results of dose–response modelling for induction of selected tumoursin mice given drinking-water containing acrylamide
Species Sex Neoplasm BMD10 (mg/kg bw per
day)
BMDL10
(mg/kg bwper day)
B6C3F1mice
Male Harderian gland adenoma 0.36–0.67 0.18–0.56Harderian gland adenoma or carcinoma 0.37–0.66 0.18–0.55Lung alveolar/bronchiolar adenoma 2.14–4.15 1.29–2.84Lung alveolar/bronchiolar adenoma orcarcinoma
2.13–4.07 1.28–2.78
Forestomach squamous cell papilloma 4.82–8.09 3.18–6.02Forestomach squamous cell papilloma orcarcinoma
3.96–6.82 2.68–5.36
B6C3F1mice
Female Harderian gland adenoma 0.43–0.63 0.31–0.53Lung alveolar/bronchiolar adenoma 1.95–4.00 1.29–2.84Lung alveolar/bronchiolar adenoma orcarcinoma
2.02–3.84 1.28–2.78
Mammary gland adenocarcinoma 1.61–4.08 1.19–3.41Mammary gland adenoacanthoma 10.92–11.12 6.39–8.19Mammary gland adenocarcinoma oradenoacanthoma
2.91–9.04 2.06–5.22
Ovarian benign granulosa cell tumour 9.45–11.45 6.51–7.83
BMD10, benchmark dose for 10% extra risk of tumours; BMDL10, 95% lower confidence limit for thebenchmark dose for 10% extra risk of tumours. Extra risk is defined as the additional incidencedivided by the tumour-free fraction of the population in the controls.
19
Evaluation
The Committee noted that mitigation after 2003 has been reported for foodtypes with high acrylamide levels or single products that contain higher levelswithin their food type. Although this might significantly reduce the exposurefor some individuals or population subgroups, the Committee noted that thiswill have little effect on the dietary exposure of the general population in allcountries. In line with this, neither the estimated average acrylamide exposurefor the general population (0.001 mg/kg bw per day) nor the exposure forconsumers in the high percentile (0.004 mg/kg bw per day) had changed sincethe sixty-fourth meeting. The MOE calculated relative to the NOAEL of0.2 mg/kg bw per day for the most sensitive non-carcinogenic end-point—namely, morphological changes in nerves, detected by electron microscopy,in rats—therefore remains unchanged. For the general population andconsumers with high exposure, the MOE values are 200 and 50, respectively.Consistent with the conclusion made at the sixty-fourth meeting, theCommittee noted that while adverse neurological effects are unlikely at theestimated average exposure, morphological changes in nerves cannot beexcluded for individuals with a high dietary exposure to acrylamide.
When average and high dietary exposures are compared with the BMDL10 of0.31 mg/kg bw per day for the induction of mammary tumours in rats, theMOE values are 310 and 78, respectively. For Harderian gland tumours inmice, the BMDL10 is 0.18 mg/kg bw per day, and the MOE values are 180and 45 for average and high exposures, respectively.
The Committee considered that for a compound that is both genotoxic andcarcinogenic, these MOEs indicate a human health concern. The Committeerecognized that these MOE values were similar to those determined at thesixty-fourth meeting and that the extensive new data from cancer bioassaysin rats and mice, PBPK modelling of internal dosimetry, a large number ofepidemiological studies and updated dietary exposure assessments supportthe previous evaluation.
The Committee noted that there was a poor correlation between the estimateddietary exposure and internal biological markers of acrylamide exposure(AA-Val and GA-Val adducts) in humans and that worker cohort epidemio-logical studies did not provide any evidence that exposure to acrylamideresulted in an increase in the incidence of cancer. To better estimate the riskfrom acrylamide in food for humans, the Committee recommended that lon-gitudinal studies on intra-individual levels of acrylamide and glycidamidehaemoglobin adducts be measured over time in relation to concurrent dietaryexposure. Such data would provide a better estimate of acrylamide exposurefor epidemiological studies designed to assess risk from the diet.
A detailed addendum to the monograph was prepared.
20
Recommendation
The Committee recommends further efforts on developing and implementingmitigation methods for acrylamide in foods of major importance for dietaryexposure.
3.2 Arsenic
Explanation
Arsenic is a metalloid that occurs in different inorganic and organic forms,which are found in the environment both from natural occurrence and fromanthropogenic activity. Arsenic was previously evaluated by the Committeeat its tenth, twenty-seventh and thirty-third meetings (Annex 1, references13, 63 and 84). At its twenty-seventh meeting (1983), it was concluded that“on the basis of the data available the Committee could arrive at only anestimate of 0.002 mg/kg b.w. as a provisional maximum tolerable daily intakefor ingested inorganic arsenic; no figure could be arrived at for organic ar-senicals in food” (Annex 1, reference 63). This was based on the observationthat arsenicism can be associated with water supplies containing an upperarsenic concentration of 1 mg/l or greater and that a concentration of 0.1 mg/lmay give rise to presumptive signs of toxicity. Assuming a daily water con-sumption of 1.5 litres, the Committee concluded that inorganic arsenic intakesof 1.5 mg/day were likely to result in chronic arsenic toxicity and that dailyintakes of 0.15 mg may also be toxic in the long term to some individuals.The Committee noted that the International Programme on Chemical Safety(IPCS) had estimated that an arsenic concentration of 0.2 mg/l in drinking-water would lead to a 5% lifetime risk of skin cancer, but that skin cancer didnot occur in the absence of other toxic effects due to arsenic. The Committeealso noted a need for information on:
arsenic accumulation in humans exposed to various forms of arsenic inthe diet and drinking-water;
the identification, absorption, elimination and toxicity of arsenic com-pounds in food, with particular reference to arsenic in fish;
the contribution of arsenic in fish to human body burden of arsenic;
epidemiological studies on populations exposed to elevated intakes ofarsenic of known speciation.
At its thirty-third meeting (1988), the Committee considered information rel-evant to assessing the significance of organoarsenicals in fish. The previousevaluation was confirmed by assigning a provisional tolerable weekly intake(PTWI) of 0.015 mg/kg bw for inorganic arsenic, “with the clear understand-ing that the margin between the PTWI and intakes reported to have toxiceffects in epidemiological studies was narrow” (Annex 1, reference 84). The
21
Committee noted that the organic forms of arsenic present in seafood neededdifferent consideration from the inorganic arsenic in water. It concluded thatthere had been no reports of ill-effects among populations consuming largequantities of fish that result in organoarsenic intakes of about 0.05 mg/kg bwper day, but further investigation would be desirable to assess the implicationsfor human health of exposure to naturally occurring organoarsenic com-pounds in marine products.
Inorganic arsenic has also been evaluated on a number of occasions by theInternational Agency for Research on Cancer (IARC). In 1973, IARC con-cluded that there was a causal relationship between skin cancer and exposureto inorganic arsenic in drugs, in drinking-water with a high arsenic contentor in the occupational environment and that the risk of lung cancer was clearlyincreased in certain smelter workers who inhaled high levels of arsenic tri-oxide. However, the causative role of arsenic was uncertain, as the influenceof other constituents of the working atmosphere could not be determined. In1980, IARC concluded that there was sufficient evidence that inorganic ar-senic compounds are skin and lung carcinogens in humans (Group 1). In 2004,IARC concluded that there was sufficient evidence in humans that arsenic indrinking-water causes cancers of the urinary bladder, lung and skin, whereasthe evidence for carcinogenicity in experimental animals was limited. In2009, IARC again concluded that arsenic in drinking-water causes cancersof the urinary bladder, lung and skin and that the evidence was “limited” forcancers of the kidney, liver and prostate.
At its present meeting, the Committee was asked to consider all informationrelated to the toxicology and epidemiology, exposure assessment, includingbiomarker studies, analytical methodology, speciation and occurrence in foodand drinking-water, in order to re-evaluate and review the PTWI for inorganicarsenic. The literature relating to arsenic is extensive, and the present Com-mittee used three recent reviews—by the United States Agency for ToxicSubstances and Disease Registry, the European Food Safety Authority(EFSA) and IARC—as the starting point for its evaluation and also took intoaccount newer studies that were considered to be informative for the evalu-ation. The arsenic-containing compounds found in water, foods and biolog-ical samples are shown in Table 4.
Absorption, distribution, metabolism and excretion
Absorption of arsenic depends on the chemical species and its solubility aswell as the matrix in which it is present. Soluble arsenicals in water are highlybioavailable. Inorganic arsenic is rapidly cleared from blood both in humansand in most experimental animal species that have been tested; an exceptionis rats, in which arsenic binds to erythrocytes, delaying clearance. Inorganicarsenic is metabolized primarily by stepwise reduction of pentavalent arsenic
22
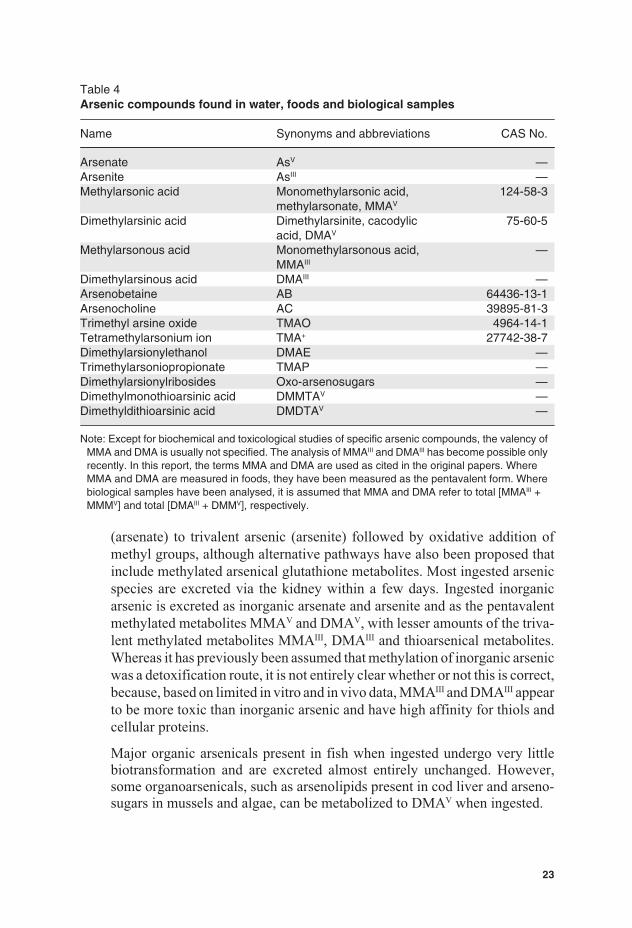
Table 4Arsenic compounds found in water, foods and biological samples
Name Synonyms and abbreviations CAS No.
Arsenate AsV —Arsenite AsIII —Methylarsonic acid Monomethylarsonic acid,
methylarsonate, MMAV
124-58-3
Dimethylarsinic acid Dimethylarsinite, cacodylicacid, DMAV
75-60-5
Methylarsonous acid Monomethylarsonous acid,MMAIII
—
Dimethylarsinous acid DMAIII —Arsenobetaine AB 64436-13-1Arsenocholine AC 39895-81-3Trimethyl arsine oxide TMAO 4964-14-1Tetramethylarsonium ion TMA+ 27742-38-7Dimethylarsionylethanol DMAE —Trimethylarsoniopropionate TMAP —Dimethylarsionylribosides Oxo-arsenosugars —Dimethylmonothioarsinic acid DMMTAV —Dimethyldithioarsinic acid DMDTAV —
Note: Except for biochemical and toxicological studies of specific arsenic compounds, the valency ofMMA and DMA is usually not specified. The analysis of MMAIII and DMAIII has become possible onlyrecently. In this report, the terms MMA and DMA are used as cited in the original papers. WhereMMA and DMA are measured in foods, they have been measured as the pentavalent form. Wherebiological samples have been analysed, it is assumed that MMA and DMA refer to total [MMAIII +MMMV] and total [DMAIII + DMMV], respectively.
(arsenate) to trivalent arsenic (arsenite) followed by oxidative addition ofmethyl groups, although alternative pathways have also been proposed thatinclude methylated arsenical glutathione metabolites. Most ingested arsenicspecies are excreted via the kidney within a few days. Ingested inorganicarsenic is excreted as inorganic arsenate and arsenite and as the pentavalentmethylated metabolites MMAV and DMAV, with lesser amounts of the triva-lent methylated metabolites MMAIII, DMAIII and thioarsenical metabolites.Whereas it has previously been assumed that methylation of inorganic arsenicwas a detoxification route, it is not entirely clear whether or not this is correct,because, based on limited in vitro and in vivo data, MMAIII and DMAIII appearto be more toxic than inorganic arsenic and have high affinity for thiols andcellular proteins.
Major organic arsenicals present in fish when ingested undergo very littlebiotransformation and are excreted almost entirely unchanged. However,some organoarsenicals, such as arsenolipids present in cod liver and arseno-sugars in mussels and algae, can be metabolized to DMAV when ingested.
23
Toxicological data
Arsenic toxicity depends on the chemical form and its solubility and variesamong animal species and with route of administration. Generally, trivalentarsenic is more toxic than the pentavalent forms. Oral administration of in-organic arsenicals to laboratory animals has a number of effects, includingeffects on the cardiovascular, respiratory, gastrointestinal, haematological,immune, reproductive and nervous systems. MMAV administration to exper-imental animals has been shown to have effects on the gastrointestinal tract,kidney, thyroid and reproductive system, with the effect seen at the lowestdoses being diarrhoea. DMAV has effects on the urinary bladder, kidneys,thyroid and fetal development.
Studies in experimental animals conducted according to standard protocolshave generally not shown increased tumour incidences following chronic oralexposure to inorganic arsenic. However, evidence of tumour promotion andco-carcinogenicity has been reported. In addition, studies involving admin-istration of arsenite to pregnant mice in their drinking-water have shownevidence of transplacental carcinogenesis.
MMAV has not shown evidence of carcinogenicity in 2-year cancer bioassayswith doses equivalent to up to 100 mg/kg bw per day. DMAV (administeredin drinking-water at 50 mg/l) was carcinogenic in the urinary bladder of rats,but not mice. DMAV is not genotoxic, and its carcinogenic mode of action isconsidered to involve cytotoxicity to the bladder epithelium and sustainedincreased cell proliferation; the rat is considered to be particularly sensitiveto DMAV because of slower elimination and possibly a greater potential formetabolism to DMAIII compared with other species. The NOAEL was equiv-alent to 0.73 mg/kg bw per day.
In its most recent evaluation, IARC concluded that there is sufficient evidencefor carcinogenicity of inorganic arsenic compounds in experimental animalsand sufficient evidence for carcinogenicity of DMAV in experimental ani-mals. Evidence from a wide range of studies has led to the conclusion thatarsenic compounds do not react directly with DNA. There are a number ofproposed mechanisms of carcinogenicity of inorganic arsenic, including ox-idative damage, epigenetic effects and interference with DNA damage repair.
Because of a general lack of data on both exposure to and toxicity of organicarsenicals, the Committee further considered only inorganic arsenic for thisreport.
Taking into account the lack of a good animal model for carcinogenicity ofinorganic arsenic compounds and the large number of data available fromepidemiological studies, the Committee did not consider the data from ex-perimental animals appropriate for the dose–response analysis.
24
Observations in humans
The main adverse effects reported to be associated with long-term ingestionof inorganic arsenic by humans are cancer, skin lesions, developmental ef-fects, cardiovascular disease, neurotoxicity and diabetes.
The classification of arsenic as a carcinogen was originally based on evidenceof skin cancers. Studies in Taiwan, China, and other regions where high ex-posures to arsenic in drinking-water occurred have confirmed the relation-ship. Significant associations between exposure to high levels of ingestedarsenic in drinking-water and bladder cancer have been observed in ecolog-ical studies from Chile, Argentina and Taiwan, China, and cohort studies inTaiwan, China. Some of the studies showed an association only in smokers.In studies from Chile, Argentina and Taiwan, China, exposure to arsenic athigh concentrations in drinking-water has been shown to be associated withlung cancer. Again, when smokers and non-smokers were compared, the as-sociations were stronger in the smokers. Nutritional status of exposed popu-lations has been observed to influence cancer risk. Thus, compromisednutrition (e.g. low protein intake) is likely to be associated with significantlyhigher risk. The evidence for an association with cancers at other sites, in-cluding prostate, liver and kidney, is less conclusive.
Epidemiological studies in different regions of the world have consistentlydemonstrated a strong association between long-term inorganic arsenic in-gestion and skin lesions, typically in the form of hyperkeratosis, hyperpig-mentation or hypopigmentation. Observations of skin lesions following lowchronic exposure have suggested that these characteristic dermal changes aresensitive indications of the toxic effects of inorganic arsenic.
Available epidemiological studies indicate a positive relationship betweenhigh concentrations of inorganic arsenic in drinking-water and sensitive end-points for peripheral and central neurotoxicity. There is some evidence thatexposure of children to inorganic arsenic in areas with elevated arsenic con-centrations (>50 μg/l) in drinking-water produces effects on cognitive per-formance, but so far this is not conclusive.
The cardiovascular outcomes that have been associated with chronic expo-sure to arsenic through drinking-water include blackfoot disease (BFD),increased mortality or prevalence of coronary heart disease, peripheral arte-rial disease, myocardial infarction and stroke, and other cardiovascular end-points, such as increased blood pressure and prolonged QT interval of theelectrocardiogram. The association between BFD and inorganic arsenic ex-posure has been confirmed by many studies, but BFD has been reportedprimarily in an area along the south-western coast of Taiwan, China, wherearsenic contamination in well water is very high (170–880 μg/l). Except for
25
BFD, the reported associations between inorganic arsenic exposure and car-diovascular disease prevalence/mortality and other cardiovascular end-pointscurrently do not provide sufficient evidence of causality and are not consid-ered pivotal for the assessment.
Studies conducted in Bangladesh and Taiwan, China, indicated an extra riskof diabetes among high-exposure populations. In addition, recent findingssuggest that in utero arsenic exposure impaired child thymic developmentand that enhanced morbidity and immunosuppression might occur. However,as a result of limitations in the studies, the relationship between arsenic ex-posure and these outcomes remains uncertain.
The Committee concluded that the greatest strength of evidence for a causalassociation between inorganic arsenic and adverse effects in humans is forcancers of the skin, urinary bladder and lung and skin lesions (hyperkeratosis,hyperpigmentation and hypopigmentation) observed in studies in which lev-els of arsenic in drinking-water were relatively high (e.g. 100 μg/l). For thisevaluation, studies were preferred that included documentation of exposurefrom drinking-water both at higher concentrations (e.g. 300 μg/l) and alsoat relatively lower concentrations (e.g. <100 μg/l). This was in order to assesseffects across a broad gradient of exposure and to avoid extrapolation belowthe observed range in the dose–response modelling. For skin cancer, three ofthe four most recent studies of low-level exposure utilized toenail arsenic asa biomarker of exposure; however, the relationship between toenail arsenicand total dietary exposure to inorganic arsenic remains uncertain. Further, asarsenic-related skin lesions may be a possible precursor to skin cancer andhave been reported at lower concentrations of arsenic in drinking-water com-pared with skin cancer, the Committee considered the data for skin lesions tobe a more sensitive adverse effect than skin cancer. Thus, pivotal data wereidentified from epidemiological studies reporting a positive association witharsenic exposure and these effects (i.e. cancers of the lung and urinary tractand skin lesions).
Analytical methods
The most common detection techniques for arsenic are inductively coupledplasma mass spectrometry (ICP-MS), ICP–atomic emission spectroscopy(ICP-AES) and hydride generation coupled with atomic absorption spec-troscopy (HG-AAS) or atomic fluorescence spectroscopy (HG-AFS). ICP-AES is generally adequate for determination of total arsenic in foods, and itssensitivity can be improved by coupling to HG. ICP-MS has the highest sen-sitivity without derivatization. HG-AAS and HG-AFS have limits of detec-tion (LODs) in the microgram per kilogram range, which is adequate for allfoods. For speciation with HG-based detection systems, some organoarsenicspecies require oxidation to species that form volatile arsines prior to theirdetection.
26
Samples prepared for total arsenic determination are mineralized by eitherwet or dry methods. Microwave is the most common closed system used inwet mineralization, although temperatures higher than those that can beachieved by microwave are needed for the complete degradation of someorganoarsenic species. This leads to an underestimation of total arsenic insome foods when HG-based detection systems are used. Recent develop-ments, such as microwave-induced combustion methods, are solving thisproblem. In dry mineralization, addition of ashing aids is necessary to avoidarsenic losses by volatilization.
Methodological research in the last decade has been targeted to arsenic spe-ciation. Quantitative extraction of arsenic species from food matrices is oneof the main methodological problems, and efficiencies vary widely, depend-ing on the nature of the matrix and the method used. Polar solvents assistedby ultrasound, accelerated solvent extraction or microwave are commonlyused. Extraction of arsenite is especially difficult to achieve, because of bind-ing to thiol groups in proteins. Separation of arsenic species is most com-monly achieved by high-performance liquid chromatography (HPLC).Multidimensional chromatography (different columns and conditions) maybe needed for samples with a large number of arsenic species; up to 23 specieshave been found in seaweed and seafood, for example. Further difficultiesare that the elution may not be quantitative under certain conditions, and theeluent may change the arsenic oxidation state.
Most of the current work on arsenic speciation has been targeted to charac-terization of arsenic species profiles in food products, without special atten-tion to inorganic arsenic. There is a current need for validated and horizontalmethods for selective extraction and determination of inorganic arsenic andfor certified reference materials for inorganic arsenic in foods. Further, itwould be more appropriate to report total inorganic arsenic rather than ar-senite and arsenate, because various extraction/analytical procedures maychange the oxidation state.
Effects of processing
Peeling of vegetables and polishing of rice reduce the content of total arsenic.Washing or soaking rice and seaweed and discarding the water before cookingreduce arsenic levels, especially inorganic forms. Decreases in arsenic levelswith boiling have been described for rice, pasta, seaweed and seafood prod-ucts, except where the water used is contaminated with arsenic, when levelsmay increase. The main arsenic species solubilized are AB, DMA andarsenosugars for seafood products and inorganic arsenic for cereals and sea-weed. Limited studies in which seafood was heated at temperatures above150 °C have reported that up to 11% of AB is transformed to TMAO andTMA+.
27
Prevention and control
Commercial-scale water treatment processes to remove arsenic in water areavailable. Simple arsenic removal systems for household wells have also beendeveloped. Low-cost systems in arsenic-endemic areas generally utilize ele-mental iron, iron or aluminium oxides and carbon as adsorbents for arsenic.Many household treatment systems fail prematurely because of high levelsof phosphate in water, and maintenance and disposal of arsenic-contaminatedwastes are difficult. Studies in Bangladesh have shown that most rural house-holds prefer sharing uncontaminated wells or filtering low-arsenic surfacewater through sand to treating groundwater. Sand filtration gives mixed re-sults with respect to removal of biological pathogens. Spatial variability ingroundwater arsenic contamination in Argentina, Chile and the river deltasof South and South-east Asia is very high, so villages usually have a mixtureof contaminated and uncontaminated wells. Deeper groundwater aquifers of-ten have low arsenic levels that can be used to develop community watersupplies.
Apart from processing possibilities, practical prevention and control ap-proaches for arsenic in foods are limited. Attempts to reduce arsenic uptakeinto food crops by additions of phosphate fertilizer and iron oxides have givenequivocal and unconvincing results with several vegetable and cereal crops.Silicate additions to soil have been shown to reduce arsenic levels in rice grainwhere soils are low in silicate. Growing rice under less reducing soil condi-tions can dramatically reduce grain arsenic levels. However, the challenge isto do this without substantial loss of yields in uncontaminated soils. Verylimited identification of “low” and “high” arsenic rice varieties has been re-ported, and more data are needed before recommendations can be made tofarmers and consumers.
Levels and patterns of contamination in food commodities
Data on total arsenic contents of foods for evaluation at the present meetingwere obtained from the literature and from data submitted to the Committeeby Australia, Brazil, France, Japan, New Zealand and Singapore. The totalnumber of analytical results (single or composite) evaluated at the presentmeeting was 17 498. Table 5 summarizes the ranges of total arsenic concen-trations by food category, based on results with quantified values (minimumto maximum). The highest total arsenic concentrations have been found inseaweed, fish and shellfish, mushrooms and fungi, rice and rice products andsome meat products. The levels in the remaining food products usually donot exceed 1 mg/kg. In some food groups, the number of non-detectable/non-quantifiable results was important (n = 9081) and influences the derivationof mean concentrations; this was the case with milk products (66%), meatand meat products (74%), eggs and egg products (65%), bakery wares (70%),cereals other than rice (80%) and vegetables other than mushrooms (86%).
28
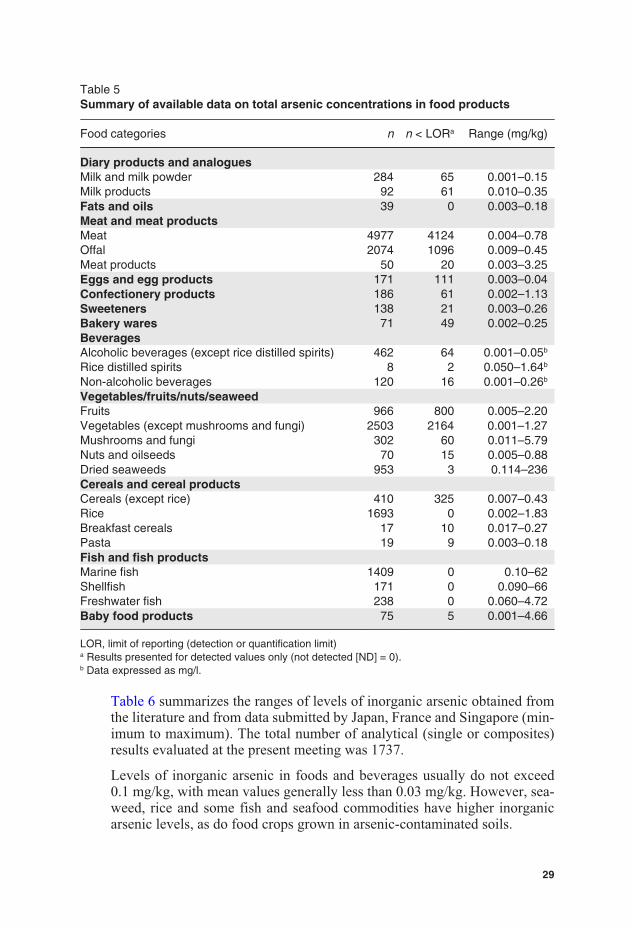
Table 5Summary of available data on total arsenic concentrations in food products
Food categories n n < LORa Range (mg/kg)
Diary products and analoguesMilk and milk powder 284 65 0.001–0.15Milk products 92 61 0.010–0.35Fats and oils 39 0 0.003–0.18Meat and meat productsMeat 4977 4124 0.004–0.78Offal 2074 1096 0.009–0.45Meat products 50 20 0.003–3.25Eggs and egg products 171 111 0.003–0.04Confectionery products 186 61 0.002–1.13Sweeteners 138 21 0.003–0.26Bakery wares 71 49 0.002–0.25BeveragesAlcoholic beverages (except rice distilled spirits) 462 64 0.001–0.05b
Rice distilled spirits 8 2 0.050–1.64b
Non-alcoholic beverages 120 16 0.001–0.26b
Vegetables/fruits/nuts/seaweedFruits 966 800 0.005–2.20Vegetables (except mushrooms and fungi) 2503 2164 0.001–1.27Mushrooms and fungi 302 60 0.011–5.79Nuts and oilseeds 70 15 0.005–0.88Dried seaweeds 953 3 0.114–236Cereals and cereal productsCereals (except rice) 410 325 0.007–0.43Rice 1693 0 0.002–1.83Breakfast cereals 17 10 0.017–0.27Pasta 19 9 0.003–0.18Fish and fish productsMarine fish 1409 0 0.10–62Shellfish 171 0 0.090–66Freshwater fish 238 0 0.060–4.72Baby food products 75 5 0.001–4.66
LOR, limit of reporting (detection or quantification limit)a Results presented for detected values only (not detected [ND] = 0).b Data expressed as mg/l.
Table 6 summarizes the ranges of levels of inorganic arsenic obtained fromthe literature and from data submitted by Japan, France and Singapore (min-imum to maximum). The total number of analytical (single or composites)results evaluated at the present meeting was 1737.
Levels of inorganic arsenic in foods and beverages usually do not exceed0.1 mg/kg, with mean values generally less than 0.03 mg/kg. However, sea-weed, rice and some fish and seafood commodities have higher inorganicarsenic levels, as do food crops grown in arsenic-contaminated soils.
29
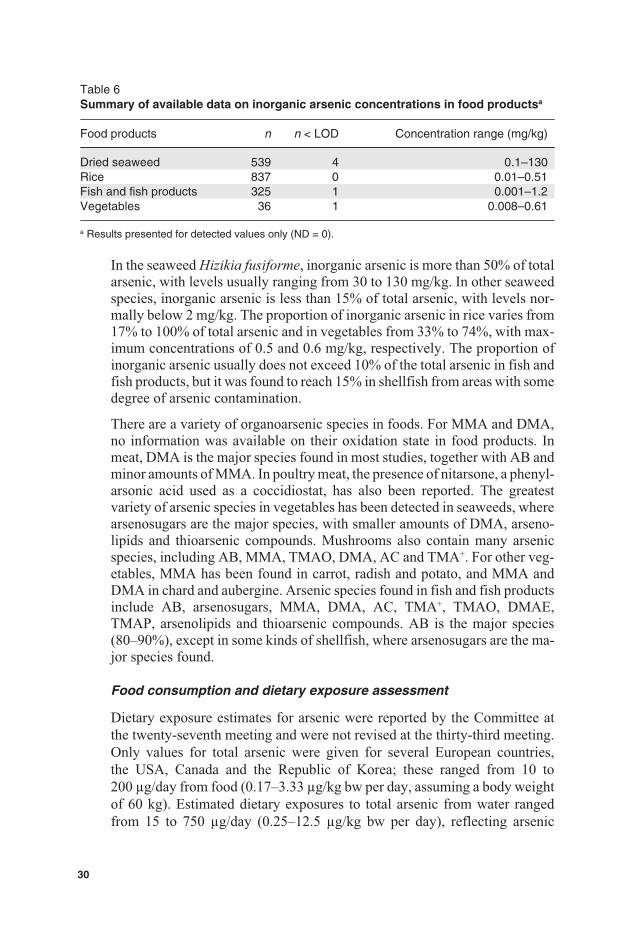
Table 6Summary of available data on inorganic arsenic concentrations in food productsa
Food products n n < LOD Concentration range (mg/kg)
Dried seaweed 539 4 0.1–130Rice 837 0 0.01–0.51Fish and fish products 325 1 0.001–1.2Vegetables 36 1 0.008–0.61
a Results presented for detected values only (ND = 0).
In the seaweed Hizikia fusiforme, inorganic arsenic is more than 50% of totalarsenic, with levels usually ranging from 30 to 130 mg/kg. In other seaweedspecies, inorganic arsenic is less than 15% of total arsenic, with levels nor-mally below 2 mg/kg. The proportion of inorganic arsenic in rice varies from17% to 100% of total arsenic and in vegetables from 33% to 74%, with max-imum concentrations of 0.5 and 0.6 mg/kg, respectively. The proportion ofinorganic arsenic usually does not exceed 10% of the total arsenic in fish andfish products, but it was found to reach 15% in shellfish from areas with somedegree of arsenic contamination.
There are a variety of organoarsenic species in foods. For MMA and DMA,no information was available on their oxidation state in food products. Inmeat, DMA is the major species found in most studies, together with AB andminor amounts of MMA. In poultry meat, the presence of nitarsone, a phenyl-arsonic acid used as a coccidiostat, has also been reported. The greatestvariety of arsenic species in vegetables has been detected in seaweeds, wherearsenosugars are the major species, with smaller amounts of DMA, arseno-lipids and thioarsenic compounds. Mushrooms also contain many arsenicspecies, including AB, MMA, TMAO, DMA, AC and TMA+. For other veg-etables, MMA has been found in carrot, radish and potato, and MMA andDMA in chard and aubergine. Arsenic species found in fish and fish productsinclude AB, arsenosugars, MMA, DMA, AC, TMA+, TMAO, DMAE,TMAP, arsenolipids and thioarsenic compounds. AB is the major species(80–90%), except in some kinds of shellfish, where arsenosugars are the ma-jor species found.
Food consumption and dietary exposure assessment
Dietary exposure estimates for arsenic were reported by the Committee atthe twenty-seventh meeting and were not revised at the thirty-third meeting.Only values for total arsenic were given for several European countries,the USA, Canada and the Republic of Korea; these ranged from 10 to200 μg/day from food (0.17–3.33 μg/kg bw per day, assuming a body weightof 60 kg). Estimated dietary exposures to total arsenic from water rangedfrom 15 to 750 μg/day (0.25–12.5 μg/kg bw per day), reflecting arsenic
30
concentrations in water of 10 μg/l and 500 μg/l and assuming a consumptionof 1.5 litres of water per day. The Committee at the twenty-seventh meetingnoted that water and seafood were the major sources of total arsenic, withother foods making minor contributions.
The focus of the Committee at the present meeting was on dietary exposureto inorganic arsenic; however, the majority of dietary exposure estimatessubmitted for evaluation were for total arsenic. The main factors influencingdietary exposure to inorganic arsenic are the water supply, type of food con-sumed and food preparation methods.
Where water is contaminated with arsenic, it is one of the most significantsources of inorganic arsenic exposure. It is also a major source of inorganicarsenic in food produced by irrigation with arsenic-contaminated water andfrom food preparation and cooking. Rice takes up high amounts of arsenic,but speciation of arsenic in rice varies between different regions, with a higherinorganic content in rice grown in Asia compared with the USA. Rice tendsto be a major source of inorganic arsenic from food, particularly in Asia andother countries where it is a staple food. The level of inorganic arsenic in therice consumed also varies, depending on food processing and preparationmethods.
Arsenic contamination of groundwater is widespread, and there are a numberof regions where arsenic contamination of drinking-water is important. Areasaffected include southern Asia (e.g. Bangladesh, India), South-east and EastAsia (e.g. China, including Taiwan, Mongolia, Viet Nam), the Americas (e.g.Argentina, Canada, Chile, Mexico, USA) and Europe (e.g. Finland, Hungary,Romania). Exposure to inorganic arsenic from water can be very variable,with high and low arsenic sources present in close proximity. Contaminatedwater that is used for drinking and food preparation would normally containarsenic at concentrations between 10 and 200 μg/l. However, concentrationsabove 200 μg/l have been reported in some areas. The amount of water con-sumed also varies according to the region, temperature, physical activity andtypes of food, with soups and rice being examples of foods that will eithercontain high quantities of water or take up large quantities of water. This canresult in a total water consumption of between 1.5 and 5 litres per day.
The fact that water consumption and water used in cooking are not alwaysincluded in dietary exposure estimates also makes direct comparison of re-ported total and inorganic arsenic dietary exposures found in different studiesdifficult, as exposure will be underestimated where water has not been in-cluded. In estimating dietary exposure to inorganic arsenic, variations in thedifferent species of arsenic within a food category and between food cate-gories need to be considered.
31
A summary of reported national inorganic arsenic estimates is given in Table7, with ranges taken from various studies for some countries. It is particularlydifficult to predict dietary exposures to arsenic at a regional level due to thecomplex factors discussed above that influence exposure at a local level. In-ternational estimates using the 13 GEMS/Food consumption cluster dietswere not generated, as the Committee considered that this level of general-ization was not appropriate for estimating dietary exposures to inorganicarsenic.
In most circumstances, it would be expected that estimates of dietary expo-sure to inorganic arsenic using individual dietary records would be moreaccurate than those obtained using population food consumption figures, suchas normally used in TDSs or model diets. However, it is not possible to assumethis is the case; for example, the EFSA estimates for European countries usedindividual records but assigned inorganic arsenic values derived from con-version factors applied to total arsenic levels for broad food groups, intro-ducing uncertainties in the estimates and tending to overestimate dietaryexposure compared with individual country studies in the region.
In general, the ranges of dietary exposure to inorganic arsenic for NorthAmerica and Europe were similar but were lower than those reported forcountries in Asia. An exception was Bangladesh, for which mean dietaryexposure to inorganic arsenic was estimated to be up to 3 times that in otherAsian countries. Mean dietary exposure to inorganic arsenic for adults in acommunity in Chile was 7 times higher at the upper end of the reported rangethan that reported for adults elsewhere.
For infants and children, a limited amount of information was available forEurope and the USA; in general, estimates of dietary exposure to inorganicarsenic for children were higher than those for adults from the same popula-tion when expressed per kilogram of body weight.
With the exception of dietary exposure estimates for inorganic arsenic forBangladesh and Chile, mean reported dietary exposures for adults or wholepopulations were less than 1 μg/kg bw per day, and upper-percentile dietaryexposures were less than 1.5 μg/kg bw per day. For infants and children, meandietary exposure estimates for inorganic arsenic were less than 2 μg/kg bwper day, and upper-percentile estimates were less than 3 μg/kg bw per day.The mean dietary exposures of up to 3 μg/kg bw per day for Bangladesh werefor a small community known to have contaminated water; the results fromthe study in Chile would need to be confirmed.
For countries where rice is the staple food, rice and water were the majorcontributors to total inorganic arsenic dietary exposures, with wheatand vegetables being minor contributors. In Europe and North America, where
32
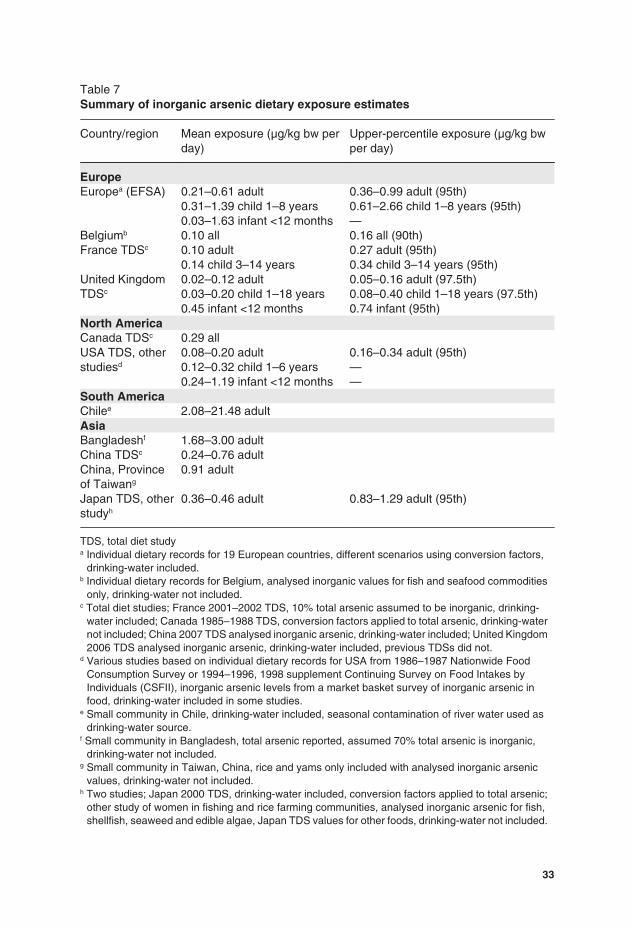
Table 7Summary of inorganic arsenic dietary exposure estimates
Country/region Mean exposure (μg/kg bw perday)
Upper-percentile exposure (μg/kg bwper day)
EuropeEuropea (EFSA) 0.21–0.61 adult
0.31–1.39 child 1–8 years0.03–1.63 infant <12 months
0.36–0.99 adult (95th)0.61–2.66 child 1–8 years (95th)—
Belgiumb 0.10 all 0.16 all (90th)France TDSc 0.10 adult
0.14 child 3–14 years0.27 adult (95th)0.34 child 3–14 years (95th)
United KingdomTDSc
0.02–0.12 adult0.03–0.20 child 1–18 years0.45 infant <12 months
0.05–0.16 adult (97.5th)0.08–0.40 child 1–18 years (97.5th)0.74 infant (95th)
North AmericaCanada TDSc 0.29 allUSA TDS, otherstudiesd
0.08–0.20 adult0.12–0.32 child 1–6 years0.24–1.19 infant <12 months
0.16–0.34 adult (95th)——
South AmericaChilee 2.08–21.48 adultAsiaBangladeshf 1.68–3.00 adultChina TDSc 0.24–0.76 adultChina, Provinceof Taiwang
0.91 adult
Japan TDS, otherstudyh
0.36–0.46 adult 0.83–1.29 adult (95th)
TDS, total diet studya Individual dietary records for 19 European countries, different scenarios using conversion factors,
drinking-water included.b Individual dietary records for Belgium, analysed inorganic values for fish and seafood commodities
only, drinking-water not included.c Total diet studies; France 2001–2002 TDS, 10% total arsenic assumed to be inorganic, drinking-
water included; Canada 1985–1988 TDS, conversion factors applied to total arsenic, drinking-waternot included; China 2007 TDS analysed inorganic arsenic, drinking-water included; United Kingdom2006 TDS analysed inorganic arsenic, drinking-water included, previous TDSs did not.
d Various studies based on individual dietary records for USA from 1986–1987 Nationwide FoodConsumption Survey or 1994–1996, 1998 supplement Continuing Survey on Food Intakes byIndividuals (CSFII), inorganic arsenic levels from a market basket survey of inorganic arsenic infood, drinking-water included in some studies.
e Small community in Chile, drinking-water included, seasonal contamination of river water used asdrinking-water source.
f Small community in Bangladesh, total arsenic reported, assumed 70% total arsenic is inorganic,drinking-water not included.
g Small community in Taiwan, China, rice and yams only included with analysed inorganic arsenicvalues, drinking-water not included.
h Two studies; Japan 2000 TDS, drinking-water included, conversion factors applied to total arsenic;other study of women in fishing and rice farming communities, analysed inorganic arsenic for fish,shellfish, seaweed and edible algae, Japan TDS values for other foods, drinking-water not included.
33
wheat-based products and potatoes are staple foods, these were major con-tributors to inorganic arsenic dietary exposure, as well as other vegetables,milk and meat and their products. Water can contribute up to 50% of totaldietary exposure in areas in these regions where the water is not contaminated.Although total arsenic levels are higher in fish and shellfish than in otherfoods, consumption of fish and shellfish does not have a major influence ondietary exposure to inorganic arsenic, as the majority of arsenic in fish andin the edible portion of shellfish is organic. The exception to this is for pop-ulations (e.g. Japan) or individuals in other populations who consume highamounts of seaweed and other edible algae, some species of which are veryhigh in inorganic arsenic and consumption of which can make a significantcontribution to inorganic arsenic dietary exposure. No studies included di-etary supplements, although some of these may contain appreciable amountsof inorganic arsenic, which may also mean that dietary exposures to inorganicarsenic are underestimated for individuals taking these supplements on aregular basis.
Dose–response analysis
The following studies were selected for dose–response modelling of the re-spective end-points. For lung cancer, data were from a recent prospectivestudy in north-eastern Taiwan, China, of 6888 residents for whom arsenicconcentrations in drinking-water had been ascertained, with an average 11.5years of follow-up. Residents 40 years of age and older at study initiationwith 178 incident lung cancer cases identified (4) were used for modelling.An earlier case–control study of lung cancer was not preferred for modellingdue to potential selection bias in hospital-based controls. For urinary tractcancer, data from the same prospective study in north-eastern Taiwan, China,with 45 incident cases of urinary tract cancer (5) were used for dose–responsemodelling. Three arsenic-related skin lesion case–control studies were con-sidered: two conducted in Bangladesh and one conducted in Inner Mongolia,China. Substantial differences exist among the studies in factors such as casedefinition, exposure assessment methods and assessment of possible con-founders, including smoking and sun exposure. Considering these differ-ences, these studies were not used for the evaluation.
The exposure metric in these studies was concentration of arsenic in drinking-water; total dietary exposure to inorganic arsenic from food and water wasnot assessed. In order to provide an opinion on the risks to health related tothe presence of inorganic arsenic in foodstuffs, it was necessary to convertfrom the arsenic concentrations in drinking-water to total dietary exposure toinorganic arsenic. This conversion required assumptions about the arsenicexposure from food before cooking and the volumes of drinking-water con-sumed directly and in cooking for the populations in which the respective
34
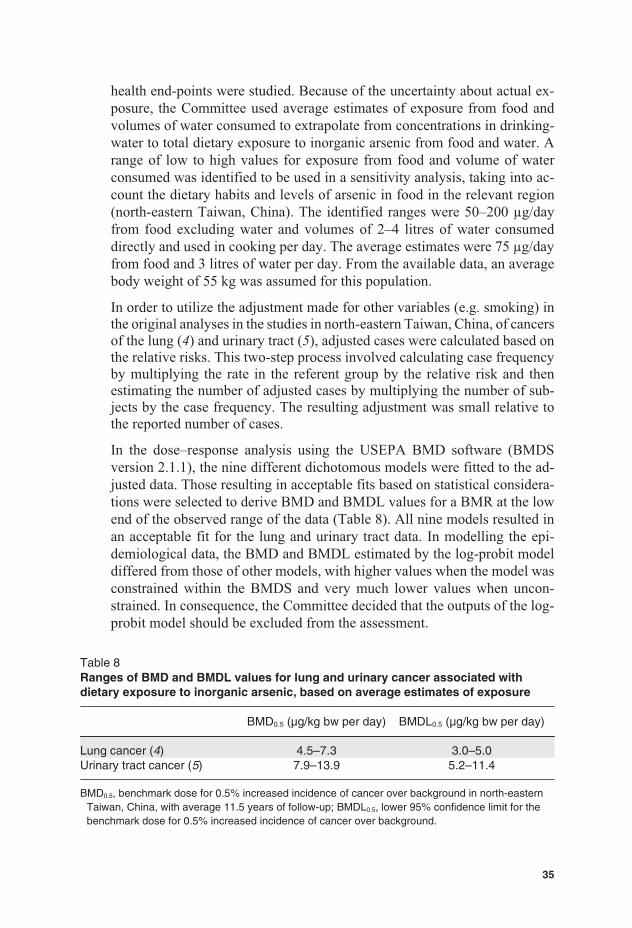
health end-points were studied. Because of the uncertainty about actual ex-posure, the Committee used average estimates of exposure from food andvolumes of water consumed to extrapolate from concentrations in drinking-water to total dietary exposure to inorganic arsenic from food and water. Arange of low to high values for exposure from food and volume of waterconsumed was identified to be used in a sensitivity analysis, taking into ac-count the dietary habits and levels of arsenic in food in the relevant region(north-eastern Taiwan, China). The identified ranges were 50–200 μg/dayfrom food excluding water and volumes of 2–4 litres of water consumeddirectly and used in cooking per day. The average estimates were 75 μg/dayfrom food and 3 litres of water per day. From the available data, an averagebody weight of 55 kg was assumed for this population.
In order to utilize the adjustment made for other variables (e.g. smoking) inthe original analyses in the studies in north-eastern Taiwan, China, of cancersof the lung (4) and urinary tract (5), adjusted cases were calculated based onthe relative risks. This two-step process involved calculating case frequencyby multiplying the rate in the referent group by the relative risk and thenestimating the number of adjusted cases by multiplying the number of sub-jects by the case frequency. The resulting adjustment was small relative tothe reported number of cases.
In the dose–response analysis using the USEPA BMD software (BMDSversion 2.1.1), the nine different dichotomous models were fitted to the ad-justed data. Those resulting in acceptable fits based on statistical considera-tions were selected to derive BMD and BMDL values for a BMR at the lowend of the observed range of the data (Table 8). All nine models resulted inan acceptable fit for the lung and urinary tract data. In modelling the epi-demiological data, the BMD and BMDL estimated by the log-probit modeldiffered from those of other models, with higher values when the model wasconstrained within the BMDS and very much lower values when uncon-strained. In consequence, the Committee decided that the outputs of the log-probit model should be excluded from the assessment.
Table 8Ranges of BMD and BMDL values for lung and urinary cancer associated withdietary exposure to inorganic arsenic, based on average estimates of exposure
BMD0.5 (μg/kg bw per day) BMDL0.5 (μg/kg bw per day)
Lung cancer (4) 4.5–7.3 3.0–5.0Urinary tract cancer (5) 7.9–13.9 5.2–11.4
BMD0.5, benchmark dose for 0.5% increased incidence of cancer over background in north-easternTaiwan, China, with average 11.5 years of follow-up; BMDL0.5, lower 95% confidence limit for thebenchmark dose for 0.5% increased incidence of cancer over background.
35
The lowest calculated BMDL was 3.0 μg/kg bw per day for a 0.5% increasedincidence of lung cancer above background over the average 11.5 years offollow-up, based on average estimates of the exposure. A sensitivity analysisto investigate the impact of uncertainty in the exposure estimate in this studyindicated that this BMDL0.5 could be in the range of 2.0–7.0 μg/kg bw perday, with the assumption made with respect to volume of drinking-waterconsumed and used in cooking having a greater impact than the assumptionregarding inorganic arsenic in food.
Evaluation
From epidemiological studies measuring arsenic levels in drinking-water,inorganic arsenic has been identified as a human carcinogen. It is presentnaturally in food and water because of geochemical conditions, and conse-quently exposure varies significantly in different regions and even withinregions, primarily through the presence or absence of arsenic in groundwatersources for drinking-water.
The approach to quantitative assessment of cancer risk from inorganic arsenicis limited, inter alia, by the lack of information on total exposure in the avail-able epidemiological studies. The inorganic arsenic BMDL for a 0.5%increased incidence of lung cancer was determined by using a range of as-sumptions to estimate exposure from drinking-water and food with differingconcentrations of inorganic arsenic. The BMDL0.5 was computed to be3.0 μg/kg bw per day (2.0–7.0 μg/kg bw per day based on the range of esti-mated total dietary exposure). The uncertainties in this BMDL0.5 relate to theassumptions regarding total exposure and to extrapolation of the BMDL0.5 toother populations due to the influence of nutritional status, such as low proteinintake, and other lifestyle factors on the effects observed in the studiedpopulation. The Committee noted that the PTWI of 15 μg/kg bw (2.1 μg/kgbw per day) is in the region of the BMDL0.5 and therefore was no longerappropriate, and the Committee withdrew the previous PTWI.
The Committee noted that more accurate information on the inorganic arseniccontent of foods as they are consumed is needed to improve assessments ofdietary exposures to inorganic arsenic species. Analytical constraints toachieving this goal include the lack of validated methods for selective deter-mination of inorganic arsenic species in food matrices and the lack of certifiedreference materials for inorganic arsenic in foods. The proportion of inorganicarsenic in some foods was found to vary widely, indicating that dietary ex-posures to inorganic arsenic should be based on actual data rather than usinggeneralized conversion factors from total arsenic measurements.
Reported mean dietary exposure to inorganic arsenic in the USA and variousEuropean and Asian countries ranged from 0.1 to 3.0 μg/kg bw per day.
36
Drinking-water was a major contributor to total inorganic arsenic dietary ex-posures and, depending on the concentration, can also be an important sourceof arsenic in food through food preparation and possibly irrigation of crops,particularly rice. The proportion of total exposure to inorganic arsenic arisingfrom food relative to the proportion from water increases as the concentrationof inorganic arsenic in the water decreases. At the lower end of the exposurerange, food can also be a major contributor to total inorganic arsenic exposure.
For certain regions of the world where concentrations of inorganic arsenic indrinking-water exceed 50–100 μg/l, some epidemiological studies provideevidence of adverse effects. There are other areas where arsenic concentra-tions in water are elevated (e.g. above the WHO guideline value of 10 μg/l)but are less than 50 μg/l. In these circumstances, there is a possibility thatadverse effects could occur as a result of exposure to inorganic arsenic fromwater and food, but these would be at a low incidence that would be difficultto detect in epidemiological studies.
A detailed addendum to the monograph was prepared.
Recommendations
There is a need for validated methods for selective extraction and determi-nation of inorganic arsenic in food matrices and for certified referencematerials for inorganic arsenic.
There is a need for improved data on occurrence of different species of arsenicin, and their bioavailability from, different foods as consumed in order toimprove the estimates of dietary and systemic exposure. Further informationon the toxicity of arsenic species found in food is also required.
The Committee recommended that future epidemiological studies of thehealth impacts of arsenic should incorporate appropriate measures of totalexposure to inorganic arsenic, including from food and from water used incooking and processing of food.
Further, it is recommended that epidemiological studies not only focus onrelative risks, but also analyse and report the data such that they are suitablefor estimating exposure levels associated with additional (lifetime) risks, soas to make their results usable for quantitative risk assessment.
3.3 Deoxynivalenol
Explanation
Deoxynivalenol (12,13-epoxy-3,4,15-trihydroxy-trichothec-9-en-8-one;DON, also known as vomitoxin; CAS No. 51481-10-8) is a type B tri-chothecene mycotoxin produced mainly in cereals by various Fusarium
37
species. In addition to DON, 3-acetyl-deoxynivalenol (3-Ac-DON; CAS No.50722-38-8) and 15-acetyl-deoxynivalenol (15-Ac-DON; CAS No.88337-96-6) are also naturally occurring fungal secondary metabolites,whereas DON-3-glucoside is a naturally occurring conjugate of DON formedin plants.
DON was previously evaluated by the fifty-sixth meeting of the Committee(Annex 1, reference 152). The Committee established a provisional maxi-mum tolerable daily intake (PMTDI) of 1 μg/kg bw on the basis of the no-observed-effect level (NOEL)1 of 100 μg/kg bw per day for decreased bodyweight gain reported in a 2-year feeding study in mice and application of asafety factor of 100. The Committee concluded that intake at this level wouldnot result in effects of DON on the immune system, growth or reproduction.The Committee noted that the available data did not suggest that DONpresents a carcinogenic hazard.
DON was on the agenda of the present meeting at the request of the SecondSession of CCCF (6), which asked the Committee to assess exposure on amore global basis, taking new data into account; to review the toxicologicaldata and consider the need for an acute reference dose (ARfD), taking intoaccount data in finished products, but also in raw wheat and other commodi-ties as they are traded internationally, and consideration of processing factors;and to assess the toxicity of 3-Ac-DON and 15-Ac-DON.
The Committee reviewed several new studies on metabolism and toxicoki-netics, acute toxicity, genotoxicity, mechanisms of toxicity and developmen-tal toxicity of DON, including its acetyl derivatives. The Committee alsotook note of the data previously evaluated at the fifty-sixth meeting. Emphasiswas given to studies in which pure DON or acetylated DON was added todefined diets in mammalian species, because naturally contaminated feedcommonly contains multiple mycotoxin contaminants. Also, new informa-tion on occurrence, processing, prevention and control, and dietary exposurewas considered.
Absorption, distribution, metabolism and excretion
The additional studies on metabolism in mice, rats and pigs confirmed thatDON and its acetyl derivatives are rapidly and extensively absorbed from theupper gastrointestinal tract and cleared with a short plasma half-life. Afterabsorption of 3-Ac-DON, DON was the principal metabolite observed inplasma, and acetylated DON was not detected, indicating that deacetylationis an extensive and rapid metabolic process. De-epoxidation of DON is amicrobial pathway that occurs in the lower gut and does not appear to be asignificant route of detoxification in the pig and other monogastric animals.
1 At the sixty-eighth meeting of the Committee (Annex 1, reference 187), JECFA decided todifferentiate between NOAEL and NOEL. This NOEL would now be considered a NOAEL.
38
The Committee noted that the new studies on absorption, distribution,metabolism and excretion (ADME) addressed the request made at the fifty-sixth meeting for data from comparative studies on toxicokinetics.
Toxicological data
As concluded at the previous meeting, emesis is the most sensitive functionalmanifestation of acute toxicity in the pig, dog and cat after either oral orparenteral administration. This is a systemic effect and is believed to arisefrom increased central serotonergic activity. The lowest doses that did notinduce emesis in the pig were 0.025 mg/kg bw by gavage and 0.25 mg/kg bwby exposure via the diet. The Committee took note of the fact that much higherdoses were tolerated when DON was given in the diet than by gavage.
New toxicological studies in mice, rats and pigs have provided insights intothe mode of action of DON in causing reduced weight gain, which was thebasis for the PMTDI established at the fifth-sixth meeting, and into its im-munological and related effects in single-dose and repeated-dose studies.These studies indicated that the effects were largely due to the induction ofsuppressors of cytokine signalling and to effects on the pituitary growth hor-mone axis. Changes in these parameters are observable very soon after acutedosing in vivo and are rapidly reversible in parallel with the decline in DONconcentrations in plasma. At the levels likely to be encountered in the diet(described below), sustained exposure would be necessary to cause functionaleffects on growth or the immune system.
At its previous evaluation, the Committee concluded that DON is not muta-genic in bacteria but gave rise to chromosomal aberrations both in vitro andin vivo, but their overall significance remained equivocal. The limited newinformation regarding the potential genotoxicity of DON did not alter theCommittee’s previous conclusion.
Despite the request from the fifty-sixth meeting of the Committee, no newlong-term study in a species other than mouse has become available, and thesupport for the lack of carcinogenic potential in humans remains dependenton a single mouse study.
One study on reproductive toxicity in rats became available, from which aNOAEL of 1 mg/kg bw per day was derived for reduced epididymal andseminal vesicle weights in rats, as well as increased sperm swimming speed.An additional developmental toxicity study in rats was available in which theNOAELs were 0.5 mg/kg bw per day for maternal toxicity, 1 mg/kg bw perday for fetal toxicity and 2.5 mg/kg bw per day for teratogenicity.
Results from studies on immunotoxicity in mice and pigs showed that lowdoses of DON increase immunoglobulin A (IgA) levels in the blood. TheCommittee noted, however, that there were insufficient data with which to
39
establish a threshold for IgA nephropathy. Most mechanistic studies on im-munological end-points in mice and pigs were unsuitable for deriving aNOAEL, but in one study, an acute NOEL of 0.1 mg/kg bw was derived basedon suppression of hepatic mRNA for insulin-like growth factor acid-labilesubunit. However, the toxicological significance of this finding is unknown.
The Committee considered the toxicity data on derivatives of DON. A fewnew studies have been published on the toxicity of acetylated DON, and thesewere considered together with the derivative studies in the previous evalua-tion. Given the results from the ADME studies, the toxicity of the acetylatedDON compounds is likely to arise from conversion to DON. In vitro cyto-toxicity and immunotoxicity studies of the relative potencies of DON and itsacetylated derivatives are not considered to provide a reliable indication ofrelative potency in vivo, as they generally do not take account of this con-version. Median lethal dose (LD50) studies indicated their toxicity in mouseto be similar to that of DON. The acetylated DON compounds were thereforeconsidered to be as toxic as DON.
No toxicological studies were found on DON-3-glucoside, a fungal metabo-lite recently detected in wheat and beer. The Committee considered it possiblethat this compound would be hydrolysed in the body and the DON wouldbecome bioavailable, but noted that ADME studies would be necessary toconfirm this.
Observations in humans
No new epidemiological studies were found. With respect to possibilities forderivation of a NOAEL from outbreaks of mycotoxicosis in humans, recentstudies indicate that urinary biomarkers may be used for assessing humanexposure to DON. As DON can be formed from its acetylated derivatives,the Committee considered that these biomarkers could provide an indicationof total dietary exposure to DON and its derivatives. Using the limited in-formation on outbreaks from epidemiological studies summarized for theprevious evaluation, the Committee noted that the calculated level that wasnot likely to elicit acute intoxication in humans was around 50 μg/kg bw.
Analytical methods
The Committee reviewed the range of screening and quantitative methodsavailable for the determination of DON in various foods after the fifty-sixthmeeting and noted that a number of advances have been made in the analysisof both DON and its derivatives and that certified standard solutions for DON,3-Ac-DON and 15-Ac-DON have been made available.
40
Immunoassays for screening purposes for DON have been further developedand, in some instances, commercialized. These methods include lateral flowdevices, fluorescence polarization and direct fluorometry after extractcleanup and derivatization. New antibodies continue to be developed. Pos-sible cross-reactivity between DON and its derivatives in enzyme-linkedimmunosorbent assays (ELISA) has been demonstrated in comparative stud-ies and possibly accounts for the previously noted higher levels of naturallyoccurring DON determined by ELISA as opposed to chromatographic meth-ods. Commercialized screening methods are usually developed with LODstargeted to meet legislative or other requirements.
Major advances have been made in DON determination by HPLC in whichanalytical methods using ultraviolet (UV) detection for DON in cereals (oatflour, wheat flour and rice flour), cereal products (polenta and wheat-basedbreakfast cereals), soft wheat and baby food have been validated by interna-tional collaborative studies. These methods, using either immunoaffinitycolumn or multifunctional column cleanup, have been validated down to60 μg/kg for baby foods and to 100 μg/kg for all other products. The appli-cation of HPLC coupled to MS has enabled multi-mycotoxin analysis to beundertaken. The major problem of LC-MS and LC-MS/MS—namely, matrixeffects in which signal enhancement or suppression occurs—is generallyovercome by the use of isotope-labelled internal standards or matrix-matchedstandard solutions. These methods can be used for a limited range of myco-toxins for which a common cleanup, such as by multi-mycotoxin im-munoaffinity column, is available; alternatively, a more diverse analysis canbe performed by an injection of an aliquot of diluted sample extract withoutprior cleanup.
Based on current knowledge, the main derivatives of DON that might con-tribute to exposure are 3-Ac-DON, 15-Ac-DON and DON-3-glucoside. Theanalysis of these compounds requires chromatographic separation. They canbe determined simultaneously with DON by LC-MS/MS. Alternatively, theacetyl derivatives have been determined by GC after suitable derivatization.
Sampling protocols
Owing to the lack of homogeneity in the distribution of mycotoxins, the sam-pling stage of the overall mycotoxin analysis can frequently represent thegreatest contribution to the overall variance of the result. This was noted bythe fifty-sixth meeting of the Committee. Specific sampling protocols forDON should be followed, such as the one provided by the European Com-mission, which regulates the number and size of incremental samples as wellas the size of the aggregate sample to be taken for control purposes.
41
Effects of processing
The fifty-sixth meeting of the Committee reviewed the effects of gravity sep-aration, milling, washing, soaking in water or sodium carbonate solutions,baking, extrusion cooking, fermentation and the use of microorganisms onDON levels. These are documented in the monograph of the fifty-sixth meet-ing of the Committee (Annex 1, reference 153). Milling redistributes DON,with the highest amounts appearing in the bran, which is sometimes used inhuman food and most often in animal feed. Additional studies conductedsince then have shown that removal of screenings and bran from wheat grainsreduced DON levels by 41–50%. Current data have also confirmed the effi-cacy of washing or soaking in water or sodium carbonate solutions in reducingDON levels in barley and wheat. Although results of frying and baking studieshave been conflicting, the use of extrusion cooking indicated a reduction ofDON levels by between 18% and 95%, depending on the moisture contentand temperature. It is, however, suggested that apparent reductions may bedue to binding or the inability to extract the toxin from the extruded matrixusing current analytical techniques. Few studies exist on the effects of maltingand brewing processes on DON levels. Steeping lowered DON levels as aresult of the water solubility of the toxin. During germination, DON levelsincreased 2-fold because of the conditions conducive for Fusarium growthand toxin formation. A subsequent decrease in DON levels during fermen-tation was observed, which was attributed to yeast absorption. Additionalstudies are required to confirm these changes as well as the effects of pro-cessing on the acetyl derivatives of DON.
Prevention and control
Prevention and control practices include the use of suitable crop rotation,appropriate use of fertilizers, irrigation and weed control, and the use of re-sistant cultivars and decontamination procedures. The use of microorganismsis a recent approach employed to reduce growth of Fusarium species, severityof disease symptoms and DON levels. Strains of Bacillus subtilis, Fusariumequiseti and Cryptococcus sp. have given encouraging results (controllingFusarium head blight and reducing DON formation) in field studieswith wheat. Experimental studies under glasshouse conditions withStreptomyces sp., Pseudomonas fluorescens and Pseudomonas frederiksber-gensis strains similarly reduced both the severity of Fusarium head blightsymptoms caused by Fusarium culmorum in wheat and barley and DONlevels under both glasshouse and field conditions. The use of chitosan(deacetylated derivative of chitin) for reducing DON levels as well as theseverity of Fusarium head blight symptom development in wheat and barleyhas been studied, but additional data are required to confirm the effects.
42
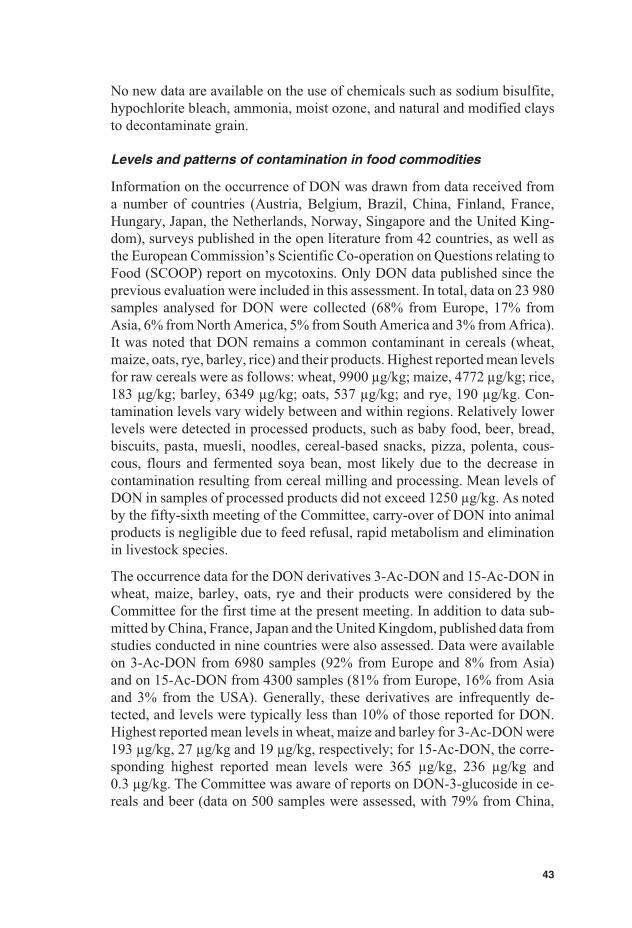
No new data are available on the use of chemicals such as sodium bisulfite,hypochlorite bleach, ammonia, moist ozone, and natural and modified claysto decontaminate grain.
Levels and patterns of contamination in food commodities
Information on the occurrence of DON was drawn from data received froma number of countries (Austria, Belgium, Brazil, China, Finland, France,Hungary, Japan, the Netherlands, Norway, Singapore and the United King-dom), surveys published in the open literature from 42 countries, as well asthe European Commission’s Scientific Co-operation on Questions relating toFood (SCOOP) report on mycotoxins. Only DON data published since theprevious evaluation were included in this assessment. In total, data on 23 980samples analysed for DON were collected (68% from Europe, 17% fromAsia, 6% from North America, 5% from South America and 3% from Africa).It was noted that DON remains a common contaminant in cereals (wheat,maize, oats, rye, barley, rice) and their products. Highest reported mean levelsfor raw cereals were as follows: wheat, 9900 μg/kg; maize, 4772 μg/kg; rice,183 μg/kg; barley, 6349 μg/kg; oats, 537 μg/kg; and rye, 190 μg/kg. Con-tamination levels vary widely between and within regions. Relatively lowerlevels were detected in processed products, such as baby food, beer, bread,biscuits, pasta, muesli, noodles, cereal-based snacks, pizza, polenta, cous-cous, flours and fermented soya bean, most likely due to the decrease incontamination resulting from cereal milling and processing. Mean levels ofDON in samples of processed products did not exceed 1250 μg/kg. As notedby the fifty-sixth meeting of the Committee, carry-over of DON into animalproducts is negligible due to feed refusal, rapid metabolism and eliminationin livestock species.
The occurrence data for the DON derivatives 3-Ac-DON and 15-Ac-DON inwheat, maize, barley, oats, rye and their products were considered by theCommittee for the first time at the present meeting. In addition to data sub-mitted by China, France, Japan and the United Kingdom, published data fromstudies conducted in nine countries were also assessed. Data were availableon 3-Ac-DON from 6980 samples (92% from Europe and 8% from Asia)and on 15-Ac-DON from 4300 samples (81% from Europe, 16% from Asiaand 3% from the USA). Generally, these derivatives are infrequently de-tected, and levels were typically less than 10% of those reported for DON.Highest reported mean levels in wheat, maize and barley for 3-Ac-DON were193 μg/kg, 27 μg/kg and 19 μg/kg, respectively; for 15-Ac-DON, the corre-sponding highest reported mean levels were 365 μg/kg, 236 μg/kg and0.3 μg/kg. The Committee was aware of reports on DON-3-glucoside in ce-reals and beer (data on 500 samples were assessed, with 79% from China,
43
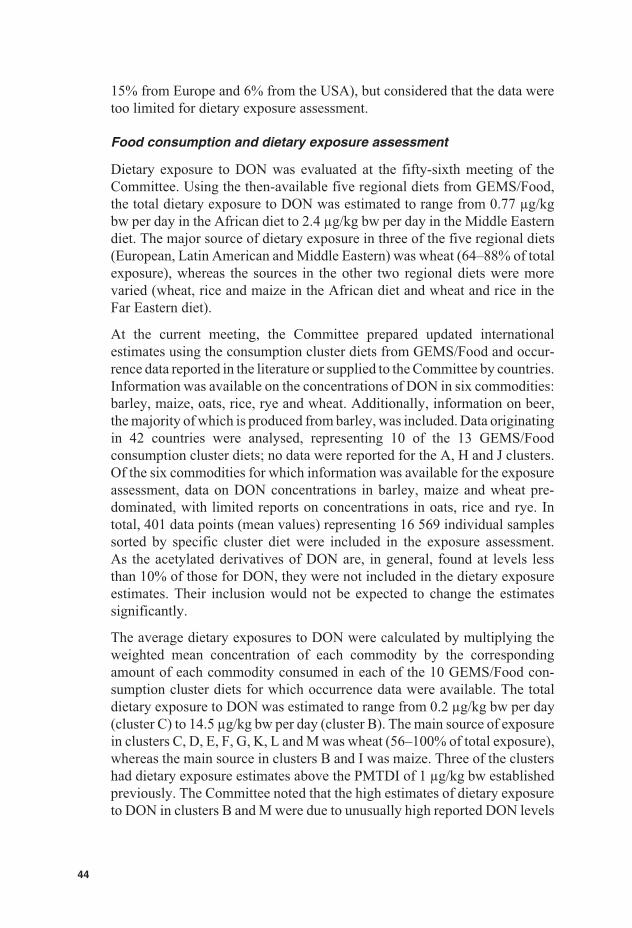
15% from Europe and 6% from the USA), but considered that the data weretoo limited for dietary exposure assessment.
Food consumption and dietary exposure assessment
Dietary exposure to DON was evaluated at the fifty-sixth meeting of theCommittee. Using the then-available five regional diets from GEMS/Food,the total dietary exposure to DON was estimated to range from 0.77 μg/kgbw per day in the African diet to 2.4 μg/kg bw per day in the Middle Easterndiet. The major source of dietary exposure in three of the five regional diets(European, Latin American and Middle Eastern) was wheat (64–88% of totalexposure), whereas the sources in the other two regional diets were morevaried (wheat, rice and maize in the African diet and wheat and rice in theFar Eastern diet).
At the current meeting, the Committee prepared updated internationalestimates using the consumption cluster diets from GEMS/Food and occur-rence data reported in the literature or supplied to the Committee by countries.Information was available on the concentrations of DON in six commodities:barley, maize, oats, rice, rye and wheat. Additionally, information on beer,the majority of which is produced from barley, was included. Data originatingin 42 countries were analysed, representing 10 of the 13 GEMS/Foodconsumption cluster diets; no data were reported for the A, H and J clusters.Of the six commodities for which information was available for the exposureassessment, data on DON concentrations in barley, maize and wheat pre-dominated, with limited reports on concentrations in oats, rice and rye. Intotal, 401 data points (mean values) representing 16 569 individual samplessorted by specific cluster diet were included in the exposure assessment.As the acetylated derivatives of DON are, in general, found at levels lessthan 10% of those for DON, they were not included in the dietary exposureestimates. Their inclusion would not be expected to change the estimatessignificantly.
The average dietary exposures to DON were calculated by multiplying theweighted mean concentration of each commodity by the correspondingamount of each commodity consumed in each of the 10 GEMS/Food con-sumption cluster diets for which occurrence data were available. The totaldietary exposure to DON was estimated to range from 0.2 μg/kg bw per day(cluster C) to 14.5 μg/kg bw per day (cluster B). The main source of exposurein clusters C, D, E, F, G, K, L and M was wheat (56–100% of total exposure),whereas the main source in clusters B and I was maize. Three of the clustershad dietary exposure estimates above the PMTDI of 1 μg/kg bw establishedpreviously. The Committee noted that the high estimates of dietary exposureto DON in clusters B and M were due to unusually high reported DON levels
44
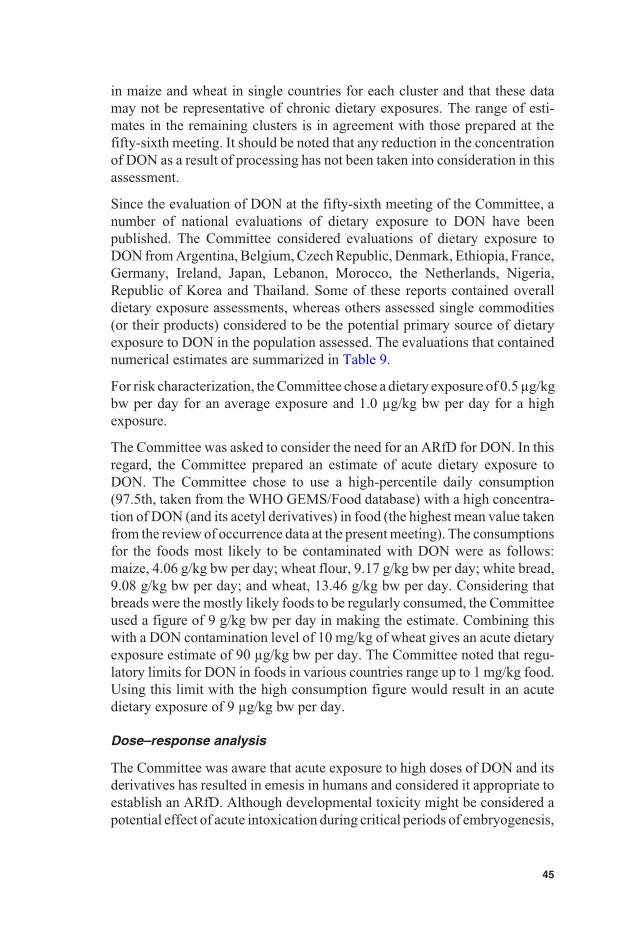
in maize and wheat in single countries for each cluster and that these datamay not be representative of chronic dietary exposures. The range of esti-mates in the remaining clusters is in agreement with those prepared at thefifty-sixth meeting. It should be noted that any reduction in the concentrationof DON as a result of processing has not been taken into consideration in thisassessment.
Since the evaluation of DON at the fifty-sixth meeting of the Committee, anumber of national evaluations of dietary exposure to DON have beenpublished. The Committee considered evaluations of dietary exposure toDON from Argentina, Belgium, Czech Republic, Denmark, Ethiopia, France,Germany, Ireland, Japan, Lebanon, Morocco, the Netherlands, Nigeria,Republic of Korea and Thailand. Some of these reports contained overalldietary exposure assessments, whereas others assessed single commodities(or their products) considered to be the potential primary source of dietaryexposure to DON in the population assessed. The evaluations that containednumerical estimates are summarized in Table 9.
For risk characterization, the Committee chose a dietary exposure of 0.5 μg/kgbw per day for an average exposure and 1.0 μg/kg bw per day for a highexposure.
The Committee was asked to consider the need for an ARfD for DON. In thisregard, the Committee prepared an estimate of acute dietary exposure toDON. The Committee chose to use a high-percentile daily consumption(97.5th, taken from the WHO GEMS/Food database) with a high concentra-tion of DON (and its acetyl derivatives) in food (the highest mean value takenfrom the review of occurrence data at the present meeting). The consumptionsfor the foods most likely to be contaminated with DON were as follows:maize, 4.06 g/kg bw per day; wheat flour, 9.17 g/kg bw per day; white bread,9.08 g/kg bw per day; and wheat, 13.46 g/kg bw per day. Considering thatbreads were the mostly likely foods to be regularly consumed, the Committeeused a figure of 9 g/kg bw per day in making the estimate. Combining thiswith a DON contamination level of 10 mg/kg of wheat gives an acute dietaryexposure estimate of 90 μg/kg bw per day. The Committee noted that regu-latory limits for DON in foods in various countries range up to 1 mg/kg food.Using this limit with the high consumption figure would result in an acutedietary exposure of 9 μg/kg bw per day.
Dose–response analysis
The Committee was aware that acute exposure to high doses of DON and itsderivatives has resulted in emesis in humans and considered it appropriate toestablish an ARfD. Although developmental toxicity might be considered apotential effect of acute intoxication during critical periods of embryogenesis,
45
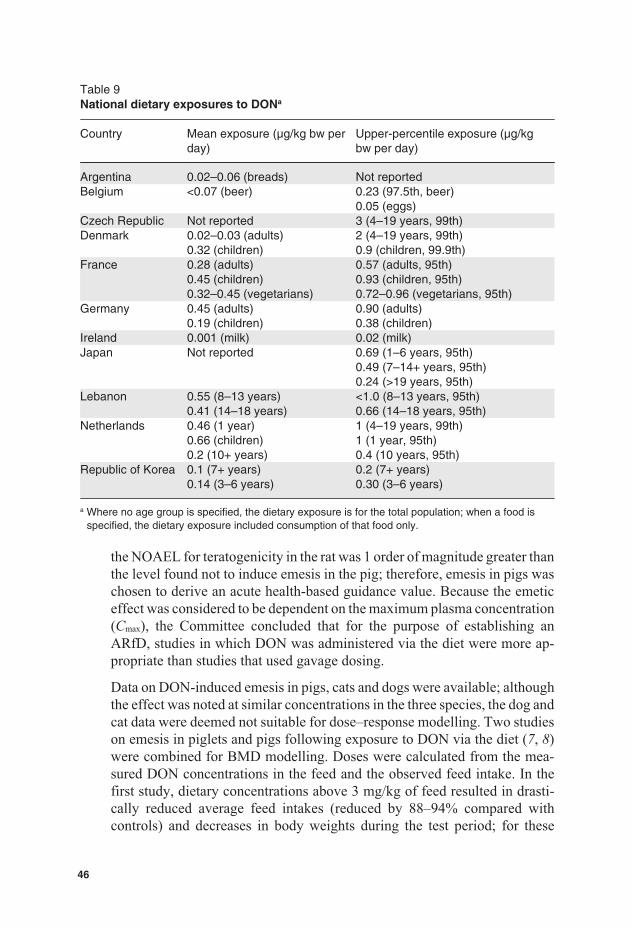
Table 9National dietary exposures to DONa
Country Mean exposure (μg/kg bw perday)
Upper-percentile exposure (μg/kgbw per day)
Argentina 0.02–0.06 (breads) Not reportedBelgium <0.07 (beer) 0.23 (97.5th, beer)
0.05 (eggs)Czech Republic Not reported 3 (4–19 years, 99th)Denmark 0.02–0.03 (adults)
0.32 (children)2 (4–19 years, 99th)0.9 (children, 99.9th)
France 0.28 (adults)0.45 (children)0.32–0.45 (vegetarians)
0.57 (adults, 95th)0.93 (children, 95th)0.72–0.96 (vegetarians, 95th)
Germany 0.45 (adults)0.19 (children)
0.90 (adults)0.38 (children)
Ireland 0.001 (milk) 0.02 (milk)Japan Not reported 0.69 (1–6 years, 95th)
0.49 (7–14+ years, 95th)0.24 (>19 years, 95th)
Lebanon 0.55 (8–13 years)0.41 (14–18 years)
<1.0 (8–13 years, 95th)0.66 (14–18 years, 95th)
Netherlands 0.46 (1 year)0.66 (children)0.2 (10+ years)
1 (4–19 years, 99th)1 (1 year, 95th)0.4 (10 years, 95th)
Republic of Korea 0.1 (7+ years)0.14 (3–6 years)
0.2 (7+ years)0.30 (3–6 years)
a Where no age group is specified, the dietary exposure is for the total population; when a food isspecified, the dietary exposure included consumption of that food only.
the NOAEL for teratogenicity in the rat was 1 order of magnitude greater thanthe level found not to induce emesis in the pig; therefore, emesis in pigs waschosen to derive an acute health-based guidance value. Because the emeticeffect was considered to be dependent on the maximum plasma concentration(Cmax), the Committee concluded that for the purpose of establishing anARfD, studies in which DON was administered via the diet were more ap-propriate than studies that used gavage dosing.
Data on DON-induced emesis in pigs, cats and dogs were available; althoughthe effect was noted at similar concentrations in the three species, the dog andcat data were deemed not suitable for dose–response modelling. Two studieson emesis in piglets and pigs following exposure to DON via the diet (7, 8)were combined for BMD modelling. Doses were calculated from the mea-sured DON concentrations in the feed and the observed feed intake. In thefirst study, dietary concentrations above 3 mg/kg of feed resulted in drasti-cally reduced average feed intakes (reduced by 88–94% compared withcontrols) and decreases in body weights during the test period; for these
46
groups, it was assumed that the total feed intake over 4 or 11 days was actuallyall consumed on day 1. This assumption was made because it has often beenobserved that pigs stop eating after DON-induced vomiting on day 1. For thethree dose groups in which it was reported that at least one pig vomited, itwas assumed that the incidence was one. In the second study, the averagefeed intake was taken from the first week of exposure, although intake wasdecreased in the dose groups given 1.4 mg/kg of feed or more compared withcontrols. The initial body weights were used for the calculations, becauseemesis was observed on day 1 of exposure.
The dose–response analysis was performed using the PROAST software(version 23.2). The BMR was set at 10% extra risk. The BMDL10s among theaccepted models ranged between 0.21 and 0.74 mg/kg bw per day. The lowestvalue in this range was used as a POD for establishing an ARfD.
Evaluation
At its fifty-sixth meeting, the Committee established a PMTDI of 1 μg/kg bwfor DON on the basis of the NOEL1 of 100 μg/kg bw per day based on de-creased body weight gain from a 2-year feeding study in mice and applicationof a safety factor of 100. Repeated-dose short-term studies considered in thepresent evaluation indicated that this NO(A)EL remains appropriate.
Since 3-Ac-DON is converted to DON and therefore contributes to the totalDON-induced toxicity, the Committee decided to convert the PMTDI forDON to a group PTMDI of 1 μg/kg bw for DON and its acetylated derivatives(3-Ac-DON and 15-Ac-DON). In this regard, the Committee considered thetoxicity of the acetylated derivatives equal to that of DON. The Committeeconcluded that, at this time, there was insufficient information to includeDON-3-glucoside in the group PMTDI.
The Committee derived a group ARfD for DON and its acetylated derivativesusing the lowest BMDL10 of 0.21 mg/kg bw per day for emesis in pigs. TheCommittee considered that because DON-induced emesis is a systemic effectand more dependent on Cmax than on area under the plasma concentration–time curve (AUC), it would be appropriate to apply an uncertainty factor of25, which is the value used by the Joint FAO/WHO Meeting on PesticideResidues (JMPR) for acute Cmax-dependent effects. The Committee estab-lished a group ARfD for DON and its acetylated derivatives of 8 μg/kg bw.Limited data from human case reports indicated that dietary exposures toDON up to 50 μg/kg bw per day are not likely to induce emesis.
1 At its sixty-eighth meeting (Annex 1, reference 187), the Committee decided to differentiatebetween NOAEL and NOEL. This NOEL would now be considered a NOAEL.
47
Estimation of dietary exposure was made using data from 42 countries, rep-resenting 10 of the 13 GEMS/Food consumption cluster diets, and wastherefore considered to be more globally representative than the previousevaluation. The Committee concluded that all of the mean estimates of na-tional exposure to DON were below the group PMTDI of 1 μg/kg bw.National reports showed dietary exposures that were above 1 μg/kg bw perday in only a few cases, only for children at upper percentiles. For acutedietary exposure, the estimate of 9 μg/kg bw per day, based on high con-sumption of bread and a regulatory limit for DON of 1 mg/kg food, was closeto the group ARfD.
The acetylated derivatives have not been included in the estimates of dietaryexposure to DON prepared at this meeting. The Committee noted that ingeneral they are found at levels less than 10% of those for DON, and inclusionwould not be expected to significantly change the estimates of dietary expo-sure to DON. Data are limited on the occurrence of DON-3-glucoside, whichmight be an important contributor to dietary exposure; this derivative wasalso not included in the dietary exposure estimates.
A detailed addendum to the monograph was prepared.
Recommendations
As DON-3-glucoside has been detected in cereals and beers and mighttherefore contribute to systemic exposure to DON, the Committee rec-ommended that ADME studies be conducted on this substance.
Additional data on the occurrence of and the effects of processing on 3-Ac-DON, 15-Ac-DON and DON-3-glucoside are needed, as well as theirco-occurrence with DON.
3.4 Furan
Explanation
Furan (C4H4O) (CAS No. 110-00-9) is a highly volatile cyclic ether that canbe formed unintentionally in foods during processing from precursors thatare natural food components. Information available to the Committee at itspresent meeting suggested that the major route of exposure to furan in thehuman population is through consumption of heat-treated foods andbeverages.
Furan has not been evaluated previously by the Committee. The request fora full evaluation of furan originated from the Second Session of CCCF (6).
48
Absorption, distribution, metabolism and excretion
Following oral administration to mice and rats, furan is rapidly absorbed,metabolized and eliminated in urine and faeces as metabolites and exhaledin air as unchanged furan and carbon dioxide formed as a result of ring open-ing. The initial ring-opened metabolite is cis-2-butene-1,4-dial (BDA), whichis formed in the liver in a reaction catalysed by CYP2E1. Furan-derivedproducts are most abundant in the liver of dosed animals. A variety of iden-tified urinary metabolites could arise from amino acid or protein crosslinking.
Toxicological data
The toxicity of orally administered furan has been extensively studied inmice and rats over a wide dose range. The primary site of toxicity of furanis the liver, although the kidneys and lungs are also affected at high doses(>30 mg/kg bw per day). In addition, changes in some haematological andhormonal parameters occur at doses as low as 0.12 mg/kg bw per day ad-ministered 5 days/week.
Regarding hepatotoxicity, uncoupling of hepatocyte mitochrondrial oxida-tive phosphorylation is an early critical event in cytolethality. Liver cellinjury, including oxidative stress, progresses to cell death. This, in turn, givesrise to regenerative responses, including increased hepatocellular prolifera-tion in mice and rats and, notably in the rat, an early proliferative reactioninvolving the biliary epithelium, referred to as cholangiofibrosis. These pro-liferative changes may be the basis for liver tumorigenicity, either alone orin combination with DNA alteration. Although furan is not genotoxic in anumber of test systems and binding to rat liver DNA was not detectable, themetabolite BDA is highly reactive and binds to proteins and nucleic acids.BDA produced DNA strand breaks in cultured mammalian cells and wasmutagenic in bacteria and cultured mammalian cells; being a dialdehyde, italso formed crosslinks with DNA of cultured cells. The in vitro genotoxicityof BDA allows the possibility that BDA formed in vivo from furan couldreact with DNA.
Several cancer bioassays of orally (gavage) administered furan in mice andrats have been performed. In mice, doses of 8 and 15 mg/kg bw per day,5 days/week (9), and 0.5, 1.0, 2.0, 4.0 and 8.0 mg/kg bw per day, 5 days/week(10), were used. In rats, doses of 2, 4 and 8 mg/kg bw per day, 5 days/week,were administered (9). In livers of male and female rats, high incidences ofcholangiocarcinomas were induced at all doses in the NTP study (9), accom-panied by biliary tract hyperplasia, metaplasia and fibrosis. Hepatocellularneoplasms were increased at lower incidences. In both sexes of rat, furan alsoincreased the incidences of mononuclear cell leukaemia, albeit against un-usually low background incidences in control groups. In male and femalemice in both studies, only hepatocellular neoplasms were increased.
49
Observations in humans
No epidemiological studies were available.
Analytical methods
GC-MS has been shown to be the most suitable technique for the reliabledetection of low levels of furan in foods. GC-MS is usually precededby headspace (HS) extraction or headspace solid-phase microextraction(HS-SPME). Both HS and HS-SPME approaches are simple and convenientand give satisfactory results for analyses of volatiles. Owing to the highvolatility of furan, food samples and standards need to be chilled and handledquickly. Puréed, liquid samples or reconstituted powdered samples can betransferred directly to HS vials, whereas solid samples have to be homoge-nized. Most published methods include the use of deuterium-labelled furanas an internal standard, which is normally added to the homogenized samplebefore the extraction. LODs and limits of quantification (LOQs) from 0.1 to5 ng/g and from 0.4 to 13 ng/g, respectively, have been reported for methodsbased on HS extraction. Lower LODs and LOQs are reported for methodsusing HS-SPME. No certified reference material is currently available.
Formation, effect of processing and fate in foods
Furan can be formed in a variety of foods from different precursors by thermaland non-thermal processing (ionizing radiation). The proposed routes for fu-ran formation are mainly based on 1) Maillard reactions, 2) thermal degra-dation of carbohydrates, 3) thermal degradation of certain amino acids, 4)thermal oxidation of ascorbic acid, polyunsaturated fatty acids andcarotenoids and 5) free radical reactions during irradiation. Higher amountsof furan are normally formed under roasting conditions (dry heating, 200 °C,10 min) compared with pressure cooking conditions (sterilization, 121 °C,25 min), and pH plays a complex role in the mechanism of furan formation.For coffee, the amount of furan formed in beans varies according to the levelof roasting. Grinding may reduce furan levels by 10–60%, and further de-creases occur in the production of instant coffee powder and in brewing.
Limited data are available on the formation of furan in home-cooked food aswell as on the stability of furan during cooking, storing and reheating ofmeals. As furan appears to be well dissolved within the matrix, opening thejars (e.g. baby foods) exposes only a relatively small surface area. Therefore,despite furan’s volatility, its evaporation is hindered by its slow diffusioninside the food matrix. However, if canned or jarred foods are heated in asaucepan under stirring, larger declines of furan content can be observed.Studies on the losses of furan during warming procedures for ready-to-eatfoods have shown conflicting results, with some authors reporting losses of
50
29–85% and others finding that furan persists during normal heating prac-tices. Losses of furan in heated foods left for cooling seem to be insignificant.
Levels and patterns of contamination in food commodities
Furan concentration data covering 21 countries were submitted by Australia,Brazil, Canada, the European Union (EU), Japan, Republic of Korea,Switzerland and the USA. The total number of analytical results (single orcomposite samples) evaluated at the present meeting was 5662, with 59.8%from Europe, 16.7% from North America, 22.8% from Asia, 1.0% from LatinAmerica and 0.7% from the Pacific region. The occurrence of furan has beeninvestigated mainly in thermally processed foods, such as coffee, canned andjarred foods, including baby foods, soups and sauces. The ranges of nationalmean levels of furan for the foods with the highest contamination levels wereas follows: roasted coffee (powder), 814–4590 μg/kg; instant coffee (pow-der), 90–783 μg/kg; brewed roasted coffee, 34–113 μg/kg; jarred baby foods,19–96 μg/kg; soya sauce, 16–52 μg/kg; canned fish, 6–76 μg/kg; and bakedbeans, 27–581 μg/kg. Lower levels have been found in other foods, includingproducts from vegetables, meat, milk and cereals.
Food consumption and dietary exposure assessment
Although the presence of furan as a flavour component in food was firstreported in 1979, dietary exposure assessments for furan were not undertakenuntil 2004, when data on furan concentrations in a variety of foods in the USAbecame available.
At the present meeting, the Committee considered dietary exposure estimatesfor furan submitted by the USA, the EU and Brazil, all of which were basedon analysed data for foods and individual dietary records for the populationsof interest. The dietary exposure estimates for the whole population, infantsand young children in the USA and Denmark were considered by theCommittee to underestimate dietary exposure, as furan levels were assignedto the specific foods analysed only and hence did not represent the wholefood supply. In contrast, the dietary exposure estimates for adults submittedby the EU for 14 European countries were considered to be overestimates; asthe mean furan levels from 2004–2009 results for individual foods weregrouped and then assigned to the food consumption amount for the relevantwider food group, as described in the EFSA Concise European FoodConsumption Database, some uncertainty was introduced in these dietaryexposure assessments. For example, the furan level for coffee was assignedto the wider food group “coffee, tea and cocoa”; as levels of furan are muchhigher in coffee than in either tea or cocoa, this results in an overestimate ofdietary exposure to furan from these beverages.
51
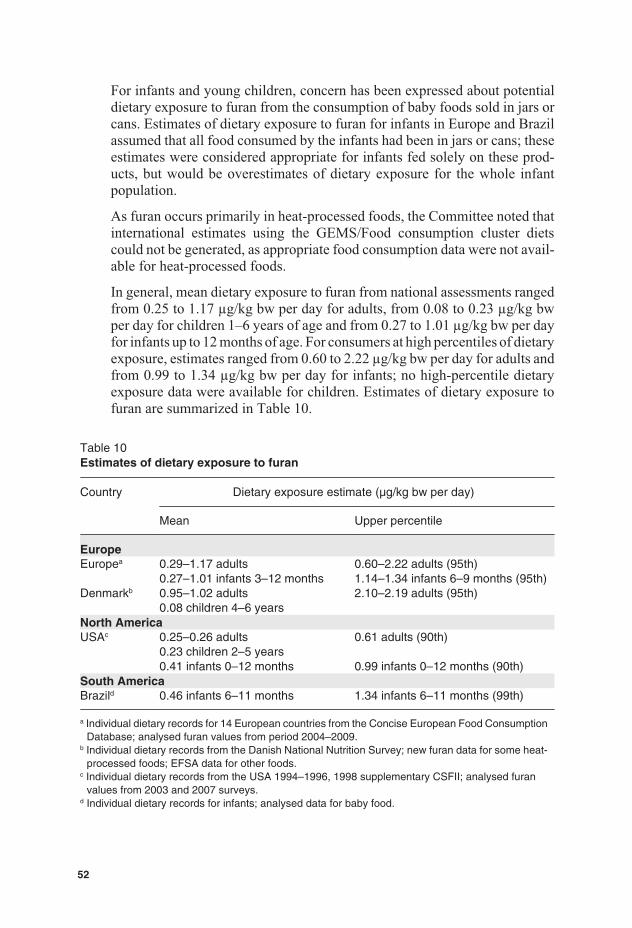
For infants and young children, concern has been expressed about potentialdietary exposure to furan from the consumption of baby foods sold in jars orcans. Estimates of dietary exposure to furan for infants in Europe and Brazilassumed that all food consumed by the infants had been in jars or cans; theseestimates were considered appropriate for infants fed solely on these prod-ucts, but would be overestimates of dietary exposure for the whole infantpopulation.
As furan occurs primarily in heat-processed foods, the Committee noted thatinternational estimates using the GEMS/Food consumption cluster dietscould not be generated, as appropriate food consumption data were not avail-able for heat-processed foods.
In general, mean dietary exposure to furan from national assessments rangedfrom 0.25 to 1.17 μg/kg bw per day for adults, from 0.08 to 0.23 μg/kg bwper day for children 1–6 years of age and from 0.27 to 1.01 μg/kg bw per dayfor infants up to 12 months of age. For consumers at high percentiles of dietaryexposure, estimates ranged from 0.60 to 2.22 μg/kg bw per day for adults andfrom 0.99 to 1.34 μg/kg bw per day for infants; no high-percentile dietaryexposure data were available for children. Estimates of dietary exposure tofuran are summarized in Table 10.
Table 10Estimates of dietary exposure to furan
Country Dietary exposure estimate (μg/kg bw per day)
Mean Upper percentile
EuropeEuropea 0.29–1.17 adults
0.27–1.01 infants 3–12 months0.60–2.22 adults (95th)1.14–1.34 infants 6–9 months (95th)
Denmarkb 0.95–1.02 adults0.08 children 4–6 years
2.10–2.19 adults (95th)
North AmericaUSAc 0.25–0.26 adults
0.23 children 2–5 years0.41 infants 0–12 months
0.61 adults (90th)
0.99 infants 0–12 months (90th)South AmericaBrazild 0.46 infants 6–11 months 1.34 infants 6–11 months (99th)
a Individual dietary records for 14 European countries from the Concise European Food ConsumptionDatabase; analysed furan values from period 2004–2009.
b Individual dietary records from the Danish National Nutrition Survey; new furan data for some heat-processed foods; EFSA data for other foods.
c Individual dietary records from the USA 1994–1996, 1998 supplementary CSFII; analysed furanvalues from 2003 and 2007 surveys.
d Individual dietary records for infants; analysed data for baby food.
52
For adults, coffee was the major contributor to dietary furan exposures(40–80%), with cereals, vegetables, meats and dairy foods contributing morethan 5% to total exposure. For children, breakfast cereals were the majorcontributor (40%). As reported furan levels were much higher for brewedcoffee than for ready-to-drink instant coffee, the type of coffee consumed ina given population and the furan level for coffee influenced the dietary ex-posure estimates for adults. The lower values obtained in the United StatesFood and Drug Administration (USFDA) estimates for adults compared withthose from EFSA for European countries were largely explained by the lowerfuran level for brewed coffee in the USFDA estimates. Despite this, estimateddietary furan exposures available to the Committee were in the same orderof magnitude.
For the purposes of risk characterization, a value of 1 μg/kg bw per day wastaken to represent mean dietary exposure to furan, and a value of 2 μg/kg bwper day was taken to represent high dietary exposure. The Committee con-sidered these values to be sufficient to cover potential dietary exposures ofinfants and children to furan.
Dose–response analysis
Dosing with furan in bioassays gave rise to increases in liver tumours andleukaemias. The neoplasms evaluated for dose–response analysis were asfollows: cholangiocarcinomas in livers of male and female rats, hepatocel-lular neoplasms in male and female rats, mononuclear cell leukaemias in maleand female rats and hepatocellular neoplasms in male and female mice.
The cholangiocarcinomas were seen only in rats and were associated withextreme hepatotoxicity and an early and marked biliary tract proliferativeresponse. The relevance for humans of the cholangiocarcinomas is not clear,and the available data do not allow for an analysis of the mode of action. Also,the high incidences of these neoplasms at all doses of furan precludedidentification of a POD. The Committee was aware of ongoing studies in ratsto extend the dose–response data and address mechanistic aspects for thisend-point.
The mononuclear cell leukaemias in rats, which occur in high incidence inthe strain used in the NTP bioassay (9), are of unknown pathogenesis, andthe increases occurred against a background of unusually low incidences inthe control groups. Moreover, studies of genotoxicity in rat bone marrow,where the progenitor cells of the leukaemias presumably arise, were negative,and the mode of action is unknown.
The hepatocellular neoplasms in rats in the NTP study (9) and in mice in theNTP study (9) and the study of Moser et al. (10) and the leukaemias in ratsin the NTP study (9) were selected for modelling.
53
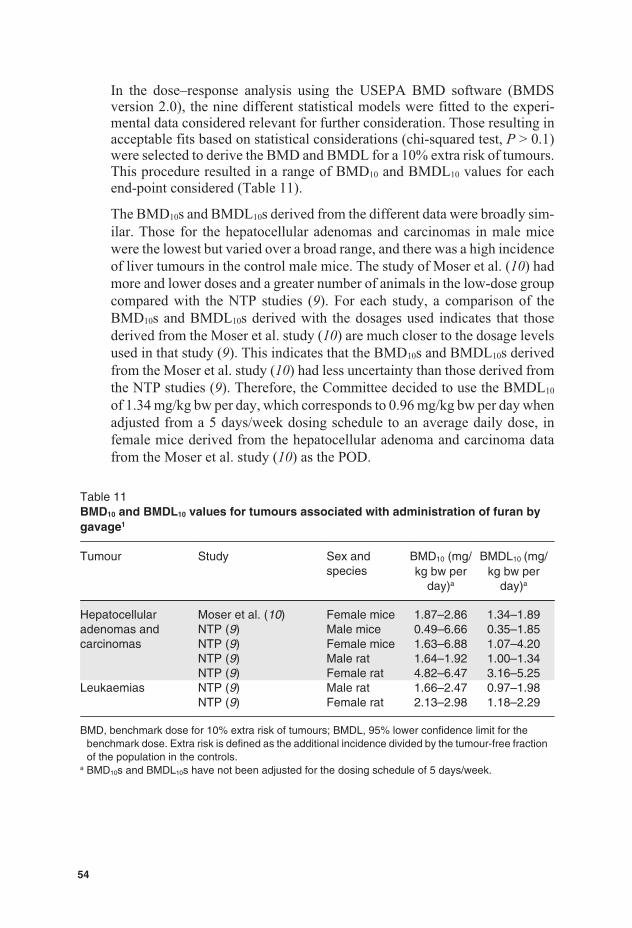
In the dose–response analysis using the USEPA BMD software (BMDSversion 2.0), the nine different statistical models were fitted to the experi-mental data considered relevant for further consideration. Those resulting inacceptable fits based on statistical considerations (chi-squared test, P > 0.1)were selected to derive the BMD and BMDL for a 10% extra risk of tumours.This procedure resulted in a range of BMD10 and BMDL10 values for eachend-point considered (Table 11).
The BMD10s and BMDL10s derived from the different data were broadly sim-ilar. Those for the hepatocellular adenomas and carcinomas in male micewere the lowest but varied over a broad range, and there was a high incidenceof liver tumours in the control male mice. The study of Moser et al. (10) hadmore and lower doses and a greater number of animals in the low-dose groupcompared with the NTP studies (9). For each study, a comparison of theBMD10s and BMDL10s derived with the dosages used indicates that thosederived from the Moser et al. study (10) are much closer to the dosage levelsused in that study (9). This indicates that the BMD10s and BMDL10s derivedfrom the Moser et al. study (10) had less uncertainty than those derived fromthe NTP studies (9). Therefore, the Committee decided to use the BMDL10
of 1.34 mg/kg bw per day, which corresponds to 0.96 mg/kg bw per day whenadjusted from a 5 days/week dosing schedule to an average daily dose, infemale mice derived from the hepatocellular adenoma and carcinoma datafrom the Moser et al. study (10) as the POD.
Table 11BMD10 and BMDL10 values for tumours associated with administration of furan bygavage1
Tumour Study Sex andspecies
BMD10 (mg/kg bw per
day)a
BMDL10 (mg/kg bw per
day)a
Hepatocellularadenomas andcarcinomas
Moser et al. (10) Female mice 1.87–2.86 1.34–1.89NTP (9) Male mice 0.49–6.66 0.35–1.85NTP (9) Female mice 1.63–6.88 1.07–4.20NTP (9) Male rat 1.64–1.92 1.00–1.34NTP (9) Female rat 4.82–6.47 3.16–5.25
Leukaemias NTP (9) Male rat 1.66–2.47 0.97–1.98NTP (9) Female rat 2.13–2.98 1.18–2.29
BMD, benchmark dose for 10% extra risk of tumours; BMDL, 95% lower confidence limit for thebenchmark dose. Extra risk is defined as the additional incidence divided by the tumour-free fractionof the population in the controls.
a BMD10s and BMDL10s have not been adjusted for the dosing schedule of 5 days/week.
54
Evaluation
MOEs were calculated at dietary exposures of 0.001 mg/kg bw per day, torepresent the average dietary exposure to furan for the general population,and 0.002 mg/kg bw per day, to represent the dietary exposure to furan forconsumers with high exposure. This estimate will also cover dietary exposureof children. Comparison of these dietary exposures with the BMDL10 of0.96 mg/kg bw per day for induction of hepatocellular adenomas and carci-nomas in female mice gives MOEs of 960 and 480 for average and highdietary exposures, respectively. The Committee considered that these MOEsindicate a human health concern for a carcinogenic compound that might actvia a DNA-reactive genotoxic metabolite.
The furan levels can be reduced in some foods through volatilization (e.g. byheating and stirring canned or jarred foods in an open saucepan). However,there is currently a lack of quantitative data for all foods, and no informationis available on other mitigation methods.
A detailed monograph was prepared.
3.5 Mercury
Explanation
Mercury occurs naturally in the earth’s crust, usually in the form of the min-eral cinnabar (mercury(II) sulfide). It can be released into the global envi-ronment through a number of processes, both natural and anthropogenic.While relatively chemically inert, mercury occurs in three valence states:elemental mercury (also known as metallic mercury), monovalent mercurousion and divalent mercuric ion, elemental mercury and the divalent ion beingthe most important in nature. There are several organic mercury compounds;by far the most common in the environment and in the aquatic food-chain ismethylmercury.
Mercury was previously evaluated by the Committee at its tenth, fourteenth,sixteenth and twenty-second meetings (Annex 1, references 13, 22, 30 and47). At its sixteenth meeting, the Committee allocated a PTWI of 0.3 mg oftotal mercury (5 μg/kg bw), of which no more than 0.2 mg (3.3 μg/kg bw)should be in the form of methylmercury, based primarily on the relationshipbetween the intake of mercury from fish and mercury levels in blood and hairassociated with the onset of clinical disease. The sixteenth meeting of theCommittee noted that almost all dietary exposure to methylmercury is fromfish and seafood and that methylmercury is probably by far the most toxicform of mercury in food; therefore, other forms of mercury could be givenless weight when establishing a tolerable intake for mercury. The originalPTWI for methylmercury (3.3 μg/kg bw) was revised at the sixty-first
55
meeting (Annex 1, reference 166) to 1.6 μg/kg bw, based on an assessmentof results from various epidemiological studies involving fish-eating popu-lations and developmental neurotoxicity. At the sixty-seventh meeting(Annex 1, reference 184), the Committee provided further clarifications as tothe relevance of the new methylmercury PTWI for different subgroups of thepopulation.
At the sixty-first meeting, the Committee recommended that the total mercuryPTWI be reviewed.
Absorption, distribution, metabolism and excretion
Following oral exposure, inorganic mercury salts show limited absorption,which is related to their water solubility. In human volunteers, the averageabsorption of a tracer dose of inorganic mercury given as mercury(II) nitratewas 5–10%, whether delivered in a protein-bound matrix or as a solution.
Inorganic mercury compounds are not lipid soluble and do not readily crossthe blood–brain barrier or placenta membranes. Ionic species of inorganicmercury readily bind to sulfhydryl groups of various thiol-containing com-pounds, such as glutathione, cysteine and metallothionein. Kidneys exhibitthe greatest concentration of mercury following exposure to inorganic mer-cury compounds. The main pathways of excretion of absorbed inorganicmercury are via the urine and, to a lesser extent, in the faeces. Owing to thepoor absorption of orally administered inorganic mercury, the majority of theingested dose in humans is excreted in the faeces. Inorganic mercury can alsobe excreted via the breast milk. The half-life for inorganic forms of mercuryin humans has been estimated at 1–2 months.
Toxicological data
Haematological, hepatic and renal effects have been reported in rats or miceadministered sublethal single oral doses of mercury(II) chloride. Renal effectsusually observed with mercury(II) chloride at doses above 5 mg/kg bw perday include interstitial sclerosis, renal tubular damage and proximal tubularnecrosis. Severe gastrointestinal damage, including inflammation and necro-sis of the forestomach and necrosis of the glandular stomach, can also beinduced with high doses of inorganic mercury, in particular for mercury(II)compounds, which are relatively more corrosive than mercury(I) compounds.
Longer-term exposure (subchronic to chronic) to inorganic mercury at dosesabove 1–5 mg/kg bw per day can induce a variety of effects related to generaltoxicity (decrease in body weight gain, changes in clinical and haematologicalparameters), as well as organ-specific effects (increased kidney and adrenalweights, testicular atrophy). Effects associated with relative kidney weightchanges include marked thickening of glomerular and tubular basement
56
membranes, degeneration and atrophy of the tubular epithelium and increasedseverity of nephropathy. Treatment of mice and rats by gavage with mer-cury(II) chloride at doses ranging from 1.25 to 20 mg/kg bw per day and from0.312 to 5.0 mg/kg bw per day, respectively, for 6 months produced a varietyof renal effects, which occurred with greater frequency and severity in maleanimals. Unlike organic mercury compounds, neurotoxicity is not usuallyobserved, even at exposure levels that produce frank toxicological effects inother organs.
Reproductive effects induced by inorganic mercury include decreased fertil-ity, reduced implantation efficiency and decreases in both live births and littersizes. The observed effects seem to involve male-specific end-points (testic-ular atrophy, androgen decreases, spermatogenesis disruption) more thaneffects in females. However, inconsistencies have been noted in some ex-perimental responses. A consistent observation in most reproduction studiesincludes increased relative kidney weights in the offspring.
Inorganic mercury compounds have produced some genotoxic effects in vitroand in vivo, with stronger evidence from in vitro experiments, including sin-gle-stranded DNA breaks, sister chromatid exchanges and chromosomalaberrations. However, the mechanisms appear to involve primarily inductionof oxidative stress (reactive oxygen species) or disruption of microtubulesrather than direct interaction with DNA, including adduct formation, whichhas not been demonstrated.
Chronic exposure of mice and rats to mercury(II) chloride at doses rangingfrom 2.5 to 10 mg/kg bw per day has produced some indications of carcino-genicity. The main findings included an increased incidence of forestomachhyperplasia, forestomach squamous cell papillomas and a marginal increasein thyroid follicular cell carcinomas in male rats. In mice, renal tubule tu-mours were seen only in high-dose males, but the incidence was not statisti-cally significant compared with historical controls. It was concluded bythe NTP (11) that there was some evidence of carcinogenic activity ofmercury(II) chloride in male F344 rats, based on the increased incidences ofsquamous cell papillomas of the forestomach and the marginally increasedincidence of thyroid follicular cell neoplasias, equivocal evidence in bothfemale rats and male mice, and no evidence in female rats. However, theNTP (11) considered that the forestomach lesions in male rats may have lim-ited relevance, as they did not progress to malignancy (direct tissue irritationeffect). Also, as follicular cell carcinomas in rats usually result from increasedincidences of hyperplasia and adenomas, it was further noted that the com-bined incidence of thyroid follicular cell neoplasms (adenomas and carcino-mas) was not significantly increased. IARC considered that there is limitedevidence in experimental animals for the carcinogenicity of mercury(II)chloride, based on results from the NTP (11) bioassay.
57
Observations in humans
Human data on the adverse health effects of exposure to inorganic mercury,including renal effects, consist of case reports or case series that do not allowthe identification of dose–response relationships. Therefore, they do not pro-vide an adequate basis for deriving a health-based guidance value. They do,however, provide evidence that supports the use of adverse renal effects ob-served in experimental species as the basis for such a derivation. Nephroticsyndrome, including proliferative or membranous glomerulonephritis, hasbeen associated with the topical use of mercury(II) ammonium chloridecreams. Based on the limited number of studies of cancer and the absence ofconsistent findings, IARC concluded that there is inadequate evidence in hu-mans for the carcinogenicity of mercury and mercury compounds. As a result,inorganic mercury compounds were not classifiable as to their carcinogenic-ity in humans (Group 3).
Analytical methods
Sample handling is generally critical only for water samples. The best mate-rials for water sample storage and processing are polytetrafluoroethylene andfluorinated ethylene-propylene. Fresh samples are usually stored deep-frozen, lyophilized in darkness or sometimes sterilized. It has been reportedthat methylmercury may be decomposed in some food matrices with repeatedfreezing and unfreezing (particularly in bivalves). However, relatively littleis known about the effect of storage on the stability of methylmercury in foodsamples.
Following acidic digestion of samples, cold vapour atomic absorption spec-trometry (CV-AAS) or cold vapour atomic fluorescence spectrometry (CV-AFS) has been widely used for the determination of total mercury in severalfood matrices. An LOQ of about 30 μg/kg dry mass in foods may be obtainedby CV-AAS. Further sensitivity enhancement may be obtained by CV-AFS.The main advantages of the cold vapour technique are the separation of theanalyte from the potentially interfering sample matrix and its comparativelylow cost. However, to avoid interference by CV-AFS, special precautionsmust be taken to completely remove vapours when nitric acid is used fordigestion. With an LOQ of about 10 μg/kg dry mass and greater selectivity,ICP-MS is increasingly being used with an addition of gold chloride to mer-cury standard solutions to avoid the mercury memory effects. Although theinstrumentation is expensive to purchase and to operate, the ability of ICP-MS to provide low LOQs, to provide a wide dynamic linear range and tomeasure many elements simultaneously can offset these cost factors.
58
Basically, all the speciation methodology is generally targeted on the sepa-ration and determination of methylmercury, and there has been no conclusiveidentification of other species of mercury.
Extraction of the mercury species from its matrix requires an aggressivetreatment, such as acid digestion, distillation or alkaline extraction, with theoption of applying ultrasonic or microwave energy to assist in the procedure.Extraction is one of the most critical steps, because two conflicting issuesneed to be addressed: obtaining high extraction efficiency and preventinglosses. In alkaline media, methylmercury appears to be more stable than inacid media, with proteins being easily hydrolysed.
GC has been the most widely used technique for the separation of mercuryspecies, whereas HPLC is increasingly being applied. The detection methods(LOD in parentheses) of CV-AAS (10 μg/kg), CV-AFS (1 μg/kg),microwave-induced plasma (MIP)-AES or ICP-AES (5 μg/kg), MS(40 μg/kg) and ICP-MS (<3 μg/kg) all have sufficient sensitivity for foodsamples. The advantage of MS and ICP-MS is their multielement and multi-isotope capabilities that allow for more accurate and precise results byspeciated isotope dilution (SID)-MS, which can also check for species trans-formations and extraction recoveries. Once in solution, methylmercury maydecompose when exposed to light, low pH and high storage temperatures.Other factors, such as the type of storage container, may also affect thestability.
Available certified reference materials and proficiency testing schemes orintercomparison exercises exist for both total mercury and methylmercury todemonstrate and maintain analytical quality assurance. However, there is acurrent need for fully validated, standardized methods for determination ofmethylmercury and inorganic mercury.
Sampling protocols
Some authorities have regulations with regards to specific sampling protocolsfor mercury and other contaminants. For example, the European Commissionhas regulated the number and size of incremental samples, size of the aggre-gate sample and precautions to be taken for control purposes.
Levels and patterns of contamination in food commodities
At its present meeting, the Committee reviewed data from eight countries onthe occurrence of mercury in different food commodities analysed between1997 and 2009. The total number of analytical results for total mercury wasmore than 106 740, with 93% coming from Europe (Finland, France, Spain),5% from Asia (Japan, China), 1% from the Americas (Brazil, Canada) and1% from Oceania (Australia), for water (85%), fish (6%), shellfish (2%) andother food groups (6%). The 2128 samples analysed for methylmercury were
59
from fish (94%), shellfish (2%) and other products (4%). However, the Com-mittee did not receive any occurrence data on inorganic mercury in foodsor water.
Total mercury levels in 98% of 90 545 water samples analysed in France werebelow the LOQ of 0.02 μg/l, with a maximum of 4.3 μg/l.
Total mercury levels in foods other than fish products were generally low(range 0.0001–0.050 mg/kg), with about 80% of the 6183 samples containinglevels below the LOQs. The highest levels were found in fungi. Meanmethylmercury levels reported by China in non-fish samples ranged from0.001 to 0.023 mg/kg, with a maximum concentration found in poultry. Noother information on methylmercury in non-fish samples was received fromother countries.
Total mercury levels in 1892 shellfish samples (80% above LOQ) rangedfrom 0.002 to 0.86 mg/kg. No shellfish species contained methylmercury atconcentrations greater than 0.5 mg/kg (range 0.002–0.451 mg/kg), with themaximum concentration found in edible crab.
Total mercury levels in 6114 fish samples ranged from 0.001 to 11.4 mg/kg,with the maximum concentration found in marlin.
The proportion of total mercury contributed by methylmercury generallyranged between 30% and 100%, depending on species of fish, size, age anddiet. Furthermore, in about 80% of these data, methylmercury accounted formore than 80% of total mercury. However, a few submitted data showedproportions of methylmercury of about 10% or less.
Food consumption and dietary exposure assessment
National estimates
Most of the available dietary exposure assessments for mercury were fromnational TDSs. These include the following TDSs: Australia (2000–2001),Canada (1998–2000), China (2007), Czech Republic (2000), France (2001–2002), Japan (2008), New Zealand (2003–2004), Republic of Korea (2005),the United Kingdom (2006) and the USA (1991–2005). Published data fromother studies focusing on special subpopulations were also available. Theseinclude TDSs conducted in Chile (Santiago) and Spain (Catalonia) and stud-ies of fishermen and their household members in Zhoushan Island (China),residents of Changchun city in north-east China, secondary-school studentsin Hong Kong Special Administrative Region, frequent seafood consumersin France (Fish and Seafood Consumption Study and Biomarkers of Exposureto Trace Elements, Pollutants and Omega-3, or the CALIPSO study), expo-sures from fish and shellfish in Spain and modelled exposure estimates forfish consumers in the USA.
60
In general, most studies available allowed for the estimation of dietary ex-posure to total mercury from fish and shellfish as well as from other foods.Table 12 summarizes the estimates of mean dietary exposure to total mercuryfrom the total diet, from fish and shellfish, and from other foods extractedfrom the studies listed above. Estimated mean dietary exposure to total mer-cury ranged from 0.07 to 5.81 μg/kg bw per week, while the estimated meandietary exposure to total mercury from fish and shellfish ranged from 0.07 to1.75 μg/kg bw per week. The estimated mean dietary exposure to total mer-cury from foods other than fish and shellfish ranged from 0 to 4.06 μg/kg bwper week. The upper limit of that range corresponds to a subpopulation ofchildren. When only total population or subpopulations of adults wereconsidered, the estimated mean dietary exposure to total mercury from foodsother than fish and shellfish ranged from <0.01 to 1.01 μg/kg bw per week.The main contributors to this average dietary exposure were breads andcereals.
The studies did not provide 90th-percentile estimates of the dietary exposureto total mercury from foods other than fish and shellfish; hence, the 90th-percentile exposure estimates were derived by multiplying the mean exposureestimates by 2. The resulting 90th-percentile exposure to total mercury fromfoods other than fish and shellfish was estimated to range from <0.02 to2.03 μg/kg bw per week for the general population or adult subpopulationsand from <0.02 to 8.12 μg/kg bw per week when children subpopulations areincluded.
The contribution of fish and shellfish to the total dietary exposure rangedfrom 40% to 100% when samples with non-detectable concentrations wereassigned a zero concentration. Estimates of per cent contribution to total di-etary exposure for foods other than fish and shellfish based on dietaryexposure estimates derived from concentration data using the LOR orLOR/2 for non-detects are not reliable because they artificially inflate thecontribution of these foods, particularly when the LOR is high. Only studiesfrom which it was possible to separately estimate the contribution of fish andshellfish and other foods to total dietary exposure to mercury are presentedin Table 12.
It was assumed that the predominant source of inorganic mercury in the dietis foods other than fish and shellfish.
International estimates
The available mercury occurrence data were deemed to be not sufficientlyrepresentative for use in deriving international estimates of dietary exposuresin combination with food consumption from the GEMS/Food consumptioncluster diets. No international estimates of dietary exposure were prepared.
61
Table 12Contribution of fish and shellfish to dietary exposure to total mercury (nationalestimates)
Country Average dietary exposure to total mercury(μg/kg bw per day)
% from fishand shellfish
Total diet Fish andshellfish
Other foods
Estimates derived by assigning a zero value to samples with concentrations belowthe LODAustralia TDS 0.01–0.02 0.01–0.02 0–0 100–100Canada TDS (excludinginfants)
0.01–0.03 0.01–0.02 <0.01–0.02 51–80
Chile (Santiago) 0.06 0.02 0.03 41China (Zhoushan Island) 0.47–0.92 0.41–0.87 0.05–0.10 87–95Japan TDS 0.17 0.16 0.01 92Republic of Korea TDS 0.04 0.03 0.01 76United Kingdom TDS 0.02–0.04a — — —USA TDS 0.01–0.02 0.01–0.02 <0.01–<0.01 96–100Estimates derived by assigning a non-zero value (LOD or LOQ) to samples withconcentrations below the LOD or LOQAustralia TDS 0.08–0.26 0.01–0.02 0.06–0.24 7–17Canada TDS (excludinginfants)
0.01–0.04 <0.01–0.04 0.01–0.03 40–74
Chile (Santiago) 0.08 0.02 0.06 31United Kingdom TDS 0.04–0.12b — — 25Estimates derived by assigning a non-zero value (LOD/2 or LOQ/2) to samples withconcentrations below the LOD or LOQChina TDS 0.08 0.01 0.07 13China (Changchun city) 0.10 0.01 0.09 13France TDS 0.16–0.26c 0.02–0.02 0.15–0.24 9–10New Zealand TDS 0.11–0.16 0.08–0.10 0.03–0.06 65–74Spain (Catalonia) 0.28–0.83 0.12–0.25 0.14–0.58 30–46Range (μg/kg bw per day)d 0.01–0.83 0.01–0.25 0–0.58 —Range (μg/kg bw per week)d 0.07–5.81 0.07–1.75 0–4.06 —
a High exposures (97.5th percentile) ranged from 0.07 to 0.17 μg/kg bw per day.b High exposures (97.5th percentile) ranged from 0.12 to 0.26 μg/kg bw per day.c High exposures (95th percentile) ranged from 0.25 to 0.41 μg/kg bw per day.d Excluding the study of fishermen and their families in Zhoushan Island, China.
Dose–response analysis
Kidney effects are consistently observed in various experimental species(weight changes, proximal tubule damage and progressive nephropathy).Relative kidney weight increases observed in rats following exposure tomercury(II) chloride are also associated with a dose-dependent increasein renal mercury accumulation and with significant changes in the renal
62
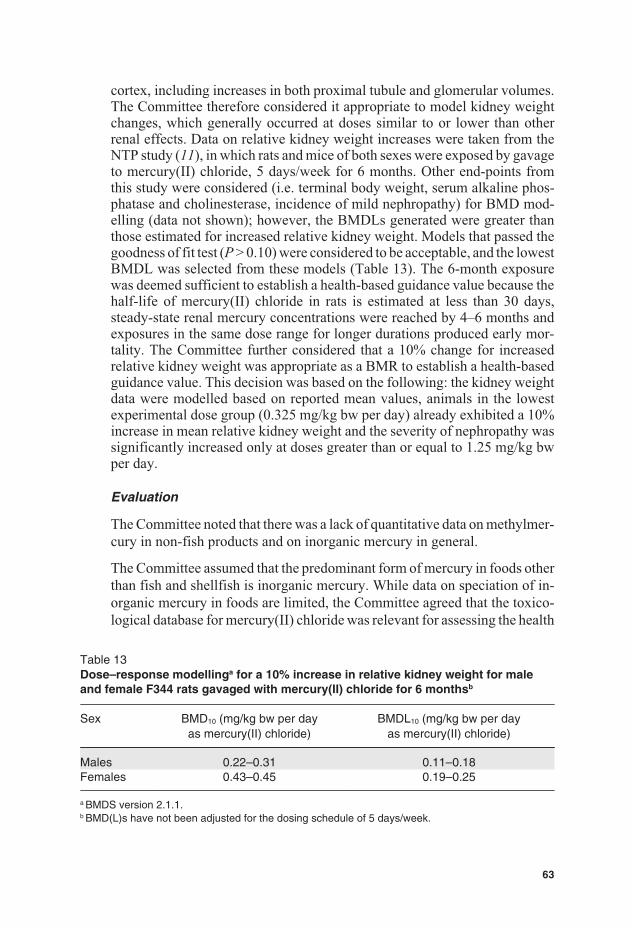
cortex, including increases in both proximal tubule and glomerular volumes.The Committee therefore considered it appropriate to model kidney weightchanges, which generally occurred at doses similar to or lower than otherrenal effects. Data on relative kidney weight increases were taken from theNTP study (11), in which rats and mice of both sexes were exposed by gavageto mercury(II) chloride, 5 days/week for 6 months. Other end-points fromthis study were considered (i.e. terminal body weight, serum alkaline phos-phatase and cholinesterase, incidence of mild nephropathy) for BMD mod-elling (data not shown); however, the BMDLs generated were greater thanthose estimated for increased relative kidney weight. Models that passed thegoodness of fit test (P > 0.10) were considered to be acceptable, and the lowestBMDL was selected from these models (Table 13). The 6-month exposurewas deemed sufficient to establish a health-based guidance value because thehalf-life of mercury(II) chloride in rats is estimated at less than 30 days,steady-state renal mercury concentrations were reached by 4–6 months andexposures in the same dose range for longer durations produced early mor-tality. The Committee further considered that a 10% change for increasedrelative kidney weight was appropriate as a BMR to establish a health-basedguidance value. This decision was based on the following: the kidney weightdata were modelled based on reported mean values, animals in the lowestexperimental dose group (0.325 mg/kg bw per day) already exhibited a 10%increase in mean relative kidney weight and the severity of nephropathy wassignificantly increased only at doses greater than or equal to 1.25 mg/kg bwper day.
Evaluation
The Committee noted that there was a lack of quantitative data on methylmer-cury in non-fish products and on inorganic mercury in general.
The Committee assumed that the predominant form of mercury in foods otherthan fish and shellfish is inorganic mercury. While data on speciation of in-organic mercury in foods are limited, the Committee agreed that the toxico-logical database for mercury(II) chloride was relevant for assessing the health
Table 13Dose–response modellinga for a 10% increase in relative kidney weight for maleand female F344 rats gavaged with mercury(II) chloride for 6 monthsb
Sex BMD10 (mg/kg bw per dayas mercury(II) chloride)
BMDL10 (mg/kg bw per dayas mercury(II) chloride)
Males 0.22–0.31 0.11–0.18Females 0.43–0.45 0.19–0.25
a BMDS version 2.1.1.b BMD(L)s have not been adjusted for the dosing schedule of 5 days/week.
63
risk of foodborne inorganic mercury. The results of the NTP bioassay (11)provided limited evidence for carcinogenicity; however, direct reaction ofmercury(II) chloride with DNA has not been demonstrated. Therefore, settinga health-based guidance value was considered appropriate.
The lowest BMDL10 for relative kidney weight increase in male rats wascalculated to be 0.11 mg/kg bw per day as mercury(II) chloride. This corre-sponds to 0.06 mg/kg bw per day as mercury, adjusted from a 5 days/weekdosing schedule to an average daily dose and for the per cent contribution ofinorganic mercury to mercury(II) chloride dose. After application of a 100-fold uncertainty factor, the Committee established a PTWI for inorganicmercury of 4 μg/kg bw (rounded to one significant number).
The previous PTWI of 5 μg/kg bw for total mercury, established at the six-teenth meeting, was withdrawn.
In the absence of evidence to the contrary, the new PTWI for inorganic mer-cury was considered applicable to dietary exposure to total mercury fromfoods other than fish and shellfish. The upper limits of estimates of averagedietary exposure to total mercury from foods other than fish and shellfish foradults (1 μg/kg bw per week) and for children (4 μg/kg bw per week) wereat or below the PTWI.
A detailed addendum to the monograph was prepared.
Recommendations
There is a need for:
validated analytical methods for both inorganic mercury and methylmer-cury applicable in several food matrices;
more information on the inorganic mercury and methylmercury contentof foods as consumed that mainly contribute to overall dietary exposure.
3.6 Perchlorate
Explanation
The perchlorate ion (ClO4 ) is very stable in water, and its salts are highlysoluble in water. Perchlorate occurs naturally in the environment, in depositsof nitrate and potash, and can be formed in the atmosphere and precipitateinto soil and groundwater. It also occurs as an environmental contaminantarising from the use of nitrate fertilizers and from the manufacture, use anddisposal of ammonium perchlorate (CAS No. 7790-98-9) used in rocket pro-pellants, explosives, fireworks, flares and air-bag inflators and in otherindustrial processes. Perchlorate can also be formed during the degradation
64
of sodium hypochlorite used to disinfect water and can contaminate the watersupply. Water, soil and fertilizers are considered to be potential sources ofperchlorate contamination in food. Potassium perchlorate (CAS No.7778-74-7) has been used as a human therapeutic medicine to treat thyroiddisease.
Perchlorate has not been previously evaluated by the Committee. It was re-ferred to the Committee for evaluation on request of the Second Session ofCCCF (6).
Absorption, distribution, metabolism and excretion
Perchlorate is rapidly absorbed following ingestion and rapidly excreted un-changed, mostly in the urine. It crosses the placenta and is also found in breastmilk.
Relevance of animal data for human risk assessment
The health effects of perchlorate salts are due to the perchlorate ion itself. Inthe studies described below, doses are expressed in terms of perchlorate ion.The primary effect of perchlorate is its ability to competitively inhibit uptakeof iodide by the thyroid gland. The inhibition is at the level of the sodium–iodide symporter (NIS), which actively transports iodide and perchloratefrom the blood into the thyroid gland. Inhibition of iodide uptake by per-chlorate reduces the amount of iodide available for the synthesis of thyroidhormones, resulting in reductions in the concentrations of circulating thy-roxine (T4) and the more biologically active hormone, triiodothyronine (T3).In a negative feedback loop, reductions in the concentrations of T4 and T3
reaching the brain trigger the release of thyrotropin-releasing hormone in thehypothalamus, which, in turn, causes the release of thyrotropin, also knownas thyroid stimulating hormone (TSH), from the anterior pituitary gland. TSHinitiates the events in the thyroid that result in NIS transport of iodide intothe thyroid and synthesis of T3 and T4. Sustained reduction in iodide uptakeby the thyroid may result in hypothyroidism. Hypothyroidism has adverseimplications for structural and functional brain development in the fetus, in-fant and child and for metabolism and the functioning of cardiovascular,gastrointestinal, skeletal, neuromuscular and reproductive systems in adults.
The Committee noted that for substances known to affect the thyroid andhaving a mode of action involving inhibition of the uptake of iodide, the ratis not a good model for humans. This applies not only to the likelihood ofthyroid cancer but also to other perturbations of thyroid physiology andpathology in response to thyroid toxicants. For this reason, the animal datareviewed by the Committee, which comprised mostly data from rats and werequalitatively supportive of the human data, were not further considered forderiving a health-based guidance value for perchlorate.
65
Observations in humans
Human observations include clinical studies on thyroid function in healthyadult volunteers given perchlorate in drinking-water, clinical studies on thy-roid function in workers occupationally exposed to perchlorate for severalyears, population-based epidemiological studies and ecological studies com-paring populations living in areas with differing concentrations of perchloratein the drinking-water. Some of the ecological studies included pregnantwomen, newborns and children and, in the case of newborns, took advantageof neonatal screening programmes that included measurements of serumTSH and/or thyroid hormones. In the various studies, outcome measures in-vestigated included one or more of the following: radiolabelled iodide uptakeby the thyroid, serum TSH and thyroid hormone concentrations, urinaryperchlorate and iodide concentrations, incidence of thyroid diseases, neonatalbirth weight, head circumference and length, incidence of congenital hy-pothyroidism and neurobehavioural measures in children. There are alsohistorical clinical data from past use of perchlorate as a treatment forhyperthyroidism.
None of the ecological studies showed any relationship between perchlorateconcentrations in drinking-water and the incidence of thyroid diseases,including congenital hypothyroidism and thyroid cancer. With respect to TSHand thyroid hormones, one study reported a significant association betweenelevated newborn TSH levels and concentrations of perchlorate in drinking-water. However, it is notable that the concentrations of perchlorate in drink-ing-water in this study were not as high as in other, negative studies onnewborns.
The clinical studies in healthy adult volunteers and workers did not show anysignificant effects on TSH or thyroid hormone concentrations at daily expo-sures of up to 0.5 mg/kg bw per day. From consideration of human clinicalstudies in healthy subjects and studies of long-term treatment of patients withhyperthyroidism, the National Academy of Sciences (NAS) in the USA hasestimated that a sustained exposure to perchlorate of more than 0.4 mg/kg bwper day would probably be necessary in order to trigger hypothyroidism innormal adults. The NAS also commented that in pregnant women, infants,children and people with low iodide intake or pre-existing thyroid dysfunc-tion, the dose of perchlorate required to cause hypothyroidism may be lower.Despite lack of effects on TSH and thyroid hormones, the studies in healthyadult volunteers did show clear, dose-related effects on radiolabelled iodideuptake by the thyroid.
A key issue for human risk assessment is whether a POD for deriving a health-based guidance value for perchlorate should be based on the end-point ofinhibition of thyroidal uptake of iodide or on end-point(s) with clearer
66
implications for adversity, such as increases in TSH, reductions in circulatingthyroid hormone levels and clinical hypothyroidism. Inhibition of iodide up-take by the thyroid is clearly a precursor event in the chain of events thatultimately can lead to adverse effects on thyroid function; by itself, however,it cannot be considered adverse if circulating thyroid hormone levels remainunchanged. The available human data provide support for such a conclusion.For example, for short-term exposure, the 14-day clinical study by Greer andco-workers (12) in healthy adults found no effect on TSH or thyroid hormonesat the highest perchlorate dose tested, 0.5 mg/kg bw per day, despite the ob-servation that the highest dose caused an average 67% inhibition of iodideuptake by the thyroid. For chronic exposure, support is provided by data fromthe two occupational studies, in which about half the participants in each studyhad been exposed for more than 5 years. In one study, perchlorate exposureequivalent to about 0.5 mg/kg bw per day (the same as the highest dose in theGreer et al. study (12)) was not associated with any change in TSH or thyroidhormones; in the other study, in which uptake of radiolabelled iodide by thethyroid was measured, a 38% reduction in iodide uptake was not associatedwith any effect on TSH or thyroid hormones. The NAS review also expressedthe view that uptake of iodide by the thyroid would need to be inhibited byat least 75% for several months or longer in adults with a normal dietaryiodine intake in order to cause declines in thyroid hormone production thatwould have adverse health effects. A further practical constraint in selectingthe end-point is that, with the exception of one study, the human clinical andepidemiological studies on perchlorate did not actually identify any signifi-cant association between perchlorate exposure and changes in TSH andthyroid hormones that could be used for the POD.
A second key issue is to what extent a POD derived from studies in healthyadults relates to potentially more vulnerable groups in the population. Giventhe critical role of thyroid hormones in brain development, it is widely con-sidered that the probability of a permanent adverse effect on neurodevelop-ment from thyroid disruption, including transient disruption, would begreatest during early life. Consideration needs to be given to the differingthyroid physiology in the fetus and neonate compared with that of childrenand adults; for example, the amount of thyroid hormone stored in the colloidin late-gestation fetuses and neonates is estimated to be sufficient for less than1 day only, compared with several months for adults. It is also unclear whethernursing infants may be additionally at risk if perchlorate were to reduce thepassage of iodide into breast milk; at present, there are very few data on this,and what data are available are contradictory.
As perchlorate competitively inhibits iodide uptake by the thyroid, anotherissue for consideration is whether populations living in parts of the worldwhere the diet is deficient in iodine would be more susceptible to perchloratethan iodine-replete individuals. The data on this aspect are sparse. A further
67
consideration is whether individuals, in particular pregnant women, who al-ready have the condition of hypothyroidism or subclinical hypothyroidismmight be additionally affected by low-level perchlorate exposure. The abovesubgroups of the general population are numerically significant.
The Committee also noted that there can be co-exposure in the diet to otherubiquitous anti-thyroid substances with the same mode of action (i.e. com-petitive inhibition at the NIS), such as nitrate or thiocyanate, or with differingmodes of action, such as organochlorines.
Given the mode of action of perchlorate, the key vulnerable groups are likelyto be pregnant women, fetuses, newborns, young infants, those with hy-pothyroidism and possibly those with iodine-deficient diets. As there are nogood quantitative data relating perchlorate dietary exposure to changes inthyroidal iodide uptake, TSH or thyroid hormones in these key groups thatare comparable with the quantitative data obtained in the study by Greer andco-workers (12), these represent significant data gaps and are the majorsources of uncertainty in any population-wide risk assessment. The uncer-tainties discussed above need to be weighed alongside the fact that the PODfor the risk assessment can be based on inhibition of iodide uptake by thethyroid, a precursor event that, at least at low to moderate levels of inhibition,appears to be non-adverse.
Analytical methods
Perchlorate is soluble in water and polar organic solvents and is easily ex-tracted from foods using either water or water–acetonitrile mixtures. Watersamples are analysed directly, whereas food extracts are subjected to solid-phase extraction (SPE) cleanup prior to determination. Analytical methodsused for the detection and determination of perchlorate levels in water andfoods include ion chromatography (IC) with conductivity detector, IC-MS orIC-MS/MS and LC-MS or LC-MS/MS. IC-MS/MS and LC-MS/MS methodsoffer lower detection limits and can be used for the determination of per-chlorate in foods. Stable isotope–labelled perchlorates are used as internalstandards. Currently, certified reference materials are not available, and col-laborative method validation studies have not been conducted. Other meth-ods, such as spectrophotometry, capillary electrophoresis and ion-selectiveelectrode–based potentiometric methods, lack in sensitivity and may not besuitable for detection at lower levels in foods and water. Rapid screeningmethods have not yet been developed. Most survey data in foods have beenobtained using the IC-MS/MS method.
Effects of processing
Limited data are available on the fate of perchlorate during food processing.However, perchlorate is generally stable at temperatures used in foodprocessing.
68
Prevention and control
Reduction of perchlorate in foods and water relies mainly on the control ofcontamination in fertilizers, irrigation systems and water used in food pro-cessing and food preparation. However, washing can reduce surface contam-ination in vegetables and fruits.
Levels and patterns of contamination in food commodities
At the present meeting, the Committee reviewed data from six countries onthe occurrence of perchlorate in water and different foods analysed between2004 and 2009 (Table 14). Analytical data on 35 073 samples of groundwaterand drinking-water indicate that the perchlorate level in 98% of samples wasbelow the LOR. In drinking-water, perchlorate levels exceeded 20 μg/l in 1%of the samples only. The USEPA reported that only 160 out of 3870 watersupplies (4%) had perchlorate levels above the LOR (4 μg/l), in the range of4–420 μg/l, with a mean concentration of 9.9 μg/l; this mean concentrationis the average of the detected concentrations. Analytical data in 1866 samples(vegetables, fruits, rice, milk, infant formula, fish and fish products, andbeverages, such as juices, beer and wine) were reviewed, and perchloratelevels in 33% of samples were found to be below the LOR. Weighted mean(mean of reported mean levels weighted by number of samples) perchloratelevels in raw vegetables were in the range of 4.8–110 μg/kg (potato,4.8 μg/kg; carrot, 6.6 μg/kg; spinach, 110 μg/kg; lettuce, 11.6 μg/kg; tomato,14 μg/kg; squash, 75 μg/kg; eggplant, 78 μg/kg; broccoli, 19 μg/kg;cauliflower, 7 μg/kg; cabbage, 10 μg/kg); in fruits, the weighted mean levelsranged from 0.5 to 28 μg/kg (oranges, 5 μg/kg; apples, 0.5 μg/kg; grapes,28 μg/kg; melons, 19 μg/kg). Other weighted mean perchlorate levels wereas follows: rice, 1 μg/kg; whole wheat flour, 3.5 μg/kg; milk, 6.8 μg/kg; beer,1 μg/kg; and wine, 6 μg/kg. The mean perchlorate levels in human milk inChina (n = 24 composite samples, with each composite sample representingmilk from 50 mothers) and the USA (n = 652) were found to be 19.7 μg/l(range 2.1–136 μg/l) and 9.3 μg/l (range 0.01–411 μg/l), respectively. Lim-ited data show that the weighted mean perchlorate level in infant formula was10 μg/kg. The Committee noted that sampling and analysis were carried outon targeted foods. However, general surveys involving a broader range offoods in different countries were lacking. In view of the widespread presenceof perchlorate in the environment, it is probable that it will be found morewidely in drinking-water and food.
Food consumption and dietary exposure assessment
The Committee evaluated occurrence and dietary exposure data for perchlor-ate from submissions from China, Japan, Canada and the USA and from theliterature. International estimates of dietary exposure were prepared usingfood consumption information from the 13 GEMS/Food consumption clusterdiets and perchlorate concentrations discussed above. The range of estimated
69
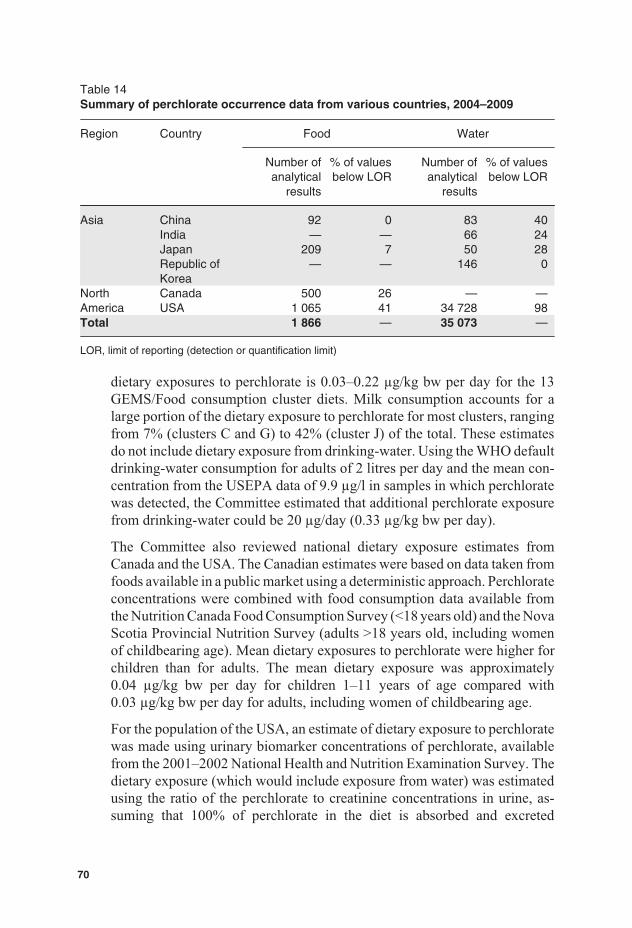
Table 14Summary of perchlorate occurrence data from various countries, 2004–2009
Region Country Food Water
Number ofanalytical
results
% of valuesbelow LOR
Number ofanalytical
results
% of valuesbelow LOR
Asia China 92 0 83 40India — — 66 24Japan 209 7 50 28Republic ofKorea
— — 146 0
NorthAmerica
Canada 500 26 — —USA 1 065 41 34 728 98
Total 1 866 — 35 073 —
LOR, limit of reporting (detection or quantification limit)
dietary exposures to perchlorate is 0.03–0.22 μg/kg bw per day for the 13GEMS/Food consumption cluster diets. Milk consumption accounts for alarge portion of the dietary exposure to perchlorate for most clusters, rangingfrom 7% (clusters C and G) to 42% (cluster J) of the total. These estimatesdo not include dietary exposure from drinking-water. Using the WHO defaultdrinking-water consumption for adults of 2 litres per day and the mean con-centration from the USEPA data of 9.9 μg/l in samples in which perchloratewas detected, the Committee estimated that additional perchlorate exposurefrom drinking-water could be 20 μg/day (0.33 μg/kg bw per day).
The Committee also reviewed national dietary exposure estimates fromCanada and the USA. The Canadian estimates were based on data taken fromfoods available in a public market using a deterministic approach. Perchlorateconcentrations were combined with food consumption data available fromthe Nutrition Canada Food Consumption Survey (<18 years old) and the NovaScotia Provincial Nutrition Survey (adults >18 years old, including womenof childbearing age). Mean dietary exposures to perchlorate were higher forchildren than for adults. The mean dietary exposure was approximately0.04 μg/kg bw per day for children 1–11 years of age compared with0.03 μg/kg bw per day for adults, including women of childbearing age.
For the population of the USA, an estimate of dietary exposure to perchloratewas made using urinary biomarker concentrations of perchlorate, availablefrom the 2001–2002 National Health and Nutrition Examination Survey. Thedietary exposure (which would include exposure from water) was estimatedusing the ratio of the perchlorate to creatinine concentrations in urine, as-suming that 100% of perchlorate in the diet is absorbed and excreted
70
unmetabolized. The 50th-percentile estimate for the total adult populationwas 0.06 μg/kg bw per day, whereas the 95th-percentile estimate was0.23 μg/kg bw per day.
An analysis of perchlorate dietary exposures in the USA from the USFDA’sTDS from 2003–2008 was submitted to the Committee. The mean estimatesfor all age subgroups 14 and over were approximately 0.1 μg/kg bw per day,with 90th-percentile estimates less than 0.23 μg/kg bw per day. Dietary ex-posure was greatest for 2-year-olds; the mean exposure for this group was0.44 μg/kg bw per day, with a 90th-percentile exposure of 0.73 μg/kg bwper day.
The Committee concluded that the analyses from the USFDA’s TDS providethe best estimates of dietary exposure to perchlorate, as they do not dependon analyses of raw commodities and include water and beverages made fromwater that might be contaminated with perchlorate. Although all of the na-tional estimates are in general agreement, the Committee noted that thehighest estimates were from the TDS, suggesting that the other estimates (andthe international estimates prepared by the Committee) may not include alldietary sources of perchlorate.
The highest estimate of dietary exposure from the USFDA’s TDS of0.7 μg/kg bw per day for 2-year-old children and the mean estimate of0.1 μg/kg bw per day for those 14 years of age and older were chosen forcomparison with the health-based guidance value.
Dose–response analysis
The pivotal study for dose–response analysis was the human clinical studyon 16 male and 21 female healthy adult volunteers published by Greer andco-workers in 2002 (12), in which perchlorate was given in drinking-waterat doses of 0.007, 0.02, 0.1 or 0.5 mg/kg bw per day for 14 days. The uptakeof iodide into the thyroid was measured at baseline before administration ofperchlorate and on days 2 and 14 of administration at both 8 and 24 h afteradministration of radiolabelled iodine. These data were used for modelling.
The Committee selected a critical effect size of 50% inhibition of iodide up-take as the BMR. This choice was made because human clinical data fromhealthy adults following both short-term and chronic exposure to perchloratehave shown that such a level of inhibition is not associated with any changesin TSH or thyroid hormone levels. The Committee noted that a BMR of 50%inhibition was within the observed range of the study.
PROAST software (version 23.2) for analysis of continuous data was used.In the clinical study, each subject served as his or her own control, with base-line values measured 1 day before the start of the 14-day perchlorate exposure
71
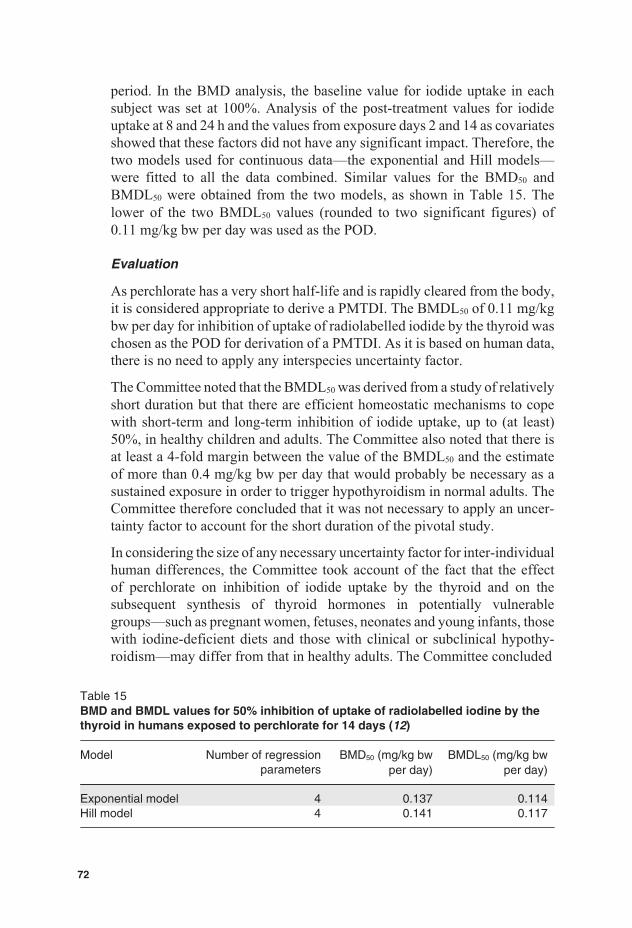
period. In the BMD analysis, the baseline value for iodide uptake in eachsubject was set at 100%. Analysis of the post-treatment values for iodideuptake at 8 and 24 h and the values from exposure days 2 and 14 as covariatesshowed that these factors did not have any significant impact. Therefore, thetwo models used for continuous data—the exponential and Hill models—were fitted to all the data combined. Similar values for the BMD50 andBMDL50 were obtained from the two models, as shown in Table 15. Thelower of the two BMDL50 values (rounded to two significant figures) of0.11 mg/kg bw per day was used as the POD.
Evaluation
As perchlorate has a very short half-life and is rapidly cleared from the body,it is considered appropriate to derive a PMTDI. The BMDL50 of 0.11 mg/kgbw per day for inhibition of uptake of radiolabelled iodide by the thyroid waschosen as the POD for derivation of a PMTDI. As it is based on human data,there is no need to apply any interspecies uncertainty factor.
The Committee noted that the BMDL50 was derived from a study of relativelyshort duration but that there are efficient homeostatic mechanisms to copewith short-term and long-term inhibition of iodide uptake, up to (at least)50%, in healthy children and adults. The Committee also noted that there isat least a 4-fold margin between the value of the BMDL50 and the estimateof more than 0.4 mg/kg bw per day that would probably be necessary as asustained exposure in order to trigger hypothyroidism in normal adults. TheCommittee therefore concluded that it was not necessary to apply an uncer-tainty factor to account for the short duration of the pivotal study.
In considering the size of any necessary uncertainty factor for inter-individualhuman differences, the Committee took account of the fact that the effectof perchlorate on inhibition of iodide uptake by the thyroid and on thesubsequent synthesis of thyroid hormones in potentially vulnerablegroups—such as pregnant women, fetuses, neonates and young infants, thosewith iodine-deficient diets and those with clinical or subclinical hypothy-roidism—may differ from that in healthy adults. The Committee concluded
Table 15BMD and BMDL values for 50% inhibition of uptake of radiolabelled iodine by thethyroid in humans exposed to perchlorate for 14 days (12)
Model Number of regressionparameters
BMD50 (mg/kg bwper day)
BMDL50 (mg/kg bwper day)
Exponential model 4 0.137 0.114Hill model 4 0.141 0.117
72
that an uncertainty factor of 10 would be appropriate to cover any differencesin the general population, including those in potentially vulnerable sub-groups. Applying this 10-fold factor to the BMDL50 and rounding to onesignificant figure, a PMTDI of 0.01 mg/kg bw was established for perchlo-rate.
The estimated dietary exposures of 0.7 μg/kg bw per day (highest) and0.1 μg/kg bw per day (mean), including both food and drinking-water, arewell below the PMTDI. The Committee considered that these estimateddietary exposures were not of health concern.
A detailed monograph was prepared.
73

4. Future work
The Committee recognized that the use of dose–response modelling is a de-veloping field and recommends to the Joint FAO/WHO Secretariat that anexpert working group be established to review progress and develop detailedguidance for the application of the methods most suitable to the work of theCommittee. The working group should, inter alia, address the followingaspects:
the use of constraints when modelling;
the weighting of model outcomes and model averaging;
goodness of fit criteria;
how human data might be used for dose–response modelling to derive aPOD;
presentation of modelling outcomes in JECFA publications.
75

5. Recommendations
Exposure
The seventy-second meeting of the Committee evaluated six contaminantsoccurring in various foods. The Committee noted that for a considered con-taminant, the occurrence data were not always submitted by Member Statesusing a food classification system allowing a direct combination with theGEMS/Food consumption cluster diets.
The Committee recommends that Member States submit occurrence data inaccordance with the Codex Alimentarius Commission classification for con-taminants. The Committee also recommends that WHO update the GEMS/Food system for data reporting (OPAL) to simplify the submission of occur-rence data in standard electronic files.
Acrylamide
The Committee recommends further efforts on developing and implementingmitigation methods for acrylamide in foods of major importance for dietaryexposure.
To better estimate the risk from acrylamide in food for humans, the Com-mittee recommends that longitudinal studies on intra-individual levels ofacrylamide and glycidamide haemoglobin adducts be measured over time inrelation to concurrent dietary exposure. Such data would provide a betterestimate of acrylamide exposure for epidemiological studies designed to as-sess risk from the diet.
Arsenic
There is a need for validated methods for selective extraction and determi-nation of inorganic arsenic in food matrices and for certified referencematerials for inorganic arsenic.
There is a need for improved data on occurrence of different species of arsenicin, and their bioavailability from, different foods as consumed in order to
77
improve the estimates of dietary and systemic exposure. Further informationon the toxicity of arsenic species found in food is also required.
The Committee recommends that future epidemiological studies of the healthimpacts of arsenic should incorporate appropriate measures of total exposureto inorganic arsenic, including from food and from water used in cooking andprocessing of food.
The Committee further recommends that epidemiological studies not onlyfocus on relative risks, but also analyse and report the data such that they aresuitable for estimating exposure levels associated with additional (lifetime)risks, so as to make their results usable for quantitative risk assessment.
DON
As DON-3-glucoside has been detected in cereals and beers and might there-fore contribute to systemic exposure to DON, the Committee recommendsthat ADME studies be conducted on this substance.
Additional data on the occurrence of and the effects of processing on3-Ac-DON, 15-Ac-DON and DON-3-glucoside are needed, as well as theirco-occurrence with DON.
Mercury
There is a need for:
validated analytical methods for both inorganic mercury and methylmer-cury applicable in several food matrices;
more information on the inorganic mercury and methylmercury contentof foods as consumed that mainly contribute to overall dietary exposure.
78

Acknowledgement
The Committee wishes to thank Ms M. Sheffer, Ottawa, Canada, for herassistance in the preparation of the report.
79

References
1. FAO/WHO. Joint FAO/WHO Conference on Food Additives. Rome,Food and Agriculture Organization of the United Nations, 1956 (FAONutrition Meetings Report Series, No. 11); Geneva, World HealthOrganization, 1956 (WHO Technical Report Series, No. 107).
2. Benford D, DiNovi M, Setzer RW. Application of the margin ofexposure (MoE) approach to substances in food that are genotoxic andcarcinogenic. Food and Chemical Toxicology, 2010, 48(Suppl. 1):S42–S48.
3. National Center for Toxicological Research/National ToxicologyProgram. Chronic carcinogenicity bioassays of acrylamide andglycidamide in male and female B6C3F1 mice and Fischer 344 rats.Unpublished study. Submitted to WHO by the National Center forToxicological Research, United States Food and Drug Administration,Jefferson, AK, 2010.
4. Chen CL et al. Ingested arsenic, characteristics of well waterconsumption and risk of different histological types of lung cancer innortheastern Taiwan. Environmental Research, 2010, 110(5):455–462.
5. Chen CL et al. Arsenic in drinking water and risk of urinary tract cancer:a follow-up study from northeastern Taiwan. Cancer Epidemiology,Biomarkers & Prevention, 2010, 19(1):101–110.
6. FAO/WHO. Report of the 2nd Session of the Codex Committee onContaminants in Foods, The Hague, The Netherlands, 31 March – 4April 2008. Rome, Food and Agriculture Organization of the UnitedNations, Joint FAO/WHO Food Standards Programme, CodexAlimentarius Commission, 2008 (ALINORM 08/31/41; http://www.codexalimentarius.net/download/report/700/al31_41e.pdf).
7. Young LG et al. Vomitoxin in corn fed to young pigs. Journal of AnimalScience, 1983, 57:655–664.
8. Pollmann DS et al. Deoxynivalenol-contaminated wheat in swine diets.Journal of Animal Science, 1985, 60:239–247.
81
9. National Toxicology Program. Toxicology and carcinogenesis studiesof furan (CAS No. 110-00-9) in F344 rats and B6C3F1 mice (gavagestudies). Research Triangle Park, NC, United States Department ofHealth and Human Services, Public Health Service, National Institutesof Health, National Toxicology Program, 1993:1–286 (NTP TechnicalReport Series, No. 402; NIH Publication No. 93-2857).
10. Moser GJ et al. Furan-induced dose–response relationships for livercytotoxicity, cell proliferation and tumorigenicity (furan-induced livertumorigenicity). Experimental and Toxicologic Pathology, 2009,61:101–111.
11. National Toxicology Program. Toxicology and carcinogenesis studiesof mercuric chloride (CAS No. 7487-94-7) in F344 rats and B3C3F1mice (gavage studies). Research Triangle Park, NC, United StatesDepartment of Health and Human Services, Public Health Service,National Institutes of Health, National Toxicology Program, 1993 (NTPTechnical Report Series, No. 408).
12. Greer MA et al. Health effects assessment for environmentalperchlorate contamination: the dose response for inhibition of thyroidalradioiodine uptake in humans. Environmental Health Perspectives,2002, 110:927–937.
82
Annex 1Reports and other documentsresulting from previous meetings ofthe Joint FAO/WHO ExpertCommittee on Food Additives
1. General principles governing the use of food additives (First report ofthe Joint FAO/WHO Expert Committee on Food Additives). FAONutrition Meetings Report Series, No. 15, 1957; WHO TechnicalReport Series, No. 129, 1957 (out of print).
2. Procedures for the testing of intentional food additives to establishtheir safety for use (Second report of the Joint FAO/WHO ExpertCommittee on Food Additives). FAO Nutrition Meetings ReportSeries, No. 17, 1958; WHO Technical Report Series, No. 144, 1958(out of print).
3. Specifications for identity and purity of food additives (antimicrobialpreservatives and antioxidants) (Third report of the Joint FAO/WHOExpert Committee on Food Additives). These specifications weresubsequently revised and published as Specifications for identity andpurity of food additives, Vol. I. Antimicrobial preservatives andantioxidants, Rome, Food and Agriculture Organization of the UnitedNations, 1962 (out of print).
4. Specifications for identity and purity of food additives (food colours)(Fourth report of the Joint FAO/WHO Expert Committee on FoodAdditives). These specifications were subsequently revised andpublished as Specifications for identity and purity of food additives,Vol. II. Food colours, Rome, Food and Agriculture Organization of theUnited Nations, 1963 (out of print).
5. Evaluation of the carcinogenic hazards of food additives (Fifth reportof the Joint FAO/WHO Expert Committee on Food Additives). FAONutrition Meetings Report Series, No. 29, 1961; WHO TechnicalReport Series, No. 220, 1961 (out of print).
6. Evaluation of the toxicity of a number of antimicrobials andantioxidants (Sixth report of the Joint FAO/WHO Expert Committeeon Food Additives). FAO Nutrition Meetings Report Series, No. 31,1962; WHO Technical Report Series, No. 228, 1962 (out of print).
83
7. Specifications for the identity and purity of food additives and theirtoxicological evaluation: emulsifiers, stabilizers, bleaching andmaturing agents (Seventh report of the Joint FAO/WHO ExpertCommittee on Food Additives). FAO Nutrition Meetings Series, No.35, 1964; WHO Technical Report Series, No. 281, 1964 (out of print).
8. Specifications for the identity and purity of food additives and theirtoxicological evaluation: food colours and some antimicrobials andantioxidants (Eighth report of the Joint FAO/WHO Expert Committeeon Food Additives). FAO Nutrition Meetings Series, No. 38, 1965;WHO Technical Report Series, No. 309, 1965 (out of print).
9. Specifications for identity and purity and toxicological evaluation ofsome antimicrobials and antioxidants. FAO Nutrition Meetings ReportSeries, No. 38A, 1965; WHO/Food Add/24.65 (out of print).
10. Specifications for identity and purity and toxicological evaluation offood colours. FAO Nutrition Meetings Report Series, No. 38B, 1966;WHO/Food Add/66.25.
11. Specifications for the identity and purity of food additives and theirtoxicological evaluation: some antimicrobials, antioxidants,emulsifiers, stabilizers, flour treatment agents, acids, and bases (Ninthreport of the Joint FAO/WHO Expert Committee on Food Additives).FAO Nutrition Meetings Series, No. 40, 1966; WHO Technical ReportSeries, No. 339, 1966 (out of print).
12. Toxicological evaluation of some antimicrobials, antioxidants,emulsifiers, stabilizers, flour treatment agents, acids, and bases. FAONutrition Meetings Report Series, No. 40A, B, C; WHO/Food Add/67.29.
13. Specifications for the identity and purity of food additives and theirtoxicological evaluation: some emulsifiers and stabilizers and certainother substances (Tenth report of the Joint FAO/WHO ExpertCommittee on Food Additives). FAO Nutrition Meetings Series, No.43, 1967; WHO Technical Report Series, No. 373, 1967.
14. Specifications for the identity and purity of food additives and theirtoxicological evaluation: some flavouring substances and nonnutritive sweetening agents (Eleventh report of the Joint FAO/WHOExpert Committee on Food Additives). FAO Nutrition Meetings Series,No. 44, 1968; WHO Technical Report Series, No. 383, 1968.
15. Toxicological evaluation of some flavouring substances and nonnutritive sweetening agents. FAO Nutrition Meetings Report Series,No. 44A, 1968; WHO/Food Add/68.33.
84
16. Specifications and criteria for identity and purity of some flavouringsubstances and non-nutritive sweetening agents. FAO NutritionMeetings Report Series, No. 44B, 1969; WHO/Food Add/69.31.
17. Specifications for the identity and purity of food additives and theirtoxicological evaluation: some antibiotics (Twelfth report of the JointFAO/WHO Expert Committee on Food Additives). FAO NutritionMeetings Series, No. 45, 1969; WHO Technical Report Series, No. 430,1969.
18. Specifications for the identity and purity of some antibiotics. FAONutrition Meetings Series, No. 45A, 1969; WHO/Food Add/69.34.
19. Specifications for the identity and purity of food additives and theirtoxicological evaluation: some food colours, emulsifiers, stabilizers,anticaking agents, and certain other substances (Thirteenth report ofthe Joint FAO/WHO Expert Committee on Food Additives). FAONutrition Meetings Series, No. 46, 1970; WHO Technical ReportSeries, No. 445, 1970.
20. Toxicological evaluation of some food colours, emulsifiers, stabilizers,anticaking agents, and certain other substances. FAO NutritionMeetings Report Series, No. 46A, 1970; WHO/Food Add/70.36.
21. Specifications for the identity and purity of some food colours,emulsifiers, stabilizers, anticaking agents, and certain other foodadditives. FAO Nutrition Meetings Report Series, No. 46B, 1970;WHO/Food Add/70.37.
22. Evaluation of food additives: specifications for the identity and purityof food additives and their toxicological evaluation: some extractionsolvents and certain other substances; and a review of the technologicalefficacy of some antimicrobial agents (Fourteenth report of the JointFAO/WHO Expert Committee on Food Additives). FAO NutritionMeetings Series, No. 48, 1971; WHO Technical Report Series, No. 462,1971.
23. Toxicological evaluation of some extraction solvents and certainother substances. FAO Nutrition Meetings Report Series, No. 48A,1971; WHO/Food Add/70.39.
24. Specifications for the identity and purity of some extraction solventsand certain other substances. FAO Nutrition Meetings Report Series,No. 48B, 1971; WHO/Food Add/70.40.
85
25. A review of the technological efficacy of some antimicrobial agents.FAO Nutrition Meetings Report Series, No. 48C, 1971; WHO/FoodAdd/70.41.
26. Evaluation of food additives: some enzymes, modified starches, andcertain other substances: Toxicological evaluations andspecifications and a review of the technological efficacy of someantioxidants (Fifteenth report of the Joint FAO/WHO ExpertCommittee on Food Additives). FAO Nutrition Meetings Series,No. 50, 1972; WHO Technical Report Series, No. 488, 1972.
27. Toxicological evaluation of some enzymes, modified starches, andcertain other substances. FAO Nutrition Meetings Report Series,No. 50A, 1972; WHO Food Additives Series, No. 1, 1972.
28. Specifications for the identity and purity of some enzymes and certainother substances. FAO Nutrition Meetings Report Series, No. 50B,1972; WHO Food Additives Series, No. 2, 1972.
29. A review of the technological efficacy of some antioxidants andsynergists. FAO Nutrition Meetings Report Series, No. 50C, 1972;WHO Food Additives Series, No. 3, 1972.
30. Evaluation of certain food additives and the contaminants mercury,lead, and cadmium (Sixteenth report of the Joint FAO/WHO ExpertCommittee on Food Additives). FAO Nutrition Meetings Series,No. 51, 1972; WHO Technical Report Series, No. 505, 1972, andcorrigendum.
31. Evaluation of mercury, lead, cadmium and the food additivesamaranth, diethylpyrocarbamate, and octyl gallate. FAO NutritionMeetings Report Series, No. 51A, 1972; WHO Food Additives Series,No. 4, 1972.
32. Toxicological evaluation of certain food additives with a review ofgeneral principles and of specifications (Seventeenth report of the JointFAO/WHO Expert Committee on Food Additives). FAO NutritionMeetings Series, No. 53, 1974; WHO Technical Report Series, No. 539,1974, and corrigendum (out of print).
33. Toxicological evaluation of some food additives including anticakingagents, antimicrobials, antioxidants, emulsifiers, and thickeningagents. FAO Nutrition Meetings Report Series, No. 53A, 1974; WHOFood Additives Series, No. 5, 1974.
86
34. Specifications for identity and purity of thickening agents, anticakingagents, antimicrobials, antioxidants and emulsifiers. FAO Food andNutrition Paper, No. 4, 1978.
35. Evaluation of certain food additives (Eighteenth report of the JointFAO/WHO Expert Committee on Food Additives). FAO NutritionMeetings Series, No. 54, 1974; WHO Technical Report Series, No. 557,1974, and corrigendum.
36. Toxicological evaluation of some food colours, enzymes, flavourenhancers, thickening agents, and certain other food additives. FAONutrition Meetings Report Series, No. 54A, 1975; WHO FoodAdditives Series, No. 6, 1975.
37. Specifications for the identity and purity of some food colours,enhancers, thickening agents, and certain food additives. FAONutrition Meetings Report Series, No. 54B, 1975; WHO FoodAdditives Series, No. 7, 1975.
38. Evaluation of certain food additives: some food colours, thickeningagents, smoke condensates, and certain other substances (Nineteenthreport of the Joint FAO/WHO Expert Committee on Food Additives).FAO Nutrition Meetings Series, No. 55, 1975; WHO Technical ReportSeries, No. 576, 1975.
39. Toxicological evaluation of some food colours, thickening agents,and certain other substances. FAO Nutrition Meetings Report Series,No. 55A, 1975; WHO Food Additives Series, No. 8, 1975.
40. Specifications for the identity and purity of certain food additives. FAONutrition Meetings Report Series, No. 55B, 1976; WHO FoodAdditives Series, No. 9, 1976.
41. Evaluation of certain food additives (Twentieth report of the Joint FAO/WHO Expert Committee on Food Additives). FAO Food and NutritionMeetings Series, No. 1, 1976; WHO Technical Report Series, No. 599,1976.
42. Toxicological evaluation of certain food additives. WHO FoodAdditives Series, No. 10, 1976.
43. Specifications for the identity and purity of some food additives. FAOFood and Nutrition Series, No. 1B, 1977; WHO Food Additives Series,No. 11, 1977.
44. Evaluation of certain food additives (Twenty-first report of the JointFAO/WHO Expert Committee on Food Additives). WHO TechnicalReport Series, No. 617, 1978.
87
45. Summary of toxicological data of certain food additives. WHO FoodAdditives Series, No. 12, 1977.
46. Specifications for identity and purity of some food additives,including antioxidant, food colours, thickeners, and others. FAONutrition Meetings Report Series, No. 57, 1977.
47. Evaluation of certain food additives and contaminants (Twenty-secondreport of the Joint FAO/WHO Expert Committee on Food Additives).WHO Technical Report Series, No. 631, 1978.
48. Summary of toxicological data of certain food additives andcontaminants. WHO Food Additives Series, No. 13, 1978.
49. Specifications for the identity and purity of certain food additives. FAOFood and Nutrition Paper, No. 7, 1978.
50. Evaluation of certain food additives (Twenty-third report of the JointFAO/WHO Expert Committee on Food Additives). WHO TechnicalReport Series, No. 648, 1980, and corrigenda.
51. Toxicological evaluation of certain food additives. WHO FoodAdditives Series, No. 14, 1980.
52. Specifications for identity and purity of food colours, flavouring agents,and other food additives. FAO Food and Nutrition Paper, No. 12, 1979.
53. Evaluation of certain food additives (Twenty-fourth report of the JointFAO/WHO Expert Committee on Food Additives). WHO TechnicalReport Series, No. 653, 1980.
54. Toxicological evaluation of certain food additives. WHO FoodAdditives Series, No. 15, 1980.
55. Specifications for identity and purity of food additives (sweeteningagents, emulsifying agents, and other food additives). FAO Food andNutrition Paper, No. 17, 1980.
56. Evaluation of certain food additives (Twenty-fifth report of the JointFAO/WHO Expert Committee on Food Additives). WHO TechnicalReport Series, No. 669, 1981.
57. Toxicological evaluation of certain food additives. WHO FoodAdditives Series, No. 16, 1981.
58. Specifications for identity and purity of food additives (carrier solvents,emulsifiers and stabilizers, enzyme preparations, flavouring agents,food colours, sweetening agents, and other food additives). FAO Foodand Nutrition Paper, No. 19, 1981.
88
59. Evaluation of certain food additives and contaminants (Twenty-sixthreport of the Joint FAO/WHO Expert Committee on Food Additives).WHO Technical Report Series, No. 683, 1982.
60. Toxicological evaluation of certain food additives. WHO FoodAdditives Series, No. 17, 1982.
61. Specifications for the identity and purity of certain food additives. FAOFood and Nutrition Paper, No. 25, 1982.
62. Evaluation of certain food additives and contaminants (Twenty-seventh report of the Joint FAO/WHO Expert Committee on FoodAdditives). WHO Technical Report Series, No. 696, 1983, andcorrigenda.
63. Toxicological evaluation of certain food additives and contaminants.WHO Food Additives Series, No. 18, 1983.
64. Specifications for the identity and purity of certain food additives. FAOFood and Nutrition Paper, No. 28, 1983.
65. Guide to specifications — General notices, general methods,identification tests, test solutions, and other reference materials. FAOFood and Nutrition Paper, No. 5, Rev. 1, 1983.
66. Evaluation of certain food additives and contaminants (Twenty-eighthreport of the Joint FAO/WHO Expert Committee on Food Additives).WHO Technical Report Series, No. 710, 1984, and corrigendum.
67. Toxicological evaluation of certain food additives and contaminants.WHO Food Additives Series, No. 19, 1984.
68. Specifications for the identity and purity of food colours. FAO Foodand Nutrition Paper, No. 31/1, 1984.
69. Specifications for the identity and purity of food additives. FAO Foodand Nutrition Paper, No. 31/2, 1984.
70. Evaluation of certain food additives and contaminants (Twenty-ninthreport of the Joint FAO/WHO Expert Committee on Food Additives).WHO Technical Report Series, No. 733, 1986, and corrigendum.
71. Specifications for the identity and purity of certain food additives. FAOFood and Nutrition Paper, No. 34, 1986.
72. Toxicological evaluation of certain food additives and contaminants.WHO Food Additives Series, No. 20. Cambridge University Press,1987.
89
73. Evaluation of certain food additives and contaminants (Thirtieth reportof the Joint FAO/WHO Expert Committee on Food Additives). WHOTechnical Report Series, No. 751, 1987.
74. Toxicological evaluation of certain food additives and contaminants.WHO Food Additives Series, No. 21. Cambridge University Press,1987.
75. Specifications for the identity and purity of certain food additives. FAOFood and Nutrition Paper, No. 37, 1986.
76. Principles for the safety assessment of food additives and contaminantsin food. WHO Environmental Health Criteria, No. 70. Geneva, WorldHealth Organization, 1987 (out of print). The full text is availableelectronically at www.who.int/pcs.
77. Evaluation of certain food additives and contaminants (Thirty-firstreport of the Joint FAO/WHO Expert Committee on Food Additives).WHO Technical Report Series, No. 759, 1987, and corrigendum.
78. Toxicological evaluation of certain food additives. WHO FoodAdditives Series, No. 22. Cambridge University Press, 1988.
79. Specifications for the identity and purity of certain food additives. FAOFood and Nutrition Paper, No. 38, 1988.
80. Evaluation of certain veterinary drug residues in food (Thirty-secondreport of the Joint FAO/WHO Expert Committee on Food Additives).WHO Technical Report Series, No. 763, 1988.
81. Toxicological evaluation of certain veterinary drug residues in food.WHO Food Additives Series, No. 23. Cambridge University Press,1988.
82. Residues of some veterinary drugs in animals and foods. FAO Foodand Nutrition Paper, No. 41, 1988.
83. Evaluation of certain food additives and contaminants (Thirty-thirdreport of the Joint FAO/WHO Expert Committee on Food Additives).WHO Technical Report Series, No. 776, 1989.
84. Toxicological evaluation of certain food additives and contaminants.WHO Food Additives Series, No. 24. Cambridge University Press,1989.
85. Evaluation of certain veterinary drug residues in food (Thirty-fourthreport of the Joint FAO/WHO Expert Committee on Food Additives).WHO Technical Report Series, No. 788, 1989.
90
86. Toxicological evaluation of certain veterinary drug residues in food.WHO Food Additives Series, No. 25, 1990.
87. Residues of some veterinary drugs in animals and foods. FAO Foodand Nutrition Paper, No. 41/2, 1990.
88. Evaluation of certain food additives and contaminants (Thirty-fifthreport of the Joint FAO/WHO Expert Committee on Food Additives).WHO Technical Report Series, No. 789, 1990, and corrigenda.
89. Toxicological evaluation of certain food additives and contaminants.WHO Food Additives Series, No. 26, 1990.
90. Specifications for identity and purity of certain food additives. FAOFood and Nutrition Paper, No. 49, 1990.
91. Evaluation of certain veterinary drug residues in food (Thirty-sixthreport of the Joint FAO/WHO Expert Committee on Food Additives).WHO Technical Report Series, No. 799, 1990.
92. Toxicological evaluation of certain veterinary drug residues in food.WHO Food Additives Series, No. 27, 1991.
93. Residues of some veterinary drugs in animals and foods. FAO Foodand Nutrition Paper, No. 41/3, 1991.
94. Evaluation of certain food additives and contaminants (Thirty-seventhreport of the Joint FAO/WHO Expert Committee on Food Additives).WHO Technical Report Series, No. 806, 1991, and corrigenda.
95. Toxicological evaluation of certain food additives and contaminants.WHO Food Additives Series, No. 28, 1991.
96. Compendium of food additive specifications (Joint FAO/WHO ExpertCommittee on Food Additives (JECFA)). Combined specificationsfrom 1st through the 37th meetings, 1956–1990. Rome, Food andAgriculture Organization of the United Nations, 1992 (2 volumes).
97. Evaluation of certain veterinary drug residues in food (Thirty-eighthreport of the Joint FAO/WHO Expert Committee on Food Additives).WHO Technical Report Series, No. 815, 1991.
98. Toxicological evaluation of certain veterinary residues in food. WHOFood Additives Series, No. 29, 1991.
99. Residues of some veterinary drugs in animals and foods. FAO Foodand Nutrition Paper, No. 41/4, 1991.
91
100. Guide to specifications — General notices, general analyticaltechniques, identification tests, test solutions, and other referencematerials. FAO Food and Nutrition Paper, No. 5, Ref. 2, 1991.
101. Evaluation of certain food additives and naturally occurringtoxicants (Thirty-ninth report of the Joint FAO/WHO ExpertCommittee on Food Additives). WHO Technical Report Series No.828, 1992.
102. Toxicological evaluation of certain food additives and naturallyoccurring toxicants. WHO Food Additives Series, No. 30, 1993.
103. Compendium of food additive specifications: addendum 1. FAO Foodand Nutrition Paper, No. 52, 1992.
104. Evaluation of certain veterinary drug residues in food (Fortieth reportof the Joint FAO/WHO Expert Committee on Food Additives). WHOTechnical Report Series, No. 832, 1993.
105. Toxicological evaluation of certain veterinary drug residues in food.WHO Food Additives Series, No. 31, 1993.
106. Residues of some veterinary drugs in animals and food. FAO Food andNutrition Paper, No. 41/5, 1993.
107. Evaluation of certain food additives and contaminants (Forty-firstreport of the Joint FAO/WHO Expert Committee on Food Additives).WHO Technical Report Series, No. 837, 1993.
108. Toxicological evaluation of certain food additives and contaminants.WHO Food Additives Series, No. 32, 1993.
109. Compendium of food additive specifications: addendum 2. FAO Foodand Nutrition Paper, No. 52, Add. 2, 1993.
110. Evaluation of certain veterinary drug residues in food (Forty-secondreport of the Joint FAO/WHO Expert Committee on Food Additives).WHO Technical Report Series, No. 851, 1995.
111. Toxicological evaluation of certain veterinary drug residues in food.WHO Food Additives Series, No. 33, 1994.
112. Residues of some veterinary drugs in animals and foods. FAO Foodand Nutrition Paper, No. 41/6, 1994.
113. Evaluation of certain veterinary drug residues in food (Forty-thirdreport of the Joint FAO/WHO Expert Committee on Food Additives).WHO Technical Report Series, No. 855, 1995, and corrigendum.
92
114. Toxicological evaluation of certain veterinary drug residues in food.WHO Food Additives Series, No. 34, 1995.
115. Residues of some veterinary drugs in animals and foods. FAO Foodand Nutrition Paper, No. 41/7, 1995.
116. Evaluation of certain food additives and contaminants (Forty-fourthreport of the Joint FAO/WHO Expert Committee on Food Additives).WHO Technical Report Series, No. 859, 1995.
117. Toxicological evaluation of certain food additives and contaminants.WHO Food Additives Series, No. 35, 1996.
118. Compendium of food additive specifications: addendum 3. FAO Foodand Nutrition Paper, No. 52, Add. 3, 1995.
119. Evaluation of certain veterinary drug residues in food (Forty-fifthreport of the Joint FAO/WHO Expert Committee on Food Additives).WHO Technical Report Series, No. 864, 1996.
120. Toxicological evaluation of certain veterinary drug residues in food.WHO Food Additives Series, No. 36, 1996.
121. Residues of some veterinary drugs in animals and foods. FAO Foodand Nutrition Paper, No. 41/8, 1996.
122. Evaluation of certain food additives and contaminants (Forty-sixthreport of the Joint FAO/WHO Expert Committee on Food Additives).WHO Technical Report Series, No. 868, 1997.
123. Toxicological evaluation of certain food additives. WHO FoodAdditives Series, No. 37, 1996.
124. Compendium of food additive specifications, addendum 4. FAO Foodand Nutrition Paper, No. 52, Add. 4, 1996.
125. Evaluation of certain veterinary drug residues in food (Forty-seventhreport of the Joint FAO/WHO Expert Committee on Food Additives).WHO Technical Report Series, No. 876, 1998.
126. Toxicological evaluation of certain veterinary drug residues in food.WHO Food Additives Series, No. 38, 1996.
127. Residues of some veterinary drugs in animals and foods. FAO Foodand Nutrition Paper, No. 41/9, 1997.
128. Evaluation of certain veterinary drug residues in food (Forty-eighthreport of the Joint FAO/WHO Expert Committee on Food Additives).WHO Technical Report Series, No. 879, 1998.
93
129. Toxicological evaluation of certain veterinary drug residues in food.WHO Food Additives Series, No. 39, 1997.
130. Residues of some veterinary drugs in animals and foods. FAO Foodand Nutrition Paper, No. 41/10, 1998.
131. Evaluation of certain food additives and contaminants (Forty-ninthreport of the Joint FAO/WHO Expert Committee on Food Additives).WHO Technical Report Series, No. 884, 1999.
132. Safety evaluation of certain food additives and contaminants. WHOFood Additives Series, No. 40, 1998.
133. Compendium of food additive specifications: addendum 5. FAO Foodand Nutrition Paper, No. 52, Add. 5, 1997.
134. Evaluation of certain veterinary drug residues in food (Fiftieth reportof the Joint FAO/WHO Expert Committee on Food Additives). WHOTechnical Report Series, No. 888, 1999.
135. Toxicological evaluation of certain veterinary drug residues in food.WHO Food Additives Series, No. 41, 1998.
136. Residues of some veterinary drugs in animals and foods. FAO Foodand Nutrition Paper, No. 41/11, 1999.
137. Evaluation of certain food additives (Fifty-first report of the Joint FAO/WHO Expert Committee on Food Additives). WHO Technical ReportSeries, No. 891, 2000.
138. Safety evaluation of certain food additives. WHO Food AdditivesSeries, No. 42, 1999.
139. Compendium of food additive specifications, addendum 6. FAO Foodand Nutrition Paper, No. 52, Add. 6, 1998.
140. Evaluation of certain veterinary drug residues in food (Fifty-secondreport of the Joint FAO/WHO Expert Committee on Food Additives).WHO Technical Report Series, No. 893, 2000.
141. Toxicological evaluation of certain veterinary drug residues in food.WHO Food Additives Series, No. 43, 2000.
142. Residues of some veterinary drugs in animals and foods. FAO Foodand Nutrition Paper, No. 41/12, 2000.
143. Evaluation of certain food additives and contaminants (Fifty-thirdreport of the Joint FAO/WHO Expert Committee on Food Additives).WHO Technical Report Series, No. 896, 2000.
94
144. Safety evaluation of certain food additives and contaminants. WHOFood Additives Series, No. 44, 2000.
145. Compendium of food additive specifications, addendum 7. FAO Foodand Nutrition Paper, No. 52, Add. 7, 1999.
146. Evaluation of certain veterinary drug residues in food (Fifty-fourthreport of the Joint FAO/WHO Expert Committee on Food Additives).WHO Technical Report Series, No. 900, 2001.
147. Toxicological evaluation of certain veterinary drug residues in food.WHO Food Additives Series, No. 45, 2000.
148. Residues of some veterinary drugs in animals and foods. FAO Foodand Nutrition Paper, No. 41/13, 2000.
149. Evaluation of certain food additives and contaminants (Fifty-fifthreport of the Joint FAO/WHO Expert Committee on Food Additives).WHO Technical Report Series No. 901, 2001.
150. Safety evaluation of certain food additives and contaminants. WHOFood Additives Series, No. 46, 2001.
151. Compendium of food additive specifications: addendum 8. FAO Foodand Nutrition Paper, No. 52, Add. 8, 2000.
152. Evaluation of certain mycotoxins in food (Fifty-sixth report of the JointFAO/WHO Expert Committee on Food Additives). WHO TechnicalReport Series No. 906, 2002.
153. Safety evaluation of certain mycotoxins in food. WHO Food AdditivesSeries, No. 47/FAO Food and Nutrition Paper 74, 2001.
154. Evaluation of certain food additives and contaminants (Fifty-seventhreport of the Joint FAO/WHO Expert Committee on Food Additives).WHO Technical Report Series, No. 909, 2002.
155. Safety evaluation of certain food additives and contaminants. WHOFood Additives Series, No. 48, 2002.
156. Compendium of food additive specifications: addendum 9. FAO Foodand Nutrition Paper, No. 52, Add. 9, 2001.
157. Evaluation of certain veterinary drug residues in food (Fifty-eighthreport of the Joint FAO/WHO Expert Committee on Food Additives).WHO Technical Report Series, No. 911, 2002.
158. Toxicological evaluation of certain veterinary drug residues in food.WHO Food Additives Series, No. 49, 2002.
95
159. Residues of some veterinary drugs in animals and foods. FAO Foodand Nutrition Paper, No. 41/14, 2002.
160. Evaluation of certain food additives and contaminants (Fifty-ninthreport of the Joint FAO/WHO Expert Committee on Food Additives).WHO Technical Report Series, No. 913, 2002.
161. Safety evaluation of certain food additives and contaminants. WHOFood Additives Series, No. 50, 2003.
162. Compendium of food additive specifications: addendum 10. FAO Foodand Nutrition Paper No. 52, Add. 10, 2002.
163. Evaluation of certain veterinary drug residues in food (Sixtieth reportof the Joint FAO/WHO Expert Committee on Food Additives). WHOTechnical Report Series, No. 918, 2003.
164. Toxicological evaluation of certain veterinary drug residues in food.WHO Food Additives Series, No. 51, 2003.
165. Residues of some veterinary drugs in animals and foods. FAO Foodand Nutrition Paper, No. 41/15, 2003.
166. Evaluation of certain food additives and contaminants (Sixty-firstreport of the Joint FAO/WHO Expert Committee on Food Additives).WHO Technical Report Series, No. 922, 2004.
167. Safety evaluation of certain food additives and contaminants. WHOFood Additives Series, No. 52, 2004.
168. Compendium of food additive specifications: addendum 11. FAO Foodand Nutrition Paper, No. 52, Add. 11, 2003.
169. Evaluation of certain veterinary drug residues in food (Sixty-secondreport of the Joint FAO/WHO Expert Committee on Food Additives).WHO Technical Report Series, No. 925, 2004.
170. Residues of some veterinary drugs in animals and foods. FAO Foodand Nutrition Paper, No. 41/16, 2004.
171. Toxicological evaluation of certain veterinary drug residues in food.WHO Food Additives Series, No. 53, 2005.
172. Compendium of food additive specifications: addendum 12. FAO Foodand Nutrition Paper, No. 52, Add. 12, 2004.
173. Evaluation of certain food additives (Sixty-third report of the JointFAO/WHO Expert Committee on Food Additives). WHO TechnicalReport Series, No. 928, 2005.
96
174. Safety evaluation of certain food additives. WHO Food AdditivesSeries, No. 54, 2005.
175. Compendium of food additive specifications: addendum 13. FAO Foodand Nutrition Paper, No. 52, Add. 13 (with Errata), 2005.
176. Evaluation of certain food contaminants (Sixty-fourth report of theJoint FAO/WHO Expert Committee on Food Additives). WHOTechnical Report Series, No. 930, 2005.
177. Safety evaluation of certain contaminants in food. WHO FoodAdditives Series, No. 55/FAO Food and Nutrition Paper, No. 82, 2006.
178. Evaluation of certain food additives (Sixty-fifth report of the JointFAO/WHO Expert Committee on Food Additives). WHO TechnicalReport Series, No. 934, 2006.
179. Safety evaluation of certain food additives. WHO Food AdditivesSeries, No. 56, 2006.
180. Combined compendium of food additive specifications. FAO JECFAMonographs 1, Volumes 1–4, 2005, 2006.
181. Evaluation of certain veterinary drug residues in food (Sixty-sixthreport of the Joint FAO/WHO Expert Committee on Food Additives).WHO Technical Report Series, No. 939, 2006.
182. Residue evaluation of certain veterinary drugs. FAO JECFAMonographs 2, 2006.
183. Toxicological evaluation of certain veterinary drug residues in food.WHO Food Additives Series, No. 57, 2006.
184. Evaluation of certain food additives and contaminants (Sixty-seventhreport of the Joint FAO/WHO Expert Committee on Food Additives).WHO Technical Report Series, No. 940, 2007.
185. Compendium of food additive specifications. FAO JECFA Monographs3, 2006.
186. Safety evaluation of certain food additives and contaminants. WHOFood Additives Series, No. 58, 2007.
187. Evaluation of certain food additives and contaminants (Sixty-eighthreport of the Joint FAO/WHO Expert Committee on Food Additives).WHO Technical Report Series, No. 947, 2007.
188. Safety evaluation of certain food additives and contaminants. WHOFood Additives Series, No. 59, 2008.
97
189. Compendium of food additive specifications. FAO JECFA Monographs4, 2007.
190. Evaluation of certain food additives (Sixty-ninth report of the JointFAO/WHO Expert Committee on Food Additives). WHO TechnicalReport Series, No. 952, 2009.
191. Safety evaluation of certain food additives. WHO Food AdditivesSeries, No. 60, 2009.
192. Compendium of food additive specifications. FAO JECFA Monographs5, 2009.
193. Evaluation of certain veterinary drug residues in food (Seventiethreport of the Joint FAO/WHO Expert Committee on Food Additives).WHO Technical Report Series, No. 954, 2009.
194. Toxicological evaluation of certain veterinary drug residues in food.WHO Food Additives Series, No. 61, 2009.
195. Residue evaluation of certain veterinary drugs. FAO JECFAMonographs 6, 2009.
196. Evaluation of certain food additives (Seventy-first report of the JointFAO/WHO Expert Committee on Food Additives). WHO TechnicalReport Series, No. 956, 2010.
197. Safety evaluation of certain food additives. WHO Food AdditivesSeries, No. 62, 2010.
198. Compendium of food additive specifications. FAO JECFA Monographs7, 2009.
199. Evaluation of certain contaminants in food (Seventy-second report ofthe Joint FAO/WHO Expert Committee on Food Additives). WHO
200. Safety evaluation of certain contaminants in food. WHO FoodAdditives Series, No. 63/FAO JECFA Monographs 8, 201 .
98
Technical Report Series, No. 959, 201 .1
1
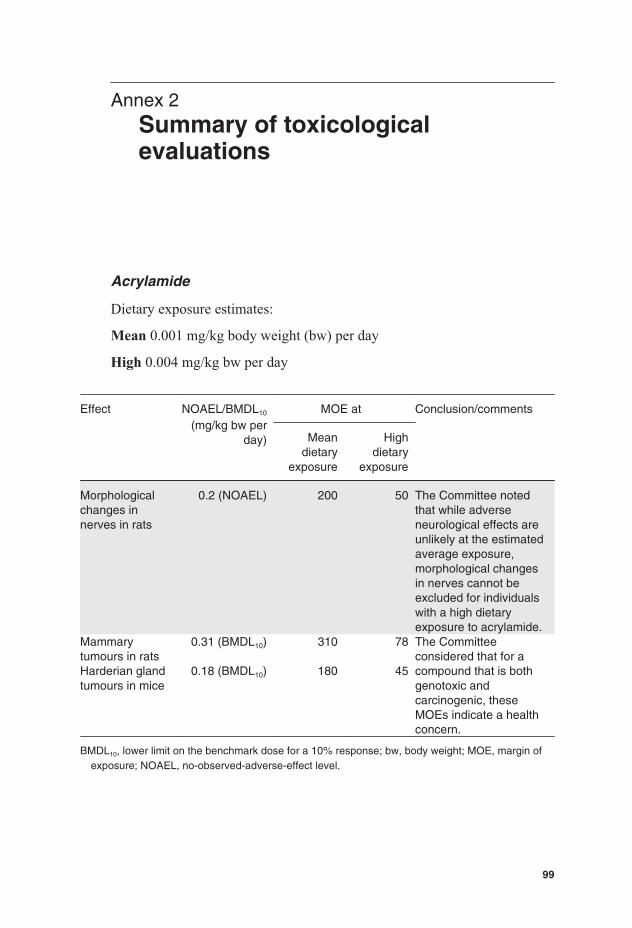
Annex 2Summary of toxicologicalevaluations
Acrylamide
Dietary exposure estimates:
Mean 0.001 mg/kg body weight (bw) per day
High 0.004 mg/kg bw per day
Effect NOAEL/BMDL10
(mg/kg bw perday)
MOE at Conclusion/comments
Meandietary
exposure
Highdietary
exposure
Morphologicalchanges innerves in rats
0.2 (NOAEL) 200 50 The Committee notedthat while adverseneurological effects areunlikely at the estimatedaverage exposure,morphological changesin nerves cannot beexcluded for individualswith a high dietaryexposure to acrylamide.
Mammarytumours in rats
0.31 (BMDL10) 310 78 The Committeeconsidered that for acompound that is bothgenotoxic andcarcinogenic, theseMOEs indicate a healthconcern.
Harderian glandtumours in mice
0.18 (BMDL10) 180 45
BMDL10, lower limit on the benchmark dose for a 10% response; bw, body weight; MOE, margin ofexposure; NOAEL, no-observed-adverse-effect level.
99
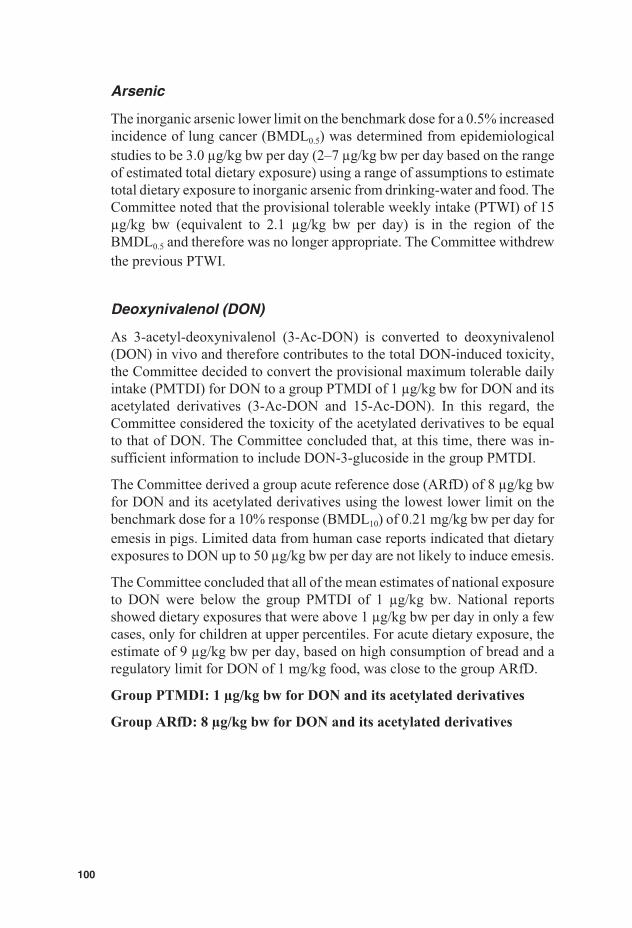
Arsenic
The inorganic arsenic lower limit on the benchmark dose for a 0.5% increasedincidence of lung cancer (BMDL0.5) was determined from epidemiologicalstudies to be 3.0 μg/kg bw per day (2–7 μg/kg bw per day based on the rangeof estimated total dietary exposure) using a range of assumptions to estimatetotal dietary exposure to inorganic arsenic from drinking-water and food. TheCommittee noted that the provisional tolerable weekly intake (PTWI) of 15μg/kg bw (equivalent to 2.1 μg/kg bw per day) is in the region of theBMDL0.5 and therefore was no longer appropriate. The Committee withdrewthe previous PTWI.
Deoxynivalenol (DON)
As 3-acetyl-deoxynivalenol (3-Ac-DON) is converted to deoxynivalenol(DON) in vivo and therefore contributes to the total DON-induced toxicity,the Committee decided to convert the provisional maximum tolerable dailyintake (PMTDI) for DON to a group PTMDI of 1 μg/kg bw for DON and itsacetylated derivatives (3-Ac-DON and 15-Ac-DON). In this regard, theCommittee considered the toxicity of the acetylated derivatives to be equalto that of DON. The Committee concluded that, at this time, there was in-sufficient information to include DON-3-glucoside in the group PMTDI.
The Committee derived a group acute reference dose (ARfD) of 8 μg/kg bwfor DON and its acetylated derivatives using the lowest lower limit on thebenchmark dose for a 10% response (BMDL10) of 0.21 mg/kg bw per day foremesis in pigs. Limited data from human case reports indicated that dietaryexposures to DON up to 50 μg/kg bw per day are not likely to induce emesis.
The Committee concluded that all of the mean estimates of national exposureto DON were below the group PMTDI of 1 μg/kg bw. National reportsshowed dietary exposures that were above 1 μg/kg bw per day in only a fewcases, only for children at upper percentiles. For acute dietary exposure, theestimate of 9 μg/kg bw per day, based on high consumption of bread and aregulatory limit for DON of 1 mg/kg food, was close to the group ARfD.
Group PTMDI: 1 μg/kg bw for DON and its acetylated derivatives
Group ARfD: 8 μg/kg bw for DON and its acetylated derivatives
100
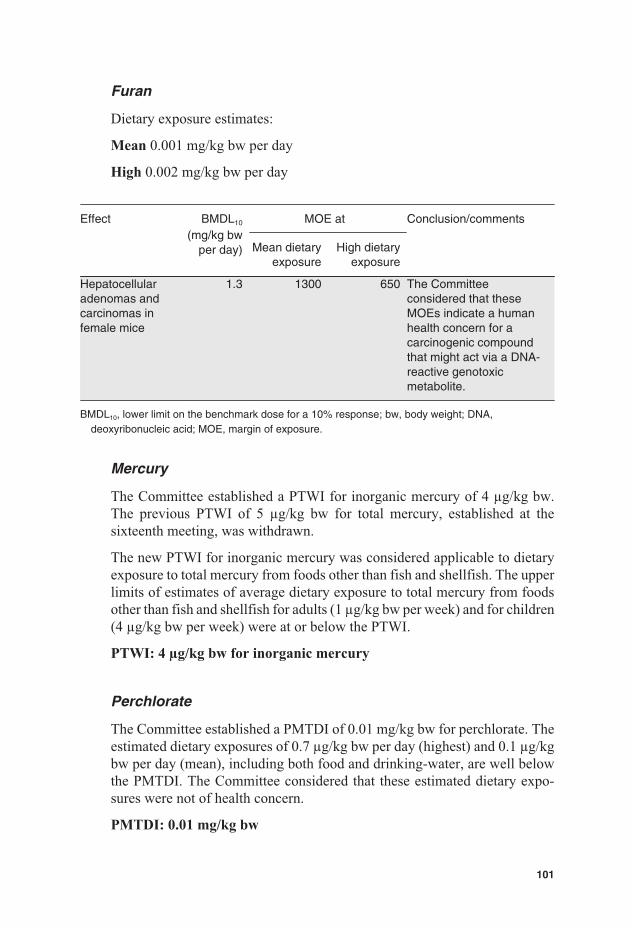
Furan
Dietary exposure estimates:
Mean 0.001 mg/kg bw per day
High 0.002 mg/kg bw per day
Effect BMDL10
(mg/kg bwper day)
MOE at Conclusion/comments
Mean dietaryexposure
High dietaryexposure
Hepatocellularadenomas andcarcinomas infemale mice
1.3 1300 650 The Committeeconsidered that theseMOEs indicate a humanhealth concern for acarcinogenic compoundthat might act via a DNA-reactive genotoxicmetabolite.
BMDL10, lower limit on the benchmark dose for a 10% response; bw, body weight; DNA,deoxyribonucleic acid; MOE, margin of exposure.
Mercury
The Committee established a PTWI for inorganic mercury of 4 μg/kg bw.The previous PTWI of 5 μg/kg bw for total mercury, established at thesixteenth meeting, was withdrawn.
The new PTWI for inorganic mercury was considered applicable to dietaryexposure to total mercury from foods other than fish and shellfish. The upperlimits of estimates of average dietary exposure to total mercury from foodsother than fish and shellfish for adults (1 μg/kg bw per week) and for children(4 μg/kg bw per week) were at or below the PTWI.
PTWI: 4 μg/kg bw for inorganic mercury
Perchlorate
The Committee established a PMTDI of 0.01 mg/kg bw for perchlorate. Theestimated dietary exposures of 0.7 μg/kg bw per day (highest) and 0.1 μg/kgbw per day (mean), including both food and drinking-water, are well belowthe PMTDI. The Committee considered that these estimated dietary expo-sures were not of health concern.
PMTDI: 0.01 mg/kg bw
101

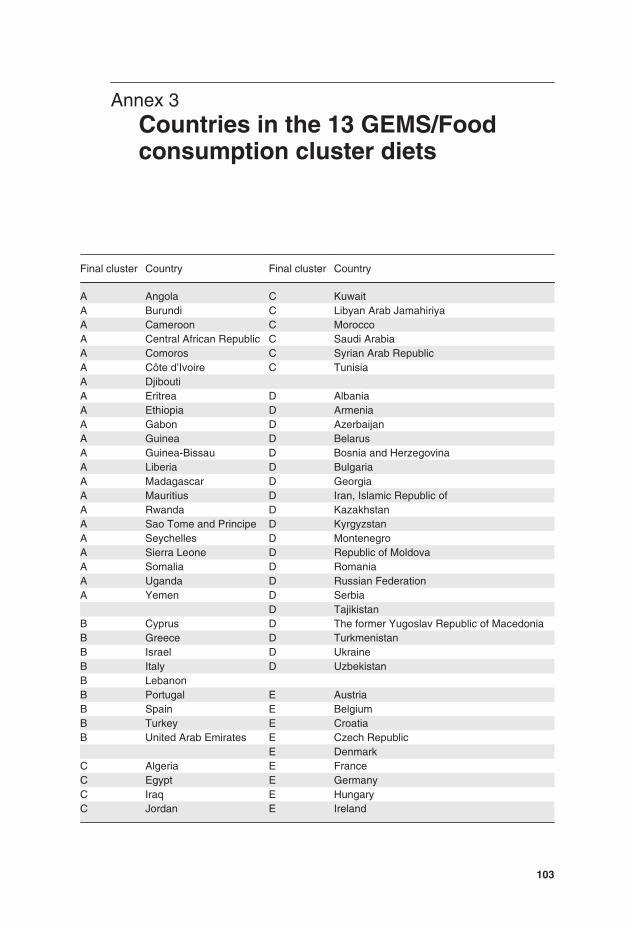
Annex 3Countries in the 13 GEMS/Foodconsumption cluster diets
Final cluster Country Final cluster Country
A Angola C KuwaitA Burundi C Libyan Arab JamahiriyaA Cameroon C MoroccoA Central African Republic C Saudi ArabiaA Comoros C Syrian Arab RepublicA Côte d’Ivoire C TunisiaA DjiboutiA Eritrea D AlbaniaA Ethiopia D ArmeniaA Gabon D AzerbaijanA Guinea D BelarusA Guinea-Bissau D Bosnia and HerzegovinaA Liberia D BulgariaA Madagascar D GeorgiaA Mauritius D Iran, Islamic Republic ofA Rwanda D KazakhstanA Sao Tome and Principe D KyrgyzstanA Seychelles D MontenegroA Sierra Leone D Republic of MoldovaA Somalia D RomaniaA Uganda D Russian FederationA Yemen D Serbia
D TajikistanB Cyprus D The former Yugoslav Republic of MacedoniaB Greece D TurkmenistanB Israel D UkraineB Italy D UzbekistanB LebanonB Portugal E AustriaB Spain E BelgiumB Turkey E CroatiaB United Arab Emirates E Czech Republic
E DenmarkC Algeria E FranceC Egypt E GermanyC Iraq E HungaryC Jordan E Ireland
103
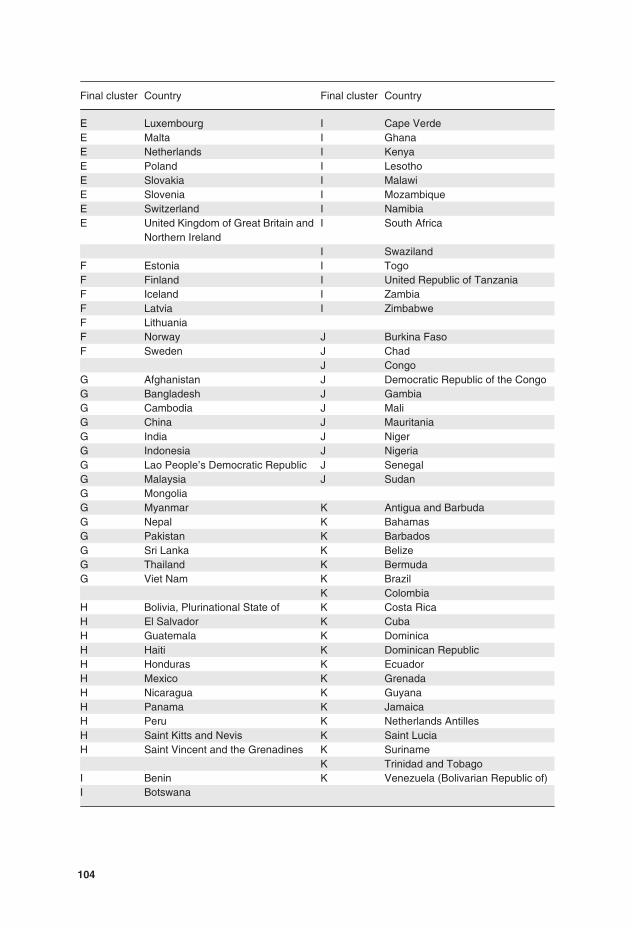
Final cluster Country Final cluster Country
E Luxembourg I Cape VerdeE Malta I GhanaE Netherlands I KenyaE Poland I LesothoE Slovakia I MalawiE Slovenia I MozambiqueE Switzerland I NamibiaE United Kingdom of Great Britain and
Northern IrelandI South Africa
I SwazilandF Estonia I TogoF Finland I United Republic of TanzaniaF Iceland I ZambiaF Latvia I ZimbabweF LithuaniaF Norway J Burkina FasoF Sweden J Chad
J CongoG Afghanistan J Democratic Republic of the CongoG Bangladesh J GambiaG Cambodia J MaliG China J MauritaniaG India J NigerG Indonesia J NigeriaG Lao People’s Democratic Republic J SenegalG Malaysia J SudanG MongoliaG Myanmar K Antigua and BarbudaG Nepal K BahamasG Pakistan K BarbadosG Sri Lanka K BelizeG Thailand K BermudaG Viet Nam K Brazil
K ColombiaH Bolivia, Plurinational State of K Costa RicaH El Salvador K CubaH Guatemala K DominicaH Haiti K Dominican RepublicH Honduras K EcuadorH Mexico K GrenadaH Nicaragua K GuyanaH Panama K JamaicaH Peru K Netherlands AntillesH Saint Kitts and Nevis K Saint LuciaH Saint Vincent and the Grenadines K Suriname
K Trinidad and TobagoI Benin K Venezuela (Bolivarian Republic of)I Botswana
104
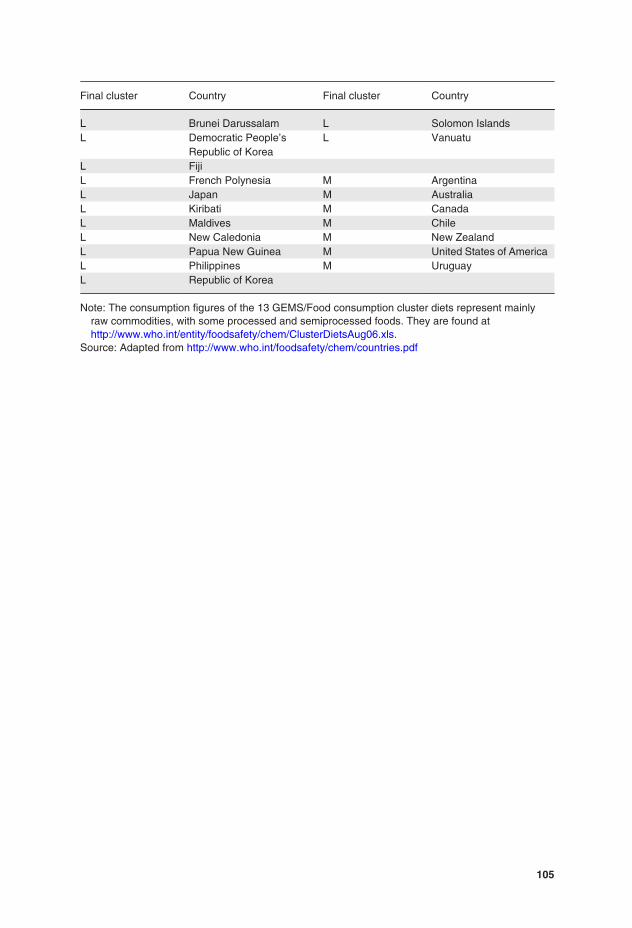
Final cluster Country Final cluster Country
L Brunei Darussalam L Solomon IslandsL Democratic People’s
Republic of KoreaL Vanuatu
L FijiL French Polynesia M ArgentinaL Japan M AustraliaL Kiribati M CanadaL Maldives M ChileL New Caledonia M New ZealandL Papua New Guinea M United States of AmericaL Philippines M UruguayL Republic of Korea
Note: The consumption figures of the 13 GEMS/Food consumption cluster diets represent mainlyraw commodities, with some processed and semiprocessed foods. They are found athttp://www.who.int/entity/foodsafety/chem/ClusterDietsAug06.xls.
Source: Adapted from http://www.who.int/foodsafety/chem/countries.pdf
105