contemporary pollen and seed dispersal in natural...
TRANSCRIPT
Genetics and Molecular Research 16 (3): gmr16039756
Contemporary pollen and seed dispersal in natural populations of Bertholletia excelsa (Bonpl.)
A.B. Baldoni1, L.H.O. Wadt2, T. Campos3, V.S. Silva4, V.C.R. Azevedo5, L.R. Mata5, A.A. Botin6, N.O. Mendes6, F.D. Tardin1, H. Tonini1, E.S.S. Hoogerheide1 and A.M. Sebbenn7
1Empresa Brasileira de Pesquisa Agropecuária, Embrapa Agrossilvipastoril, Sinop, MT, Brasil2Empresa Brasileira de Pesquisa Agropecuária, Embrapa Rondônia, Porto Velho, RO, Brasil3Empresa Brasileira de Pesquisa Agropecuária, Embrapa Acre, Rio Branco, AC, Brasil4Programa Ciência, Inovação e Tecnologia para a Amazônia, Universidade Federal do Acre, Rio Branco, AC, Brasil5Empresa Brasileira de Pesquisa Agropecuária, Cenargen, Brasília, DF, Brasil6Universidade Federal de Mato Grosso, Sinop, MT, Brasil7Instituto Florestal de São Paulo, Estação Experimental de Tupi, Piracicaba, SP, Brasil
Corresponding author: A.B. BaldoniE-mail: [email protected]
Genet. Mol. Res. 16 (3): gmr16039756Received June 20, 2017Accepted August 11, 2017Published September 21, 2017DOI http://dx.doi.org/10.4238/gmr16039756
Copyright © 2017 The Authors. This is an open-access article distributed under the terms of the Creative Commons Attribution ShareAlike (CC BY-SA) 4.0 License.
ABSTRACT. Due to the nutritional content and commercial value of its seeds, Bertholletia excelsa is one of the most important species exploited in the Amazon region. The species is hermaphroditic, insect pollinated, and its seeds are dispersed by barochory and animals. Because the fruit set is dependent on natural pollinator activity, gene flow plays a key role in fruit production. However, to date, there have

2A.B. Baldoni et al.
Genetics and Molecular Research 16 (3): gmr16039756
been no studies on pollen and seed flow in natural populations of B. excelsa. Herein, we used microsatellite loci and parentage analysis to investigate the spatial genetic structure (SGS), realized pollen and seed dispersal, and effective pollen dispersal for two B. excelsa populations in the Brazilian Amazon forest. Two plots were established in natural forests from which adults, juveniles, and seeds were sampled. Realized and effective pollen flow was greater than realized seed flow. The distance of realized pollen dispersal ranged from 36 to 2060 m, and the distance of realized seed dispersal ranged from 30 to 1742 m. Both pollen and seeds showed a dispersal pattern of isolation by distance, indicating a high frequency of mating among near-neighbor trees and seed dispersal near to mother trees. Both populations present SGS up to 175 m, which can be explained by isolation by distance pollen and seed dispersal patterns. Our results suggested that fragmentation of these forest populations may result in a significant decrease in gene flow, due to the isolation by distance pollen and seed dispersal patterns.
Key words: Conservation genetics; Microsatellite loci; Inbreeding;Population genetics; Tropical trees; Gene flow
INTRODUCTION
The Neotropical tree Bertholletia excelsa Bonpl. (Lecythidaceae), or the Brazil nut, is one of the most important extractive species in the Amazon region, due to the high nutritional and commercial value of the seeds (Vieira et al., 2009). While the logging of B. excelsa is prohibited in Brazil, nut production is considered a strategic activity to support conservation in the Amazon, as it can reconcile the economic and sustainable use of forests, enabling local families to remain in the countryside (Wadt et al., 2008). The species can be found in the Brazilian Amazon, in the States of Rondonia, Acre, Amazon, Para, Roraima, Tocantins, and Mato Grosso, and it is also found in Venezuela, Colombia, Peru, Bolivia, French Guyana, and Guyana (Wadt et al., 2005). B. excelsa occurs in non-flooded (terra firme) forests throughout the Amazon basin, preferentially on clay-sandy soils. In some regions in the Eastern Amazon, adults are concentrated in groves (Mori and Prance, 1990; Peres and Baider, 1997), while in the Southwestern Amazon individuals tend to be randomly distributed (Wadt et al., 2005). Population density ranges from <1 to 20 trees/ha (Mori and Prance, 1990; Wadt et al., 2005; Tonini et al., 2009; Scoles et al., 2016) and trees can reach a diameter at breast height (dbh) of 317 cm and height of 60 m (Scoles et al., 2016).
B. excelsa is predominantly outcrossing, hermaphroditic species (O’Malley et al., 1988), with a mellitophylous pollination syndrome (Wadt et al., 2015); its floral morphology restricts the entry of visiting insects, allowing only those with the physical strength and body size compatible with the flower structure to act as effective pollinators (Maués, 2002). The main visitors and pollinators for B. excelsa are the bees of the genera Bombus, Centris, Xylocopa, and Epicharis, as well as some species of Euglossinae (Maués, 2002; Cavalcante et al., 2012). Flowering occurs in the early rainy season during which there is an abundant supply of nectar and pollen for the pollinators (Maués, 2002). The fruit set is dependent on natural pollinator activity (Cavalcante et al., 2012), and fruit formation occurs only when there is mating between

3Gene flow in Bertholletia excelsa
Genetics and Molecular Research 16 (3): gmr16039756
trees; therefore, despite the possible occurrence of selfing (Wadt et al., 2015), gene flow may play a key role in fruit production. Fruits are primarily dispersed by barochory, due to their significant weight (0.5-1.5 kg; Costa et al., 2009), and dispersed secondarily by rodents of the genera Dasyprocta and Sciuridae (Haugaasen et al., 2010). Primary seed dispersal occurs up to approximately 35 m (Haugaasen et al., 2010), but secondary seed dispersal can occur over hundreds of meters (Peres and Baider, 1997).
Due to the ecological, social, and economic importance of the species, a series of studies have examined its production (Kainer et al., 2007; Rockwell et al., 2015), demographics (Wadt et al., 2008; Scoles and Gribel, 2012), silviculture (Kainer et al., 2014; Scoles et al., 2016), and genetics (O’Malley et al., 1988; Sujii et al., 2015; Wadt et al., 2015). Some of these studies express concerns about the impact of intensive seed collection on natural regeneration (Wadt et al., 2008; Scoles and Gribel, 2012) and logging on nut production (Rockwell et al., 2015). Studies have shown that the crowns of fruiting trees are taller than non-productive trees (Scoles et al., 2016), while silvicultural studies have shown that sapling survival and growth is greatest in full daylight conditions, such as forest gaps (Scoles et al., 2011). Population genetic studies based on genetic markers for B. excelsa have been conducted to better understand its genetic structure and diversity, spatial genetic structure (SGS), and inbreeding and mating systems of natural populations, spatially isolated trees in pastures, and trees in plantations (O’Malley et al., 1988; Sujii et al., 2015; Wadt et al., 2015). Such studies have shown lower genetic differentiation between neighboring natural populations (0.018) than spatially distant populations (0.121), significant SGS (Sujii et al., 2015), and varying levels of inbreeding among populations, with some showing no evidence of inbreeding (Sujii et al., 2015; Wadt et al., 2015). These studies have also demonstrated that reproduction occurs mainly by outcrossing (O’Malley et al., 1988; Wadt et al., 2015), but some mating occurs between related trees. Furthermore, they have found a lower effective number of pollen donors fertilizing seed trees in pastures and plantations than in natural populations, as well as a lower effective number of pollen donors within than among fruits, resulting in higher frequencies of full-sibs in anthropogenic populations and within fruits of trees (Wadt et al., 2015). However, although gene flow plays a key role in population reproduction, to date, there have been no studies on pollen and seed flow in natural populations of B. excelsa.
Gene flow is defined as the movement of genes between populations, or between subdivisions within populations, and it is responsible for connecting individuals within and between populations via pollen and seeds (Burczyk et al., 2004; Sork and Smouse, 2006; Ellstrand, 2014). It can occur through pollen flow when an egg is fertilized by a grain of immigrant pollen, and seed flow, when immigrant seeds are established in pre-existing populations. Pollen and seed flow and dispersal can be estimated through parentage analysis based on genetic markers using a sample census of all adult trees and established seedlings and juveniles with an area (plot or forest fragment), thus representing the realized gene dispersal (Burczyk et al., 2004). The distances between seedlings or juveniles and their assigned mothers are used to estimate the realized seed dispersal distance; the distances between the assigned pollen donor and the assigned mother trees are used to estimate the realized pollen dispersal distance (Burczyk et al., 2004; Bittencourt and Sebbenn, 2007). Pollen dispersal can also be studied using a sample census of adults and open-pollinated seeds within a plot or forest fragment to assess the effective pollen dispersal, which is the fertilization resulting in a seed that has not yet been established in the population (Burczyk et al., 2004). The distance between the seed tree and pollen donor represents the effective pollen dispersal distance (Burczyk et al., 2004).

4A.B. Baldoni et al.
Genetics and Molecular Research 16 (3): gmr16039756
Several factors influence gene flow in a plant population, such as the reproductive system, spatial distribution of trees, pollinator vectors, seed dispersal vectors, self-incompatibility of reproductive structures, evolutionary factors, and anthropogenic forces (Lander et al., 2010; Degen and Sebbenn, 2014; Ellstrand, 2014). When considering non-timber forest products, such as the Brazil nut, the preference for seed extraction from highly productive trees, thus limiting the action of dispersers, or even the rejection of seeds from less productive trees can impact gene flow in a population. In populations with SGS due to short distance seed dispersal low levels of pollen immigration along with short distance pollen dispersal, can lead to mating between relatives, resulting in inbreeding (Degen and Sebbenn, 2014). Pollen flow can mitigate the negative effects of genetic drift, such as the loss of alleles, increased inbreeding and coancestry, and reduced heterozygosity (Burczyk et al., 2004), thereby increasing genetic diversity, the effective number of pollen donors, and population size within families (Manoel et al., 2012). These aspects of pollen dispersal are particularly important regarding genetic conservation, environmental restoration, and mating since crossing patterns determine the relationships between and among families, and thus the effective population size.
Parentage analysis is a direct way to assess gene flow through pollen and seeds (Burczyk et al., 2004; Ashley, 2010; Ellstrand, 2014). Using microsatellite loci and parentage analysis, we assessed the SGS, realized pollen and seed dispersal distance, and effective pollen dispersal distance for two B. excelsa populations in the Brazilian Amazon. We specifically addressed the following questions: i) Is there pollen and seed immigration into the plots? ii) Since B. excelsa pollen dispersal is mediated by bees and fruits are primarily dispersed by barochory, is the rate of pollen immigration higher than seed immigration? iii) What is the pattern of pollen and seed dispersal? iv) Is there SGS in the populations?
MATERIAL AND METHODS
Study sites and sampling
The study was carried out in two populations where B. excelsa seeds are intensively harvested for commercial purposes, one in Mato Grosso State (MT) and one in Acre State (AC), both located in the Brazil Amazon forest. In MT, the study was carried out in a 75-ha plot (500 x 1500 m, 2.41 trees/ha) established in a mature natural forest, in Dal Pai farm, Itaúba municipality; in AC, the study area was a 375-ha plot (1500 x 2500 m, 0.54 trees/ha) established in a natural forest located in a 420 ha area within the Chico Mendes Extractive Reserve. In both plots, we mapped, measured dbh, and sampled cambium tissue for DNA extraction of all B. excelsa adults (dbh ≥ 50 cm; Wadt et al., 2015) and juvenile trees. In MT, we found 143 adult trees (dbh ranging from 50 to 238 cm, mean ± SD (standard deviation) = 99.1 ± 28.1 cm) and the distance between trees ranged from 16 to 1414 m (mean ± SD = 350 ± 288 m). We also found 38 juvenile trees (dbh ranging from 1 to 45.6 cm, mean ± SD = 22.2 ± 12.9 cm), with distances between the plants ranging from 2 to 372 m (mean ± SD = 178 ± 85 m) (Figure 1). Furthermore, we collected open-pollinated seeds from 14 seed trees, at approximately seven fruits per tree. After removing the husk, seeds were germinated in a sandbox, grouped by family, in a greenhouse with 50% shading. We obtained 367 offspring for the analysis, with an average of 20 offspring per seed tree. All offspring were identified by the origin of the tree and the fruit. Leaves were collected from offspring for DNA extraction.

5Gene flow in Bertholletia excelsa
Genetics and Molecular Research 16 (3): gmr16039756
In AC, we found 169 adult trees (dbh ranging from 50.0 to 193.8 cm, mean ± SD = 96.7 ± 30.71 m) and the distance between trees ranged from 19 to 2375 m (mean ± SD = 820 ± 472 m). We also sampled 34 juveniles (dbh ranging from 13.4 to 47.2 cm, mean ± SD = 36.0 ± 9.0 cm), with the distance between the plants ranging from 18 to 2269 m (mean ± SD = 782 ± 430 m) (Figure 1). We did not collect open-pollinated seeds for offspring analysis from the AC population.
Figure 1. Distribution map of Bertholletia excelsa adults and juveniles in the Mato Grosso (MT) and Acre (AC) populations.
Microsatellite analysis
DNA extraction was carried out using the CTAB protocol (Doyle and Doyle, 1990). Results were quantified after electrophoresis on 1% agarose gel and then compared to phage lambda DNA concentrations. DNA samples from adults, juveniles, and offspring were genotyped with seven microsatellite loci: Bex02, Bex09 (Reis et al., 2009), Bet06, Bet12, Bet14, Bet15, and Bet16 (Sujii et al., 2013). The protocol for DNA quantification and amplification are described in detail in Wadt et al. (2015).
Parentage analysis
The mother and father of sampled juveniles and the father of offspring in each plot were determined using the CERVUS 3.0 software (Kalinowski et al., 2007). Individuals

6A.B. Baldoni et al.
Genetics and Molecular Research 16 (3): gmr16039756
with less than six loci were excluded from the analysis, which decreased the sample size of juveniles and offspring in MT to 33 and 338, respectively. Parentage of juveniles from each plot was assigned by comparing genotypes of adults and juveniles (maternity and paternity analysis). For open-pollinated offspring, parentage was assigned by comparing genotypes of seed trees, adults, and offspring (paternity analysis), using simulations to find the most likely parents (mother and father), as determined by the Δ statistic (Marshall et al., 1998). The significance of Δ (critical Δ) was simulated using a confidence interval of 80% with 50,000 replications, a genotyping error rate of 0.01, and the assumption that 70% of candidate parents were sampled. For juveniles, if a single parent was identified within the plot, it was assumed to be the maternal parent. If two parents were assigned within the plots, we estimated the minimum seed dispersal distance assuming that the near-neighbor parent was the mother and the more distant tree the father; the maximum seed dispersal distance was estimated assuming that the more distant parent was the mother and the near-neighbor was the father. The realized pollen immigration rate (mrp) in the plots was calculated as mrp = 1 - (n2 / n), where n2 is the number of juveniles assigned to a parent pair and n is the number of juveniles sampled in the plot. The realized seed immigration rate (ms) was calculated as ms = 1 - (n1 / n), where n1 is the number of juveniles assigned at least to one parent (assumed to be the mother). For open-pollinated offspring, the effective pollen immigration rate (mep) was calculated as mep = np / n, where np is the number of offspring not assigned to a pollen donor within the plot and n is the number of sampled offspring. If a juvenile was assigned to the same individual as both mother and pollen parent, or if an offspring was assigned to the same seed tree as pollen parent, it was assumed to originate from self-fertilization. For juveniles, the realized pollen dispersal distance was based on the position of the putative mothers relative to the putative fathers and the realized seed dispersal distance was calculated based on the position of the juveniles relative to their putative mothers. For offspring, the effective pollen dispersal distance was calculated based on the position of the seed trees relative to the putative pollen donor. We estimated the mean, median, and minimum and maximum pollen and seed dispersal distance using the Euclidean distance between two points. To investigate if male mating success was a function of the distance between males and seed trees, we compared the curve of frequency of effective pollinating male parents with the frequency distribution of the distances between all males and seed trees using the Kolmogorov-Smirnov test (Sokal and Rohlf, 1995). To determine if the frequency and distance of pollen and seed dispersal were correlated, we used the Pearson correlation coefficient (Sokal and Rohlf, 1995).
Spatial genetic structure analysis
Due to the small number of juvenile individuals found in the plots, we combined both adults and juveniles to assess SGS based on the coancestry coefficient (θxy), as described in Loiselle et al. (1995), and using the SPAGEDI 1.3 software (Hardy and Vekemans, 2002). To visualize SGS, θxy values were averaged over a set of ten distance classes and then plotted against these distances. We selected a distance interval of 70 m as this value resulted in a pairwise number >200, which is recommended for accurate estimates of SGS in one distance class. To test whether there was a significant deviation from the random spatial structure, the 95% confidence interval was calculated for each observed value and each distance class using 1000 Monte Carlo permutations of individuals among distance classes. To compare the extent of SGS between the two plots, the Sp- statistic (Vekemans and Hardy, 2004) was
7Gene flow in Bertholletia excelsa
Genetics and Molecular Research 16 (3): gmr16039756
calculated as -bk /(1 - θ1), where θ1 is the mean coancestry coefficient calculated between all pairwise individuals within the first distance class (70 m) and bk is the slope of the regression of coancestry coefficient on the logarithm of spatial distance (0-350 m). To test for SGS, the spatial position of the individuals were permuted (1000 times) to obtain the frequency distribution of bk under the null hypothesis that θ1 and ln(dxy) are uncorrelated.
RESULTS
Realized gene dispersal distances
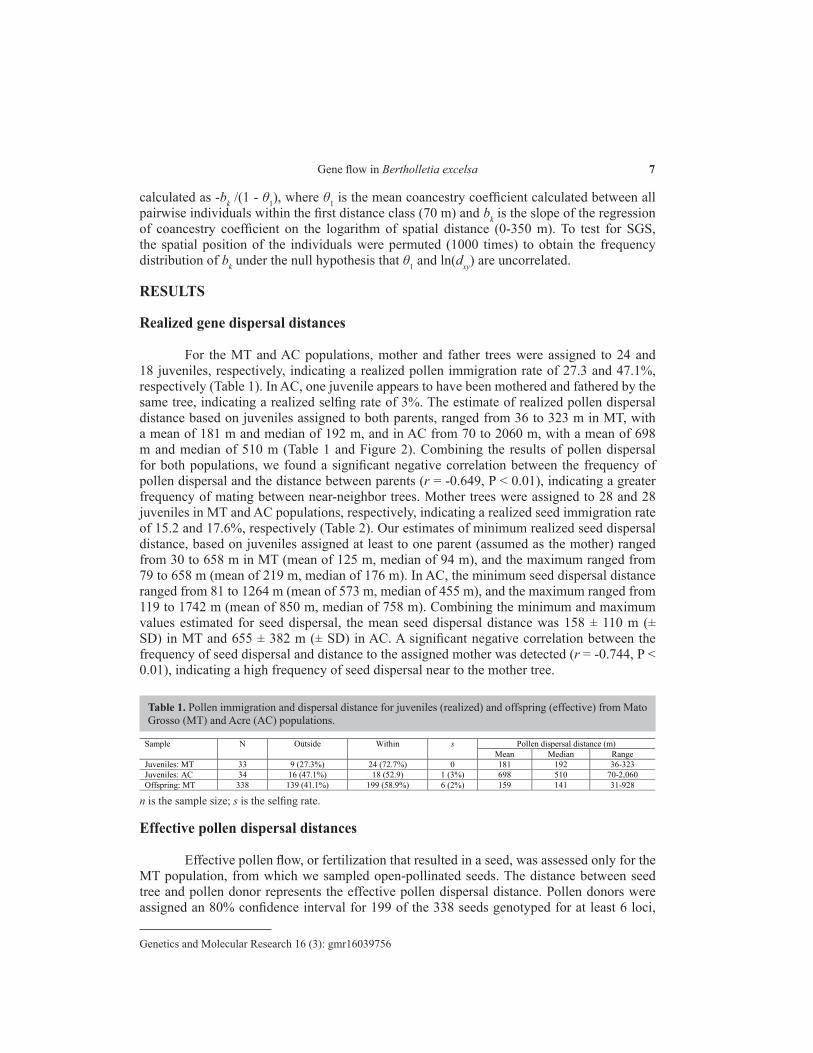
For the MT and AC populations, mother and father trees were assigned to 24 and 18 juveniles, respectively, indicating a realized pollen immigration rate of 27.3 and 47.1%, respectively (Table 1). In AC, one juvenile appears to have been mothered and fathered by the same tree, indicating a realized selfing rate of 3%. The estimate of realized pollen dispersal distance based on juveniles assigned to both parents, ranged from 36 to 323 m in MT, with a mean of 181 m and median of 192 m, and in AC from 70 to 2060 m, with a mean of 698 m and median of 510 m (Table 1 and Figure 2). Combining the results of pollen dispersal for both populations, we found a significant negative correlation between the frequency of pollen dispersal and the distance between parents (r = -0.649, P < 0.01), indicating a greater frequency of mating between near-neighbor trees. Mother trees were assigned to 28 and 28 juveniles in MT and AC populations, respectively, indicating a realized seed immigration rate of 15.2 and 17.6%, respectively (Table 2). Our estimates of minimum realized seed dispersal distance, based on juveniles assigned at least to one parent (assumed as the mother) ranged from 30 to 658 m in MT (mean of 125 m, median of 94 m), and the maximum ranged from 79 to 658 m (mean of 219 m, median of 176 m). In AC, the minimum seed dispersal distance ranged from 81 to 1264 m (mean of 573 m, median of 455 m), and the maximum ranged from 119 to 1742 m (mean of 850 m, median of 758 m). Combining the minimum and maximum values estimated for seed dispersal, the mean seed dispersal distance was 158 ± 110 m (± SD) in MT and 655 ± 382 m (± SD) in AC. A significant negative correlation between the frequency of seed dispersal and distance to the assigned mother was detected (r = -0.744, P < 0.01), indicating a high frequency of seed dispersal near to the mother tree.
Table 1. Pollen immigration and dispersal distance for juveniles (realized) and offspring (effective) from Mato Grosso (MT) and Acre (AC) populations.
n is the sample size; s is the selfing rate.
Sample N Outside Within s Pollen dispersal distance (m) Mean Median Range
Juveniles: MT 33 9 (27.3%) 24 (72.7%) 0 181 192 36-323 Juveniles: AC 34 16 (47.1%) 18 (52.9) 1 (3%) 698 510 70-2,060 Offspring: MT 338 139 (41.1%) 199 (58.9%) 6 (2%) 159 141 31-928
Effective pollen dispersal distances
Effective pollen flow, or fertilization that resulted in a seed, was assessed only for the MT population, from which we sampled open-pollinated seeds. The distance between seed tree and pollen donor represents the effective pollen dispersal distance. Pollen donors were assigned an 80% confidence interval for 199 of the 338 seeds genotyped for at least 6 loci,

8A.B. Baldoni et al.
Genetics and Molecular Research 16 (3): gmr16039756
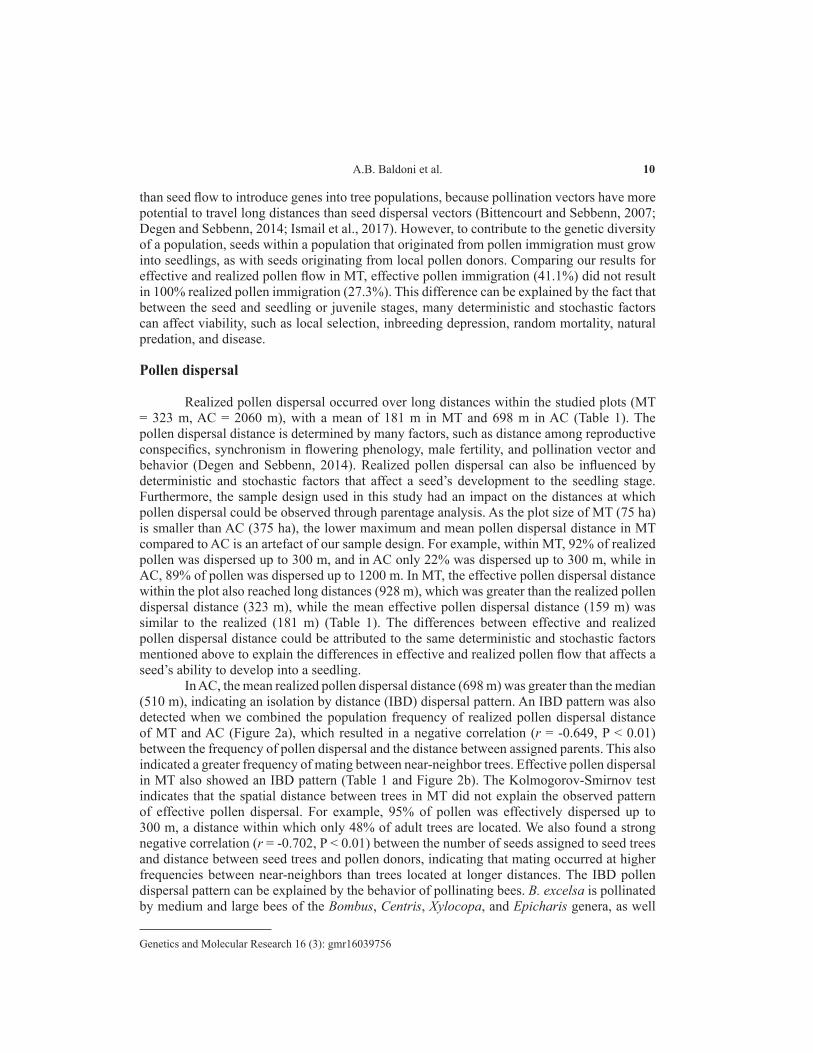
indicating a pollen immigration rate of 41.1% (Table 1). Six seeds were likely the result of self-fertilization (s = 2%). The pollen dispersal distance within the plot ranged from 31 to 928 m, with an average of 159 m and median of 141 m (Table 1 and Figure 2b). The Kolmogorov-Smirnov test was significant (D = 0.364, P < 0.0001), indicating that the spatial distance between trees does not explain the observed pattern of pollen dispersal. Ninety-five percent of effective pollen was dispersed up to 300 m. A significant and strong negative association was found between the number of seeds assigned to seed trees and distance between seed trees and pollen donors (r = -0.702, P < 0.01), indicating that mating occurred at greater frequencies between near-neighbors than trees located at long distances.
Figure 2. Frequency distribution of realized pollen and seed dispersal distance combining both Mato Grosso (MT) and Acre (AC) populations (a); effective pollen dispersal distance and distance between all trees for MT population (b).
Table 2. Realized seed immigration and minimum and maximum dispersal distances for juveniles of Mato Grosso (MT) and Acre (AC) populations.
Minimum seed dispersal distance was estimated assuming that the near-neighbor parent of an assigned juvenile was the mother; maximum seed dispersal distance was estimated assuming that the more distant parent of an assigned juvenile was the mother. N is the sample size.
Sample N Outside Within Minimum seed dispersal distance (m) Maximum seed dispersal distance (m) Mean Median Range Mean Median Range
MT 33 5 (15.2%) 28 (84.8%) 125 94 30-658 219 176 79-658 AC 34 6 (17.6%) 28 (82.4%) 573 455 81-1,264 850 758 119-1,742

9Gene flow in Bertholletia excelsa
Genetics and Molecular Research 16 (3): gmr16039756
Spatial genetic structure
A significant SGS was found up to 175 m in both MT and AC populations (Figure 3), suggesting that individuals located within this distance were likely related. The average pairwise θxy values for the first distance class (0-70 m) was lower in MT (θxy = 0.028) than that observed in AC (θxy = 0.051). The regression slope bk of pairwise coancestry coefficient on the logarithm of spatial distance (0-350 m) was significant (P < 0.01) and negative for both populations (MT = -0.0176, AC = -0.0260), confirming the presence of SGS. The extent of SGS, measured by the Sp statistic, was lower in MT (Sp = 0.018) than the AC population (Sp = 0.027).
Figure 3. Correlograms of mean pairwise coancestry coefficients (θxy) in the Mato Grosso (MT) and Acre (AC) populations. The solid line represents the average θxy value. The dashed lines represent the 95% (two-tailed) confidence interval of the mean θxy.
DISCUSSION
Pollen and seed flow
Our results for gene flow show moderate levels of realized (27.3-47.1%) and effective (41.1%) pollen immigration, and realized seed immigration (15.2 and 17.6% for MT and AC, respectively) (Tables 1 and 2). Pollen and seed immigration were expected because the plots are located within continuous natural forests and are therefore not spatially isolated. However, realized and effective pollen immigration was greater than realized seed immigration, confirming our hypothesis that bees as pollen dispersal vectors can disperse B. excelsa genes over longer distances than seed dispersal by the rodents Dasyprocta spp and Sciuridae spp, despite the fact that these animals have the potential to disperse seeds over hundreds of meters (Haugaasen et al., 2010). Both pollen and seed flow can introduce new genes into populations, increasing the genetic diversity and effective population size. However, pollen flow is more effective
10A.B. Baldoni et al.
Genetics and Molecular Research 16 (3): gmr16039756
than seed flow to introduce genes into tree populations, because pollination vectors have more potential to travel long distances than seed dispersal vectors (Bittencourt and Sebbenn, 2007; Degen and Sebbenn, 2014; Ismail et al., 2017). However, to contribute to the genetic diversity of a population, seeds within a population that originated from pollen immigration must grow into seedlings, as with seeds originating from local pollen donors. Comparing our results for effective and realized pollen flow in MT, effective pollen immigration (41.1%) did not result in 100% realized pollen immigration (27.3%). This difference can be explained by the fact that between the seed and seedling or juvenile stages, many deterministic and stochastic factors can affect viability, such as local selection, inbreeding depression, random mortality, natural predation, and disease.
Pollen dispersal
Realized pollen dispersal occurred over long distances within the studied plots (MT = 323 m, AC = 2060 m), with a mean of 181 m in MT and 698 m in AC (Table 1). The pollen dispersal distance is determined by many factors, such as distance among reproductive conspecifics, synchronism in flowering phenology, male fertility, and pollination vector and behavior (Degen and Sebbenn, 2014). Realized pollen dispersal can also be influenced by deterministic and stochastic factors that affect a seed’s development to the seedling stage. Furthermore, the sample design used in this study had an impact on the distances at which pollen dispersal could be observed through parentage analysis. As the plot size of MT (75 ha) is smaller than AC (375 ha), the lower maximum and mean pollen dispersal distance in MT compared to AC is an artefact of our sample design. For example, within MT, 92% of realized pollen was dispersed up to 300 m, and in AC only 22% was dispersed up to 300 m, while in AC, 89% of pollen was dispersed up to 1200 m. In MT, the effective pollen dispersal distance within the plot also reached long distances (928 m), which was greater than the realized pollen dispersal distance (323 m), while the mean effective pollen dispersal distance (159 m) was similar to the realized (181 m) (Table 1). The differences between effective and realized pollen dispersal distance could be attributed to the same deterministic and stochastic factors mentioned above to explain the differences in effective and realized pollen flow that affects a seed’s ability to develop into a seedling.
In AC, the mean realized pollen dispersal distance (698 m) was greater than the median (510 m), indicating an isolation by distance (IBD) dispersal pattern. An IBD pattern was also detected when we combined the population frequency of realized pollen dispersal distance of MT and AC (Figure 2a), which resulted in a negative correlation (r = -0.649, P < 0.01) between the frequency of pollen dispersal and the distance between assigned parents. This also indicated a greater frequency of mating between near-neighbor trees. Effective pollen dispersal in MT also showed an IBD pattern (Table 1 and Figure 2b). The Kolmogorov-Smirnov test indicates that the spatial distance between trees in MT did not explain the observed pattern of effective pollen dispersal. For example, 95% of pollen was effectively dispersed up to 300 m, a distance within which only 48% of adult trees are located. We also found a strong negative correlation (r = -0.702, P < 0.01) between the number of seeds assigned to seed trees and distance between seed trees and pollen donors, indicating that mating occurred at higher frequencies between near-neighbors than trees located at longer distances. The IBD pollen dispersal pattern can be explained by the behavior of pollinating bees. B. excelsa is pollinated by medium and large bees of the Bombus, Centris, Xylocopa, and Epicharis genera, as well

11Gene flow in Bertholletia excelsa
Genetics and Molecular Research 16 (3): gmr16039756
as some species of Euglossinae (Maués, 2002; Cavalcante et al., 2012). While these species can fly over long distances, they forage within restricted areas when there are many trees flowering, thus resulting in short distance pollen dispersal (Janzen, 1971).
Realized seed dispersal distance and patterns
Realized seed dispersal also reached long distances within the studied plots (MT = 658 m, AC = 1742 m), with a maximum mean in MT of 219 m and 763 m in AC (Table 2). Like realized pollen dispersal, the lower values for minimum and maximum mean seed dispersal distances in MT compared to AC were a consequence of the size of the plot in MT. The minimum and maximum values in MT indicate that at least 89% of seeds were dispersed up to 300 m and in AC; only 11% were dispersed up to 300 m. In AC, at least 86% of seeds were dispersed up to 1000 m. In both populations, the mean minimum and maximum seed dispersal distances were higher than the respective median, indicating an IBD seed dispersal pattern (Table 2). Considering both populations together, a strong negative correlation was found between the frequency of seed dispersal and the distance between parents (r = -0.744, P < 0.01), indicating a greater frequency of seed dispersal near to mother trees, which can explain the detected SGS in the populations. Significant SGS was found up to 175 m in both MT and AC (Figure 3), although the extent of SGS was lower in MT (Sp = 0.018) than in AC (Sp = 0.027). These results suggest that individuals located within this distance were likely related. In five other B. excelsa populations, SGS was detected up to 100 m (Sujii et al., 2015). SGS is the result of seed and pollen dispersal patterns (Vekemans and Hardy, 2004), as well as asexual reproduction by roots and apomixis (Silva et al., 2011). According to our results for realized pollen and seed dispersal, the SGS observed herein was mainly caused by seed dispersal near to the mother tree, because the observed seed dispersal distance was shorter than the pollen dispersal distance. Fruit of B. excelsa are primarily dispersed by barochory (Costa et al., 2009), but seeds must be released from the hard fruit shell by an external agent (Silvertown, 2004). Therefore, secondary seed dispersal is a determining factor for seed dispersal distance and patterns. Secondary dispersal is carried out by rodents, such as Dasyprocta spp and Sciuridae spp (Haugaasen et al., 2010), which have the potential to disperse seeds over long distances (Haugaasen et al., 2010).
Mean realized pollen dispersal distance in MT (181 m) and AC (698 m) was greater than the minimum mean seed dispersed distance in both MT (125 m) and AC (573 m), even when the mean was calculated combining the minimum and maximum values estimated for seed dispersal in each population (MT = 158 m, AC = 655 m). These results suggest that pollen dispersal by bees can transport B. excelsa genes over longer distances than seed dispersal by rodents.
Mating system
The realized selfing rate measured in juveniles (AC = 3%) and the effective selfing rate measured in offspring (MT = 2%) indicate that the majority of juveniles and offspring originated from outcrossing (Table 1). The predominance of outcrossing in B. excelsa was previously reported in a study on the mating system using genetic markers (O’Malley et al., 1988; Wadt et al., 2015). In contrast, a study of the species based on hand pollination showed that self-fertilization did not result in fruit production, suggesting that the species is self-incompatible or presents inbreeding depression (Cavalcante et al., 2012). However, self-

12A.B. Baldoni et al.
Genetics and Molecular Research 16 (3): gmr16039756
incompatibility may be latent or vary by an individual due to genetic mechanisms, meaning that at some stages of tree fertility self-fertilization may occur or some trees may be self-compatible allowing self-fertilization to occur. Selection against inbred individuals between offspring and adult stages has been reported for the species (Wadt et al., 2015), which results in limited numbers of seed sets from inbreeding and high frequencies of seeds originating from outcrossing.
The observed high outcrossing rate is also an indicator that the species favors gene recombination to maintain genetic diversity, an important trait for population adaptation and survival when faced with environmental changes. However, a previous study of the mating system in the MT population, based on the same genetic data used herein for offspring, detected that even though seeds were mainly produced by outcrossing, mating was not random. This is due to the occurrence of mating between related individuals (0.04) and between seed trees and the same pollen donor resulting in correlated mating ( pr = 0.22), particularly within ( )(wpr = 0.41) rather than among fruits ( )(apr = 0.18). Therefore, open-pollinated seeds present some levels of biparental inbreeding and varying levels of relatedness, such as self-sibs, half-sibs, full-sibs, and self-half-sibs (Wadt et al., 2015). Mating among relatives can be explained by the observed SGS in the populations, as adult individuals within 175 m in both populations (Figure 3) may be genetically related. Mating among related individuals produces inbreeding at levels equal to the coancestry among parents. The estimated inbreeding was 0.23that is similar to that expected for mating between full-sibs (0.25) and the mean relatedness within families was 0.153that is greater than expected in panmictic populations (0.125).
CONCLUSION
We found moderate levels of pollen and seed immigration into the two study populations, which is particularly notable for pollen dispersal. Seed immigration and dispersal distances are lower than pollen immigration and dispersal distances, suggesting that if the populations are subjected to forest fragmentation, it may result in a decrease in gene flow, especially due to decreases in seed immigration. Our results suggest that pollen dispersal by bees can transport B. excelsa genes over longer distances than seed dispersal by rodents. Realized and effective pollen dispersal and realized seed dispersal follow a pattern of isolation by distance, with mating occurring at high frequencies between near-neighbor trees and seeds dispersed near to the mother trees. These factors may explain the observed SGS in the populations. Realized and effective selfing rates show that the species is predominantly outcrossing, favoring gene recombination and thus maintaining genetic diversity, a trait that is important for population adaptation and survival in the face of environmental change.
Conflicts of interest
The authors declare no conflict of interest.
ACKNOWLEDGMENTS
Research supported by grants from Embrapa. V.S. Silva received a scholarship from CNPq (#384898/2013-3), and A.M. Sebbenn and F.D. Tardin are recipients of research fellowships from CNPq. We thank Dr. Evelyn Nimmo for her editing of the English of the manuscript.

13Gene flow in Bertholletia excelsa
Genetics and Molecular Research 16 (3): gmr16039756
REFERENCES
Ashley MV (2010). Plant parentage, pollination, and dispersal: How DNA microsatellites have altered the landscape. Crit. Rev. Plant Sci. 29: 148-161. https://doi.org/10.1080/07352689.2010.481167
Bittencourt JV and Sebbenn AM (2007). Patterns of pollen and seed dispersal in a small, fragmented population of the wind-pollinated tree Araucaria angustifolia in southern Brazil. Heredity (Edinb) 99: 580-591. https://doi.org/10.1038/sj.hdy.6801019
Burczyk J, DiFazio SP and Adams WT (2004). Gene flow in forest trees: How far do genes really travel? For. Genet. 11: 179-192.
Cavalcante MC, Oliveira FF, Maue’s MM and Freitas BM (2012). Pollination requirements and the foraging behavior of potential pollinators of cultivated Brazil nut (Bertholletia excelsa Bonpl.) trees in Central Amazon rainforest. Psyche (Stuttg.) 2012: 1-9. https://doi.org/10.1155/2012/978019
Costa JR, Castro ABC, Wandelli EV, Coral SCT, et al. (2009). Aspectos silviculturais da castanha-do-brasil (Bertholletia excelsa) em sistemas agroflorestais na Amazônia Central. Acta Amazon. 39: 843-850. https://doi.org/10.1590/S0044-59672009000400013
Degen B and Sebbenn AM (2014). Genetic and tropical forest. In: Tropical Forestry Handbook (Pancel L and Kölh M, eds.). 2nd edn. Springer Verlag, Berlin Heidelberg, 1-30.
Doyle JJ and Doyle JL (1990). Isolation of plant DNA from fresh tissue. Focus 12: 13-15.Ellstrand NC (2014). Is gene flow the most important evolutionary force in plants? Am. J. Bot. 101: 737-753. https://doi.
org/10.3732/ajb.1400024Hardy O and Vekemans X (2002). SPAGeDI: a versatile computer program to analyze spatial genetic structure at the
individual or population levels. Mol. Ecol. Notes 2: 618-620. https://doi.org/10.1046/j.1471-8286.2002.00305.xHaugaasen JMT, Haugaasen T, Peres CA, Gribel R, et al. (2010). Seed dispersal of the Brazil nut tree (Bertholletia excelsa)
by scatter-hoarding rodents in a central Amazonian forest. J. Trop. Ecol. 26: 251-262. https://doi.org/10.1017/S0266467410000027
Ismail SA, Ghazoul J, Ravikanth G, Kushalappa CG, et al. (2017). Evaluating realized seed dispersal across fragmented tropical landscapes: a two-fold approach using parentage analysis and the neighbourhood model. New Phytol. 214: 1307-1316 https://doi.org/10.1111/nph.14427.
Janzen DH (1971). Euglossine bees as long-distance pollinators of tropical plants. Science 171: 203-205. https://doi.org/10.1126/science.171.3967.203
Kainer KA, Wadt LHO and Staudhammer CL (2007). Explaining variation in Brazil nut fruit production. For. Ecol. Manage. 250: 244-255. https://doi.org/10.1016/j.foreco.2007.05.024
Kainer KA, Wadt LHO and Staudhammer CL (2014). Testing a silvicultural recommendation: Brazil nut responses 10 years after liana cutting. J. Appl. Ecol. 51: 655-663. https://doi.org/10.1111/1365-2664.12231
Kalinowski ST, Taper ML and Marshall TC (2007). Revising how the computer program CERVUS accommodates genotyping error increases success in paternity assignment. Mol. Ecol. 16: 1099-1106. https://doi.org/10.1111/j.1365-294X.2007.03089.x
Lander TA, Boshier DH and Harris SA (2010). Fragmented but not isolated: contribution of single trees, small patches and long distance pollen flow to genetic connectivity for Gomortega keule, an endangered Chilean tree. Biol. Conserv. 143: 2583-2590. https://doi.org/10.1016/j.biocon.2010.06.028
Loiselle BA, Sork VL, Nason J and Graham C (1995). Spatial genetic structure of a tropical understory shrub, Psychotria officinalis (Rubiaceae). Am. J. Bot. 82: 1420-1425. https://doi.org/10.2307/2445869
Manoel RO, Alves P, Dourado C, Gaino APSC, et al. (2012). Contemporary pollen flow, mating patterns and effective population size inferred from paternity analysis in a small fragmented population of the Neotropical tree Copaifera langsdorffii Desf. (Leguminosae-Caesalpinioideae). Conserv. Genet. 13: 613-623. https://doi.org/10.1007/s10592-011-0311-0
Marshall TC, Slate J, Kruuk LEB and Pemberton JM (1998). Statistical confidence for likelihood-based paternity inference in natural populations. Mol. Ecol. 7: 639-655. https://doi.org/10.1046/j.1365-294x.1998.00374.x
Maués MM (2002). Reproductive phenology and pollination of the Brazil nut tree (Bertholletia excelsa Humb. & Bonpl. Lecythidaceae) in Eastern Amazonia. In: Pollinating bees - the conservation link between agriculture and nature (Kevan P and Imperatriz Fonseca VL, eds.). Ministry of the Environment, Brasília, 245-254.
Mori SA and Prance GT (1990). Taxonomy, ecology, and economic botany of the Brazil nut (Bertholletia excelsa Humb. & Bonpl.: Lecythidaceae). Adv. Econ. Bot. 8: 130-150.
O’Malley DM, Buckley DP, Prance GT and Bawa KS (1988). Genetics of Brazil nut (Bertholletia excelsa Humb. & Bonpl.: Lecythidaceae) : 2. Mating system. Theor. Appl. Genet. 76: 929-932. https://doi.org/10.1007/BF00273683

14A.B. Baldoni et al.
Genetics and Molecular Research 16 (3): gmr16039756
Peres CA and Baider C (1997). Seed dispersal, spatial distribution and population structure of Brazil nut trees (Bertholletia excelsa) in Southeastern Amazonia. J. Trop. Ecol. 13: 595-616. https://doi.org/10.1017/S0266467400010749
Reis AM, Braga AC, Lemes MR, Gribel R, et al. (2009). Development and characterization of microsatellite markers for the Brazil nut tree Bertholletia excelsa Humb. & Bonpl. (Lecythidaceae). Mol. Ecol. Resour. 9: 920-923. https://doi.org/10.1111/j.1755-0998.2008.02481.x
Rockwell CA, Guariguata MR, Menton M, Arroyo Quispe E, et al. (2015). Nut production in Bertholletia excelsa across a logged forest mosaic: Implications for multiple forest use. PLoS One 10: e0135464. https://doi.org/10.1371/journal.pone.0135464
Scoles R and Gribel R (2012). The regeneration of Brazil nut trees in relation to nut harvest intensity in the Trombetas River valley of Northern Amazonia, Brazil. For. Ecol. Manage. 265: 71-81. https://doi.org/10.1016/j.foreco.2011.10.027
Scoles R, Gribel R and Klein GN (2011). Crescimento e sobrevivência de castanheira (Bertholletia excelsa Bonpl.) em diferentes condições ambientais na região do rio Trombetas, Oriximiná, Pará. Bol. Mus. Para. Emílio Goeldi Ciênc. Nat. 6: 273-293.
Scoles R, Canto MR, Almeida RG and Vieira DP (2016). Sobrevivência e frutificação de Bertholletia excelsa Bonpl. em áreas desmatadas em Oriximiná, Pará. Flor. Amb 23: 555-564. https://doi.org/10.1590/2179-8087.132015
Silva CRS, Albuquerque PSB, Ervedosa FR, Mota JWS, et al. (2011). Understanding the genetic diversity, spatial genetic structure and mating system at the hierarchical levels of fruits and individuals of a continuous Theobroma cacao population from the Brazilian Amazon. Heredity (Edinb) 106: 973-985. https://doi.org/10.1038/hdy.2010.145
Silvertown J (2004). Sustainability in a nutshell. Trends Ecol. Evol. 19: 276-278.Sokal RR and Rohlf FJ (1995). Biometry: principles and practices of statistics in biological research. 3rd edn. W.H.
Freeman and Company, New York.Sork VL and Smouse PE (2006). Genetic analysis of landscape connectivity in tree populations. Landsc. Ecol. 21: 821-
836. https://doi.org/10.1007/s10980-005-5415-9Sujii PS, Inglis PW, Ciampi AY, Solferini VN, et al. (2013). Isolation and characterization of microsatellite markers
for Bertholletia excelsa (Lecythidaceae) population genetic analysis. Genet. Mol. Res. 12: 5278-5282. https://doi.org/10.4238/2013.November.7.2
Sujii PS, Martins K, Wadt LHO, Azevedo VCR, et al. (2015). Genetic structure of Bertholletia excelsa populations from the Amazon at different spatial scales. Conserv. Genet. 116: 955-964. https://doi.org/10.1007/s10592-015-0714-4
Tonini H, Costa P and Kaminski PE (2009). Estrutura e produção de duas populações nativas de castanheira-do-brasil (Bertholletia excelsa O. Berg) em Roraima. Floresta 38: 445-457.
Vekemans X and Hardy OJ (2004). New insights from fine-scale spatial genetic structure analyses in plant populations. Mol. Ecol. 13: 921-935. https://doi.org/10.1046/j.1365-294X.2004.02076.x
Vieira AH, Bentes-Gama MM, Rocha RB, Locatelli M, et al. (2009). Fenologia reprodutiva de castanha-do-Brasil (Bertholletia excelsa Humb. Bompl.), em Porto Velho, RO. Embrapa Rondônia Porto Velho, RO, Bol. Pesq. Desenvol./Embrapa Rondônia.
Wadt LHO, Kainer KA and Gomes-Silva DAP (2005). Population structure and nut yield of a Bertholletia excelsa stand in Southwestern Amazon. For. Ecol. Manage. 211: 371-384. https://doi.org/10.1016/j.foreco.2005.02.061
Wadt LHO, Kainer KA, Staudhammer C and Serrano R (2008). Sustainable forest use in Brazilian extractive reserves: Natural regeneration of Brazil nut in exploited populations. Biol. Conserv. 141: 332-346. https://doi.org/10.1016/j.biocon.2007.10.007
Wadt LHO, Baldoni AB, Silva VS, Campos T, et al. (2015). Mating system variation among populations, individuals and within and among fruits in Bertholletia excelsa. Silvae Genet. 64: 248-259.