content sl. no. page no. items 1 1 fp services …...home delivery of contraceptives through asha...
TRANSCRIPT
Sl. No. Page No.
1 1
2 2
3 3
4 4
5 5
6 6
7 7
8 8
9 9
10 10
11 11
12 12
13 13
14 14
15 15
16 16
17 17
18 18
19 19
20 20
21 21
22 22
23 23
24 24
25 25
26 26
27 27
28 28
29 29
30 30
31 31
32 32
33 33
34 34
35 35
36 36
37 37
38 38-39
39 40
40 41
41 42
Method wise Male sterilisation Performance
PPIUCD Performance
District Wise Total Deliveries - Type wise in MCH, GH and ESI Hospitals
Chhaya & Antara Performance
Technique-wise MTP Performance compared with Previous Year
Post Abortion Contraceptive
Coverage of Deliveries in GH with 2 & above Children
Sterilisation, PPIUCD Performance in MCHs
Coverage of Deliveries in GH - 0 and 1 child
Coverage of Deliveries in MCH - 0 and 1 child
Parity-wise Report on Sterilisation Acceptors (with 2 & Less than 2 Living
Children)
HUD-wise Sterilisation done at GPHC OTs
Non-Functioning of Operation Theatres in Govt. Primary Health Centres
Death,Failure and Complication Occurred due to Sterilisation
District wise HOB Coverage (120 HOB Block Coverage)
Statistiical Vital Rates Formula
F.W Performance durinig and upto the month
Male Sterilisation Performance
Oral Pills & E-Pills Performance
CC Performance
Coverage of Deliveries in GPHC - 0 and 1 child
Female Sterilisation Performance
Sterilisation Performance compared with Previous Year
Method wise Female sterilisation Performance
Total Sterilisation Performance
Coverage of Deliveries in GPHC with 2 & above Children
% of Five Good & Poor Performing District in Sterilization
% of Five Good & Poor Performing District in PPIUCD
Trends in % of TFR & HOB in TN
State F.W Performance & Indicators
District Wise Family Welfare Performing Centres
District Profile (Unmet need) - NFHS-4 (2015-16) Survey
District-wise % of Higher Order Births -2018
Interval IUCD Performance
IUCD Performance compared with Previous Year
Coverage of Deliveries in MCH - 2 and above
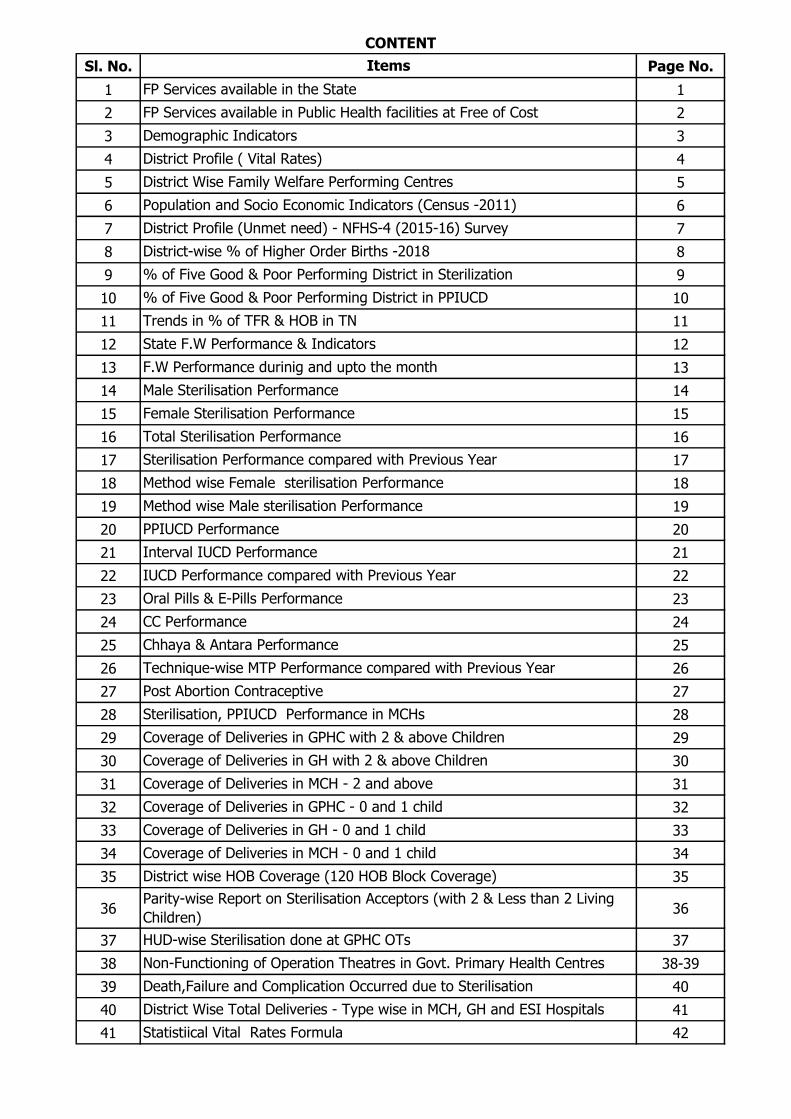
CONTENT
Items
FP Services available in the State
FP Services available in Public Health facilities at Free of Cost
Demographic Indicators
District Profile ( Vital Rates)
Population and Socio Economic Indicators (Census -2011)
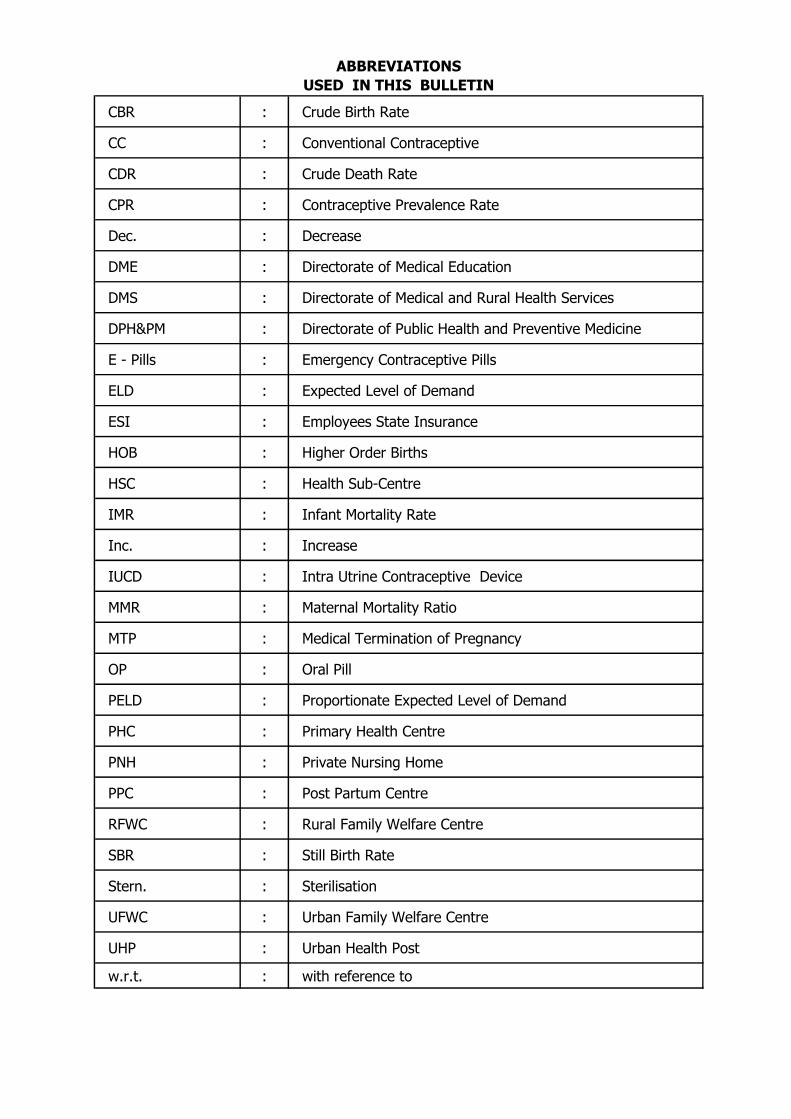
CBR : Crude Birth Rate
CC : Conventional Contraceptive
CDR : Crude Death Rate
CPR : Contraceptive Prevalence Rate
Dec. : Decrease
DME : Directorate of Medical Education
DMS : Directorate of Medical and Rural Health Services
DPH&PM : Directorate of Public Health and Preventive Medicine
E - Pills : Emergency Contraceptive Pills
ELD : Expected Level of Demand
ESI : Employees State Insurance
HOB : Higher Order Births
HSC : Health Sub-Centre
IMR : Infant Mortality Rate
Inc. : Increase
IUCD : Intra Utrine Contraceptive Device
MMR : Maternal Mortality Ratio
MTP : Medical Termination of Pregnancy
OP : Oral Pill
PELD : Proportionate Expected Level of Demand
PHC : Primary Health Centre
PNH : Private Nursing Home
PPC : Post Partum Centre
RFWC : Rural Family Welfare Centre
SBR : Still Birth Rate
Stern. : Sterilisation
UFWC : Urban Family Welfare Centre
UHP : Urban Health Post
w.r.t. : with reference to
ABBREVIATIONS
USED IN THIS BULLETIN
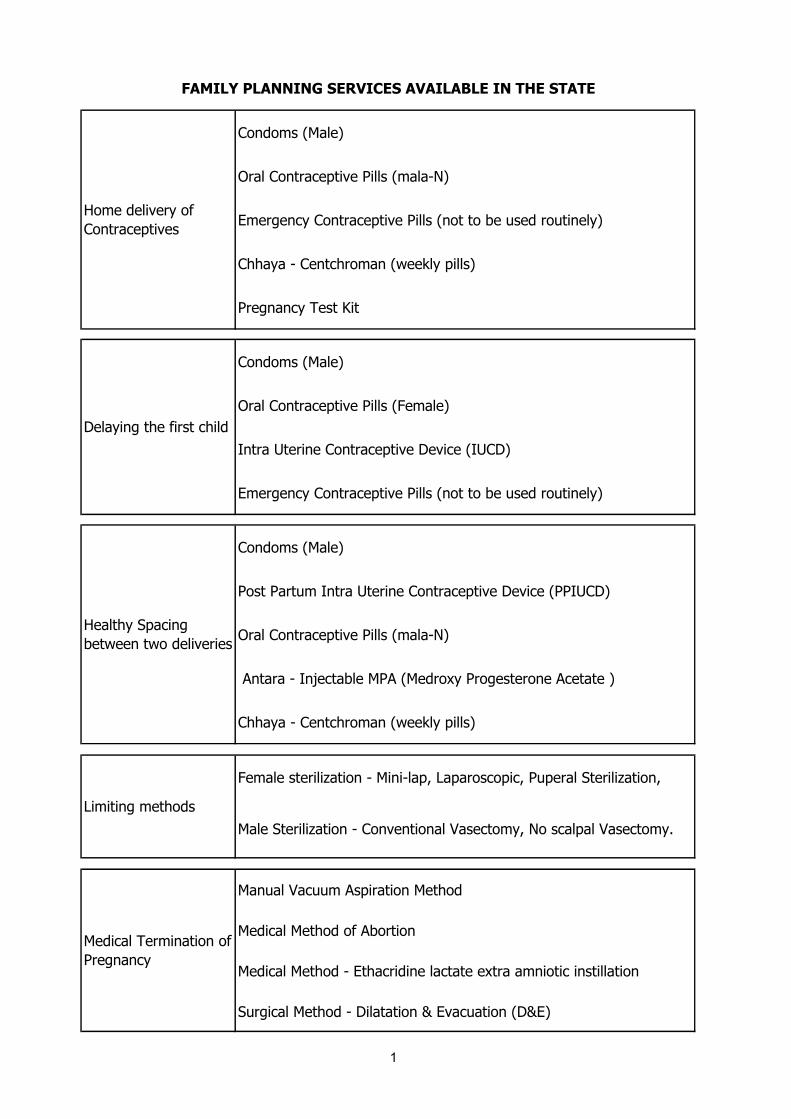
Condoms (Male)
Oral Contraceptive Pills (mala-N)
Emergency Contraceptive Pills (not to be used routinely)
Chhaya - Centchroman (weekly pills)
Pregnancy Test Kit
Condoms (Male)
Oral Contraceptive Pills (Female)
Intra Uterine Contraceptive Device (IUCD)
Emergency Contraceptive Pills (not to be used routinely)
Condoms (Male)
Post Partum Intra Uterine Contraceptive Device (PPIUCD)
Oral Contraceptive Pills (mala-N)
Antara - Injectable MPA (Medroxy Progesterone Acetate )
Chhaya - Centchroman (weekly pills)
Female sterilization - Mini-lap, Laparoscopic, Puperal Sterilization,
Male Sterilization - Conventional Vasectomy, No scalpal Vasectomy.
Manual Vacuum Aspiration Method
Medical Method of Abortion
Medical Method - Ethacridine lactate extra amniotic instillation
Surgical Method - Dilatation & Evacuation (D&E)
FAMILY PLANNING SERVICES AVAILABLE IN THE STATE
Home delivery of
Contraceptives
Delaying the first child
Healthy Spacing
between two deliveries
Limiting methods
Medical Termination of
Pregnancy
1
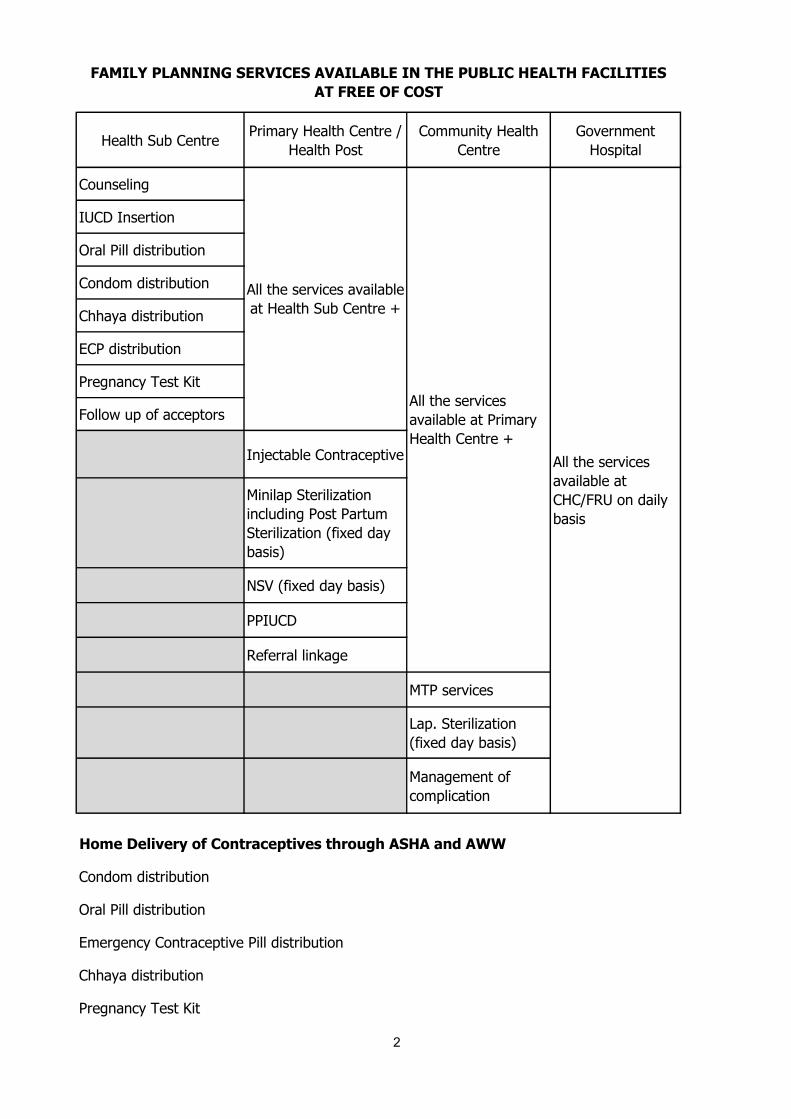
Health Sub CentrePrimary Health Centre /
Health Post
Community Health
Centre
Government
Hospital
Counseling
IUCD Insertion
Oral Pill distribution
Condom distribution
Chhaya distribution
ECP distribution
Pregnancy Test Kit
Follow up of acceptors
Injectable Contraceptive
Minilap Sterilization
including Post Partum
Sterilization (fixed day
basis)
NSV (fixed day basis)
PPIUCD
Referral linkage
MTP services
Lap. Sterilization
(fixed day basis)
Management of
complication
Condom distribution
Oral Pill distribution
Emergency Contraceptive Pill distribution
Chhaya distribution
Pregnancy Test Kit
FAMILY PLANNING SERVICES AVAILABLE IN THE PUBLIC HEALTH FACILITIES
AT FREE OF COST
All the services
available at Primary
Health Centre +
All the services
available at
CHC/FRU on daily
basis
Home Delivery of Contraceptives through ASHA and AWW
All the services available
at Health Sub Centre +
2

SL. NO. INDIA TAMIL NADU
1 121 7.2
2 32 24.1
3 5 5.7
4 31 48.0
5 382 555.0
Male 67.3 68.6
Female 69.6 71.8
7 20.2 14.9
8 6.3 6.7
9 13.9 8.3
10 2.3 1.6
11 33.0 16.0
12 130 66.0
1347.8%*
(NFHS-4)
52.6% *
(NFHS-4)
Crude Birth Rate -2017
Natural Growth Rate - 2017
Life Expectancy at Birth -
2011-15
Total Fertility Rate -2016
INDICATORS
% of Population less than 15 years
Crude Death Rate -2017
6
Population (Crores) - 2011 Census
% of Urban Population
DEMOGRAPHIC INDICATORS
% of Population more than 65 years
Population Density per Sq. Km.
Sample Registration System Registrar General, Government of India
Projected Level of Expectation of Life at Birth for India and States: 2001 - 2026 -
M/O Health and Family Welfare
Infant Mortality Rate -2017
Source :
Contraceptive Prevalence Rate
Maternal Mortality Ratio - 2014-16 (SRS)
* - National Family Health Survey.
3

CBR CDR IMR SBR
1 Ariyalur 14.9 5.8 14.4 8.4 11.8
2 Chennai 12.1 3.4 14.4 2.8 2.7
3 Coimbatore 13.6 5.3 10.0 6.4 2.5
4 Cuddalore 15.4 5.6 19.1 11.2 7.8
5 Dharmapuri 16.6 5.4 21.7 9.3 12.3
6 Dindigul 13.6 5.2 10.7 9.3 8.4
7 Erode 13.1 6.3 9.1 8.1 3.6
8 Kancheepuram 14.6 4.8 8.9 5.8 4.8
9 Kanniyakumari 10.2 4.6 11.7 13.7 3.3
10 Karur 13.5 6.1 16.3 10.0 7.8
11 Krishnagiri 15.1 3.2 16.5 12.2 10.3
12 Madurai 16.4 5.9 19.9 7.8 6.7
13 Nagapattinam 16.3 7.5 10.8 7.7 6.7
14 Namakkal 11.9 6.0 11.0 6.3 6.3
15 Perambalur 14.9 5.8 14.4 8.4 10.3
16 Pudukkottai 15.2 5.1 12.9 10.7 11.0
17 Ramanathapuram 15.6 4.9 13.4 7.9 9.1
18 Salem 15.6 6.2 16.3 12.3 8.3
19 Sivagangai 13.7 5.0 11.5 9.1 8.2
20 Thanjavur 14.8 7.0 12.4 6.5 7.2
21 The Nilgiris 10.5 4.2 10.8 13.1 6.5
22 Theni 13.7 5.1 16.4 9.7 4.8
23 Thiruvallur 13.6 2.9 11.7 7.0 6.2
24 Thiruvarur 14.3 6.3 13.1 9.5 6.7
25 Thoothukudi 13.0 3.9 21.8 12.5 7.6
26 Thiruchirappalli 14.4 5.8 17.2 14.5 7.1
27 Thirunelveli 14.7 5.2 16.7 10.3 7.7
28 Tiruppur 13.9 5.7 12.7 11.5 2.2
29 Thiruvannamalai 15.9 5.6 14.7 10.4 13.8
30 Vellore 15.3 5.8 17.1 11.8 11.6
31 Villupuram 17.3 5.9 17.0 12.9 9.9
32 Virudhunagar 13.4 4.5 17.2 6.1 6.3
14.3 5.3 14.6 9.5 7.2
14.9 6.7 16.0 --
Sources: Vital Events Survey of Tamil Nadu 2012 conducted by DPH&PM
TAMIL NADU
SRS - 2017
DISTRICT PROFILE ( VITAL RATES)
Sl. NoName of the
District
Vital Rates (2012) % of HOB
2018
4

Urban
NT
K
TK
W&
CH
To
tal
SD
H
Blo
ck
GP
HC
Oth
er
GP
HC
Urb
an
GP
HC
1 ARIYALUR 0 1 0 3 0 3 6 31 2 39 117 160 0 5
2 CHENNAI 4 0 1 2 0 3 0 0 158 158 0 165 2 317
3 COIMBATORE 1 1 4 8 0 12 12 41 36 89 328 431 1 204
4 CUDDALORE 1 1 1 8 0 9 13 51 7 71 319 401 0 63
5 DHARMAPURI 1 1 0 3 0 3 8 42 1 51 218 274 0 23
6 DINDIGUL 0 1 5 7 0 12 14 52 7 73 311 397 0 52
7 ERODE 1 1 2 5 0 7 14 49 13 76 311 396 0 173
8 KANCHEEPURAM 1 1 1 8 0 9 13 47 17 77 364 452 0 101
9 KANYAKUMARI 1 1 3 5 0 8 9 30 8 47 267 324 0 149
10 KARUR 1 1 2 4 0 6 8 24 5 37 168 213 0 34
11 KRISHNAGIRI 0 1 1 5 0 6 10 46 5 61 239 307 1 36
12 MADURAI 1 1 1 5 0 6 13 41 34 88 314 410 1 161
13 NAGAPATTINAM 0 1 3 8 0 11 11 42 5 58 258 328 0 21
14 NAMAKKAL 0 1 3 5 0 8 15 40 8 63 240 312 0 75
15 PERAMBALUR 0 1 0 3 0 3 4 24 1 29 90 123 0 11
16 PUDUKKOTTAI 1 1 2 10 0 12 13 60 3 76 242 332 0 28
17 RAMANATHAPURAM 0 1 2 7 0 9 11 43 5 59 244 313 0 40
18 SALEM 1 1 2 9 0 11 20 67 20 107 398 518 1 149
19 SIVAGANGA 1 1 4 6 6 16 12 36 4 52 275 345 0 59
20 THANJAVUR 1 1 6 7 0 13 14 55 8 77 309 401 0 81
21 THE NILGIRIS 0 1 5 0 5 4 29 4 37 194 237 0 20
22 THENI 1 1 2 3 0 5 8 27 6 41 162 210 0 42
23 THOOTHUKUDI 1 1 2 6 0 8 12 38 10 60 253 323 0 56
24 TIRUCHIRAPPALLI 1 1 1 8 0 9 14 50 20 84 307 402 1 139
25 TIRUNELVELI 1 1 7 9 0 16 19 69 16 104 379 501 1 91
26 THIRUPPUR 0 1 2 7 0 9 13 33 21 67 242 319 0 69
27 THIRUVALLUR 0 1 2 8 0 10 14 43 11 68 303 382 0 20
28 TIRUVANNAMALAI 1 1 1 8 0 9 18 75 6 99 410 520 0 22
29 THIRUVARUR 1 1 1 5 1 7 10 36 4 50 195 254 0 23
30 VELLORE 1 1 3 9 0 12 20 77 22 119 454 587 1 66
31 VILLUPURAM 1 1 1 10 0 11 22 84 4 110 557 680 0 27
32 VIRUDHUNAGAR 0 1 2 8 0 10 11 40 7 58 245 314 1 105
Grand Total 24 31 67 204 7 278 385 1422 478 2285 8713 11331 10 2462
Sources: NHM-TN
DISTRICT - WISE FAMILY WELFARE PERFORMING CENTRES
S.
NoName of the HUD
MC
H
HQ
RS
SDH GPHC
HS
C
To
tal
Insti
tuti
on
s
ES
I
AP
PD
. N
.H
Rural
To
tal
Urb
an
&
Ru
ral
GP
HC
5

GeneralChild
Sex RatioMales Females
1 Ariyalur 754894 1015 897 81.2 61.7
2 Chennai 4646732 989 950 93.7 86.6
3 Coimbatore 3458045 1000 956 89.1 78.9
4 Cuddalore 2605914 987 896 85.9 70.1
5 Dharmapuri 1506843 946 913 76.9 59.8
6 Dindigul 2159775 998 934 84.2 68.3
7 Erode 2251744 993 953 80.4 64.7
8 Kancheepuram 3998252 986 959 89.9 79.0
9 Kanniyakumari 1870374 1019 964 93.6 89.9
10 Karur 1064493 1015 939 84.5 66.9
11 Krishnagiri 1879809 958 926 78.7 63.9
12 Madurai 3038252 990 932 89.7 77.2
13 Nagapattinam 1616450 1025 959 89.8 77.6
14 Namakkal 1726601 986 914 82.6 66.6
15 Perambalur 565223 1003 913 82.9 65.9
16 Pudukkottai 1618345 1015 960 85.6 69.0
17 Ramanathapuram 1353445 983 961 87.8 73.5
18 Salem 3482056 954 916 80.2 65.2
19 Sivagangai 1339101 1003 960 87.9 71.9
20 Thanjavur 2405890 1035 957 89.0 76.5
21 The Nilagiris 735394 1042 985 91.7 79.0
22 Theni 1245899 991 934 85.0 69.5
23 Thiruvallur 3728104 987 946 89.7 78.3
24 Thiruvarur 1264277 1017 958 89.1 76.7
25 Thoothukudi 1750176 1023 963 91.1 81.3
26 Thiruchirapalli 2722290 1013 947 89.7 76.9
27 Thirunelveli 3077233 1023 960 89.2 76.0
28 Tiruppur 2479052 989 952 85.5 71.8
29 Thiruvannamalai 2464875 994 930 83.1 65.3
30 Vellore 3936331 1007 944 86.5 71.9
31 Villuppuram 3458873 987 941 80.5 63.2
32 Virudhunagar 1942288 1007 955 87.7 72.7
72147030 996 943 86.8 73.4
943 919 82.1 65.4
# - Tiruppur bifurcated from Coimbatore, Ariyalur bifurcated from Perambalur, Krishnagiri
bifurcated from Dharmapuri, Namakkal bifurcated from Salem and Karur bifurcated from
Trichy.
TAMILNADU
INDIA
POPULATION AND SOCIO ECONOMIC INDICATORS - CENSUS 2011
Sl. NoName of the
District
2011
Census
Population
Sex Ratio Literacy Rates
6
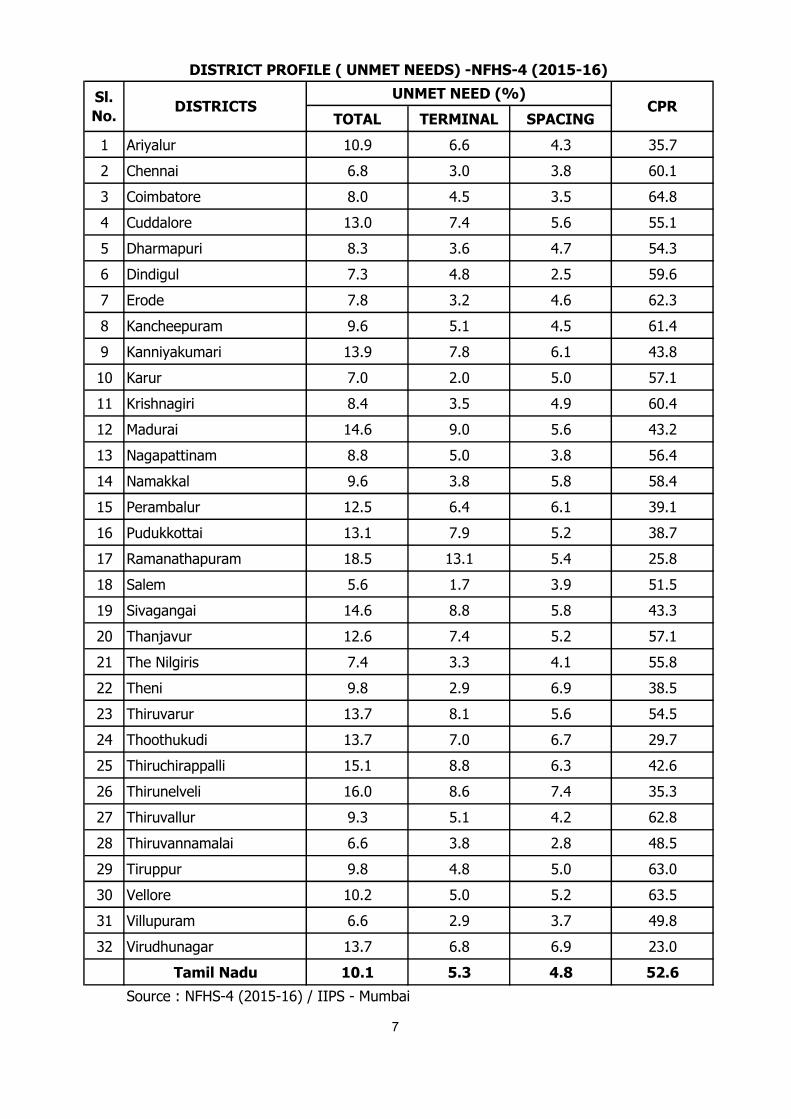
TOTAL TERMINAL SPACING
1 Ariyalur 10.9 6.6 4.3 35.7
2 Chennai 6.8 3.0 3.8 60.1
3 Coimbatore 8.0 4.5 3.5 64.8
4 Cuddalore 13.0 7.4 5.6 55.1
5 Dharmapuri 8.3 3.6 4.7 54.3
6 Dindigul 7.3 4.8 2.5 59.6
7 Erode 7.8 3.2 4.6 62.3
8 Kancheepuram 9.6 5.1 4.5 61.4
9 Kanniyakumari 13.9 7.8 6.1 43.8
10 Karur 7.0 2.0 5.0 57.1
11 Krishnagiri 8.4 3.5 4.9 60.4
12 Madurai 14.6 9.0 5.6 43.2
13 Nagapattinam 8.8 5.0 3.8 56.4
14 Namakkal 9.6 3.8 5.8 58.4
15 Perambalur 12.5 6.4 6.1 39.1
16 Pudukkottai 13.1 7.9 5.2 38.7
17 Ramanathapuram 18.5 13.1 5.4 25.8
18 Salem 5.6 1.7 3.9 51.5
19 Sivagangai 14.6 8.8 5.8 43.3
20 Thanjavur 12.6 7.4 5.2 57.1
21 The Nilgiris 7.4 3.3 4.1 55.8
22 Theni 9.8 2.9 6.9 38.5
23 Thiruvarur 13.7 8.1 5.6 54.5
24 Thoothukudi 13.7 7.0 6.7 29.7
25 Thiruchirappalli 15.1 8.8 6.3 42.6
26 Thirunelveli 16.0 8.6 7.4 35.3
27 Thiruvallur 9.3 5.1 4.2 62.8
28 Thiruvannamalai 6.6 3.8 2.8 48.5
29 Tiruppur 9.8 4.8 5.0 63.0
30 Vellore 10.2 5.0 5.2 63.5
31 Villupuram 6.6 2.9 3.7 49.8
32 Virudhunagar 13.7 6.8 6.9 23.0
Tamil Nadu 10.1 5.3 4.8 52.6
Source : NFHS-4 (2015-16) / IIPS - Mumbai
Sl.
No.DISTRICTS
UNMET NEED (%)
DISTRICT PROFILE ( UNMET NEEDS) -NFHS-4 (2015-16)
CPR
7

1 Thiruvannamalai 32560 4502 13.8
2 Dharmapuri 23643 2918 12.3
3 Ariyalur 11114 1316 11.8
4 Vellore 51215 5934 11.6
5 Pudukkottai 22768 2511 11.0
6 Krishnagiri 26433 2734 10.3
7 Perambalur 8051 831 10.3
8 Villupuram 47875 4758 9.9
9 Ramanathapuram 19222 1754 9.1
10 Dindigul 26257 2194 8.4
11 Salem 51198 4263 8.3
12 Sivagangai 18410 1512 8.2
13 Cuddalore 33120 2586 7.8
14 Karur 11756 915 7.8
15 Thirunelveli 38861 2993 7.7
16 Thoothukudi 19745 1491 7.6
17 Thanjavur 32429 2341 7.2
18 Thiruchirappalli 35856 2532 7.1
19 Nagapattinam 19286 1301 6.7
20 Madurai 46246 3106 6.7
21 Thiruvarur 14833 989 6.7
22 The Nilgiris 6385 416 6.5
23 Virudhunagar 22246 1391 6.3
24 Namakkal 18441 1153 6.3
25 Thiruvallur 32485 2000 6.2
26 Kancheepuram 41665 2007 4.8
27 Theni 14445 692 4.8
28 Erode 23826 863 3.6
29 Kanniyakumari 22485 739 3.3
30 Chennai 79767 2161 2.7
31 Coimbatore 45746 1128 2.5
32 Thiruppur 29895 670 2.2
928264 66701 7.2
* The Districts from 1 to 16 above State average of 7.2%
TAMIL NADU
DISTRICT WISE % OF HOB FOR 2018
Sl. No Name of the District Total Births
Number of HOBs
(more than 2
Living Children)
% of HOBs
(more than 2
Living Children)
8

% OF FIVE GOOD PERFORMING DISTRICT IN STERILIZAION 2019-20
(UPTO OCTOBER 2019)
% OF FIVE POOR PERFORMING DISTRICT IN STERILIZAION 2019-20
(UPTO OCTOBER 2019)
0
20
40
60
80
100
120
140116.2949309
107.244898 100.1215805 97.09634551 94.91729323
0
10
20
30
40
50
60
70
80
90
100
53.50703183 56.57142857 59.38173302 64.15112161 64.16883117
77.1
9
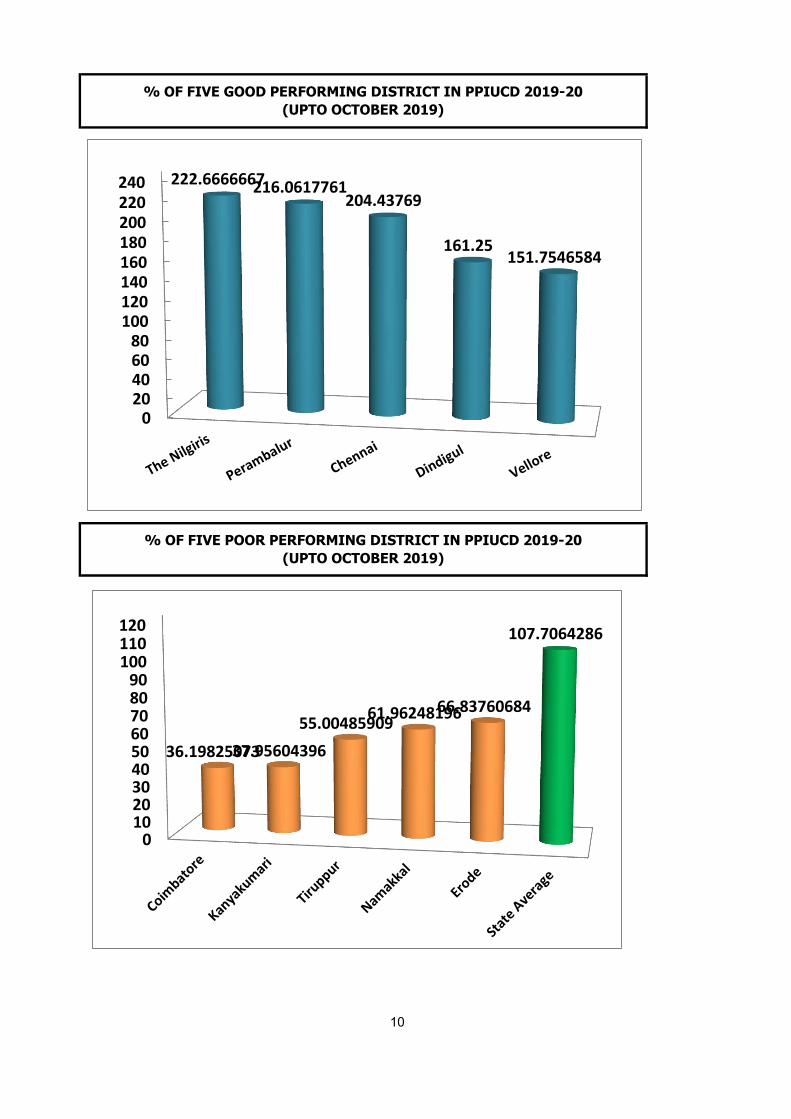
% OF FIVE GOOD PERFORMING DISTRICT IN PPIUCD 2019-20
(UPTO OCTOBER 2019)
% OF FIVE POOR PERFORMING DISTRICT IN PPIUCD 2019-20
(UPTO OCTOBER 2019)
0
20
40
60
80
100
120
140
160
180
200
220
240 222.6666667 216.0617761
204.43769
161.25 151.7546584
0
10
20
30
40
50
60
70
80
90
100
110
120
36.19825073 37.95604396
55.00485909 61.96248196
66.83760684
107.7064286
10

TRENDS IN % OF TOTAL FERTILITY RATE (YEAR WISE)
TRENDS IN % OF HIGHER ORDER BIRTH (YEAR WISE)
0
5
10
15
20
25
30
24.2
21.6
20.2
18.9 17.8
16.3
14.8
13.6
12.5 11.6
10.6 9.6
9 8.7 8.4 7.9 7.5 7.2 7.2
3.9 3.8
3.4
2.7
2.2 2.1
2
1.7 1.7 1.7 1.6 1.6
0
0.5
1
1.5
2
2.5
3
3.5
4
4.5
11

Sl. No Programme ELD P.ELDDURING
OCT. 19
UPTO OTC.
19
% w.r.t
P.ELD
1 Male Sterilisation 7000 4083 73 375 9.2
2 Female Sterilisation 343000 200083 22760 156954 78.4
Total Sterilisation 350000 204167 22833 157329 77.1
3 Interval IUCD 5356 47154
4 PAIUCD 194 1264
5 PPIUCD 240000 140000 24766 150789 107.7
Total IUCD 400000 233333 30316 199207 85.4
6 O.P. Users 400000 400000 28329 28329 7.1
7 C.C Users 600000 600000 82338 82338 13.7
8 E-Pills - - 1900 15170 -
9 CHHAYA - - 10248 65286 -
10 ANTARA - - 3783 24641 -
Sl. No 2019-20 2018-19 Inc./ Dec. % of Inc./Dec.
1 375 237 138 58.2
2 136412 138357 -1945 -1.4
3 20542 18683 1859 10.0
157329 157277 52 0.0
1 47154 84126 -36972 -43.9
2 PAIUCD 1264 1116 148 13.3
3 150789 115486 35303 30.6
199207 200728 -1521 -0.8
1 28329 36070 -7741 -21.5
2 82338 93841 -11503 -12.3
3 53485 42044 11441 27.2
4 24641 21913 2728 12.4
5 65286 45178 20108 44.5
6 15170 12675 2495 19.7
2019 % 2018 Inc./ Dec.
1 42054 26.7 42901 -847
2 25368 16.1 24944 424
3 30093 19.1 31116 -1023
4 584 0.4 518 66
5 4916 3.1 4938 -22
6 4504 2.9 4872 -368
7 47047 30.0 45054 1993
8 2763 1.7 2934 -171
157329 157277 52
160000
OP USERS
PPIUCD
Vasectomy
MTP
Voluntary Organisations
CC USERS
ANTARA
E.Pills
TOTAL IUCD
Approved Nursing Homes
GH
Local Bodies
MCH
PHC
Department
(a). PERFORMANCE WITH REFERENCE TO ELD 2019-20 ( UPTO OCTOBER 2019)
(b).COMPARATIVE STATEMENT FOR FW PERFORMANCE 2019-20
( UPTO OCTOBER 2019)
CHHAYA
Tubectomy
Laparoscopic
INTERVAL IUCD
TOTAL STERILISATION
93333 51.9
TOTAL
( c ). STERILISATION SHARE BY DIFFERENT INSTITUTIONS 2019-20
(UPTO OCTOBER 2019 )
Sl. NoNo. of Sterilisations
Unapproved Nursing Homes
ESI
Method
12

Sl. No Programme DM Oct. UM Oct. % of share to Total
performance
1 Male Sterilisation
Conventional Vasectomy 0 5 0.0
No Scalpel Vasectomy 73 370 0.2
73 375 0.2
2 Female Sterilisation
TAT / Mini Lap 1704 16961 10.8
Tubectomy 19156 119451 75.9
Laparoscopic 1900 20542 13.1
22760 156954 99.8
22833 157329
3 IUCD
Interval IUCD 5356 47154 23.7
PAIUCD 194 1264 0.6
PPIUCD 24766 150789 75.7
30316 199207
4 O.P. Users 28329 28329
5 C.C Users 82338 82338
6 E.Pills 1900 15170
7 Chhaya 10248 65286
8 Antara
1st Dose 2134 14611 59.3
2nd Dose 929 5493 22.3
3rd Dose 396 2549 10.3
4th Dose 324 1988 8.1
3783 24641
9 MTP
MVA 2592 17300
MMA 2025 12045
EVA 224 1418
Other Technique 3320 22722
8161 53485
10 POST ABORTION Sterilisation
MTP with TAT / Mini Lap 764 6015
MTP with Laparoscopic 616 3656
1380 9671Total POST ABORTION Sterilisation
Total IUCD
Total Antara
Total MTP
PERFORMANCE DURING AND UPTO THE MONTH OF OCTOBER 2019
Total Sterilisation
Male Sterilisation
Female Sterilisation
13

DM UM% w.r.t.
P.ELD
Chennai 538 314 51 193 61.5 1
The Nilgiris 38 22 1 6 27.1 2
Erode 186 109 7 26 24.0 3
Nagapattinam 138 81 0 14 17.4 4
Ramanathapuram 134 78 0 9 11.5 5
Dindigul 168 98 4 11 11.2 6
Thiruchirapalli 262 153 0 12 7.9 7
Perambalur 66 39 0 3 7.8 8
Sivagangai 144 84 0 6 7.1 9
Tiruppur 202 118 0 8 6.8 10
Coimbatore 354 207 0 12 5.8 11
Pudukkottai 178 104 1 6 5.8 12
Thanjavur 290 169 2 8 4.7 13
Thirunelveli 330 193 0 9 4.7 14
Namakkal 154 90 1 4 4.5 15
Theni 124 72 0 3 4.1 16
Thiruvallur 186 109 1 4 3.7 17
Thiruvarur 108 63 0 2 3.2 18
Thiruvannamalai 222 130 0 4 3.1 19
Villupuram 366 214 1 6 2.8 20
Madurai 386 225 0 6 2.7 21
Cuddalore 242 141 0 3 2.1 22
Thoothukudi 164 96 0 2 2.1 23
Ariyalur 88 51 0 1 1.9 24
Salem 360 210 0 4 1.9 25
Virudhunagar 188 110 0 2 1.8 26
Kancheepuram 294 172 2 3 1.7 27
Vellore 398 232 1 4 1.7 28
Karur 110 64 0 1 1.6 29
Kanyakumari 172 100 1 1 1.0 30
Dharmapuri 192 112 0 1 0.9 31
Krishnagiri 218 127 0 1 0.8 32
TAMIL NADU 7000 4083 73 375 9.2
DISTRICT WISE MALE STERILISATION PERFORMANCE 2019-20
District
Ra
nkELD P.ELD
Performance October 2019
14
DM UM% w.r.t.
P.ELD
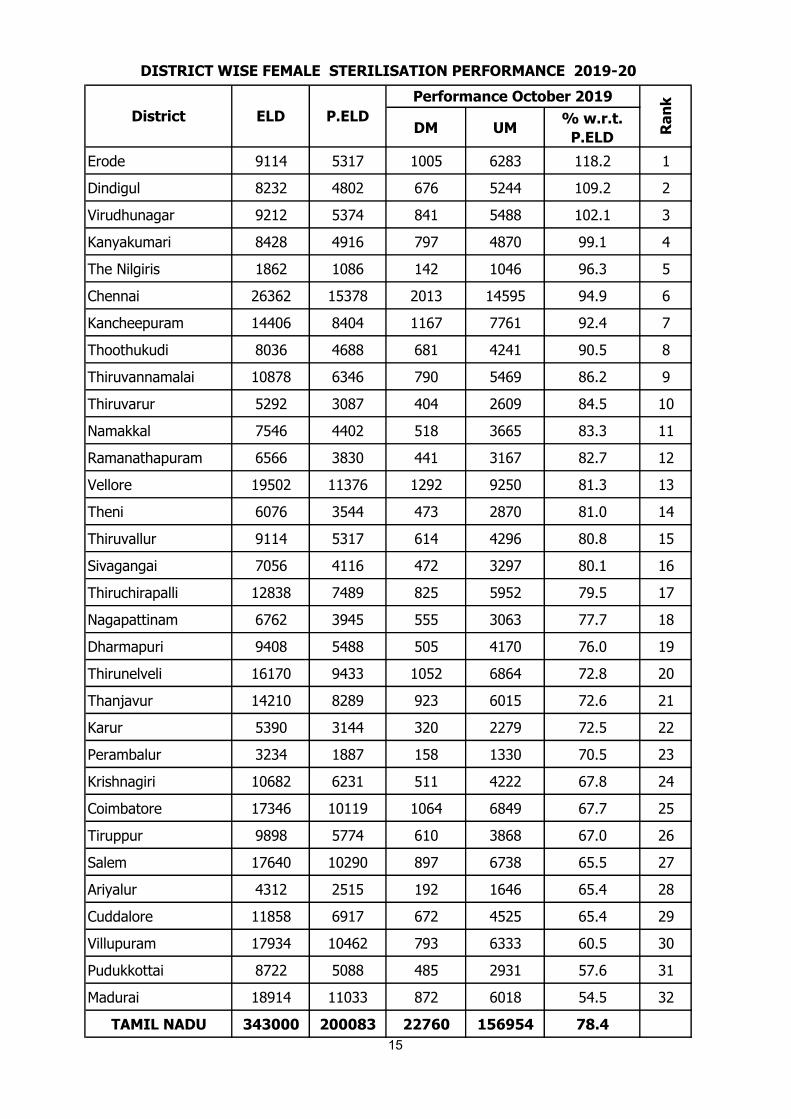
Erode 9114 5317 1005 6283 118.2 1
Dindigul 8232 4802 676 5244 109.2 2
Virudhunagar 9212 5374 841 5488 102.1 3
Kanyakumari 8428 4916 797 4870 99.1 4
The Nilgiris 1862 1086 142 1046 96.3 5
Chennai 26362 15378 2013 14595 94.9 6
Kancheepuram 14406 8404 1167 7761 92.4 7
Thoothukudi 8036 4688 681 4241 90.5 8
Thiruvannamalai 10878 6346 790 5469 86.2 9
Thiruvarur 5292 3087 404 2609 84.5 10
Namakkal 7546 4402 518 3665 83.3 11
Ramanathapuram 6566 3830 441 3167 82.7 12
Vellore 19502 11376 1292 9250 81.3 13
Theni 6076 3544 473 2870 81.0 14
Thiruvallur 9114 5317 614 4296 80.8 15
Sivagangai 7056 4116 472 3297 80.1 16
Thiruchirapalli 12838 7489 825 5952 79.5 17
Nagapattinam 6762 3945 555 3063 77.7 18
Dharmapuri 9408 5488 505 4170 76.0 19
Thirunelveli 16170 9433 1052 6864 72.8 20
Thanjavur 14210 8289 923 6015 72.6 21
Karur 5390 3144 320 2279 72.5 22
Perambalur 3234 1887 158 1330 70.5 23
Krishnagiri 10682 6231 511 4222 67.8 24
Coimbatore 17346 10119 1064 6849 67.7 25
Tiruppur 9898 5774 610 3868 67.0 26
Salem 17640 10290 897 6738 65.5 27
Ariyalur 4312 2515 192 1646 65.4 28
Cuddalore 11858 6917 672 4525 65.4 29
Villupuram 17934 10462 793 6333 60.5 30
Pudukkottai 8722 5088 485 2931 57.6 31
Madurai 18914 11033 872 6018 54.5 32
TAMIL NADU 343000 200083 22760 156954 78.4
DISTRICT WISE FEMALE STERILISATION PERFORMANCE 2019-20
ELD P.ELDDistrict
Ra
nkPerformance October 2019
15
DM UM % w.r.t. P.ELD
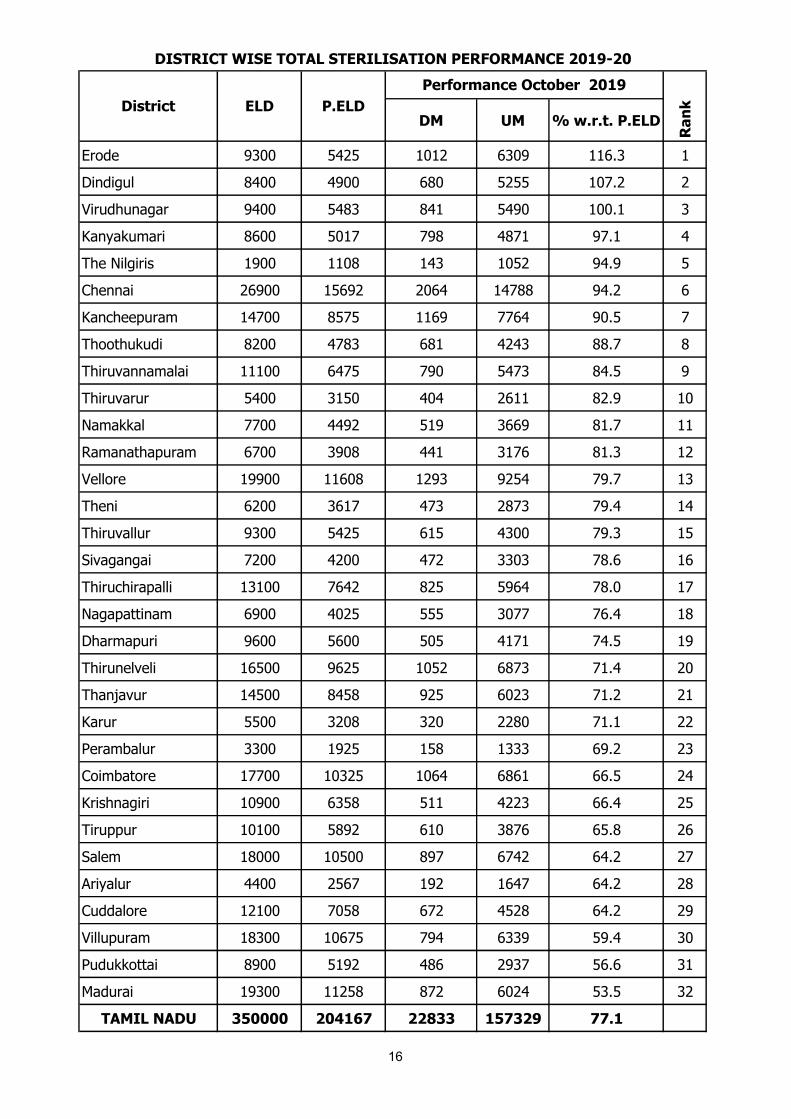
Erode 9300 5425 1012 6309 116.3 1
Dindigul 8400 4900 680 5255 107.2 2
Virudhunagar 9400 5483 841 5490 100.1 3
Kanyakumari 8600 5017 798 4871 97.1 4
The Nilgiris 1900 1108 143 1052 94.9 5
Chennai 26900 15692 2064 14788 94.2 6
Kancheepuram 14700 8575 1169 7764 90.5 7
Thoothukudi 8200 4783 681 4243 88.7 8
Thiruvannamalai 11100 6475 790 5473 84.5 9
Thiruvarur 5400 3150 404 2611 82.9 10
Namakkal 7700 4492 519 3669 81.7 11
Ramanathapuram 6700 3908 441 3176 81.3 12
Vellore 19900 11608 1293 9254 79.7 13
Theni 6200 3617 473 2873 79.4 14
Thiruvallur 9300 5425 615 4300 79.3 15
Sivagangai 7200 4200 472 3303 78.6 16
Thiruchirapalli 13100 7642 825 5964 78.0 17
Nagapattinam 6900 4025 555 3077 76.4 18
Dharmapuri 9600 5600 505 4171 74.5 19
Thirunelveli 16500 9625 1052 6873 71.4 20
Thanjavur 14500 8458 925 6023 71.2 21
Karur 5500 3208 320 2280 71.1 22
Perambalur 3300 1925 158 1333 69.2 23
Coimbatore 17700 10325 1064 6861 66.5 24
Krishnagiri 10900 6358 511 4223 66.4 25
Tiruppur 10100 5892 610 3876 65.8 26
Salem 18000 10500 897 6742 64.2 27
Ariyalur 4400 2567 192 1647 64.2 28
Cuddalore 12100 7058 672 4528 64.2 29
Villupuram 18300 10675 794 6339 59.4 30
Pudukkottai 8900 5192 486 2937 56.6 31
Madurai 19300 11258 872 6024 53.5 32
TAMIL NADU 350000 204167 22833 157329 77.1
DISTRICT WISE TOTAL STERILISATION PERFORMANCE 2019-20
ELD P.ELDDistrict
Ra
nk
Performance October 2019
16

2018-19
(Upto Oct.-18)
2019-20
(Upto Oct-19)
1 Erode 5565 6309 744
2 Thiruchirapalli 5415 5964 549
3 Nagapattinam 2697 3077 380
4 Dindigul 4940 5255 315
5 Karur 1976 2280 304
6 Coimbatore 6673 6861 188
7 Virudhunagar 5317 5490 173
8 Villupuram 6182 6339 157
9 Pudukkottai 2799 2937 138
10 Dharmapuri 4039 4171 132
11 Theni 2741 2873 132
12 Chennai 14660 14788 128
13 Cuddalore 4402 4528 126
14 Tiruppur 3842 3876 34
15 Kanyakumari 4847 4871 24
16 Perambalur 1316 1333 17
17 Thirunelveli 6888 6873 -15
18 Thiruvarur 2653 2611 -42
19 Namakkal 3714 3669 -45
20 Sivagangai 3354 3303 -51
21 Salem 6798 6742 -56
22 Thoothukudi 4309 4243 -66
23 The Nilgiris 1141 1052 -89
24 Thanjavur 6130 6023 -107
25 Thiruvannamalai 5596 5473 -123
26 Ramanathapuram 3413 3176 -237
27 Kancheepuram 8015 7764 -251
28 Madurai 6287 6024 -263
29 Ariyalur 2046 1647 -399
30 Thiruvallur 4776 4300 -476
31 Krishnagiri 4763 4223 -540
32 Vellore 9983 9254 -729
TOTAL 157277 157329 52
DISTRICT WISE STERILISATION PERFORMANCE COMPARED WITH
PREVIOUS YEAR
Sl. No Name of the District Inc / Dec
Performance
17

TAT /
Mini
Lap
Tubecto
my
Laparo-
scopic
Total
Femal
Sten.
TAT /
Mini
Lap
Tubecto
my
Laparo-
scopic
Total
Femal
Sten.
1 Ariyalur 11 155 26 192 95 986 565 1646
2 Chennai 82 1688 243 2013 923 11255 2417 14595
3 Coimbatore 71 894 99 1064 518 5686 645 6849
4 Cuddalore 34 579 59 672 493 3383 649 4525
5 Dharmapuri 88 367 50 505 793 2742 635 4170
6 Dindigul 22 495 159 676 175 2982 2087 5244
7 Erode 52 858 95 1005 553 4950 780 6283
8 Kancheepuram 61 997 109 1167 567 6215 979 7761
9 Kanyakumari 18 732 47 797 64 4417 389 4870
10 Karur 8 251 61 320 103 1522 654 2279
11 Krishnagiri 108 379 24 511 984 2833 405 4222
12 Madurai 86 771 15 872 991 4798 229 6018
13 Nagapattinam 20 531 4 555 220 2784 59 3063
14 Namakkal 41 438 39 518 510 2727 428 3665
15 Perambalur 9 137 12 158 204 780 346 1330
16 Pudukkottai 12 469 4 485 351 2541 39 2931
17 Ramanathapuram 14 413 14 441 170 2573 424 3167
18 Salem 123 671 103 897 1230 4547 961 6738
19 Sivagangai 30 421 21 472 444 2616 237 3297
20 Thanjavur 13 860 50 923 173 4903 939 6015
21 The Nilgiris 14 115 13 142 131 719 196 1046
22 Theni 48 416 9 473 497 2241 132 2870
23 Thiruchirapalli 50 606 169 825 503 3955 1494 5952
24 Thirunelveli 24 930 98 1052 288 5823 753 6864
25 Thiruvallur 77 516 21 614 658 3244 394 4296
26 Thiruvannamalai 150 637 3 790 1449 3888 132 5469
27 Thiruvarur 12 381 11 404 155 2355 99 2609
28 Thoothukudi 38 604 39 681 495 3456 290 4241
29 Tiruppur 44 505 61 610 429 3031 408 3868
30 Vellore 181 1096 15 1292 1389 7679 182 9250
31 Villupuram 71 529 193 793 678 3506 2149 6333
32 Virudhunagar 92 715 34 841 728 4314 446 5488
TAMIL NADU 1704 19156 1900 22760 16961 119451 20542 156954
Upto the MonthDuring the Month
METHOD - WISE FEMALE STERILISATION 2019-20 (UPTO OCTOBER 2019)
Sl.
No
Name of the
District
18
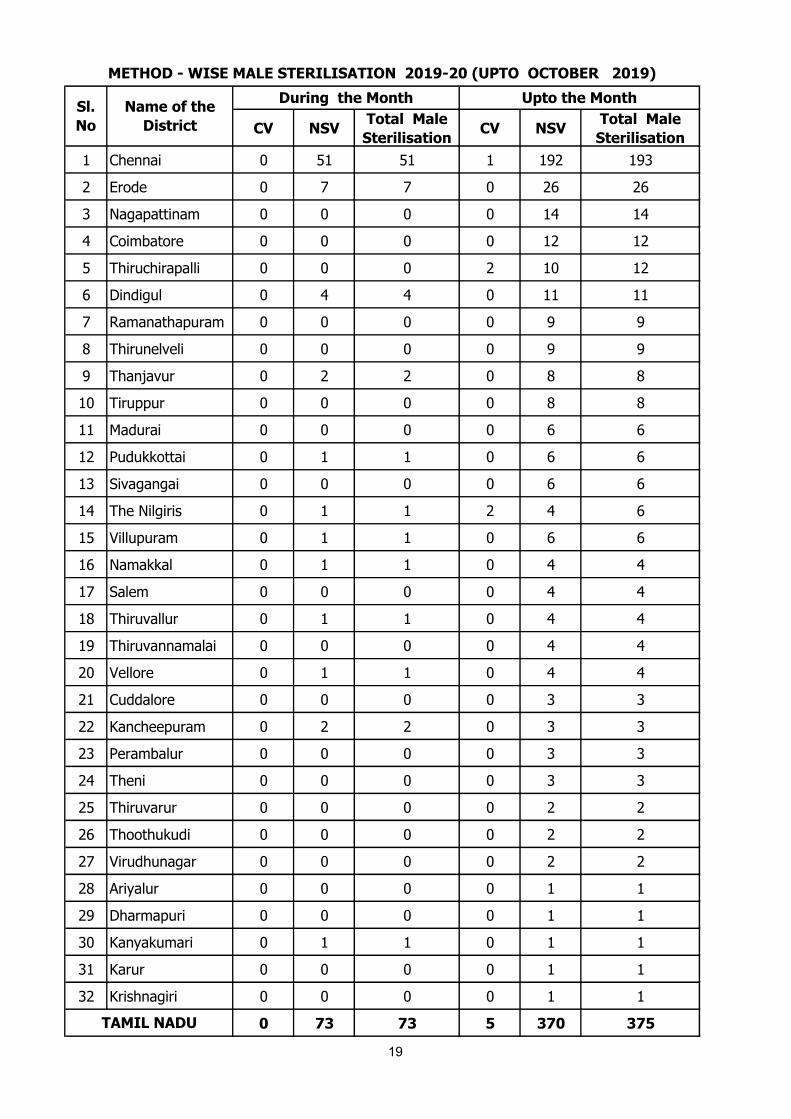
CV NSVTotal Male
SterilisationCV NSV
Total Male
Sterilisation
1 Chennai 0 51 51 1 192 193
2 Erode 0 7 7 0 26 26
3 Nagapattinam 0 0 0 0 14 14
4 Coimbatore 0 0 0 0 12 12
5 Thiruchirapalli 0 0 0 2 10 12
6 Dindigul 0 4 4 0 11 11
7 Ramanathapuram 0 0 0 0 9 9
8 Thirunelveli 0 0 0 0 9 9
9 Thanjavur 0 2 2 0 8 8
10 Tiruppur 0 0 0 0 8 8
11 Madurai 0 0 0 0 6 6
12 Pudukkottai 0 1 1 0 6 6
13 Sivagangai 0 0 0 0 6 6
14 The Nilgiris 0 1 1 2 4 6
15 Villupuram 0 1 1 0 6 6
16 Namakkal 0 1 1 0 4 4
17 Salem 0 0 0 0 4 4
18 Thiruvallur 0 1 1 0 4 4
19 Thiruvannamalai 0 0 0 0 4 4
20 Vellore 0 1 1 0 4 4
21 Cuddalore 0 0 0 0 3 3
22 Kancheepuram 0 2 2 0 3 3
23 Perambalur 0 0 0 0 3 3
24 Theni 0 0 0 0 3 3
25 Thiruvarur 0 0 0 0 2 2
26 Thoothukudi 0 0 0 0 2 2
27 Virudhunagar 0 0 0 0 2 2
28 Ariyalur 0 0 0 0 1 1
29 Dharmapuri 0 0 0 0 1 1
30 Kanyakumari 0 1 1 0 1 1
31 Karur 0 0 0 0 1 1
32 Krishnagiri 0 0 0 0 1 1
0 73 73 5 370 375
Upto the Month
METHOD - WISE MALE STERILISATION 2019-20 (UPTO OCTOBER 2019)
TAMIL NADU
Sl.
No
Name of the
District
During the Month
19
DM UM% w.r.t.
P.ELD
The Nilgiris 900 525 203 1169 222.7 803 366 1
Perambalur 2220 1295 465 2798 216.1 2239 559 2
Chennai 16920 9870 3487 20178 204.4 19037 1141 3
Dindigul 4800 2800 735 4515 161.3 2897 1618 4
Vellore 11040 6440 1427 9773 151.8 8022 1751 5
Thiruvannamalai 6780 3955 1093 5951 150.5 2375 3576 6
Thiruchirapalli 8340 4865 1211 7031 144.5 3736 3295 7
Ramanathapuram 2820 1645 335 2253 137.0 1858 395 8
Pudukkottai 5280 3080 678 4193 136.1 2810 1383 9
Virudhunagar 7260 4235 860 5621 132.7 4095 1526 10
Nagapattinam 4620 2695 649 3560 132.1 2153 1407 11
Krishnagiri 6300 3675 704 4786 130.2 4537 249 12
Thiruvarur 3720 2170 389 2763 127.3 2658 105 13
Ariyalur 2940 1715 340 2170 126.5 1815 355 14
Thoothukudi 5940 3465 678 4295 124.0 3438 857 15
Villupuram 10620 6195 1382 7020 113.3 5199 1821 16
Dharmapuri 6240 3640 704 4090 112.4 3013 1077 17
Kancheepuram 10560 6160 1146 6874 111.6 6125 749 18
Sivagangai 5160 3010 500 3286 109.2 2469 817 19
Thiruvallur 7080 4130 626 4024 97.4 3226 798 20
Theni 4920 2870 306 2720 94.8 984 1736 21
Cuddalore 6960 4060 742 3818 94.0 2676 1142 22
Karur 3900 2275 298 2092 92.0 1440 652 23
Thanjavur 11760 6860 1082 6168 89.9 5833 335 24
Thirunelveli 11940 6965 944 5923 85.0 4369 1554 25
Madurai 15480 9030 1013 6544 72.5 4460 2084 26
Salem 11220 6545 766 4629 70.7 3173 1456 27
Erode 7020 4095 444 2737 66.8 1757 980 28
Namakkal 5940 3465 328 2147 62.0 1389 758 29
Tiruppur 8820 5145 468 2830 55.0 2642 188 30
Kanyakumari 7800 4550 316 1727 38.0 1295 432 31
Coimbatore 14700 8575 447 3104 36.2 2963 141 32
TAMIL NADU 240000 140000 24766 150789 107.7 115486 35303
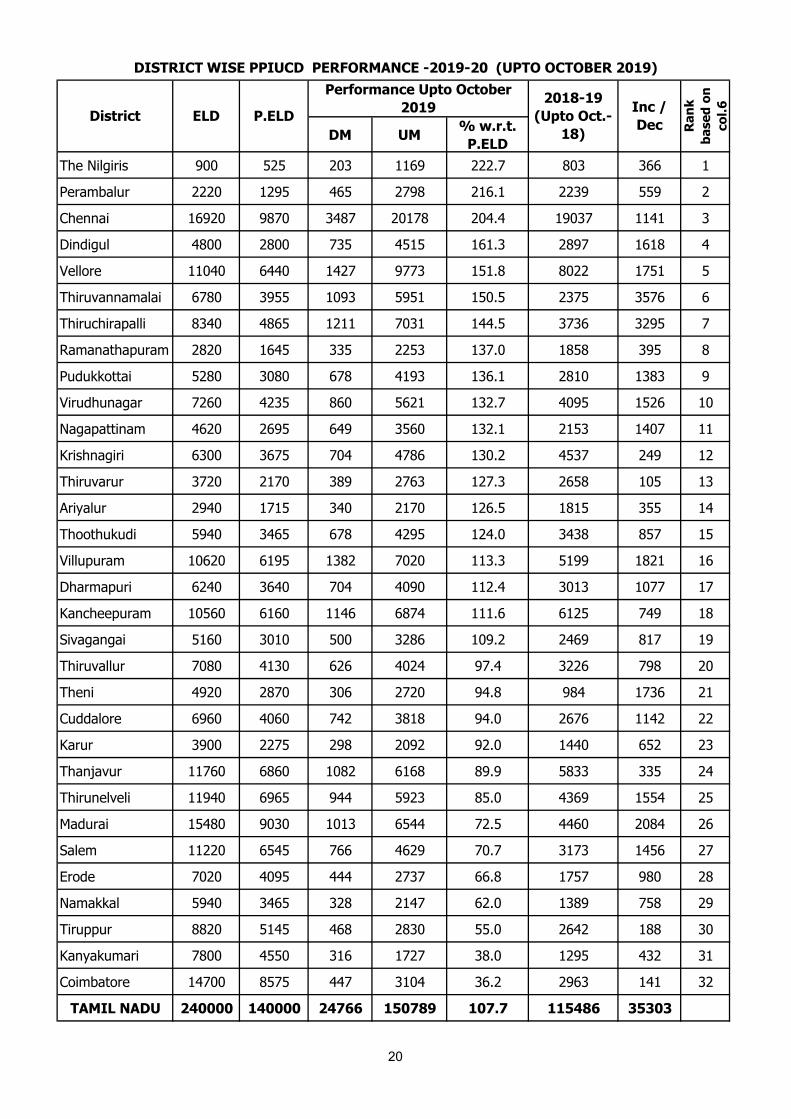
DISTRICT WISE PPIUCD PERFORMANCE -2019-20 (UPTO OCTOBER 2019)
District ELD P.ELD
Performance Upto October
2019
Ra
nk
ba
se
d o
n
co
l.62018-19
(Upto Oct.-
18)
Inc /
Dec
20
DM UM% w.r.t.
P.ELD
Ramanathapuram 1880 1097 247 2221 202.5 3772 -1551 1
The Nilgiris 600 350 35 450 128.6 698 -248 2
Erode 4680 2730 521 3335 122.2 3231 104 3
Chennai 11280 6580 68 6357 96.6 13407 -7050 4
Nagapattinam 3080 1797 274 1709 95.1 2883 -1174 5
Dindigul 3200 1867 167 1699 91.0 2939 -1240 6
Thiruvarur 2480 1447 145 1294 89.4 3113 -1819 7
Sivagangai 3440 2007 231 1728 86.1 2575 -847 8
Krishnagiri 4200 2450 231 1897 77.4 2545 -648 9
Thiruchirapalli 5560 3243 228 2160 66.6 2539 -379 10
Ariyalur 1960 1143 101 734 64.2 1094 -360 11
Coimbatore 9800 5717 545 3659 64.0 4779 -1120 12
Theni 3280 1913 148 1114 58.2 1893 -779 13
Karur 2600 1517 134 881 58.1 1196 -315 14
Kanyakumari 5200 3033 171 1633 53.8 1665 -32 15
Vellore 7360 4293 316 2081 48.5 3493 -1412 16
Tiruppur 5880 3430 200 1488 43.4 2340 -852 17
Thoothukudi 3960 2310 134 878 38.0 2396 -1518 18
Dharmapuri 4160 2427 98 903 37.2 1802 -899 19
Salem 7480 4363 183 1475 33.8 1585 -110 20
Thiruvannamalai 4520 2637 64 887 33.6 964 -77 21
Pudukkottai 3520 2053 95 671 32.7 1572 -901 22
Cuddalore 4640 2707 100 855 31.6 2823 -1968 23
Madurai 10320 6020 252 1856 30.8 2258 -402 24
Kancheepuram 7040 4107 176 1220 29.7 2570 -1350 25
Thanjavur 7840 4573 139 1346 29.4 4248 -2902 26
Villupuram 7080 4130 143 1142 27.7 3566 -2424 27
Namakkal 3960 2310 89 578 25.0 860 -282 28
Thirunelveli 7960 4643 167 1064 22.9 2757 -1693 29
Perambalur 1480 863 35 193 22.4 396 -203 30
Virudhunagar 4840 2823 73 463 16.4 2019 -1556 31
Thiruvallur 4720 2753 40 447 16.2 1264 -817 32
TAMIL NADU 160000 93333 5550 48418 51.9 105762 -57344
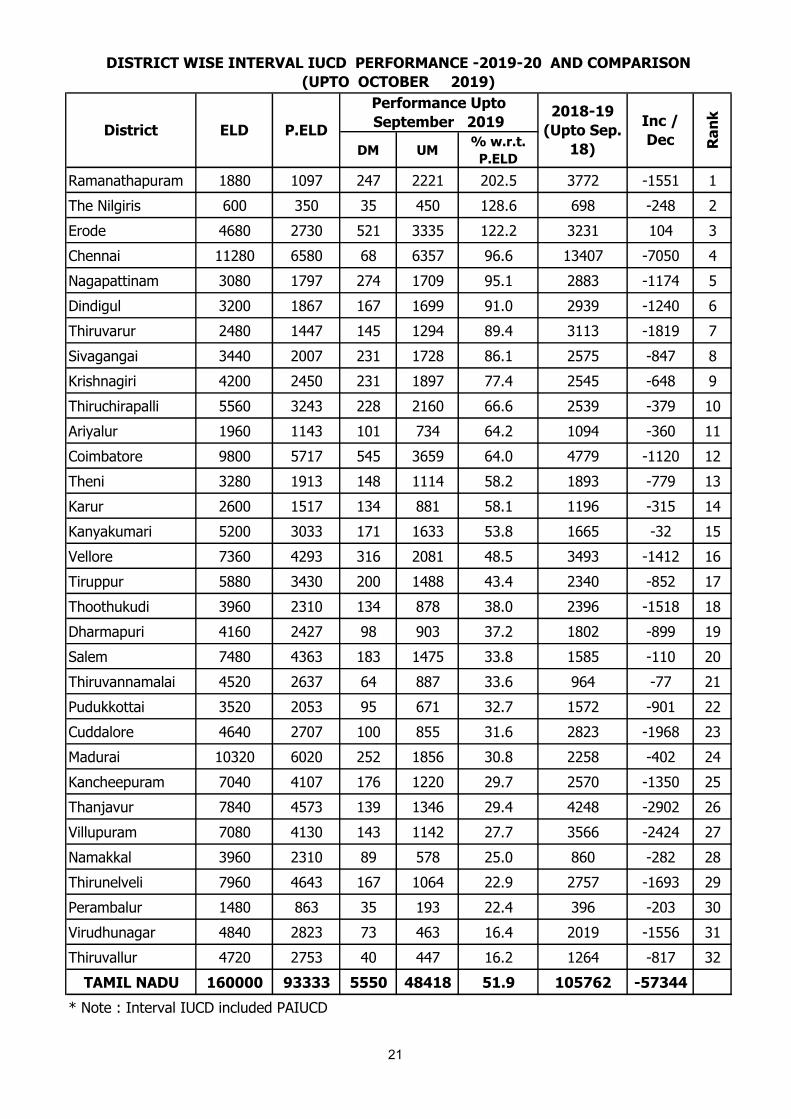
* Note : Interval IUCD included PAIUCD
DISTRICT WISE INTERVAL IUCD PERFORMANCE -2019-20 AND COMPARISON
(UPTO OCTOBER 2019)
ELD P.ELDDistrict
Performance Upto
September 2019
Ra
nk2018-19
(Upto Sep.
18)
Inc /
Dec
21

2018-19
(Upto Oct.-18)
2019-20
(Upto Oct.-19)
1 Thiruvannamalai 3339 6838 3499
2 Thiruchirapalli 6275 9191 2916
3 Madurai 6718 8400 1682
4 Salem 4758 6104 1346
5 Erode 4988 6072 1084
6 Theni 2877 3834 957
7 Pudukkottai 4382 4864 482
8 Namakkal 2249 2725 476
9 Kanyakumari 2960 3360 400
10 Dindigul 5836 6214 378
11 Perambalur 2635 2991 356
12 Vellore 11515 11854 339
13 Karur 2636 2973 337
14 Nagapattinam 5036 5269 233
15 Dharmapuri 4815 4993 178
16 The Nilgiris 1501 1619 118
17 Ariyalur 2909 2904 -5
18 Thiruvallur 4490 4471 -19
19 Sivagangai 5044 5014 -30
20 Virudhunagar 6114 6084 -30
21 Thirunelveli 7126 6987 -139
22 Krishnagiri 7082 6683 -399
23 Kancheepuram 8695 8094 -601
24 Villupuram 8765 8162 -603
25 Thoothukudi 5834 5173 -661
26 Tiruppur 4982 4318 -664
27 Cuddalore 5499 4673 -826
28 Coimbatore 7742 6763 -979
29 Ramanathapuram 5630 4474 -1156
30 Thiruvarur 5771 4057 -1714
31 Thanjavur 10081 7514 -2567
32 Chennai 32444 26535 -5909
200728 199207 -1521TAMIL NADU
DISTRICT WISE TOTAL I.U.C.D. PERFORMANCE COMPARED
WITH PREVIOUS YEAR
Sl. No Name of the District
Performance
Inc / Dec
22

O.P. Users
1 Ramanathapuram 3000 1036 7517 991 33.0 918
2 Nagapattinam 7400 4313 16382 2160 29.2 499
3 Dindigul 7400 2142 14834 1956 26.4 934
4 Thiruvarur 6100 3498 10706 1412 23.1 403
5 The Nilgiris 1000 197 1559 206 20.6 116
6 Chennai 22300 4464 18548 2446 11.0 1835
7 Karur 7200 933 5860 773 10.7 138
8 Sivagangai 9000 1187 7173 946 10.5 812
9 Erode 11200 765 7561 997 8.9 514
10 Salem 17700 1827 10229 1349 7.6 941
11 Thoothukudi 10500 1003 5732 756 7.2 300
12 Thiruvannamalai 12200 1205 6428 848 6.9 730
13 Perambalur 4000 255 2027 267 6.7 18
14 Virudhunagar 13300 997 6724 887 6.7 525
15 Kancheepuram 17300 1116 8438 1113 6.4 555
16 Cuddalore 10300 787 5008 660 6.4 571
17 Vellore 17100 1430 8223 1084 6.3 215
18 Pudukkottai 8700 610 4168 550 6.3 627
19 Namakkal 10700 900 5045 665 6.2 424
20 Coimbatore 26200 1705 11748 1549 5.9 679
21 Villupuram 16800 1071 7425 979 5.8 475
22 Kanyakumari 14300 725 5569 734 5.1 220
23 Tiruppur 15500 1155 5816 767 4.9 131
24 Thiruchirapalli 14000 740 4997 659 4.7 326
25 Krishnagiri 10400 546 3564 470 4.5 178
26 Thiruvallur 11900 538 3745 494 4.1 179
27 Thanjavur 21000 984 5417 714 3.4 398
28 Dharmapuri 9200 98 1893 250 2.7 164
29 Madurai 28900 675 5807 766 2.6 825
30 Theni 8800 469 1721 227 2.6 356
31 Thirunelveli 21300 530 4036 532 2.5 150
32 Ariyalur 5300 176 927 122 2.3 14
TAMIL NADU 400000 38077 214827 28329 7.1 15170
Upto Oct.
2019
No
. o
f
E-P
ills
Dis
trib
ute
dO.P. Cycles
DISTRICT WISE ORAL PILLS PERFORMANCE 2019-20 ( UPTO OCTOBER 2019 )
Sl.
No
Name of the
District % o
f
Pe
rfo
rma
nce
to E
LDExpected
Level of
Demand During Oct.
2019
Upto Oct.
2019
23

C.C. Users
1 Ramanathapuram 5300 16126 148702 3541 66.8
2 The Nilgiris 1700 4395 39424 939 55.2
3 Dindigul 11400 23195 256681 6111 53.6
4 Cuddalore 16000 19550 227150 5408 33.8
5 Virudhunagar 19200 14787 245162 5837 30.4
6 Thiruvarur 9200 29655 117310 2793 30.4
7 Nagapattinam 11200 13200 96999 2310 20.6
8 Pudukkottai 13100 11770 108502 2583 19.7
9 Kancheepuram 26000 18442 215259 5125 19.7
10 Chennai 36100 39790 282328 6722 18.6
11 Erode 16900 14804 118095 2812 16.6
12 Krishnagiri 15500 10145 94406 2248 14.5
13 Villupuram 25600 17729 141996 3381 13.2
14 Sivagangai 13200 11410 70165 1671 12.7
15 Vellore 26100 9810 135720 3231 12.4
16 Thiruvallur 17600 9445 83927 1998 11.4
17 Salem 26900 4556 120643 2872 10.7
18 Tiruppur 22700 12175 98286 2340 10.3
19 Perambalur 5800 1325 23961 571 9.8
20 Thiruvannamalai 17700 5096 71436 1701 9.6
21 Ariyalur 7700 2805 30915 736 9.6
22 Karur 10400 5920 40411 962 9.3
23 Thanjavur 30800 19010 117500 2798 9.1
24 Namakkal 15500 6580 58580 1395 9.0
25 Kanyakumari 20700 6518 77421 1843 8.9
26 Theni 12800 5750 42045 1001 7.8
27 Thiruchirapalli 20900 5579 64833 1544 7.4
28 Thoothukudi 15300 4964 46871 1116 7.3
29 Dharmapuri 16200 620 48400 1152 7.1
30 Coimbatore 38400 11160 98100 2336 6.1
31 Madurai 42900 6290 87350 2080 4.8
32 Thirunelveli 31200 6750 49638 1182 3.8
TAMIL NADU 600000 369351 3458216 82338 13.7
During Oct.
2019
DISTRICT WISE C.C. PERFORMANCE 2019-20 (UPTO OCTOBER 2019)
Sl.
No.
Name of the
District
Expected
Level of
Demand
% of
Performance
to ELD
NIRODH Pieces
Upto Oct.
2019
Upto Oct.
2019
24

CHHAYA
Centchroman
(Weekly) Pills
No. of 1st
Dose
No. of
2nd Dose
No. of 3rd
Dose
No. of 4th
Dose
Total
Antara
1 Chennai 6239 1786 444 194 58 2482
2 Vellore 3353 727 274 168 213 1382
3 Salem 8245 1001 254 68 38 1361
4 Madurai 3510 744 333 167 105 1349
5 Dindigul 1286 897 280 107 45 1329
6 Thiruvannamalai 3130 774 325 139 77 1315
7 Coimbatore 1606 680 288 160 129 1257
8 Villupuram 2227 576 243 98 92 1009
9 Sivagangai 2420 537 220 54 40 851
10 Kancheepuram 1494 494 189 81 71 835
11 Thanjavur 1868 483 165 81 92 821
12 Nagapattinam 877 409 193 122 93 817
13 Cuddalore 1378 465 183 73 38 759
14 Erode 2690 416 154 91 88 749
15 Thiruchirapalli 1632 396 165 66 49 676
16 Ramanathapuram 1427 417 119 43 22 601
17 Tiruppur 831 396 131 33 36 596
18 Thiruvallur 770 334 147 64 45 590
19 The Nilgiris 630 254 149 78 89 570
20 Virudhunagar 1150 342 102 61 55 560
21 Krishnagiri 994 248 159 86 59 552
22 Dharmapuri 603 326 128 49 37 540
23 Thiruvarur 1736 280 114 68 56 518
24 Pudukkottai 1198 272 87 63 44 466
25 Theni 2113 254 124 53 32 463
26 Namakkal 5453 158 100 69 78 405
27 Thoothukudi 1983 242 87 46 28 403
28 Thirunelveli 1342 191 65 43 96 395
29 Kanyakumari 1245 160 97 39 24 320
30 Perambalur 756 128 70 40 20 258
31 Karur 743 100 54 30 32 216
32 Ariyalur 357 124 50 15 7 196
65286 14611 5493 2549 1988 24641TAMIL NADU
Sl.
No.District
ANTARA
DISTRICT WISE CHHAYA & ANTARA PERFORMANCE 2019-20
( UPTO OCTOBER 2019)
25

MVA MMA EVAOther
TechniqueTotal
1 Erode 344 2154 0 1290 3788 1226 2562
2 Namakkal 459 1495 0 1160 3114 1744 1370
3 Salem 1863 1325 92 707 3987 2796 1191
4 Trichy 663 194 0 2080 2937 1949 988
5 Cuddalore 241 338 0 1571 2150 1573 577
6 Virudhunagar 465 226 0 555 1246 835 411
7 Coimbatore 487 1072 540 0 2099 1696 403
8 Thiruvanamalai 596 462 0 894 1952 1552 400
9 Villupuram 1108 204 0 388 1700 1302 398
10 Thanjavur 519 420 0 997 1936 1545 391
11 Chennai 4635 736 0 1297 6668 6338 330
12 Trinelveli 459 279 0 1170 1908 1639 269
13 Pudukottai 223 138 0 323 684 422 262
14 Dindigul 368 337 0 814 1519 1265 254
15 Tiruppur 230 495 774 0 1499 1266 233
16 Theni 470 129 0 272 871 665 206
17 Dharmapuri 422 206 0 793 1421 1220 201
18 Nagapattinam 268 132 0 254 654 476 178
19 Thiruvarur 188 112 0 540 840 666 174
20 Madurai 406 274 0 858 1538 1394 144
21 Tiruvallur 316 59 0 692 1067 924 143
22 Kanniyakumari 180 66 0 316 562 422 140
23 Thoothukudi 282 99 0 739 1120 983 137
24 Krishnagiri 149 215 0 1093 1457 1365 92
25 Kancheepuram 328 164 0 807 1299 1218 81
26 Perambalur 311 20 0 164 495 432 63
27 Karur 226 89 5 612 932 878 54
28 The Nilgris 48 84 6 191 329 310 19
29 Ariyalur 145 66 0 67 278 304 -26
30 Ramanathpuram 159 93 0 447 699 744 -45
31 Sivagangai 162 76 0 373 611 664 -53
32 Vellore 580 286 1 1258 2125 2231 -106
17300 12045 1418 22722 53485 42044 11441TAMIL NADU
TECHNIQUE-WISE MTP PERFORMANCE 2019-20 (UPTO OCTOBER 2019)
MTP
Performance
2018-19
(UPTO
OCTOBER 2018)
Inc./
Dec.
MTP PERFORMANCE
(UPTO OCTOBER 2019)Sl.
No
Name of the
District
26

TAT /
Mini LapLap. PA IUCD OP/ CC
Antara
(Injectable
)
Plain
MTPTotal
1 Chennai 830 351 259 1114 758 3356 6668
2 Salem 1000 428 123 346 94 1996 3987
3 Erode 211 17 37 183 10 3330 3788
4 Namakkal 339 128 10 218 1 2418 3114
5 Trichy 255 511 101 41 1 2028 2937
6 Cuddalore 104 292 50 110 1 1593 2150
7 Vellore 227 4 162 302 26 1404 2125
8 Coimbatore 82 150 18 176 70 1603 2099
9 Thiruvanamalai 385 70 44 403 124 926 1952
10 Thanjavur 34 160 7 448 52 1235 1936
11 Trinelveli 91 49 14 343 2 1409 1908
12 Villupuram 159 479 30 117 103 812 1700
13 Madurai 271 4 14 187 1 1061 1538
14 Dindigul 58 170 25 48 63 1155 1519
15 Tiruppur 164 45 24 94 9 1163 1499
16 Krishnagiri 115 71 26 0 0 1245 1457
17 Dharmapuri 138 164 33 36 0 1050 1421
18 Kancheepuram 288 137 29 9 8 828 1299
19 Virudhunagar 216 7 34 111 68 810 1246
20 Thoothukudi 168 21 2 50 9 870 1120
21 Tiruvallur 146 14 64 45 25 773 1067
22 Karur 71 100 11 110 3 637 932
23 Theni 126 1 8 0 0 736 871
24 Thiruvarur 27 24 25 88 4 672 840
25 Ramanathpuram 92 26 5 19 1 556 699
26 Pudukottai 43 14 7 61 12 547 684
27 Nagapattinam 79 33 24 242 6 270 654
28 Sivagangai 96 8 4 15 73 415 611
29 Kanniyakumari 5 106 20 91 0 340 562
30 Perambalur 109 41 1 95 0 249 495
31 The Nilgris 20 21 26 60 6 196 329
32 Ariyalur 66 10 27 80 5 90 278
6015 3656 1264 5242 1535 35773 53485
MTP PERFORMANCE (UPTO OCTOBER 2019)
DistrictSl.
No.
TAMIL NADU
POST ABORTION CONTRACEPTIVE 2019-20 (UPTO OCTOBER 2019)
27
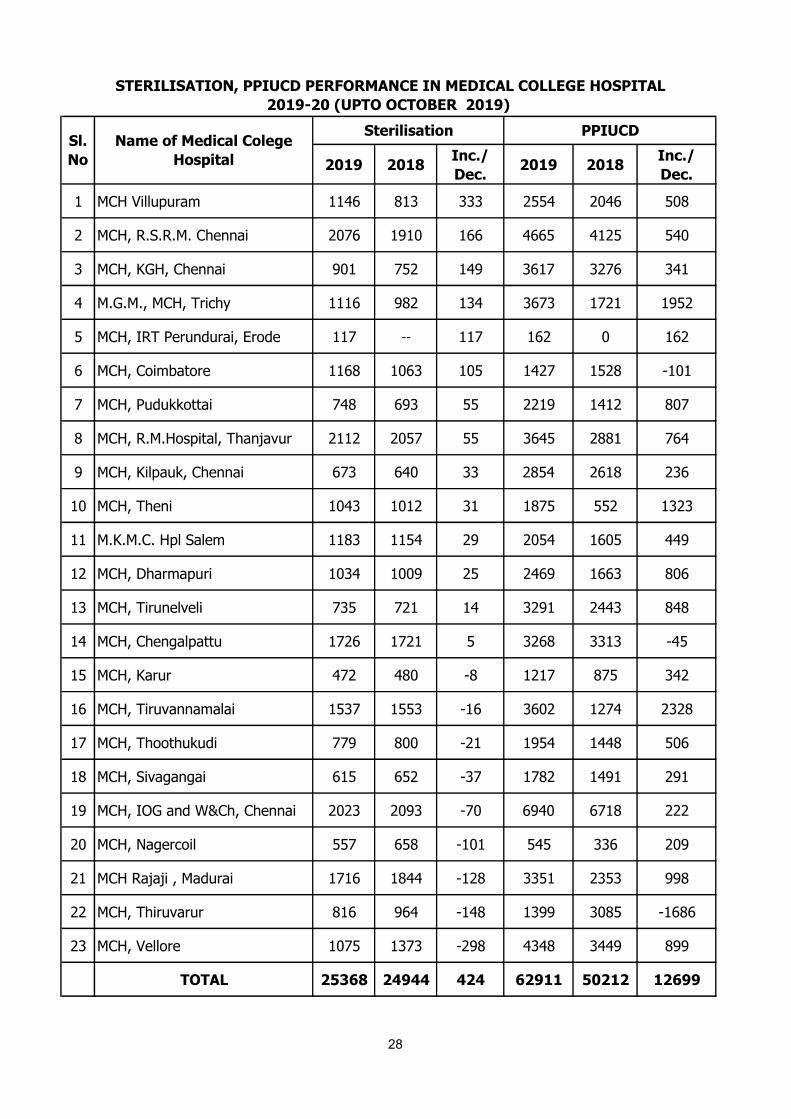
2019 2018Inc./
Dec.2019 2018
Inc./
Dec.
1 MCH Villupuram 1146 813 333 2554 2046 508
2 MCH, R.S.R.M. Chennai 2076 1910 166 4665 4125 540
3 MCH, KGH, Chennai 901 752 149 3617 3276 341
4 M.G.M., MCH, Trichy 1116 982 134 3673 1721 1952
5 MCH, IRT Perundurai, Erode 117 117 162 0 162
6 MCH, Coimbatore 1168 1063 105 1427 1528 -101
7 MCH, Pudukkottai 748 693 55 2219 1412 807
8 MCH, R.M.Hospital, Thanjavur 2112 2057 55 3645 2881 764
9 MCH, Kilpauk, Chennai 673 640 33 2854 2618 236
10 MCH, Theni 1043 1012 31 1875 552 1323
11 M.K.M.C. Hpl Salem 1183 1154 29 2054 1605 449
12 MCH, Dharmapuri 1034 1009 25 2469 1663 806
13 MCH, Tirunelveli 735 721 14 3291 2443 848
14 MCH, Chengalpattu 1726 1721 5 3268 3313 -45
15 MCH, Karur 472 480 -8 1217 875 342
16 MCH, Tiruvannamalai 1537 1553 -16 3602 1274 2328
17 MCH, Thoothukudi 779 800 -21 1954 1448 506
18 MCH, Sivagangai 615 652 -37 1782 1491 291
19 MCH, IOG and W&Ch, Chennai 2023 2093 -70 6940 6718 222
20 MCH, Nagercoil 557 658 -101 545 336 209
21 MCH Rajaji , Madurai 1716 1844 -128 3351 2353 998
22 MCH, Thiruvarur 816 964 -148 1399 3085 -1686
23 MCH, Vellore 1075 1373 -298 4348 3449 899
TOTAL 25368 24944 424 62911 50212 12699
STERILISATION, PPIUCD PERFORMANCE IN MEDICAL COLLEGE HOSPITAL
2019-20 (UPTO OCTOBER 2019)
Sl.
No
Name of Medical Colege
Hospital
Sterilisation PPIUCD
28
Stern. % PPIUCD %
Virudhunagar 780 501 64.2 93 11.9 1
Sivakasi 737 462 62.7 55 7.5 2
Cheyyar 858 535 62.4 112 13.1 3
Kanniyakumari 422 248 58.8 47 11.1 4
Erode 990 534 53.9 66 6.7 5
Thoothukudi 504 268 53.2 48 9.5 6
Villupuram 1700 886 52.1 172 10.1 7
Ramanathapuram 384 190 49.5 38 9.9 8
Paramakudi 675 333 49.3 61 9.0 9
Saidapet 1183 522 44.1 66 5.6 10
Tirunelveli 1286 554 43.1 106 8.2 11
Trichy 1890 794 42.0 597 31.6 12
Nagapattinam 404 162 40.1 21 5.2 13
Namakkal 889 353 39.7 190 21.4 14
Thirupathur 2133 842 39.5 359 16.8 15
Vellore 2130 798 37.5 509 23.9 16
Kanchipuram 1007 372 36.9 51 5.1 17
Sivagangai 820 301 36.7 197 24.0 18
Thiruvarur 634 225 35.5 5 0.8 19
Kovilpatty 385 132 34.3 54 14.0 20
Thiruvallur 2023 679 33.6 253 12.5 21
Tiruvannamalai 2545 808 31.7 472 18.5 22
Kallakurichi 2883 860 29.8 244 8.5 23
Poonamallee 373 107 28.7 33 8.8 24
Thiruppur 810 204 25.2 112 13.8 25
The Nilgiris 273 68 24.9 142 52.0 26
Salem 2395 553 23.1 437 18.2 27
Dharmapuri 1870 417 22.3 267 14.3 28
Theni 718 153 21.3 49 6.8 29
Krishnagiri 1905 396 20.8 164 8.6 30
Sankarankoil 434 89 20.5 87 20.0 31
Cuddalore 1148 228 19.9 93 8.1 32
Madurai 2461 469 19.1 389 15.8 33
Thanjavur 891 154 17.3 205 23.0 34
Pudhukkottai 533 84 15.8 117 22.0 35
Coimbatore 825 122 14.8 99 12.0 36
Dindigul 1113 136 12.2 379 34.1 37
Karur 624 73 11.7 99 15.9 38
Aranthangi 598 56 9.4 197 32.9 39
Perambalur 254 14 5.5 181 71.3 40
Palani 629 20 3.2 314 49.9 41
Ariyalur 626 0 0.0 223 35.6 42
Total 45742 14702 32.1 7403 16.2
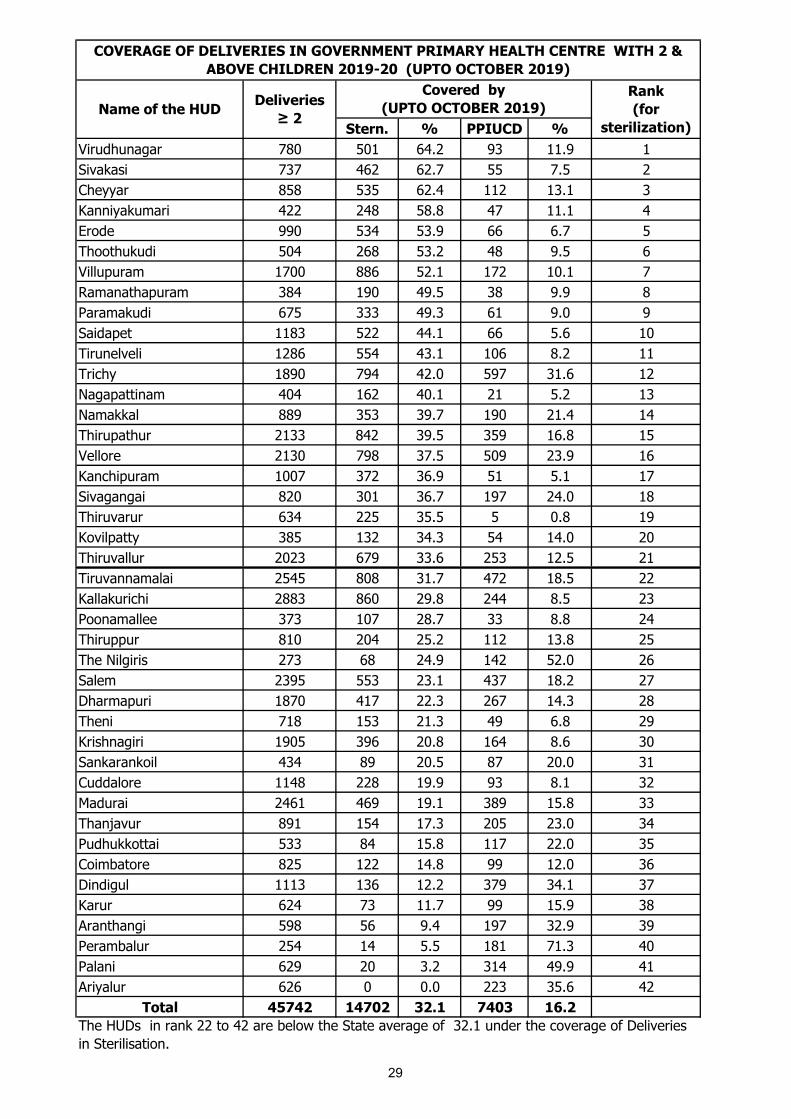
COVERAGE OF DELIVERIES IN GOVERNMENT PRIMARY HEALTH CENTRE WITH 2 &
ABOVE CHILDREN 2019-20 (UPTO OCTOBER 2019)
Name of the HUDDeliveries
≥ 2
Covered by
(UPTO OCTOBER 2019)
Rank
(for
sterilization)
The HUDs in rank 22 to 42 are below the State average of 32.1 under the coverage of Deliveries
in Sterilisation.
29
Stern. % PPIUCD %
KANNIYAKUMARI 1186 1026 86.5 72 6.1 1
THIRUVARUR 1108 804 72.6 207 18.7 2
NAGAPATTINAM 2683 1916 71.4 532 19.8 3
THOOTHUKUDI 1615 1116 69.1 342 21.2 4
ERODE 1675 1151 68.7 270 16.1 5
RAMANATHAPURAM 1733 1168 67.4 244 14.1 6
TIRUNELVELI 1814 1198 66.0 299 16.5 7
SIVAGANGAI 1563 1018 65.1 230 14.7 8
KANCHEEPURAM 2495 1611 64.6 591 23.7 9
VIRUDHUNAGAR 2785 1745 62.7 601 21.6 10
PUDUKKOTTAI 950 594 62.5 270 28.4 11
THIRUVANAMALAI 1517 938 61.8 266 17.5 12
THENI 1313 762 58.0 86 6.5 13
THE NILGIRIS 726 417 57.4 164 22.6 14
NAMAKKAL 1813 1011 55.8 273 15.1 15
THIRUVALLUR 2321 1285 55.4 737 31.8 16
COIMBATORE 1350 734 54.4 261 19.3 17
DINDIGUL 2902 1546 53.3 516 17.8 18
CHENNAI 581 306 52.7 15 2.6 19
KARUR 609 311 51.1 140 23.0 20
MADURAI 1554 785 50.5 341 21.9 21
THIRUPPUR 2391 1205 50.4 480 20.1 22
ARIYALUR 1145 569 49.7 497 43.4 23
VELLORE 3868 1919 49.6 646 16.7 24
CUDDALORE 4095 2028 49.5 801 19.6 25
TRICHY 1813 897 49.5 598 33.0 26
SALEM 1655 740 44.7 453 27.4 27
THANJAVUR 2112 909 43.0 432 20.5 28
DHARMAPURI 620 257 41.5 271 43.7 29
KRISHNAGIRI 3087 1268 41.1 1444 46.8 30
PERAMBALUR 1366 492 36.0 824 60.3 31
VILLUPURAM 3013 1061 35.2 1472 48.9 32
Total 59458 32787 55.1 14375 24.2
Rank
(for
sterilization)
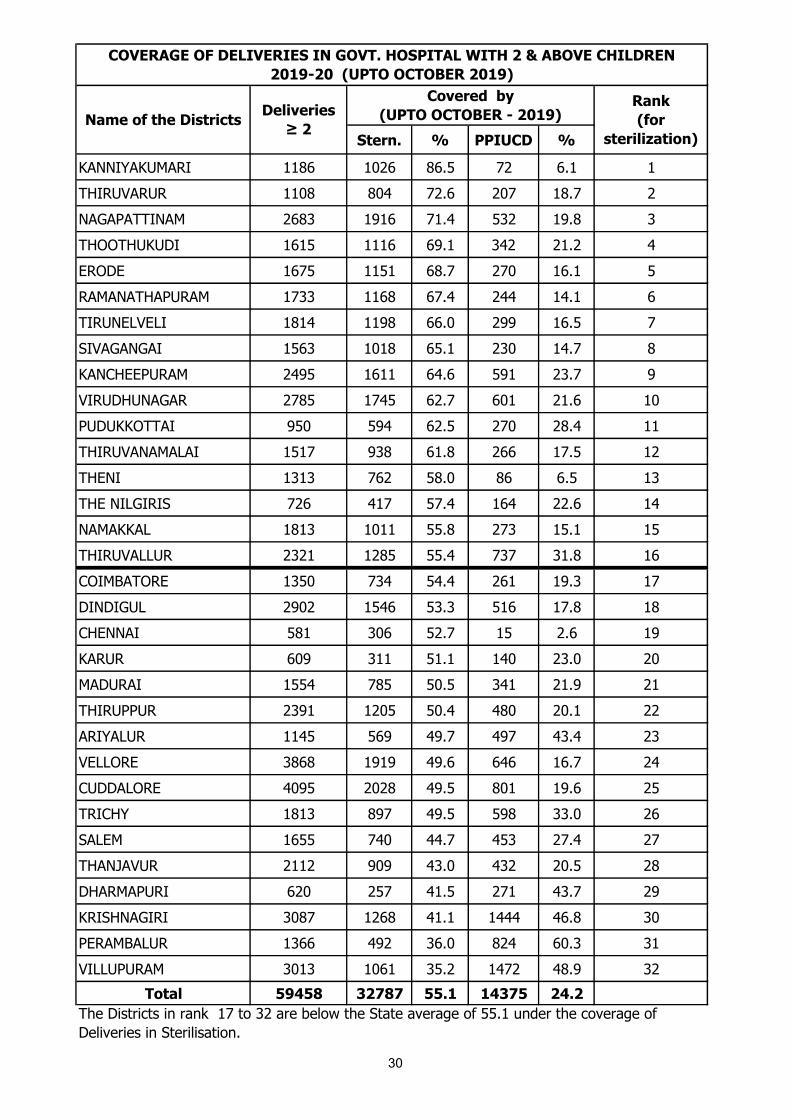
COVERAGE OF DELIVERIES IN GOVT. HOSPITAL WITH 2 & ABOVE CHILDREN
2019-20 (UPTO OCTOBER 2019)
Deliveries
≥ 2Name of the Districts
Covered by
(UPTO OCTOBER - 2019)
The Districts in rank 17 to 32 are below the State average of 55.1 under the coverage of
Deliveries in Sterilisation.
30
DeliveriesCovered
by Stern. %
Covered
by
PPIUCD
%
Ra
nk
(fo
r
ste
rili
za
tio
n)
MCH, R.S.R.M. Chennai 3040 1948 64.1 722 23.8 1
MCH, Thiruvarur 1162 718 61.8 292 25.1 2
MCH, Nagercoil 817 499 61.1 129 15.8 3
MCH, Chengalpattu 2888 1611 55.8 149 5.2 4
MCH Rajaji , Madurai 3103 1672 53.9 792 25.5 5
MCH, Thoothukudi 1350 709 52.5 491 36.4 6
MCH, Karur 785 400 51.0 236 30.1 7
MCH, R.M.Hospital, Thanjavur 4250 2045 48.1 1260 29.6 8
MCH, Sivagangai 1239 584 47.1 488 39.4 9
MCH, Tiruvannamalai 3032 1410 46.5 1076 35.5 10
MCH, IOG and W&Ch, Chennai 4344 1992 45.9 1301 29.9 11
MCH, IRT Perundurai, Erode 237 108 45.6 28 11.8 12
MCH, Theni 2182 978 44.8 377 17.3 13
MCH, KGH, Chennai 1974 863 43.7 1040 52.7 14
MCH, Coimbatore 2158 933 43.2 445 20.6 15
MCH, Pudukkottai 1699 687 40.4 696 41.0 16
MCH, Vellore 2991 1157 38.7 1249 41.8 17
MCH Villupuram 2360 905 38.3 1054 44.7 18
MCH, Tirunelveli 1806 682 37.8 956 52.9 19
M.G.M., MCH, Trichy 2458 870 35.4 1274 51.8 20
M.K.M.C. Hpl Salem 3340 1173 35.1 740 22.2 21
MCH, Dharmapuri 2737 921 33.6 909 33.2 22
MCH, Kilpauk, Chennai 2219 614 27.7 993 44.7 23
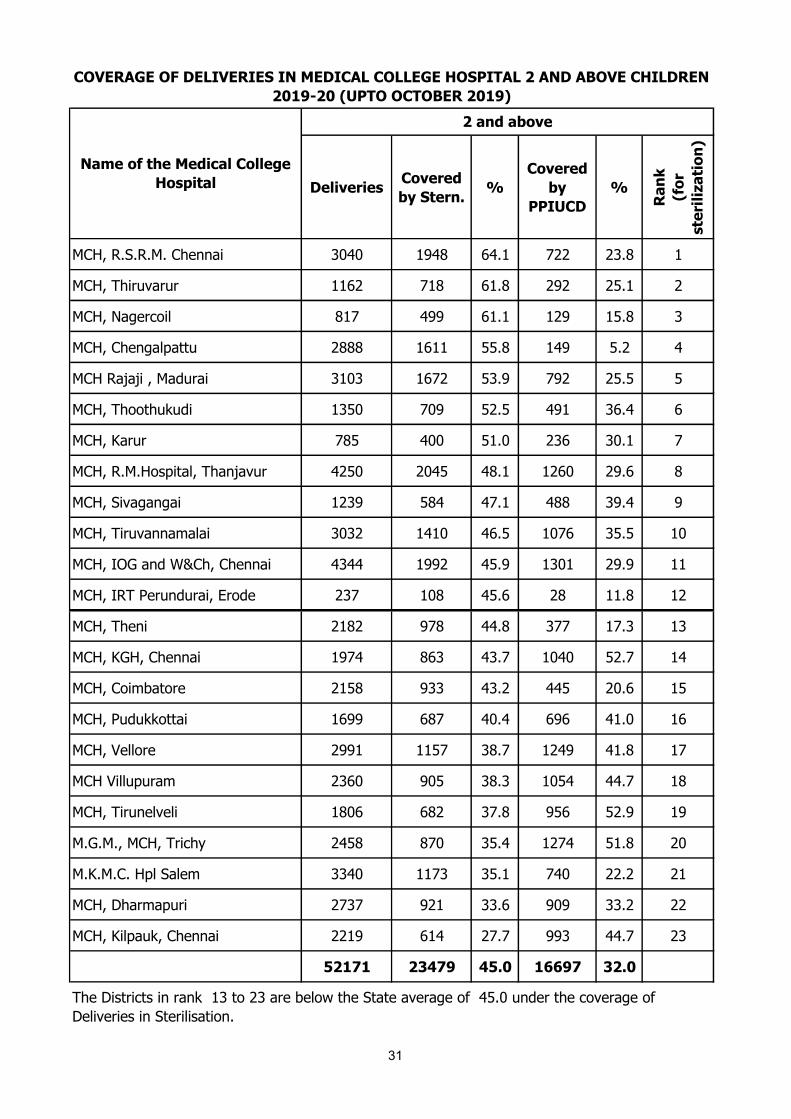
52171 23479 45.0 16697 32.0
The Districts in rank 13 to 23 are below the State average of 45.0 under the coverage of
Deliveries in Sterilisation.
Name of the Medical College
Hospital
2 and above
COVERAGE OF DELIVERIES IN MEDICAL COLLEGE HOSPITAL 2 AND ABOVE CHILDREN
2019-20 (UPTO OCTOBER 2019)
31

DelliveriesCovered by
PPIUCD %
Rank
(for PPIUCD)
Perambalur 133 111 83.5 1
Virudhunagar 616 514 83.4 2
The Nilgiris 183 139 76.0 3
Sivakasi 639 484 75.7 4
Sivagangai 495 343 69.3 5
Palani 354 245 69.2 6
Vellore 1024 687 67.1 7
Thirupathur 1025 687 67.0 8
Namakkal 610 406 66.6 9
Erode 676 439 64.9 10
Ariyalur 376 239 63.6 11
Dindigul 549 343 62.5 12
Cheyyar 382 238 62.3 13
Tiruvannamalai 1180 719 60.9 14
Trichy 1344 785 58.4 15
Aranthangi 339 196 57.8 16
Thiruvallur 1016 584 57.5 17
Pudhukkottai 295 167 56.6 18
Sankarankoil 259 139 53.7 19
Paramakudi 470 250 53.2 20
Karur 386 205 53.1 21
Kovilpatty 241 127 52.7 22
Madurai 1729 897 51.9 23
Tirunelveli 777 400 51.5 24
Salem 1130 575 50.9 25
Kanniyakumari 263 131 49.8 26
Thiruppur 540 258 47.8 27
Dharmapuri 1308 616 47.1 28
Villupuram 808 372 46.0 29
Theni 369 168 45.5 30
Cuddalore 741 328 44.3 31
Ramanathapuram 207 83 40.1 32
Thanjavur 710 284 40.0 33
Kanchipuram 599 233 38.9 34
Krishnagiri 948 349 36.8 35
Coimbatore 496 178 35.9 36
Thoothukudi 264 91 34.5 37
Kallakurichi 1280 441 34.5 38
Poonamallee 204 59 28.9 39
Saidapet 827 236 28.5 40
Nagapattinam 312 72 23.1 41
Thiruvarur 483 52 10.8 42
Total 26587 13870 52.2
COVERAGE OF DELIVERIES IN GOVERNMENT PRIMARY HEALTH CENTRE WITH 0
& 1 CHILD 2019-20 (UPTO OCTOBER 2019)
Name of the HUD
0 and 1 child
The HUDs in rank 23 to 42 are below the State average of 52.2 under the coverage of
Deliveries in PPIUCD.
32

DelliveriesCovered by
PPIUCD %
Rank
(for PPIUCD)
NAGAPATTINAM 3030 2924 96.5 1
THIRUVARUR 1127 1085 96.3 2
ARIYALUR 1270 1208 95.1 3
PERAMBALUR 1693 1606 94.9 4
PUDUKKOTTAI 1077 1021 94.8 5
THOOTHUKUDI 1831 1678 91.6 6
DHARMAPURI 516 472 91.5 7
KRISHNAGIRI 3167 2857 90.2 8
THIRUVALLUR 2658 2365 89.0 9
VIRUDHUNAGAR 4048 3510 86.7 10
KANCHEEPURAM 2805 2389 85.2 11
MADURAI 1708 1446 84.7 12
TIRUNELVELI 1878 1551 82.6 13
KANNIYAKUMARI 1150 934 81.2 14
THE NILGIRIS 888 720 81.1 15
DINDIGUL 3215 2540 79.0 16
ERODE 2237 1767 79.0 17
TRICHY 1512 1188 78.6 18
KARUR 552 429 77.7 19
RAMANATHAPURAM 2031 1574 77.5 20
VILLUPURAM 2380 1767 74.2 21
COIMBATORE 1546 1136 73.5 22
CUDDALORE 3593 2616 72.8 23
THANJAVUR 2258 1584 70.2 24
VELLORE 3627 2542 70.1 25
THIRUPPUR 2921 1958 67.0 26
SALEM 1354 844 62.3 27
NAMAKKAL 2095 1285 61.3 28
THIRUVANAMALAI 902 543 60.2 29
SIVAGANGAI 1496 724 48.4 30
THENI 1501 563 37.5 31
CHENNAI 565 109 19.3 32
Total 62631 48935 78.1
Name of the Districts
0 and 1 child
COVERAGE OF DELIVERIES IN GOVT. HOSPITAL WITH 0 & 1 CHILD 2019-20
(UPTO OCTOBER 2019)
The Districts in rank 19 to 32 are below the State average of 78.1 under the coverage of
Deliveries in PPIUCD.
33

DelliveriesCovered by
PPIUCD %
Rank
(for PPIUCD)
MCH, Karur 1103 981 88.9 1
MCH, KGH, Chennai 2945 2577 87.5 2
MCH, R.S.R.M. Chennai 4525 3948 87.2 3
MCH, Pudukkottai 1818 1523 83.8 4
MCH, Sivagangai 1528 1270 83.1 5
MCH, IOG and W&Ch, Chennai 6860 5696 83.0 6
MCH, Thoothukudi 1801 1493 82.9 7
MCH, Tirunelveli 2815 2332 82.8 8
MCH, Thiruvarur 1391 1105 79.4 9
M.G.M., MCH, Trichy 3067 2399 78.2 10
MCH, Vellore 4112 3099 75.4 11
MCH Villupuram 2025 1501 74.1 12
MCH, Tiruvannamalai 3457 2507 72.5 13
MCH, Chengalpattu 4544 3128 68.8 14
MCH, Theni 2644 1498 56.7 15
MCH, IRT Perundurai, Erode 251 135 53.8 16
MCH, Kilpauk, Chennai 3584 1863 52.0 17
MCH Rajaji , Madurai 5305 2559 48.2 18
MCH, Dharmapuri 3261 1561 47.9 19
MCH, R.M.Hospital, Thanjavur 5217 2388 45.8 20
MCH, Nagercoil 1061 417 39.3 21
MCH, Coimbatore 2882 982 34.1 22
M.K.M.C. Hpl Salem 3912 1331 34.0 23
70108 46293 66.0
COVERAGE OF DELIVERIES IN MEDICAL COLLEGE HOSPITAL
0 AND 1 CHILD 2019-20 (UPTO OCTOBER 2019)
The Districts in rank 15 to 23 are below the State average of 66.0 under the Coverage of
Deliveries in PPIUCD
Name of the Medical College
Hospital
0 and 1 child
34
Ste
rili
sa
tio
n
MV
A w
ith
Ste
rili
sa
tio
n
MM
A w
ith
Ste
rili
sa
tio
n
IU
CD
An
tara
- In
jecta
ble
Co
ntr
ace
pti
ve
CH
HA
YA
-
Ce
ntc
hro
ma
n P
ills
To
tal
Co
ve
rag
e
% o
f T
ota
l C
ove
rag
e
1 Krishnagiri 6 3777 735 30 18 192 138 267 1380 36.5 2397 63.5
2 Sivagangai 2 399 70 1 0 40 7 6 124 31.1 275 68.9
3 Tiruvallur 3 2027 381 0 0 151 47 42 621 30.6 1406 69.4
4 Tiruvannamalai 12 13910 2316 123 132 1019 334 181 4105 29.5 9805 70.5
5 Virudhunagar 2 465 84 0 0 34 4 0 122 26.2 343 73.8
6 Nammakkal 1 568 75 10 0 19 14 12 130 22.9 438 77.1
7 Dindigul 3 3132 535 0 0 156 13 1 705 22.5 2427 77.5
8 Madurai 3 2697 208 4 0 209 115 63 599 22.2 2098 77.8
9 Cuddalore 5 1521 256 1 8 34 22 16 337 22.2 1184 77.8
10 Dharmapuri 7 6660 1262 21 7 97 17 0 1404 21.1 5256 78.9
11 Thoothukudi 8 2042 140 18 4 148 42 30 382 18.7 1660 81.3
12 Pudukkottai 7 6597 753 0 0 218 89 147 1207 18.3 5390 81.7
13 Ramnad 3 1715 249 16 1 9 14 0 289 16.9 1426 83.1
14 Tirunelveli 4 1671 178 0 0 81 1 12 272 16.3 1399 83.7
15 Trichy 6 2530 190 13 1 110 32 25 371 14.7 2159 85.3
16 Villupuram 15 15215 1798 35 3 198 77 53 2164 14.2 13051 85.8
17 Ariyalur 5 9066 905 9 0 252 51 50 1267 14.0 7799 86.0
18 Salem 10 9389 677 110 18 182 103 115 1205 12.8 8184 87.2
19 Karur 3 1725 183 0 9 23 0 2 217 12.6 1508 87.4
20 Perambalur 2 4104 238 9 1 29 75 149 501 12.2 3603 87.8
21 Vellore 13 7260 651 0 0 54 25 20 750 10.3 6510 89.7
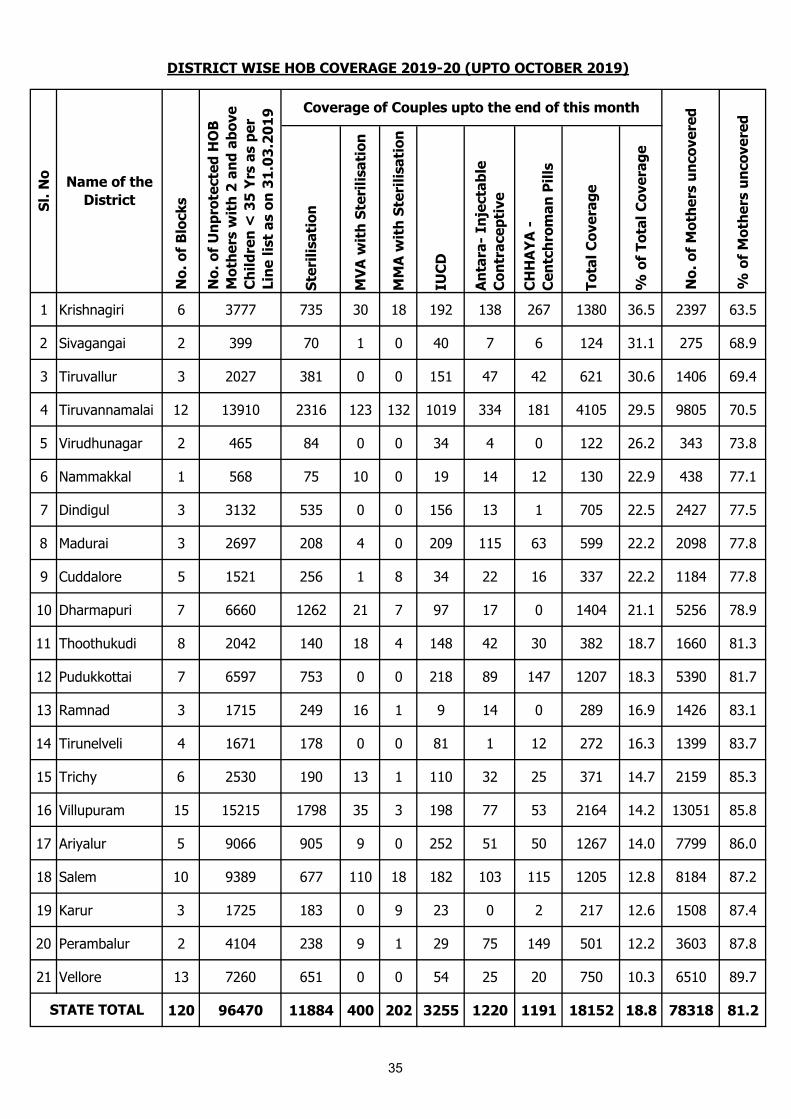
120 96470 11884 400 202 3255 1220 1191 18152 18.8 78318 81.2STATE TOTAL
DISTRICT WISE HOB COVERAGE 2019-20 (UPTO OCTOBER 2019)
No
. o
f U
np
rote
cte
d H
OB
Mo
the
rs w
ith
2 a
nd
ab
ove
Ch
ild
ren
< 3
5 Y
rs a
s p
er
Lin
e l
ist
as o
n 3
1.0
3.2
01
9 Coverage of Couples upto the end of this month
No
. o
f M
oth
ers
un
co
ve
red
% o
f M
oth
ers
un
co
ve
red
Sl.
No
Name of the
District
No
. o
f B
lock
s
35
Male Female Total Male Female
1 2 3 4 5 6 7 8 9 10
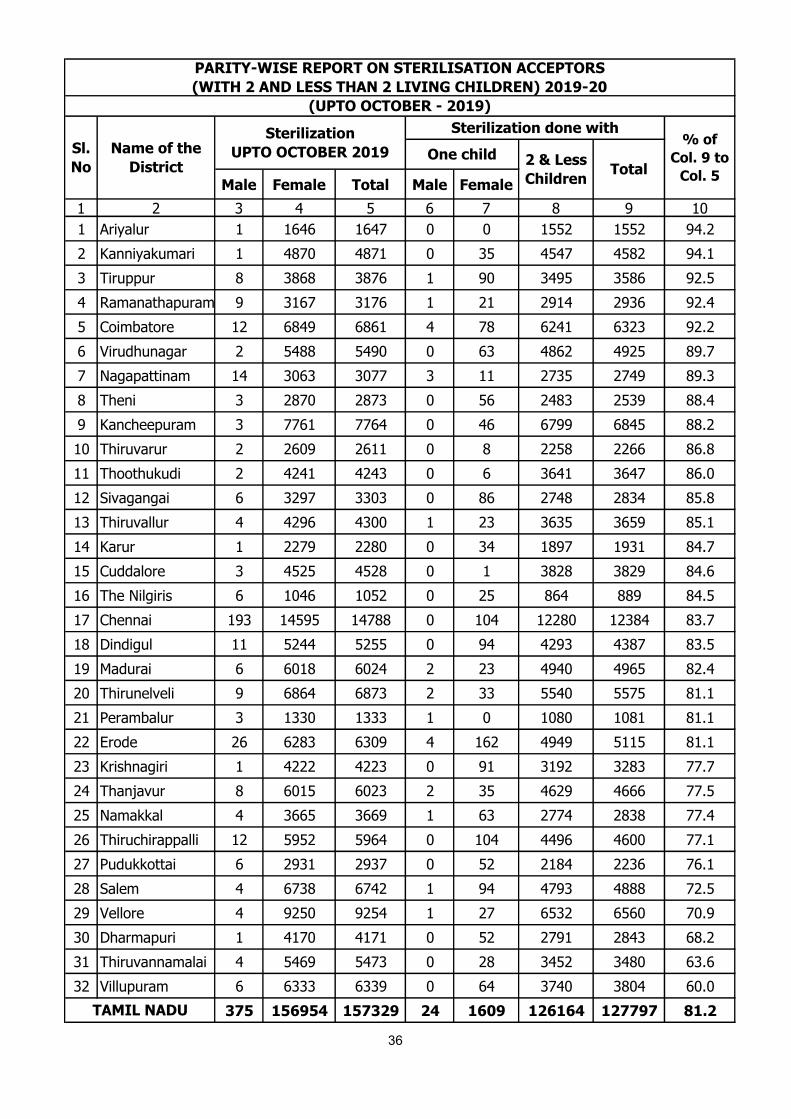
1 Ariyalur 1 1646 1647 0 0 1552 1552 94.2
2 Kanniyakumari 1 4870 4871 0 35 4547 4582 94.1
3 Tiruppur 8 3868 3876 1 90 3495 3586 92.5
4 Ramanathapuram 9 3167 3176 1 21 2914 2936 92.4
5 Coimbatore 12 6849 6861 4 78 6241 6323 92.2
6 Virudhunagar 2 5488 5490 0 63 4862 4925 89.7
7 Nagapattinam 14 3063 3077 3 11 2735 2749 89.3
8 Theni 3 2870 2873 0 56 2483 2539 88.4
9 Kancheepuram 3 7761 7764 0 46 6799 6845 88.2
10 Thiruvarur 2 2609 2611 0 8 2258 2266 86.8
11 Thoothukudi 2 4241 4243 0 6 3641 3647 86.0
12 Sivagangai 6 3297 3303 0 86 2748 2834 85.8
13 Thiruvallur 4 4296 4300 1 23 3635 3659 85.1
14 Karur 1 2279 2280 0 34 1897 1931 84.7
15 Cuddalore 3 4525 4528 0 1 3828 3829 84.6
16 The Nilgiris 6 1046 1052 0 25 864 889 84.5
17 Chennai 193 14595 14788 0 104 12280 12384 83.7
18 Dindigul 11 5244 5255 0 94 4293 4387 83.5
19 Madurai 6 6018 6024 2 23 4940 4965 82.4
20 Thirunelveli 9 6864 6873 2 33 5540 5575 81.1
21 Perambalur 3 1330 1333 1 0 1080 1081 81.1
22 Erode 26 6283 6309 4 162 4949 5115 81.1
23 Krishnagiri 1 4222 4223 0 91 3192 3283 77.7
24 Thanjavur 8 6015 6023 2 35 4629 4666 77.5
25 Namakkal 4 3665 3669 1 63 2774 2838 77.4
26 Thiruchirappalli 12 5952 5964 0 104 4496 4600 77.1
27 Pudukkottai 6 2931 2937 0 52 2184 2236 76.1
28 Salem 4 6738 6742 1 94 4793 4888 72.5
29 Vellore 4 9250 9254 1 27 6532 6560 70.9
30 Dharmapuri 1 4170 4171 0 52 2791 2843 68.2
31 Thiruvannamalai 4 5469 5473 0 28 3452 3480 63.6
32 Villupuram 6 6333 6339 0 64 3740 3804 60.0
375 156954 157329 24 1609 126164 127797 81.2
2 & Less
Children
Sterilization done with
Total
TAMIL NADU
PARITY-WISE REPORT ON STERILISATION ACCEPTORS
(WITH 2 AND LESS THAN 2 LIVING CHILDREN) 2019-20
(UPTO OCTOBER - 2019)
Sl.
No
Name of the
District
Sterilization
UPTO OCTOBER 2019% of
Col. 9 to
Col. 5
One child
36
2019-20 2018-19
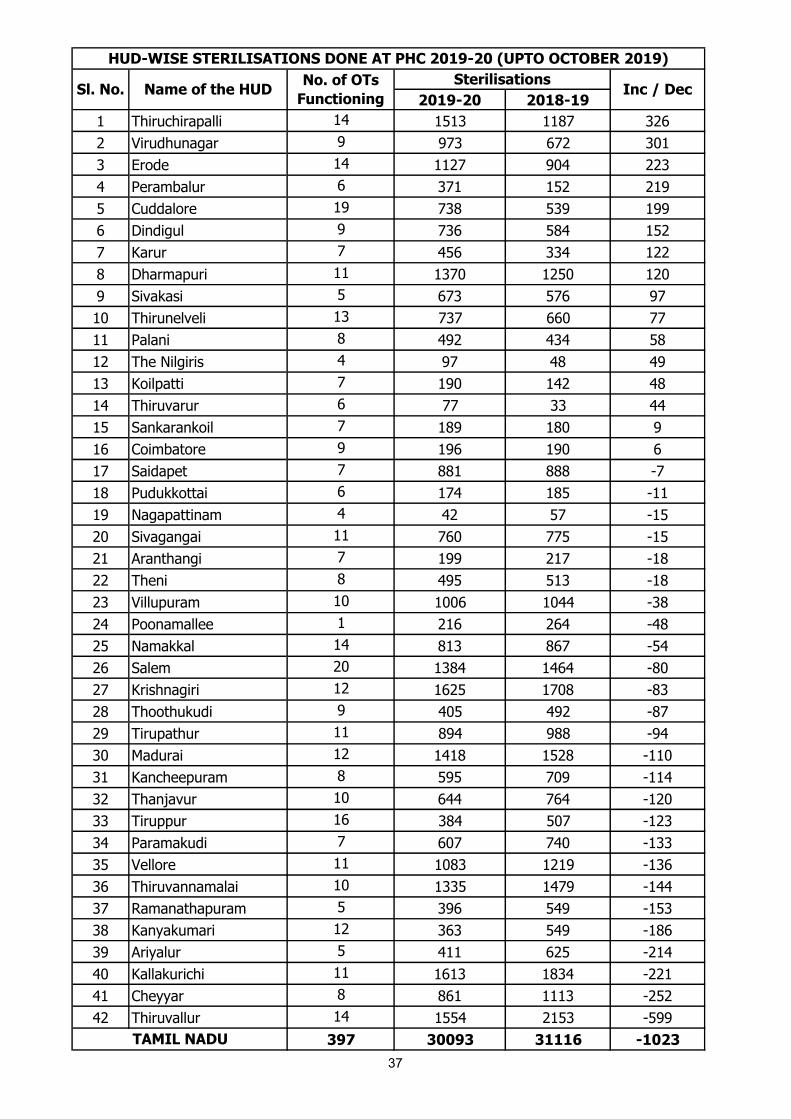
1 Thiruchirapalli 14 1513 1187 326
2 Virudhunagar 9 973 672 301
3 Erode 14 1127 904 223
4 Perambalur 6 371 152 219
5 Cuddalore 19 738 539 199
6 Dindigul 9 736 584 152
7 Karur 7 456 334 122
8 Dharmapuri 11 1370 1250 120
9 Sivakasi 5 673 576 97
10 Thirunelveli 13 737 660 77
11 Palani 8 492 434 58
12 The Nilgiris 4 97 48 49
13 Koilpatti 7 190 142 48
14 Thiruvarur 6 77 33 44
15 Sankarankoil 7 189 180 9
16 Coimbatore 9 196 190 6
17 Saidapet 7 881 888 -7
18 Pudukkottai 6 174 185 -11
19 Nagapattinam 4 42 57 -15
20 Sivagangai 11 760 775 -15
21 Aranthangi 7 199 217 -18
22 Theni 8 495 513 -18
23 Villupuram 10 1006 1044 -38
24 Poonamallee 1 216 264 -48
25 Namakkal 14 813 867 -54
26 Salem 20 1384 1464 -80
27 Krishnagiri 12 1625 1708 -83
28 Thoothukudi 9 405 492 -87
29 Tirupathur 11 894 988 -94
30 Madurai 12 1418 1528 -110
31 Kancheepuram 8 595 709 -114
32 Thanjavur 10 644 764 -120
33 Tiruppur 16 384 507 -123
34 Paramakudi 7 607 740 -133
35 Vellore 11 1083 1219 -136
36 Thiruvannamalai 10 1335 1479 -144
37 Ramanathapuram 5 396 549 -153
38 Kanyakumari 12 363 549 -186
39 Ariyalur 5 411 625 -214
40 Kallakurichi 11 1613 1834 -221
41 Cheyyar 8 861 1113 -252
42 Thiruvallur 14 1554 2153 -599
397 30093 31116 -1023TAMIL NADU
HUD-WISE STERILISATIONS DONE AT PHC 2019-20 (UPTO OCTOBER 2019)
Sl. No. Name of the HUDSterilisations
Inc / DecNo. of OTs
Functioning
37

Sl.
No.Name of the HUD Name of the PHC Reason for Not functioning
1 Ariyalur Kumuliam Waiting for the equipments
2 Coimbatore Kanjampatti Waiting for AC and new equipments
3 Coimbatore Taliyur New threater under construction
4 Coimbatore Arisipalayam Construction going on 30 bedded Hospital
5 Cuddalore Kammapuram Construction completed
6 Cuddalore Krishnapuram Construction completed
7 Cuddalore Muttam construction failure
8 Cuddalore Nallur OT condemmed
9 Cuddalore Thozhudur Civil work completed
10 Karur Kanniyalampatti Construction completed
11 Karur Vangal Under construction (sealing going to be complete)
12 Krishnagiri Kamanddoddi Construction is completed
13 Krishnagiri Jagadevi Construction completed
14 Krishnagiri Singarapettai No theatre is availble
15 Madurai Valayankulam Waiting for Equipments
16 Nagapattinum Thevur CHC Boyles appartus is under maintanance
17 Nagapattinum Vadugachery Newly constructed
18 Nagapattinum Thirumarugal construction completed
19 Nagapattinum Konerirajapuram Newly constructed
20 Nagapattinum Manalmedu Newly constructed
21 Nagapattinum Akkur Trained man power not available
22 Nagapattinum Kariyapattinam OT damaged by Gaja storm. Civil work completed.
23 Nagapattinum Thirupoondi OT damaged by Gaja storm. Civil work completed.
24 Nagapattinum Nallur OT fit for operation, no surgeons available
25 Namakkal Powerkadu OT Construction going on
26 Pudukottai Adhanakottai Steps taken to rectify Electricity Problem
27 Pudukottai Nagudi Electrical work under progress, Fully rewiring
28 Ramnad T.U.Mangai Very old building non availability of water service
29 Ramnad R.S.Mangalam Building repair work under construction
30 Salem Belur Waiting for the equipments
31 Salem Karumandurai Construction is going on (painting work is going on)
32 Sivaganaga Maravamangalam Waiting for Equipments
33 Cheyyar Kolapallur OT condemned
Non-Functioning of Operation Theatres in Govt. Primary Health Centres for the year
2019-20 ( Upto October 2019)
38

Sl.
No.Name of the HUD Name of the PHC Reason for Not functioning
34 T.V.Malai Northampoondi Condemned , waiting for PWD inspection report
35 T.V.Malai SE Gudalur Under construction
36 T.V.Malai Nammiyampattu IUD building is converted into OT, condemned and
not fit for OT
37 T.V.Malai Kommandal OT completed
38 Thanjavur Konulampallam Waiting for the equipments
39 Thanjavur Madukkur Waiting for AC and new equipments
40 Thanjavur Palayapatti Electiric work pending
41 Thanjavur Silathur Waiting for 2nd swab test result
42 Thanjavur Thamariyankottai Waiting for 3rd swab test result
43 The Nilgiris KodanaduCivil Work under construction, water leakage from
ground
44 Theni Gandamanur Anaesthetist scarcity
45 Sankaran koil Vadakarai Kilpidagai PWD maintenance request given
46 Sankarankoil Nettur OT Construction going on
47 Sankarankoil Ariyappapuram New OT should be constructed
48 Thiruppur PerumanallurOG Doctor is on Long Leave due to Met an
accident and bone fracture.
49 Thiruvarur Poonthottam First Swab test is positive.
50 Thiruvarur Adiyakkamangalam Instruments not available, waiting for swab test
51 Thiruvarur Alathambadi OT Condemned.
52 Thiruvarur Thirumakottai Ceiling leakage. Work pending with PWD.
53 Thiruvarur Muthupet Instruments and materials purchase is not
available. Waiting for second swab test
54 Tiruchirapalli D. Pettavaithalai OT is converted into labour room
55 Tiruchirapalli Mettupalayam Waiting for PWD inspection report
56 Thirupathur Pudurnadu Waiting for swab test and equipments
57 Kallakurichi Vilandhai OT Condemned
58 Villupuram Murukkeri Waiting for the equipments
59 Villupuram Kiliyanur OT Construction going on
60 Sivakasi Thayilapatti Construction completed
61 Virdhunagar M.Reddiapatti OT condemned
Non-Functioning of Operation Theatres in Govt. Primary Health Centres for the year
2019-20 ( Upto October 2019)
39

M F M F M F
1 Ariyalur 0 0 0 0 0 0
2 Chennai 0 1 0 22 0 0
3 Coimbatore 0 0 0 1 0 0
4 Cuddalore 0 0 0 15 0 0
5 Dharmapuri 0 0 0 9 0 0
6 Dindigul 0 0 0 14 0 0
7 Erode 0 0 0 6 0 0
8 Kancheepuram 0 0 0 20 0 0
9 Kanyakumari 0 0 0 5 0 0
10 Karur 0 0 0 2 0 0
11 Krishnagiri 0 0 0 9 0 0
12 Madurai 0 0 0 19 0 0
13 Nagapattinam 0 0 0 0 0 0
14 Namakkal 0 0 0 8 0 0
15 Perambalur 0 0 0 0 0 0
16 Pudukkottai 0 0 0 7 0 0
17 Ramanathapuram 0 0 0 4 0 0
18 Salem 0 0 0 10 0 0
19 Sivagangai 0 0 0 10 0 0
20 Thanjavur 0 0 0 8 0 0
21 The Nilgiris 0 0 0 6 0 0
22 Theni 0 0 1 3 0 0
23 Thiruchirapalli 0 0 0 7 0 0
24 Thirunelveli 0 0 0 28 0 0
25 Thiruvallur 0 0 0 6 0 0
26 Thiruvannamalai 0 0 0 15 0 0
27 Thiruvarur 0 0 0 0 0 0
28 Thoothukudi 0 1 0 17 0 0
29 Thiruppur 0 0 0 1 0 0
30 Vellore 0 0 0 30 0 0
31 Villupuram 0 0 0 12 0 0
32 Virudhunagar 0 0 0 12 0 0
Total 0 2 1 306 0 0
DEATH, FAILURE AND COMPLICATION REPORT FOR THE YEAR 2019-20
(UPTO OCTOBER 2019)
Sl. No DistrictDEATH FAILURE COMPLICATION
40
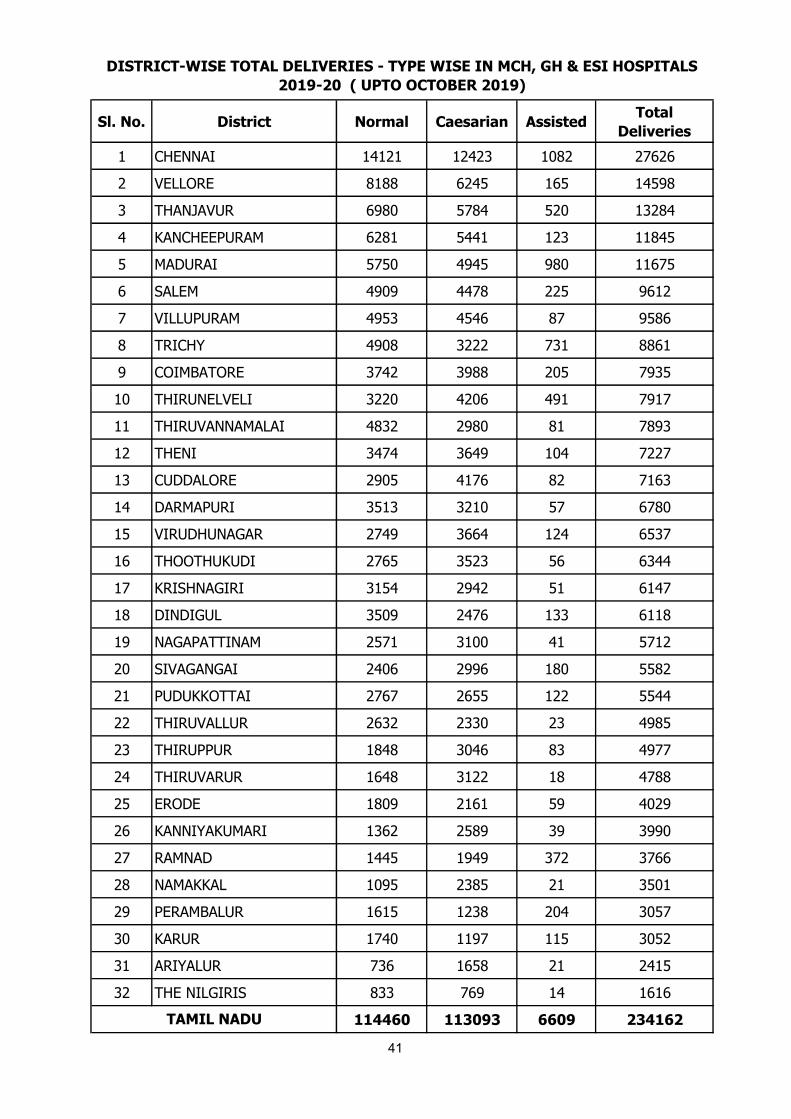
Sl. No. District Normal Caesarian AssistedTotal
Deliveries
1 CHENNAI 14121 12423 1082 27626
2 VELLORE 8188 6245 165 14598
3 THANJAVUR 6980 5784 520 13284
4 KANCHEEPURAM 6281 5441 123 11845
5 MADURAI 5750 4945 980 11675
6 SALEM 4909 4478 225 9612
7 VILLUPURAM 4953 4546 87 9586
8 TRICHY 4908 3222 731 8861
9 COIMBATORE 3742 3988 205 7935
10 THIRUNELVELI 3220 4206 491 7917
11 THIRUVANNAMALAI 4832 2980 81 7893
12 THENI 3474 3649 104 7227
13 CUDDALORE 2905 4176 82 7163
14 DARMAPURI 3513 3210 57 6780
15 VIRUDHUNAGAR 2749 3664 124 6537
16 THOOTHUKUDI 2765 3523 56 6344
17 KRISHNAGIRI 3154 2942 51 6147
18 DINDIGUL 3509 2476 133 6118
19 NAGAPATTINAM 2571 3100 41 5712
20 SIVAGANGAI 2406 2996 180 5582
21 PUDUKKOTTAI 2767 2655 122 5544
22 THIRUVALLUR 2632 2330 23 4985
23 THIRUPPUR 1848 3046 83 4977
24 THIRUVARUR 1648 3122 18 4788
25 ERODE 1809 2161 59 4029
26 KANNIYAKUMARI 1362 2589 39 3990
27 RAMNAD 1445 1949 372 3766
28 NAMAKKAL 1095 2385 21 3501
29 PERAMBALUR 1615 1238 204 3057
30 KARUR 1740 1197 115 3052
31 ARIYALUR 736 1658 21 2415
32 THE NILGIRIS 833 769 14 1616
114460 113093 6609 234162
DISTRICT-WISE TOTAL DELIVERIES - TYPE WISE IN MCH, GH & ESI HOSPITALS
2019-20 ( UPTO OCTOBER 2019)
TAMIL NADU
41

=
X1000
No. of Live Births which occured among the
population of the same area during the same year
STATISTICAL VITAL RATES FORMULAE
Crude Birth Rate (CBR) =
No. of Live Births which occurred in a given
geographical area during a given yearX 1000
Mid year estimated population of the same area
during the same year
X 100000
Total No. of Live Births in a given year
Crude Death Rate (CDR) =
No. of Deaths which occurred in a given
geographical area during a given yearX 1000
Mid year estimated population of the same area
during the same year
Infant Mortality Rate (IMR) =
No. of Deaths under one year of age which
occured among the population of a given area
during a given year
1000
Still Birth Rate (SBR) =
No. of Still Births which occurred in a given
geographical area during a given year
X 1000Total No. of Delivery (Live Birth + Still Birth) of
the same geographical area during the same year
Maternal Mortality Ratio (MMR) =
Total No. of woman who die as a result of
pregnancy and child birth complications
X 100
Total No. of Live Births
Age Specific Fertility Rate
(ASFR) =
No. of Live Births to the mothers of a speicific age
group of population in a given geographical area
during the given yearX 1000
Mid year female population of the specified age
groupin the given area during the same year
Total Fertility Rate (TFR)
(Where the age grouping is in
class interval of 5 years)
=
5 X summation of ASFR
% of HOB
No. of Live Births 3 and above
42