contentsaustraliancharities.acnc.gov.au/wp-content/uploads/2015/... · web viewfigure 2.4 shows...
TRANSCRIPT


Australian Charities and Not-for-Profits CommissionThe Australian Charities and Not-for-Profits Commission (ACNC) is Australia’s national charity regulator. Registered charities are required to provide the ACNC with an Annual Information Statement comprising up-to-date corporate governance and financial data. The ACNC has commissioned CSI at UNSW to analyse charity data and provide reports for distribution to the sector and the broader Australian community. This closes the feedback loop for charities required to provide data and provides empirically-based insights into Australia’s charities. ACNC data can also be explored at: http://australiancharities.acnc.gov.au
The Centre for Social ImpactThe Centre for Social Impact (CSI) is a collaboration between the University of New South Wales, The University of Western Australia and Swinburne University of Technology. CSI’s mission is to create beneficial social impact in Australia through teaching, research, measurement and promoting public debate. We consider and promote best practice and thought leadership in the context of a systems thinking approach to social purpose.
The Social Policy Research CentreThe Social Policy Research Centre (SPRC) at the University of New South Wales was founded in 1980 as Australia’s first national research centre dedicated to shaping awareness of social welfare issues. The Centre makes a positive impact through independent and leading research that explores the key social issues of poverty, inequality, wellbeing and justice.
Research teamCentre for Social Impact
Roger Simnett, Abigail Powell, Rebecca Reeve, Andrew Young, Ioana Ramia
Social Policy Research CentreNatasha Cortis
Suggested citationCortis, N., Powell, A., and Ramia, I. (2017) Australia’s Aged Care Charities in 2015. Centre for Social Impact and Social Policy Research Centre, UNSW Australia.
Contact for follow upAbigail Powell, Senior Research Fellow, Centre for Social Impact: Email: [email protected] Ph: 02 8936 0916
AcknowledgementsThe research team has benefited from the extensive expertise, commitment and support of Susan Pascoe AM, Ross Gillott, Emma Chiu, Susan Cotterill, Melville Yates, Tim Liu and Benjamin Rashid from the ACNC, Chris Twomey from Western Australian Council of Social Services (WACOSS) and the Aged Care reference group. We thank the charities that contributed to the case studies: Resthaven, Your Aged Care at Home, Mecwacare, Advocare, and Matrix Guild Victoria. Any errors or omissions are those of the authors.
©ACNC for the Commonwealth of Australia. You are free to copy, adapt, modify, transmit and distribute this material as you wish (but not in any way that suggests the ACNC or the Commonwealth endorses you or any of your services or products). However, we do ask that you cite the report using the suggested citation above.
2

ContentsContents.........................................................................................................................................3Figures...........................................................................................................................................5Figures in Appendices..................................................................................................................6Abbreviations................................................................................................................................7Executive summary.......................................................................................................................8
Key findings...........................................................................................................................8Where does the data come from?..........................................................................................9
1. Introduction..........................................................................................................................10Charities in Australia’s aged care sector..............................................................................10Australia’s formal aged care framework...............................................................................10Contribution of this report.....................................................................................................12Case studies of aged care charities.....................................................................................13Report series using 2015 data.............................................................................................13Constructing a dataset to build Australia’s evidence-base..................................................13
2. Introducing Australia’s Aged Care charities.....................................................................16Examining the size of Australia’s aged care charities..........................................................16How old are Australia’s aged care charities?.......................................................................16Case Study 1: Your Aged Care at Home Ltd.......................................................................17Where are aged care charities located?..............................................................................18What business structures are used by Australia’s Aged care charities?.............................22
3. What do Australia’s Aged Care charities do?...................................................................25Other charities involved in aged care...................................................................................25Case Study 2: Advocare Incorporated.................................................................................26How do Australia’s Aged Care charities pursue their purpose?..........................................26Plans to change purpose.....................................................................................................29Who else do Australia’s aged care charities help?..............................................................30Case Study 3: Matrix Guild Victoria Inc. (Matrix).................................................................32
4. Who works in Australia’s Aged Care charities?................................................................33Paid employees in Australia’s aged care charities...............................................................33Case Study 4: Mecwacare Incorporated..............................................................................34Volunteers in Australia’s Aged Care Charities.....................................................................35Aged care charities with both volunteers and employees....................................................35
5. How do Aged Care charities fund their activities?...........................................................37Total income........................................................................................................................37Sources of income...............................................................................................................38Funding from Government sources.....................................................................................39Donations and bequests......................................................................................................40Other income and revenue..................................................................................................41
6. How do Australian aged care charities allocate their funds?..........................................43Total expenses.....................................................................................................................43Spending on employees......................................................................................................44Spending on grants and donations......................................................................................44Case Study 5: Resthaven Incorporated (Resthaven)..........................................................45
7. A closer look at the finances of Australia’s aged care charities.....................................46Income and expenditure......................................................................................................46Assets..................................................................................................................................47Expense ratios.....................................................................................................................48
3

8. How are Australia’s Aged Care charities changing?........................................................51Change in total income........................................................................................................51Change in employment in aged care charities.....................................................................51Change in volunteers...........................................................................................................52
9. Conclusion............................................................................................................................53References...................................................................................................................................54Appendix A: Supplementary tables...........................................................................................55Appendix B: Aged care Charities by highest income..............................................................56Appendix C: Further methodological details...........................................................................57
Data inclusion......................................................................................................................57Group data...........................................................................................................................57Data cleaning - ACNC..........................................................................................................57Data cleaning/omission – Research team...........................................................................58Estimation model.................................................................................................................58Change over time model......................................................................................................59
4

FiguresFigure 1.1 Summary of data sources..................................................................................................15
Figure 2.1 Size profile of aged care charities and all charities, 2015.................................................16
Figure 2.2 Age profile of aged care charities and all charities (%), 2015...........................................17
Figure 2.3 Proportion of aged care charities operating in Australia by number of jurisdictions, 2015. . ..........................................................................................................................................19
Figure 2.4 Aged care charities registered and operating in each jurisdiction, 2015...........................19
Figure 2.5 Proportion of aged care charities operating in each state and territory by size, 2015 (%).............................................................................................................................................20
Figure 2.6 Aged care charities operating in each jurisdiction, per 1,000 residents aged 65 or over, 2015...................................................................................................................................21
Figure 2.7 Entity type of reporting charities, aged care and all charities 2015 (%)............................22
Figure 2.8 Proportion of aged care charities which were Public Benevolent Institutions, compared with all charities, 2015 (%).................................................................................................23
Figure 2.9 Proportion of aged care charities with DGR status by size, 2015 (%)..............................24
Figure 3.1 Main activities of charities which selected aged care as a general activity, 2015.............25
Figure 3.2 Charitable purpose of aged care charities, 2015 (%)........................................................27
Figure 3.3 Word frequency: how Australia’s aged care charities pursue their purpose.....................28
Figure 3.4 Beneficiaries of aged care charities and all charities, 2015..............................................31
Figure 4.1 Full time, part time and casual staff, aged care charities, 2015........................................33
Figure 4.2 Proportion of aged care charities and proportion of employees in aged care charities by size, 2015 (%)....................................................................................................................34
Figure 4.3 Proportion of aged care charities with volunteers by size, 2015 (%)................................35
Figure 4.4 Aged care charities and all charities with paid employees and volunteers 2015 (%).......36
Figure 4.5 Proportion of aged care charities with employees and volunteers, 2015 (%)...................36
Figure 5.1 Summary of income sources, aged care charities and all charities 2015.........................37
Figure 5.2 Concentration of income, aged care charities and all charities 2015................................38
Figure 5.3 Key indicators of income sources, aged care charities, 2015...........................................38
Figure 5.4 Aged care charities for which government grants comprised more than 50% of total income, 2015 (%)..............................................................................................................40
Figure 5.5 Aged care charities for which donations and bequests comprised more than 50% of total income, 2015 (%)..............................................................................................................41
Figure 5.6 Proportion of total income from ‘other income’ by size of aged care charity, 2015 (%)....42
Figure 6.1 Summary of expenditure, 2015 ($)....................................................................................43
Figure 6.2 Mean total expenditure by size, 2015 ($)..........................................................................43
Figure 6.3 Aged care charities for which employee expenses were zero, 2015 (%)..........................44
Figure 6.4 Expenditure on grants, 2015 ($)........................................................................................44
Figure 7.1 Average Net Income Ratio by Size, Aged Care Charities, 2015 (%)................................47
Figure 7.2 Summary of assets and liabilities, aged care charities 2015 ($).......................................47
5

Figure 7.3 Net Asset Ratio by Size, 2015...........................................................................................48
Figure 7.4 Years assets could cover expenses, by size of aged care charities, 2015.......................49
Figure 7.5 Years assets could cover expenses, by years since aged care charities were established, 2015...................................................................................................................................50
Figure 8.1 Percentage change in income among aged care charities, 2014 to 2015........................51
Figure 8.2 Percentage change in volunteers, 2014 to 2015...............................................................52
Figures in Appendices Figure A. 1 Staff in aged care charities by size............................................................................55
Figure A. 2 Aged care charities with no paid staff by size............................................................55
Figure A. 3 Expenditure on grants by aged care charities............................................................55
6

AbbreviationsABN Australian Business Number
ABR Australian Business Register
ACFA Aged Care Financing Authority
ACNC Australian Charities and Not-for-profits Commission
AIS Annual Information Statement
CSI Centre for Social Impact
DGR Deductible Gift Recipient
L Large charities (total income $1,000,000 to <$10,000,000)
M Medium charities (total income $250,000 to <$1,000,000)
ORIC Office of the Registrar of Indigenous Corporations
PBI Public Benevolent Institution
S Small charities (total income $50,000 to <$250,000)
SPRC Social Policy Research Centre
XL Extra large charities (total income $10,000,000 to <$100,000,000)
XS Extra small charities (total income <$50,000)
XXL Extra, extra large charities (total income >$100,000,000)
7

Executive summaryThis report profiles 1,465 registered charities which reported that their main activity in 2015 was aged care. It is a companion report to Australian Charities Report 2015 and other resources available at http:// australiancharities.acnc.gov.au .
Key findingsIn 2015 Australia’s 1,465 aged care charities made up 2.9% of all registered charities, but they accounted for:
9.3% of the charity sector’s total income 10.8% of the charity sector’s income from government 9.5% of the charity sector’s total expenditure 13.8% of charities’ total assets 14.1% of all charity sector employees.
While many aged care charities deliver residential aged care and home care services as part of the national aged care system, charities perform a much wider range of activities benefiting older people, including providing cultural and recreational opportunities, social services and religious services.
Characteristics of aged care charities
Aged care charities tend to be larger than other charities. Relatively small proportions of aged care charities operate with incomes under $1 million (49.6% compared with 83% among all charities).
Around half of aged care charities (54.2%) are based in major cities.
Staff and volunteers
Aged care charities are much more likely to operate with paid staff than other charities. In 2015, aged care charities employed 171,863 paid staff. Full time workers were in the minority:
o 60.7% of employees were part timeo 16.4% were full timeo 22.9% were casual.
On average, aged care charities had 117.5 paid employees; however, many had a much smaller workforce (median number of staff was 15).
93.2% of aged care charities engaged volunteers, and the average number was 90 (median of 25).
Income sources
Together, aged care charities had a total income of $12.5 billion in 2015. A quarter of this income was reported by the 13 largest aged care charities.
Government income is important to aged care charities. o 65.2% of aged care charities received income from government compared with 35.1%
of all charities. o 48.0% of aged care charities’ total income came from government, compared with
41.4% across all charities.
8

Donated income makes a relatively small contribution to the overall income of aged care charities.
o High proportions of aged care charities are recognised as Public Benevolent Institutions (PBI) and Deductible Gift Recipients (DGR), and relatively high proportions of aged care charities receive some income from donations and bequests.
o However, donations and bequests make a relatively small contribution to the overall income of aged care charities, comprising 1.4% of aged care charities’ total income compared with 8.3% across all charities.
Finances
Australia’s aged care charities had assets of $37.0 billion, and net assets of $16.0 billion in 2015.
Aged care charities’ net income ratio was 6.4% (indicating an average surplus of 6.4% of total income).
Change over time (2014-2015)
Aged care charities had higher rates of growth than across the whole charity sector. From 2014-2015:
The total income reported by aged care charities grew by 6.6% (compared with 2.0% among all charities).
Employment in aged care charities grew by 3.0% (compared with 0.7% among all charities), although most growth occurred in casual staff numbers:
o The number of full time staff in aged care charities fell by 10.3% from 2014 to 2015.o Growth in part time staff was modest (2.6%). Growth in casual staff was much higher,
at 16.0% from 2014 to 2015.
Where does the data come from?
The data comes from Australian charities registered with the ACNC at the end of their 2015 reporting period.1 In most cases, information was drawn from the charity’s Annual Information Statements (AIS) 2015, or from the charity’s 2014 or 2013 AIS where 2015 data was unavailable. Where no AIS data was available, information was used from the ACNC Register. Where financial information was not reported by charities, it was estimated based on data reported by comparable charities, to help build a complete picture of the charity sector.
Visit http:// australiancharities.acnc.gov.au to:
Download a summary of the Australian Charities Report 2015 – a view of the charity sector in pictures.
Interact with “datacubes” to view and customize graphics for the whole Charity Sector or for one or two Sectors (for example, Health or Education).
Download specific interest reports, including on Australia’s smallest charities, charities working with people with disabilities, charities working internationally and charity red tape.
1 Charities which, by the end of the 2015 AIS lodgement period, had not provided their AIS for 2 years (and met the criteria for deregistration) were excluded. A number of charities which report to the Office of the Registrar of Indigenous Corporations (ORIC) were also excluded.
9

1. IntroductionAustralia’s aged care industry supports over 1.3 million older people, and is growing rapidly (Department of Health, 2016). Within the industry, charities are significant participants, contributing to the wellbeing, health and independence of older people and their families. This report provides in-depth analysis of Australia’s 1,465 ‘aged care charities’, defined as charities which were registered with the Australian Charities and Not-for-profits Commission (ACNC) in 2015 and which reported ‘aged care activities’ as their main activity.2
Charities in Australia’s aged care sectorIn 2015, Australia’s 1,465 aged care charities accounted for 2.9% of all registered charities. These charities contribute through a range of charitable purposes including by advancing health, welfare, culture, and promoting the rights of elderly people. Often, charities assist older people with activities of daily living in residential or home-based settings, including personal care like bathing and dressing, and meal provision. Many provide services as part of Australian Government residential and home care programs, and are approved aged care providers. However, charities also perform a wide range of other activities in the community to promote independence and enrich the lives of older people. For example, charities may promote social and cultural participation and connectedness among older Australians through recreational activities, culture and the arts, a range of social services, and religion.
Australia’s formal aged care frameworkAs noted above, many charities operate as part of Australia’s formal aged care system. In this system, the Australian Government plays a key funding, policy and regulatory role, to ensure older people’s functional and social needs are met. Consistent with objectives of promoting independence, governments aim for aged care services that are accessible, well-planned, appropriate to the needs of recipients and carers, person-centred, and high quality.
In 2014-15, Australia had over 2,000 providers supplying aged care services, including charities and other non-profits, for-profit, and public sector organisations. These service providers employed over 350,000 aged care workers, including nurses, personal care workers, support staff and allied health professionals (Department of Health, 2016). Volunteers also make a significant contribution across the aged care sector, although their numbers and contribution are not frequently captured in key policy documents relating to the aged care workforce.
The Aged Care Financing Authority (ACFA) (2016a) estimated that in 2014-2015 the Australian Government spent $15.2 billion on aged care, and a further $4.5 billion was spent by consumers. The main aims of this expenditure are to promote the wellbeing and independence of older people (and their carers), by enabling them to stay in their own homes or by assisting them in residential care (Productivity Commission, 2017). The Aged Care Act 1997 and accompanying Aged Care Principles are the main regulatory instruments establishing Australia’ aged care framework, although some services are provided outside of this Act.
As of 30 June 2016 there were 283,268 aged care places funded through the formal aged care system. This consisted of 199,499 residential places and 78,956 home care places, along with 4,000 restorative care places (Department of Health, 2016). Residential aged care accounts for the largest share of the Australian Government’s aged care spending each year, constituting around $11.4 billion in total, or approximately $63,400 for each permanent residential aged care recipient (Department of Health, 2016). As the population ages, this level of spending is expected to grow at 5.1% per year (Department of Health, 2016).
Within the aged care market, charities are important participants. However, the extent of their contribution has not been clear, as data has not previously focused precisely on registered charities.
2 Many charities perform aged care activities, but not as their main activity. We provide some details about this group in Chapter 3.
10

Existing data sources do show however that charities are significant recipients of government and private expenditure on aged care, and supply a wide range of care and other services. While the categories do not perfectly align with the registered charity sector, in 2015, organisations defined by ACFA as ‘charitable providers’ comprised 256 of 1,084 (23.6%) Commonwealth Home and Community Care (HACC) providers (ACFA, 2016a: 44), and held 31.9% of home care packages (ACFA, 2016a: 56). These figures however may understate the contribution of charities, because ACFA data collections also use categories of ‘religious’ or ‘community-based’ providers, and do not include a separate category of ‘registered charities’, nor identify how many religious or community-based providers were registered charities.
Notwithstanding definitional issues, charities clearly play an important role in aged care service delivery. As well as providing home care, they are also significant providers of residential aged care: charitable providers and other non-profits account for 54% of providers and 57% of aged care places (ACFA, 2016a: 76)3. However, the proportion of operational residential aged care places owned by those defined by ACFA as ‘charitable providers’ was much smaller (17.3%) compared to ‘religious providers’ (24.4%) (although some of these may be registered charities). In comparison, private for-profits held (38.4%) of places. Community based providers had 13.8% and state, territory and local governments (combined) serviced the remaining residential aged care places (6.1%) (Department of Health, 2016).
In addition to Australian Government funding, State, Territory and local governments also have a role in funding and delivering aged care services. In particular, State and Territory governments are involved in administering Aged Care Assessments, and jointly administering some care services (Productivity Commission, 2017). While all levels of government are involved in aged care, government funding subsidises only a portion of the total care costs. Private funding also makes a significant contribution; clients and residents contribute through fees and payments, and charitable donations also provide another source of income for providers (Productivity Commission, 2017)
Understanding the diverse activities of Australia’s aged care charitiesWhile many of Australia’s aged care charities deliver government funded residential aged care and community care services and supports, they also perform a range of other activities to benefit older people which fall outside of this system, including social services, cultural and recreational activities, and religious services. By focusing on registered charities and not a particular program or system, this report illustrates the wide range of supports provided to benefit older Australians and meet their diverse needs. Building on the Australian Charities Report 2015, this report provides further information about the diversity and contribution of Australia’s aged care charities, and illustrates the rapid growth occurring within this sector.
Transformation in the aged care sectorAustralia’s aged care charities are operating in the context of rapid growth, and major changes to the aged care framework. Demand for aged care services is growing. The proportion of people aged 65 years or over in the total population is projected to increase from 15% in 2015-2016 to 18% in 2026, with those aged 85 and over growing from 2.0% to 2.3% of the population, compounding fiscal pressures (Department of Health, 2016).
The growth and development of the aged care sector, and charities within it, is likely to continue, given growing recognition that many of the assistance needs of older people are not effectively being met under current arrangements. In 2015, 30.8 per cent of people aged 65 years and who were living at home and needed assistance reported that their assistance needs were not fully met (Productivity Commission, 2017: 14.14, citing ABS Survey Disability Ageing and Carers 2015). The proportion was higher for older people with a profound and severe disability (37.4 per cent) than for older people without a disability (20.8 per cent) (Productivity Commission, 2017: 14.14, citing ABS Survey Disability Ageing and Carers 2015).
3 In the ACFA (2016) report, data is not reported separately for charities and non-profit providers for residential aged care, as it is for home care.
11

Within a wider context of industry growth, aged care charities are also growing. As documented in the Australian Charities Report 2015, from 2014 to 2015 aged care charities’ income grew by 6.6%, compared with 2.0% across all charities (Cortis et al, 2016). Employment in aged care charities grew by 4,327 (3.0%), compared with 0.7% among all charities. It is anticipated that growth trends will continue as Australia’s population continues to age, with charities and other aged care providers expected to supply 76,000 additional residential care places over the next decade in response to rising demand (ACFA, 2016a).
As aged care charities grow, they also need to adapt to policy and industry reforms. These should aim to respond to the challenges of an ageing population; stronger preferences among older Australians for supported independent living over residential care; growing diversity in care needs and preferences of older people; and widespread perceptions of service rigidity and inefficiency in traditional approaches to aged care (Productivity Commission, 2008; ACFA, 2016a). A major change affecting charities and other aged care providers is the consumer-centred funding model. From 2017, home care packages have been assigned to older Australians to direct to their preferred provider, rather than allocated to providers. The Productivity Commission’s Inquiry into Aged Care (2011) sparked the implementation of consumer-centred funding, through the Living Longer, Living Better policy (2012), which commenced in July 2014. The ACFA and My Aged Care website were also established under these reforms.
Financial performance of aged care providers
The ACFA notes increased merger and acquisition activity in the residential sector, although financial performance has been improving. While it is not disaggregated for charities and other providers, the Authority reports that 72% of home care providers achieved a net profit in 2014-15, compared to 66% in 2013-14. The improvement was slightly lower in residential care, with 68% of residential providers achieving a net profit in 2014-15 compared to 66% in 2013-15 (ACFA, 2016). Among residential aged care providers in 2014-15, not-for-profit organisations made a 4.6% net profit before tax; this was lower than for-profit organisations (9.0%), but higher than government organisations (-7.1%) (ACFA, 2016a: 96).
Services in rural and remote areas were more likely to experience high cost pressures that affected their financial results. The ACFA (2016) identified financial issues affecting rural and remote aged care providers, and identified that geographical isolation affects financial results through workforce costs to engage and retain staff, travel, freight, access to allied health professionals, limited internet coverage, and small scale facilities and services due to smaller catchment areas (ACFA, 2016b). While directed to the residential sector as a whole, and not only regional and remote or charitable providers, the ACFA suggested providers develop stronger governance and financial management strategies, better asset management, and administrative efficiencies, including pooled services.
It is not clear how the financial performance of charities and other aged care providers compares. However, Deloitte (2016) has noted that for-profit providers have led new capital investment in aged care, and in 2015 were awarded 63% of new licenses. In the context of consolidation within the residential care sector, for profit providers have recently increased the relative size of their operations (ACFA, 2016a).
Contribution of this reportBy providing a profile of Australia’s aged care charities, the report shows their distinctiveness and underlines the importance of the contribution these charities make to Australia’s social fabric. While aged care charities are important in terms of providing government funded aged care services, the ACNC data highlights a much wider range of services and supports which charities provide to older Australians.
The report illustrates some key characteristics of aged care charities, including their size. However, as a charity’s size is based entirely on annual income (in this case the 2015 financial year), some caution should be used when interpreting the findings. This is because aged care charities may, for example, have large assets and no current revenue, or could have a small revenue in the current
12

year, but large expenses. While size categories are primarily based on revenue, we also give close consideration to the asset base of charities, given their importance for many aged care activities.
The analysis in this report is sourced from the same data that was used in the main report, Australia Charities Report 2015 (which profiles all registered charities). In general, data here comes from charities registered with the ACNC at the end of the charity's 2015 financial year.4 The dataset uses the best and most recent data available for each charity. In most cases, data came from Annual Information Statements (AIS) provided for 2015. Where 2015 data was unavailable it was taken from the 2014 or 2013 AIS (whichever was more recent). Additional data was taken from the ACNC Register and from the Australian Business Register. Where no AIS data was available, data was estimated, where possible using information from the ACNC Register. The methodology for this estimation process is described in the Australian Charities Report 2015.
Together this information builds an accurate picture of the characteristics, structure, activities, purpose and resources of Australia’s aged care charities. For the first time, it also uses a panel data set which shows the change among charities between 2014 and 2015.
Case studies of aged care charitiesThroughout the report we provide case studies of aged care charities. These provide additional insight into the activities and contribution Australia’s aged care charities, and their staffing, volunteers, income sources, expenditure, and challenges for the future. These case studies help highlight the diversity of Australia’s aged care charities, and the ways they are orienting themselves to confront emerging challenges in the policy and operating environment.
Report series using 2015 dataThis report should be read alongside Australian Charities Report 2015. Data can also be explored at http:// australiancharities.acnc.gov.au , where you can:
Download a summary of Australian Charities Report 2015 – a view of the charity sector in pictures.
Interact with “datacubes” to view and customize graphics for the whole Charity Sector or for one or two Sectors (for example, Health or Education).
Download special interest reports, including previous reports on Australia’s smallest charities (also using 2015 data) and reports on charities working with people with disabilities, charities working internationally and charity red tape (based on 2014 data).
Constructing a dataset to build Australia’s evidence-baseFull details of the dataset are in Australian Charities 2015 Report. In summary, data from the following sources was matched using Australian Business Numbers (ABNs):
The ACNC Register The Australian Business Register Charities’ Annual Information Statements.
In the whole dataset, there were 50,908 records containing information about the activities of 51,679 charities.5 However, this report is focused on the 1,465 charities which reported aged care was their main activity in their 2015 AIS.
4 Charities which, by the end of the 2015 AIS lodgement period, had not provided their AIS for 2 years (and met the criteria for deregistration) were excluded. Charities which report to the Office of the Registrar of Indigenous Corporations (ORIC) were also excluded.5 There were 58 aged care charities which reported as part of 14 groups. Each group is treated as a single charity.
13

The ACNC RegisterThe ACNC Register contains information provided by charities for the purposes of registering with the ACNC. This includes their legal name, ABN, date of establishment and their charitable purpose. The register is available publicly on the ACNC website.6 The ACNC Register is a ‘living’ dataset. It is regularly updated by the ACNC as new charities are registered or report a change of details, or as charities have their registration voluntarily or involuntarily revoked. Some data in this report, including charities’ date of establishment, and charitable purpose, is derived from the register, as this information was not captured in the AIS.
The Australian Business Register (ABR) datasetThe ABR contains details provided by Australian businesses and organisations when they register for an Australian Business Number (ABN). It includes information about whether or not charities are endorsed for tax concessions. Relevant ABR data were obtained by the ACNC and provided to the research team for matching to the ACNC Register and 2015 AIS data. In this report, ABR information is used to profile charities’ legal structure, and their Deductible Gift Recipient (DGR) status. It is important to note that for some charities, ABR data may be incorrect or out of date compared to data held on the ACNC Register.
The Annual Information Statement (AIS) datasetMost information in this report comes from information reported by charities to the ACNC as part of their AIS. The 2015 AIS captures the key characteristics of charities and their activities in the reporting period ending in 2015. The standard ACNC reporting period is the financial year from 1 July to 30 June. However, charities that use a different reporting period can apply for a ‘substituted accounting period’ (ACNC, 2015a). The time period reported on in the AIS is based on the reporting period used by the charity.
The AIS captures information including charity size, activities, beneficiaries, employee and volunteer numbers, and locations of operations. Since 2014, AIS information has included financial information. Not all registered charities were required to provide an AIS in 2015 (such as newly established charities), and not all providing an AIS were required to provide financial information (such as basic religious charities).
The dataset incorporates information from the 2015 AIS for 1,465 aged care charities which had provided the required information to the ACNC by 19 September 2016. Among those who provided their 2015 AIS, there were 58 charities which reported as part of 14 groups. Each group is treated as a single charity for the purposes of this analysis, as it is not possible to disaggregate the data and assign values to each charity in the group.
Although the 2015 AIS provides the best source of information about a charity in 2015, some charities were not required to provide a 2015 AIS, while others were required to report but had not done so in time for the analysis. In these cases, proxy information for the charity was used.
Where 2015 AIS data was not available and proxy data was required,7 information was estimated based on the best available data about the charity which was held by the ACNC. In most cases information was drawn from the charity’s previous AIS. For aged care charities, data came from the 2015 AIS for the vast majority of charities (1386, or 94.6%). Data came from the 2014 AIS for 61 aged care charities and the 2013 AIS was used for 4 aged care charities. The composition of the dataset is presented in Figure 1.1.
6 Charities are able to withhold commercially sensitive details, if public release could cause harm to the charity or a person, or endanger public safety ACNC. (2016) Information on the ACNC Register: withheld information. Available at: http://acnc.gov.au/ACNC/FindCharity/About_Register/Withheld_info/ACNC/Reg/With_info.aspx.7 Charities did not report 2015 either because they were not required to, or in a smaller number of cases, because they had not done so in time for the analysis.
14

Figure 1.1 Summary of data sources
Source Number of Aged Care Charities Percent
2015 AIS 1386 94.6
Group charities, 2015 AIS 14 1.0
2014 AIS 61 4.22013 AIS 4 0.3
Total 1465 100.0
Some questions in the AIS were not answered by all charities, so the total number of responses to each question may vary. Non-response reduces the accuracy with which the findings represent the whole population of registered charities. Notwithstanding, the near complete nature of the data, and the approach to identifying and correcting errors means the dataset provides the most accurate and comprehensive information available about Australia’s charities, to date.
Want to know more about the data?Further information about the dataset, including estimation processes and data quality, can be found in Appendix C: Further methodological details.
15

2. Introducing Australia’s Aged Care charitiesIn this chapter we introduce some basic information about Australia’s aged care charities, showing their size, age, location, and business structures.
Examining the size of Australia’s aged care charitiesIn 2015, the 1,465 aged care charities in Australia comprised 2.9% of all charities. These were of varied size (based on income in 2015). As shown in Figure 2.2, aged care charities’ size profile differed to the wider charity sector. Compared to the whole charity sector, a much smaller proportion of aged care charities had incomes under $1 million.8 Correspondingly, a higher proportion of charities were in the larger categories (incomes over $1 million).
In fact, 13.4% and 1.9% of aged care charities had incomes over $10 million and $100 million respectively, whereas for all charities these figures were 3.7% and 0.3%.
Figure 2.2 Size profile of aged care charities and all charities, 2015
Aged care charities All charities0%
10%
20%
30%
40%
50%
60%
70%
80%
90%
100%
17.47
37.116.25
30.2
15.84
15.735.15
13.113.383.71.91 0.3
XS (<$50k) S ($50k-$250k) M ($250k-$1m) L ($1m-$10m) XL ($10m-$100m) XXL (>$100m)
Notes: n=1,465 (aged care charities). n=50,908 (all charities)
How old are Australia’s aged care charities?On average, aged care charities have been established for 36.6 years (median 31.0). Aged care charities were slightly older than the average of 34.1 years across all charities (median 24.0 years).
8 Consistent with the Australian Charities Report, we use six detailed income categories ranging from ‘Extra small’ (XS) to Extra extra large (XXL). These size categories concord with the three categories used by the ACNC for administrative purposes: small (under $250,000); medium ($250,000 to $1 million), and large (over $1 million).
16

This is reflected in Figure 2.2, which shows that more than half of aged care charities were established between 20 and 50 years ago (58.4%), compared with 38.6% of all charities. A slightly higher proportion of aged care charities were established between 50 and 100 years ago (19.2% compared with 13.5%). About 2% of aged care charities were established 100 or more years ago. Very few aged care charities were established in the last five years: 0.1% of aged care charities were established less than 1 year ago, compared with 0.4% of all charities. Similarly, 2.2% of aged care charities were established 1 to 5 years ago, compared with 8.6% of all charities. This suggests that the growth in the aged care sector (such as growth in income and employment, which we discuss later) is arising from growth among existing charities rather than the establishment of new charities. Nevertheless, there are still new aged care charities being establishing in Australia and an example of one is presented in Case Study 1.
Figure 2.3 Age profile of aged care charities and all charities (%), 2015
Less than 1 year
1 to less than 5 years
5 to less than 10 years
10 to less than 20 years
20 to less than 50 years
50 to less than 100
years
100 years or more
0
10
20
30
40
50
60
70
0.1 2.26.0
11.8
58.4
19.2
2.20.4
8.612.0
20.4
38.6
13.5
6.5
Aged care charities All charities
N=1,378 (age of establishment was missing for 87 aged care charities).
Case Study 1: Your Aged Care at Home Ltd
Your Aged Care at Home operates in the suburbs of Sydney, and is part of the minority of aged care charities defined as small, having income under $250,000. The charity is relatively new, having been in operation for less than five years. Only 3% of Australia’s aged care charities have been around for fewer than five years – the vast majority (nearly 80%) have been established for 20 years or more.
The charity works hard to deliver affordable and high quality services to elderly people. It is particularly focussed on supporting older people who are frail, financially disadvantaged, at risk of homelessness or who have experienced homelessness.
Your Aged Care at Home provides some services subsidised through the Commonwealth Government’s Home Care Packages Program (HCPP). It also offers a free ‘comfort pet’ service to
17

various residential care facilities as well as those living alone in the community, aimed at improving older people’s mental health and wellbeing.
Your Aged Care at Home is aware that many of its beneficiaries are highly vulnerable people, and that it is crucial that protections are in place to support its beneficiaries. To achieve this, the charity has established strategies to ensure good governance and transparency within its operations.
Your Aged Care at Home engaged a total of 11 staff – mostly part-time – and 3 volunteers during 2015. Like the majority of aged care charities, most of Your Aged Care at Home’s expenses went towards employee costs. However, small aged care charities like Your Aged Care at Home contribute to less than 1% of the sector’s total employment. This is largely due to the significant levels of employment by XL and XXL charities, with organisations in those two categories employing 80% of total staff in the sector.
In 2015, Your Aged Care at Home’s reported income was $188,981, 78% of which came from government funding. Reliance on government funding as a main source of income appears to be less common among small aged care charities (28.2%) than larger ones (around 60%). Your Aged Care at Home also generates revenue from brokered aged care services, and from fundraising activities, such as regular garage sales and eBay sales. The charity is keen to attract more donations but has found doing so challenging as many larger corporations already have charities that they support.
Another challenge for Your Aged Care at Home to address is the changing policy and operating environment in the aged care sector. The aged care reforms are expected to introduce some level of uncertainty for the charity as new service providers may enter the scene and funding arrangements change. Nevertheless, Your Aged Care at Home remains focussed on meeting the needs of its beneficiaries.
Where are aged care charities located?The dataset captures two types of information about charities’ locations. Main or registered business address shows the location in which charities were registered or based. Information about charities’ main business address includes their state and postcode. Of course, many charities operate in multiple sites. Their registered business address indicates their ‘home’, but does not necessarily represent the areas in which they conduct activities. For this reason, the AIS also asks which Australian states and territories and overseas countries charities conducted charitable activities in the reporting period. This shows the jurisdictions in which charities operated.
The vast majority of aged care charities (1,363 or 93.3%) operated in a single State and Territory, while 88 aged care charities (6.0%) operated in between 2 and 7 jurisdictions, and only 10 (0.7%) operated in every Australian jurisdiction. This is largely reflective of the type of services aged care charities provide, which tend to be highly localised. Figure 2.4 shows how a relatively high proportion of aged care charities operated in a single jurisdiction, compared with the wider charity sector.
18

Figure 2.4 Proportion of aged care charities operating in Australia by number of jurisdictions, 2015
Aged care charities All charities0%
10%
20%
30%
40%
50%
60%
70%
80%
90%
100%
93.386.0
6.08.7
0.7 5.3
Operated in a single State or Territory Operated in 2 to 7 States and/or TerritOperated in every State and Territory
Notes: n=1461 aged care charities (4 aged care charities were excluded as they reported having no operations in Australia). n=48,617 for all charities (2291 reported no operations in Australia for the reporting period).
Distribution of charities across Australian jurisdictionsFigure 2.5 shows that the largest number of aged care charities had a registered business address in New South Wales (517 aged care charities, or 35.6%), and 39.0% of aged care charities operated there. A little over one-fifth of aged care charities were based in Victoria (21.5%) and 23.3% reported operating there.
Small numbers of aged care charities were based in the smaller jurisdictions, with Tasmania, the ACT, and NT each being the main business address of less than 100 aged care charities. However, many more aged care charities operated in these jurisdictions: Tasmania had 89 aged care charities in operation although only 66 were based there, the ACT had 49 in operation although only 20 were based there, and the NT had 19 operating although only 1 was based there. This is consistent with previous findings showing smaller jurisdictions are serviced by charities based in the more populous states.
Figure 2.5 Aged care charities registered and operating in each jurisdiction, 2015
Aged care charities’ registered address in each jurisdiction
Aged care charities operating in each jurisdiction
n % n %NSW 517 35.6 571 39.0VIC 312 21.5 341 23.3QLD 279 19.2 320 21.8WA 129 8.9 146 10.0SA 127 8.8 144 9.8TAS 66 4.6 89 6.1ACT 20 1.4 49 3.3NT 1 0.1 19 1.3Total 1451 100.0 -- --
19

Notes: Main business address was missing for 14 group reporting charities. The number of charities operating in each jurisdiction adds to more than the total of charities, as a charity can operate in more than one jurisdiction. Figures may not add due to rounding.
Figure 2.6 shows the size profile of aged care charities operating in each jurisdiction. This shows there was a relatively high proportion of very large aged care charities operating in the ACT, while Victoria and Tasmania had relatively high proportions of extra small charities in operation. In most jurisdictions however, aged care charities were most commonly large, having incomes between $1 million and $10 million, with the exception of Queensland, which had a relatively high proportion of charities in the medium category (incomes between $50,000 and $250,000).
Figure 2.6 Proportion of aged care charities operating in each state and territory by size, 2015 (%)
ACT NT WA SA QLD NSW VIC TAS0%
10%
20%
30%
40%
50%
60%
70%
80%
90%
100%
8.2 5.315.8 16.7 16.3 14.5
22.0 19.1
20.4 31.617.1 16.0
26.9
14.211.7 19.1
12.25.3
6.2 10.4
17.5
20.3 10.09.0
30.642.1 42.5 38.2
24.435.7
39.0 29.2
10.2
10.5 13.7 15.3 12.5 13.0 15.3 22.518.4
5.3 4.8 3.5 2.5 2.3 2.1 1.1 XS S M L XL XXL
Distribution of aged care charities per capitaFor every 1,000 people aged 65 and older, there was 0.4 aged care charities operating in Australia. However, this differed slightly for some jurisdictions, which may reflect differences in levels of need among older people and service gaps resulting from patterns of provision from other providers, among other factors. While the larger jurisdictions had 0.4 or 0.5 charities in operation per 1,000 older people, this was higher in the smaller jurisdictions, with 0.9 charities per 1,000 residents aged 65 or over in Tasmania, 1.0 in the ACT, and 1.1 in the Northern Territory. However, it should be noted that although the AIS data indicates whether or not a charity had operations in each jurisdiction, it doesn’t tell us about the nature or scale of charities’ operations in each jurisdiction, nor how staffing or expenditure of multi-jurisdictional charities are divided within or across states.
20

Figure 2.7 Aged care charities operating in each jurisdiction, per 1,000 residents aged 65 or over, 2015
Victoria
Western
Aus...
Queensla
nd
New So
uth ...
South Austr
...
Tasman
ia
Australi
an Cap
i...
Northern
Ter...
0.0
0.2
0.4
0.6
0.8
1.0
1.2
0.40.4 0.5 0.5 0.5
0.91.0
1.1
Notes: population data is for June 2015 (ABS, 2016) Australian Demographic Statistics, 31010DO002_2016_06, Table 7.
Aged care charities in rural and remote areasA little over half of aged care charities were based in Australia’s major cities (791, or 54.2%), while 392 aged care charities (26.9%) were based in inner regional, 230 (15.8%) were outer regional, and 47 (3.2%) were based in areas classified as remote or very remote areas.9 As such, while aged care charities were 2.9% of all providers, they constituted 4.2% of all charities based outside the major cities. Very few aged care charities said they had overseas operations (24 or 1.6% of all aged care charities). Figure 2.7 Aged care charities based in major cities, regional and remote areas, 2015
54.2
26.9
15.8
2.1 1.2
Major Cities of AustraliaInner Regional AustraliaOuter Regional AustraliaRemote AustraliaVery Remote Australia
9 Charities were allocated to these categories based on their postcodes. Postcodes of main business address were coded against the Australian Bureau of Statistics Remoteness Areas 2011, part of the Australian Standard Geographical Classification (ABS, 2011) to show the distribution of charities across major cities, regional and remote Australia.
21

What business structures are used by Australia’s Aged care charities?Charities’ business structures shape their legal identities, governance structures, financial responsibilities and compliance obligations. Charities are required to declare their legal structure and charitable purpose(s) when registering with the ACNC, and to the Australian Business Register when they apply for an ABN.
Entity typeThere are some notable differences in the entity types used by aged care charities compared to those used by all charities (see Figure 2.8). This may reflect the need for organisations to be incorporated in order to be approved providers under some government programs. Of the 1,451 charities for which data was available (all but 14 group charities), the majority (60.0%) were incorporated entities (generally incorporated associations). This was high relative to the wider charity sector, perhaps reflecting the larger size profile of aged care charities. Correspondingly, a smaller proportion of aged care charities were unincorporated (17.7% compared with 31.3% of all charities), and there were relatively low proportions of trusts (3.3% compared with 12.2%).
Figure 2.8 Entity type of reporting charities, aged care and all charities 2015 (%)
Aged care charities All charities 0%
10%
20%
30%
40%
50%
60%
70%
80%
90%
100%
60.0
41.0
17.71
31.3
16.6112.3
3.3112.2
2.34 3.2
Incorporated entity Unincorporated entity Public company Trusts Other legal structure
Notes: XS charities= 1,451. All charities =50,792 (data was missing for 114 groups, including 14 aged care charities, and 2 who did not record their entity type).
Charity sub-typeCharity sub-type is determined according to the charity’s purpose, and affects eligibility for some tax concessions. A very high proportion of aged care charities had public benevolent institution (PBI) status10 (69.9% compared with 16.3% of all charities). This is shown in Figure 2.9. As noted in the Australian Charities Report 2015, larger charities were much more likely to be recognised as public benevolent institutions. This was also evident among aged care charities, with almost 9 in 10 XL aged care charities, and all XXL aged care charities, having PBI status.
10 Public benevolent institutions are institutions whose main purpose is to relieve poverty or distress. More information is at https://www.acnc.gov.au/ACNC/Pblctns/Factsheets/FS_PBI/ACNC/FTS/Fact_PBI.aspx
22

Figure 2.9 Proportion of aged care charities which were Public Benevolent Institutions, compared with all charities, 2015 (%)
XS S M L XL XXL Total0
10
20
30
40
50
60
70
80
90
100
33.2
53.5
66.8
88.3 89.5
100.0
69.9
10.7 10.6
20.8
33.836.7
41.4
16.3
Aged care charities All charities
Notes: All charities n=49,593 (excludes 1,315 charities which were either group charities or didn’t have charity subtype recorded). Aged care charities = 1405 (excludes 60 aged care charities which were group charities or didn’t have subtype recorded).
DGR statusDeductible gift recipients (DGRs) are organisations that are registered to receive tax deductible gifts.11 DGR status is required for charities to access PBI status. Although the criteria for DGR endorsement does not require a certain size, larger charities were much more likely to have DGR status. This was evident for aged care charities, as it was among all charities.
However, this trend was not just evident among large aged care charities, with higher proportions of aged care charities holding DGR status across all size categories compared to other charities. To illustrate, while 38.4% of all registered charities had DGR status in 2015, up to 72.7% of aged care charities had DGR status.12 This is shown in Figure 2.10.
11 DGR status can help charities to attract donations and enable them to receive distributions from some charitable funds. Not all charities are able to be DGRs. To be eligible, an organisation must have its own ABN, fall within a general DGR category or have a fund that is part of the organisation which falls within a general DGR category, have acceptable rules for transferring surplus gifts and deductible contributions on winding up or DGR endorsement being revoked, maintain a gift fund (if seeking endorsement for the operation of a fund), and generally, be in Australia (ACNC, 2015b). Data about DGR status was obtained from the ABR.12 This is slightly lower than the figure reported in the Australian Charities Report 2014 (40.4%), most likely because of the use of the more comprehensive dataset in 2015.
23
Figure 2.10 Proportion of aged care charities with DGR status by size, 2015 (%)
XS S M L XL XXL Total0
10
20
30
40
50
60
70
80
90
100
42.6
60.1
70.3
87.8 88.3 89.3
72.7
29.7 29.4
48.8
60.6
73.6
85.2
38.4
Aged care charities All charities
24

3. What do Australia’s Aged Care charities do?‘Aged care’ encompasses a range of services and activities performed by charities, and may be the main activity of a charity, or provided alongside other services or activities. While we have identified aged care charities based on their selection of ‘aged care’ as their main activity in the 2015 reporting period, the AIS also asked about the other categories of activity they performed. 13 Charities must choose one main activity, but they can also nominate any other activities that they undertook during the year (general activities). In addition to the 1,465 charities for which aged care was the main activity, there were 3,072 charities which selected aged care as a general (but not main) activity.
Other charities involved in aged careOf the 3,072 charities which performed aged care as a general activity, the largest numbers had main activities which were social services (921 charities, or 30.0% of all who selected aged care as a general but not main activity) or religious activities (793 charities, or 25.8%). This demonstrates that many charities which focused on social services or religion also performed activities that benefited older people, although these were not their main activities in 2015. There were also large numbers of charities performing aged care as a general activity whose main activities were ‘other health service delivery’ (289, or 9.4%) and ‘economic, social and community development’ charities (247 charities, or 8.0%). However, it is currently not possible to measure how a charity allocates its efforts across its main or general activities. To illustrate how aged care charities engage in a broad range of activities, Case Study 2 presents an example of an aged care charity that performs civic and advocacy activities to promote the rights of older people. Figure 3.11 Main activities of charities which selected aged care as a general activity, 2015
Law and legal servicesEnvironmental activities
Higher educationSports
Income support and maintenanceMissing
Animal ProtectionPrimary and secondary education
International activitiesEmployment and training
Other PhilanthropicResearch
OtherMental health and crisis intervention
Civic and advocacy activitiesHousing activities
Other EducationCulture and arts
Emergency ReliefHospital services and rehabilitation
Grant-making activitiesOther recreation and social club
Economic, social and community developmentOther health service delivery
Religious activitiesSocial services
0 100 200 300 400 500 600 700 800 900 1000
39991214141516222226273134
67717374839398
247289
793921
Notes: n=3,072.
13 AIS activity areas are based on the International Classification of Non-profit Organisations (ICNPO). The AIS categories had some minor variations from ICNPO, namely the inclusion of a category for aged care and the exclusion of business and professional associations and unions.
25

Case Study 2: Advocare Incorporated
Located in Western Australia, Advocare is a peak organisation that promotes older people’s rights and raises public awareness of elder abuse. Advocare was one of just 34 aged care charities (equal to about 1% of the sector) that selected ‘civic and advocacy’ as an activity. It provides advocacy and information to help people access aged care services, assists those who have concerns about their aged care provider, and supports those who have suffered elder abuse. In addition, Advocare participates in local events and facilitates educational sessions across the state.
Advocare also works actively with a range of stakeholders – including government agencies and other charities – to coordinate the Alliance for the Prevention of Elder Abuse WA and the Western Australian Network for the Prevention of Elder Abuse. At a national level, the charity is involved with various elder abuse groups and publishes the annual National Elder Abuse Annual Report.
With a total income of $1.5 million, Advocare is considered a large charity. Just over 35% of aged care charities fall within this income bracket, with income between $1 million and $10 million. Like 47% of aged care charities, more than half of Advocare’s 2015 income came from government sources. The charity reported receiving $1.39 million in government funding, of which 70% came from the WA government and 30% from the Federal government.
Employee costs were Advocare’s largest expense, with around $1 million spent on staff. At the time of completing its 2015 Annual Information Statement, Advocare had 12 full-time staff, four part-time staff and three volunteers supporting its work. This mix of volunteers and paid staff is common in the sector. More than 72% of aged care charities depend on the efforts of both paid staff and volunteers, compared to 44.9% among all charities.
The charity’s reliance on government funding means it is keeping a close eye on possible changes to future funding arrangements at both the State and Federal level. These changes could mean reductions in the level of funding available for Advocare. Another challenge for the charity is the introduction of the new aged care reforms. This will affect Advocare’s operating environment and will require the charity to adapt. In response, Advocare has taken a number of positive steps to position itself securely in this ever-changing and complex landscape. The charity has plans to use more innovative methods to deliver services – such as video-conferencing and webinars – as well as the introduction of pop-up offices.
How do Australia’s Aged Care charities pursue their purpose?When charities register with the ACNC they register as one or more of 12 charitable subtypes of charities. These subtypes reflect the charity’s charitable purpose, such as ‘advancing health’ or ‘advancing education’. Among aged care charities, the most common charitable purpose was advancing social or public welfare, reported by 423 aged care charities (29.2%). The next most common charitable purpose was advancing health (218 aged care charities, or (15.0%). This is shown in Figure 3.12.
26

Figure 3.12 Charitable purpose of aged care charities, 2015 (%)
Preventing or relieving suffering of animals
Advancing the natural environment
Promoting or opposing a change to law, government, policy or practice
Advancing Education
Protecting or Promoting Human Rights
Advancing security or safety
Promoting reconciliation, mutual respect and tolerance
Advancing culture
Advancing religion
Other purposes beneficial to the general public
Advancing Health
Advancing social or public welfare
0 50 100 150 200 250 300 350 400 450
1
4
7
9
16
21
24
35
55
146
218
423
Notes: n=1451 (charitable purpose was not available for 14 group charities.
The 2015 AIS gave charities the opportunity to describe how their charity’s activities and outcomes helped achieve their purpose. Figure 3.13 shows that the words ‘caring’, ‘ageing’, ‘providing’, ‘services’ and ‘community’ were the most commonly occurring words in aged care charity’s descriptions of how they achieve their purpose.
27

Figure 3.13 Word frequency: how Australia’s aged care charities pursue their purpose
Many charities described pursuing their purposes by providing residential aged care or supports to older people living at home. Those that described providing residential aged care were mostly large charities with incomes over $1 million, reflecting the level of resources associated with providing accommodation. Examples include:
Provision of quality residential aged care for 56 frail aged persons and 22 self-contained independent living units in a retirement village (large aged care charity based in VIC).
Operating a 50 bed residential care hostel, plus a retirement village (large aged care charity based in SA).
The principal activity of the organisation during the financial year was to provide care to elderly persons who require hostel, nursing home or dementia unit type accommodation, or who wish to reside in the retirement village (large aged care charity in NSW).
Many charities also described pursuing their purposes by supporting older people in their homes. Unlike residential care, charities providing supports to older people at home were of varying sizes. Examples include:
By providing government funded home care services and visiting programs for the aged and socially isolated (large aged care charity based in WA).
We deliver meals to the aged, frail and their carers as well as provide social support activities (small aged care charity in NSW).
We assist the frail aged and younger people with disabilities to remain living in their homes by providing a range of services including: domestic assistance,
28

personal care, respite, social support, home and garden maintenance, transport, meals on wheels, meals at the Centre, social activities at the Centre and outings (large aged care charity based in WA).
Delivering meals to the home of elderly and infirm people and providing emergency relief to needy folk (small aged care charity in QLD).
Provision of services, primarily by staff and volunteers to help enable people to remain in their own homes and to maintain connection with their community (large aged care charity based in WA).
While many charities focused on residential and/or home-based care, many also outlined how they pursued purposes by providing a range of supports in the community. Often, these charities’ descriptions focused on the provision of social activities for older people in the community, aimed at promoting physical and mental health and addressing social isolation. Many social activities for older people appear to be provided by smaller charities, for example:
Conducting a range of regularly scheduled activities each week to enable seniors to learn new skills and to provide a facility where seniors can interact with each other (small aged care charity based in the ACT)
We are a Senior Citizens Club, and we socialise and have healthy activities to keep our members fit and health. (small aged care charity based in SA)
Continued weekly 'Hall Cafe' get together providing friendship and support for seniors and others in the community who find themselves socially isolated. This was started in 2007. We have a weekly attendance of [around] 35 guests supported by up to 10 volunteers (small aged care charity based in WA)
Some charities emphasised targeting their services to particular groups of older people, including Aboriginal people, CALD populations, and gay, lesbian, bisexual, transgender and intersex people. This is reflected in the following descriptions:
We worked on optimising our service delivery to special-interest groups including the financially and socially disadvantaged, the lesbian, gay, bisexual, transgender and intersex community, veterans, and culturally and linguistically diverse groups (large aged care charity based in VIC).
We provide Services to Aboriginal Elderly people. BBQ outings, transport, social support, and home maintenance (small aged care charity based in SA)..
Spoken at several conferences/workshops about lesbian-inclusive Aged Care. To educate aged care providers about discrimination against lesbians in Aged Care…. Held monthly afternoon teas and games days to provide social networking for isolated older lesbians. ….Held a tea dance for our members and friends (small aged care charity based in VIC).
Comprehensive, coordinated and integrated basic support services to the aged and infirmed culturally and linguistically diverse (CALD) communities in the region through direct provision of community care in their own home; Day Centre and “Out and about” activities for the CALD community at risk of social isolation, distress and suffering; Direct in home support and Home Care Packages for frail aged CALD clients, thereby enhancing their quality of life and preventing their inappropriate admission to long term residential care; Information, education, newsletters, and social media updates for CALD Communities to foster and contribute to a socially inclusive community (large aged care charity based in QLD).
Plans to change purposeThere were 95 aged care charities (6.5%) which indicated they were planning to change how they achieve their purpose in the next year. This was on par with the figure for all charities that indicated
29

plans to change (6.3%). Some described changes to their mix of activities, for example introducing a new activity or ceasing to provide a particular service
We are introducing Home Care Packages as a service in the 15/16 year (large aged care charity based in SA).
Introducing free of charge group exercises under supervision of professional people (large aged care charity based in WA).
No longer involved in subsidised accommodation for the ageing (medium aged care charity based in NSW).
Intend to run computer and tablet courses, particularly for older people. Also want to establish a digital photography class (small aged care charity based in NSW).
A few others described how ceasing operations or merging with another organisation would change their mix of services, for example:
Our organisation is currently in the process of merger negotiations with another locally based not-for-profit charity; if this process is successfully completed the organisation will also be providing centre based day care activities and respite services for the aged and persons with ongoing functional disabilities (medium charity based in WA).
We have merged with [another service] and will be providing: Meals on wheels, excursions, social activities, fitness classes, gardening and health support in the community. We will operate an opportunity shop to subsidise the cost of running these programs (large aged care charity in VIC).
We are in the process of integration with [another service] and therefore they will be our parent company and our constitution will also change (medium aged care charity based in NSW).
Who else do Australia’s aged care charities help?The 2015 AIS captures information about charities’ beneficiaries with the question: “Who was helped by your charity’s activities in the 2015 reporting period?” As charities may help multiple populations, they were asked to select all that apply. Whether or not the charity was focused on a main beneficiary group, and the extent to which their activities were aimed at this group, was not identified.14 Around one in five aged care charities (21.7%) selected one or two beneficiaries, while a further 9.2% and 9.1% selected three and four beneficiary groups. A further 10.9% selected five beneficiary groups, while the remaining 49.2% of aged care charities selected six or more sets of beneficiaries.
As would be expected, the most common group selected by aged care charities was elderly people aged 60 and over, selected by 91.7% of aged care charities (see Figure 3.14). Of those aged care charities which did not include elderly people as a beneficiary group, the majority selected broader categories which include older people. Most commonly, this was ‘all ages’ (selected by 61.5% of aged care charities which did not select elderly people as a beneficiary group), women (54.1%), people with disabilities (54.1%), men (53.3%) and veterans or their families (50.0%).
While the most common beneficiary among aged care charity was elderly people (as would be expected), the next most common group was people with disabilities, reflecting how some charities provide residential, home-based and community-based supports to benefit both older people and people with disabilities. Apart from men and women, other prominent groups assisted by aged care charities are people with chronic or terminal illness (51.8%), veterans and their families (46.6%) and people from ethnic backgrounds (37.9%). This differed to the whole charity sector, for which the dominant beneficiary groups were general community, women, children under 13, men, all ages, and youth aged 13 to under 25. An example of an aged care charity that specifically supports LGBTI beneficiaries is provided below (Case Study 3).
14 From the 2016 Annual Information Statement onwards, the beneficiary question will collect more specific information from charities about their beneficiaries.
30

Figure 3.14 Beneficiaries of aged care charities and all charities, 2015
Victims of crime
Pre or Post Release Offenders and Families
Other beneficiaries not listed
Children under 13
Migrants Refugees or Asylum Seekers
All Ages
People at risk of homelessness
Aboriginal and/or Torres Strait Islander people
People from ethnic backgrounds
People with chronic or terminal Illness
Women
Elderly people aged 60 and over
0 10 20 30 40 50 60 70 80 90 1001.92.3
2.43.94.0
10.410.912.4
15.216.917.217.7
22.927.629.2
32.337.9
46.651.8
60.361.0
66.391.7
5.313.9
5.59.59.3
38.938.9
35.114.4
18.336.3
7.715.9
26.920.7
50.920.0
10.317.6
38.741.1
29.728.0
All charities Aged care charities
Notes: n=1465 (aged care charities) and 50,908 (all charities)
31
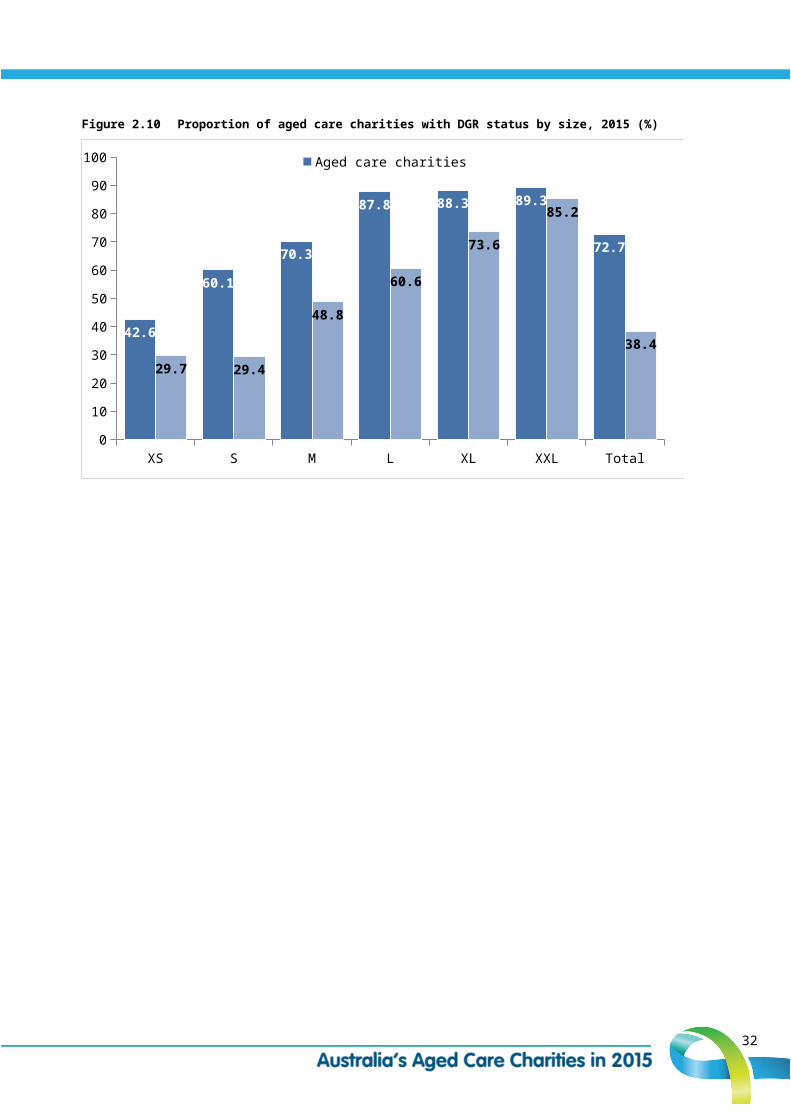
Case Study 3: Matrix Guild Victoria Inc. (Matrix)
Matrix is a small Victorian charity founded 25 years ago by a group of lesbian feminists. The charity believes that setting up an aged care facility that specifically caters for the needs of older lesbians offers the best possible environment for those who need a home at their end of life, and the aim for Matrix’s founders is establishing what they describe as an “Old Dykes Home”. This aims to address fears held by older lesbians that they will experience discrimination in accessing aged care services. Since its establishment, Matrix has contributed to positive changes within existing aged care services, so that the unique needs of older lesbians are better understood and addressed.
At a broader level, Matrix also supports more inclusive measures for all LGBTI people accessing aged care services. Matrix is among the 17.7% of aged care charities which nominated LGBTI people as one of their key beneficiaries in 2015. By comparison, just 7.7% of all charities reported LGBTI people as a beneficiary in that same year.
The charity has been actively raising awareness of ageism, sexism and lesbophobia, addressing these issues through the provision of educational materials available to only older lesbians, aged care providers and the general public. To support its advocacy work, Matrix has been involved in research focussed on the experiences of older lesbians in aged care services. This work aims to influence change by ensuring the needs of its beneficiaries are better understood and documented.
It also offers direct services for older lesbians, including affordable accommodation for disadvantaged older lesbians, and social events targeting social isolation. In 2015 it established a new volunteer visitor program focussed on helping highly isolated older lesbians who live either in the community or in residential Aged Care. Matrix doesn’t employ staff and is completely reliant on the work of around 20 volunteers. This puts it in the minority in the aged care sector, as only 22.8% of aged care charities reported having no paid staff.
Matrix’s largest source of income in 2015 came from two fundraising events – its Comedy Gala and its Satin and Silk Ball. These events were a major contribution towards Matrix’s total reported income of $28,410 in 2015. No income came from government sources. While more than 65% of aged care charities received some income from government, more than 73.5% of extra small charities like Matrix report receiving zero income from government.
Nevertheless, Matrix hopes there will be greater future opportunities to access government funding as awareness and demand grows for the type of services it offers. The charity is also keen to attract more bequests, as one it received previously significantly transformed its work by providing the resources for it to establish a housing project.
32
4. Who works in Australia’s Aged Care charities?Australia’s aged care charities are significant as employers of paid staff, and also engage high numbers of volunteers.
Paid employees in Australia’s aged care charitiesThe AIS asked charities to indicate the number of paid full time, part time, and casual employees who worked for their charity during the last pay period of the 2015 reporting period. Charities were asked to provide their best estimate, if exact figures were unavailable. The AIS did not ask charities whether their casual staff worked on a full or part time basis. Further, as the data is for one pay period only, it does not capture fluctuations in staffing levels over the reporting period. As such, it should be considered a snapshot of the charity’s employment for that pay period.
Aged care charities employed 171,863 paid staff. This is approximately 14.1% of the 1.2 million employees engaged in the charity sector as a whole. To put this in perspective, aged care charities constitute just 2.9% of all charities, yet they are a significant source of employment. Compared to the rate of employment in other charity sectors, the aged care sector was ranked third behind primary and secondary education, and, higher education.
The majority of staff in aged care charities were engaged on a part time or casual basis. Of paid staff in aged care charities, 60.7% were part time and 22.9% were casual. Only a minority (16.4%) were employed on a full time basis. This is shown in Figure 4.15.
By contrast, other charities (i.e. those other than aged care charities) had higher proportions of full time staff than aged care charities (41.6%), and lower proportions of part time staff (31.1%). However, the proportion of casual staff was similar: 26.3% in other charities compared with 22.9% in aged care charities. An example of an aged care charity with relatively high proportions of casual staff is below, in Case Study 4.Figure 4.15 Full time, part time and casual staff, aged care charities, 2015
Staff Mean (median) Sum % of totalFull time staff 19.3 (2) 28,221 16.4Part time staff 71.3 (6) 104,279 60.7Casual staff 27.0 (2) 39,363 22.9Total 117.5 (15) 171,863 100.0
On average, aged care charities had 117.5 paid employees. However, this average is influenced by the large numbers of staff employed by a small number of charities: half of aged care charities had less than 15 staff. As would be expected, the average number of paid staff increased substantially with the size of the charity. Figure 4.16 shows that while the 28 largest aged care charities (XXL, incomes over $100 million) constituted only 1.9% of all aged care charities, they employed 39.2% of all staff employed by aged care charities. At the other extreme, the smallest charities (with incomes under $50,000) constituted 17.5% of all aged care charities, but only 0.2% of employment. An example of a large aged care charity with a substantial workforce is presented in Case Study 4.
33

Figure 4.16 Proportion of aged care charities and proportion of employees in aged care charities by size, 2015 (%)
XS S M L XL XXL0
5
10
15
20
25
30
35
40
45
17.516.1 15.9
35.2
13.4
1.9
0.2 0.9 1.2
18.9
39.7 39.2
Proportion of aged care charities Proportion of employees in aged care charities
n=1463 charities and 171,863 staff.
Aged care charities with no paid staffAmong all charities, almost half (47.5%) had no paid staff in 2015. However, this figure is much lower for aged care charities, with 22.8% operating with no paid staff. The majority of these aged care charities with no paid staff were small. In fact, 63.2% were extra small with an income of less than $50,000 and another 25.8% with an income between $50,000 and $250,000.
Case Study 4: Mecwacare Incorporated
Located in Victoria, mecwacare has been supporting the aged and those with disabilities for more than 58 years. The charity has grown organically over the decades, with its central purpose to support and improve the community by providing optimal care.
With the needs of its beneficiaries at the centre of all its work, mecwacare has consistently invested back into care and service provisions. As a result of this approach, the charity believes it is able to provide ‘a viable, community-focused aged care option in an increasingly competitive and corporatised sector’.
Each week, mecwacare cares for more than 13,000 people across greater Melbourne and regional Victoria. The charity offers a range of services, such as residential aged care, home care packages, respite care, in-home support, community programs and also nursing services. Its integrated service network helps mecwacare provide a continuous community-based care experience that caters for people’s changing needs.
The charity has also responded to the changing demographics of its beneficiaries; mecwacare staff are culturally and linguistically diverse, representing 89 nationalities and speaking 98 different languages. Targeting culturally and linguistically diverse people is more common among aged care charities than the overall charity sector. The 2015 AIS found that 37.9% of aged care charities, cited ‘people from ethnic backgrounds’ as a main beneficiary, compared to just 20% for all charities.
Around 1,500 paid staff and 350 volunteers made up mecwacare’s workforce in 2015. The organisation employed nearly 60% of its staff on a casual basis, while almost 33% were part-time staff. By comparison, the 2015 Annual Information statement found 60.7% of all aged care employees were employed on a part-time basis, while 22.9% were casual.
34

mecwacare received more than $56.5 million in income during 2015. Close to $33 million of this came from Federal government funding. The next largest source of income was consumer contributions, followed by donations and bequests. The charity reports that its income continues to grow in line with their overall growth across its services.
The charity’s expenditure pattern is fairly similar to that reported by all aged care charities. In 2015, 71.2% of mecwacare’s income went towards employee expenses, with 28.7% going towards other expenses. For all aged care charities, the proportions spent on these two areas were 66.3% and 33.4%, respectively.
With changes to the national aged care system, mecwacare has recognised the need to alter the way it operates. Funding will be allocated differently under the aged care reforms, bringing with it changes to how mecwacare manages its staff and services. This challenge is also an opportunity for mecwacare, which has implemented a new five-year strategic development plan to guide its expansion across Victoria. The charity reached an important milestone in this process in late 2015 when it acquired two new facilities – a move which allowed it to expand its residential care services.
Volunteers in Australia’s Aged Care CharitiesAs described in Australian Charities 2015, most charities draw on the efforts of unpaid volunteers to perform their activities. The AIS asked charities to report the estimated number of volunteers who worked for the charity during the 2015 reporting period. Together, aged care charities reported 131,641 volunteers. This is around 4.4% of all volunteers reported by Australia’s charities. The vast majority (93.2%) of aged care charities had volunteers (Figure 4.17).
The proportion of aged care charities that engaged any volunteers is shown in Figure 4.17, by size. The average number of volunteers per aged care charity ranged from 22.4 in XS aged care charities to 574 in XXL aged care charities. In each size category, more than 9 in 10 aged care charities engaged volunteers. However, large charities (income between $1 million to $10 million) had the greatest volume of volunteer engagement compared to all other size categories (42,296 or 32.1%).Figure 4.17 Proportion of aged care charities with volunteers by size, 2015 (%)
% with any volunteers
Mean number of volunteers
Median Sum % of total
XS (<$50k) 92.9 22.4 12 5,706 4.3S ($50k-$250k) 91.9 121.1 28 28,457 21.6
M ($250k-$1m) 91.4 69.6 30 16,140 12.3
L ($1m-$10m) 93.2 82.1 21 42,296 32.1
XL ($10m-$100m) 96.4 117.8 68 22,969 17.4XXL (>$100m) 96.4 574.0 480 16,073 12.2Total 93.2 90.2 25 131,641 100.0
Notes: n=1,460 charities, as number of volunteers were missing for 5 aged care charities.
Aged care charities with both volunteers and employeesFigure 4.18 shows that 72.5% of aged care charities had both employees and volunteers. This was much higher than the figure for all charities (44.9%). Aged care charities were also less likely to operate solely with volunteers: 20.7% did so compared with 39.1% of all charities. Further, aged care charities were less likely to operate with employees only (4.8% compared with 7.5%), reflecting the tendency in aged care to pursue their purpose using a combination of both paid workers and volunteers.
35

Figure 4.18 Aged care charities and all charities with paid employees and volunteers 2015 (%)
Had neit
her em
...
Employe
...
Voluntee...
Employe
es a.
..0
10
20
30
40
50
60
70
80
90
100
2.14.8
20.7
72.5
8.4 7.5
39.144.9
Aged care charities All charities
Notes: n= 46,813 (all charities) and 1460 (aged care charities).
Figure 4.19 shows that the proportion the proportion of charities with both employees and volunteers was very high among all but extra small aged care charities. Indeed, among aged care charities with over $1 million in income, more than nine in ten charities engaged both employees and volunteers. Figure 4.19 Proportion of aged care charities with employees and volunteers, 2015 (%)
XS S M L XL XXL Total0
10
20
30
40
50
60
70
80
90
100
15.3
60.0
82.8
91.895.4 96.4
72.5
Notes: n=1460 (aged care charities).
36

5. How do Aged Care charities fund their activities?While governments fund and regulate the formal aged care systems, they subsidise only a portion of care costs. Private funding also makes a significant contribution to residential and home care providers, with clients and residents contributing through fees and payments, and donations also providing an alternative source income (PC, 2017). This section analyses the incomes of charities whose main activities were aged care, including those that provide residential and home care services, but also other charities that cater to the needs of older people.
Most information comes from the income statement in the 2015 AIS. This required most charities to answer questions about financial information, including the source of their income for the 2015 reporting period. Income for basic religious charities and others for which financial information was unavailable is estimated (see further methodological details in Australian Charities Report 2015). The composition of charities’ income illuminates how these charities fund their activities. Income in the AIS was captured in three main categories: Government grants15; donations and bequests; and other income and revenue.
Total incomeTogether, Australia’s charities had $134.5 billion in income in 2015.16 While aged care charities constituted only 2.9% of all charities, they account for a relatively high share of the charity sector’s income: $12.5 billion (9.3%).
Among aged care charities, average income was $4.3 million, although this was heavily influenced by some very large aged care charities with half of aged care charities reporting incomes under $391,328. Indeed, aged care charities’ income was highly concentrated, although to a lesser extent than across all charities. The top 1% of aged care charities (13 charities) reported 25.6% of all aged care charities’ income, while the top 10% (139 charities) reported 73.3% of aged care charities’ income. A further breakdown is shown in Figure 5.21. By contrast, income across the whole charities sector was more concentrated. For example the top 1% of charities had 58.0% of income, and the top 10% had 89.5%.Figure 5.20 Summary of income sources, aged care charities and all charities 2015
Income source Aged care charities ($)
% of total income (aged care
charities)All charities ($) % of total income
(all charities)
Government grants 5,999,371,501 48.0 55,664,078,556 41.4Donations and bequests 168,927,545 1.4 11,169,158,530 8.3Other income and revenue 6,334,891,913 50.7 67,682,720,868 50.3
Total 12,503,063,588 100.0 134,514,292,173 100.0
Notes: n=50,908 (all charities) and 1,465 (aged care charities). Totals include estimated data for charities which had not provided financial reports.
15 Government grants include all financial assistance provided by the government to the charity for a purpose, such as for the charity to provide goods or services to others. The category does not distinguish between level of government or between particular government programs. 16 This figure is higher than the figure reported in the Australian Charities Report 2014, because of the use of a more complete data set in 2015. This does not reflect change. For estimates of growth in total income see Section Error: Reference source not found.
37

Figure 5.21 Concentration of income, aged care charities and all charities 2015
Income source n % income Mean income ($) Total income ($)
Top 1% of aged care charities 13 25.6 242,749,653 3,155,745,489Top 10% of aged care charities 139 73.3 65,014,112 9,036,961,528Top 20% of aged care charities 279 85.6 37,829,826 10,554,521,324Top 50% of aged care charities 679 98.5 17,423,094 12,143,896,351
Notes: n=38,117 (all charities) and 1,394 (aged care charities) (reporting charities only).
Sources of incomeAustralia’s aged care charities draw on a slightly different mix of income sources, compared with the wider sector (see Figure 5.20). The most obvious difference is that aged care charities have relatively high levels of income from government, and receive relatively low income from philanthropic sources. While a high proportion of charities received some income from donations and bequests, the amounts received by aged care charities were relatively small: donations and bequests comprised 1.4% of total income for the sector compared with 8.3% of all charity income.
Instead, aged care charities received a higher proportion of total income from government funding. 48.0% of income from aged care charities came from government funding compared to 41.4% in the whole charities sector.
Figure 5.22 reports the proportion of charities that received any income from each source, and the mean income per charity from each source. For both aged care charities and the whole charity sector, the most common source of income was ‘other income and revenue’ (received by 97.9% of aged care and 91.2% of all charities). Higher proportions of aged care charities received government grants (65.2% compared with 35.1% of all charities), with aged care charities receiving higher amounts: $4.1 million on average compared with $1.1 million across the whole sector.
While donations and bequests were received by a relatively high proportion of aged care charities (72.7% compared with 62.8% of all charities), the amounts were relatively small. The average amount received by these aged care charities was $115,309. In contrast, this amount is almost doubled in the whole charities sector ($219,399), despite a smaller proportion receiving this income source (Figure 5.22).
It is also notable that almost all aged care charities received ‘other income’, much of which is from user or client fees. Other income and revenue was also relatively high, with an average of $4.3 million per charity compared with $1.3 million among all charities. Figure 5.22 Key indicators of income sources, aged care charities, 2015
Income source% of aged care charities which
received income^
Aged care charities - mean per charity ($)*
% of all charities which received
income ^
All charities - mean per charity
($)*Government grants 65.2 4,095,134 35.1 1,093,425Donations and bequests 72.7 115,309 62.8 219,399Other income and revenue 97.9 4,324,158 91.2 1,329,641
Total 99.5 8,534,514 98.1 2,642,302Notes: ^Uses reported data: all charities n=38,117, aged care charities n=1,394 (reported data only) *Uses estimated data n=50,908, aged care charities =1,465
38

Funding from Government sourcesAged care charities could receive income from a range of state, federal and local programs, as well as Commonwealth programs to support older people access residential care and assistance for independent living. Together, Australia’s charities reported around $55.7 billion in income from government sources in the 2015 reporting period. This income from government accounted for 41.4% of sector’s total income. For aged care charities specifically, the reported income from government sources was $6.0 billion. This means that while aged care charities constituted only 2.9% of all charities, they received around 10.8% of the charity sector’s income from government. Although the proportion of aged care charities delivering Commonwealth programs is not clear from the AIS data, the importance of income from government to aged care charities likely reflects the significant role that aged care charities play in delivering Commonwealth aged care programs.
As an indicator of reliance on government grants, three categories were constructed, capturing those with no government grants, those for which grants made a relatively minor contribution to total income (less than 50%), and those for which grants constituted a major contribution to total income (more than 50%).
Among all charities, 19.1% of charities received more than half of their income from government. This was much higher for aged care charities: almost half (47.1%) received more than half of their income from government. Only law and legal services had higher dependence on government (68.4% received more than half their income from government).
Correspondingly, across the charity sector, the majority (64.9%) received no income from government (Cortis et al, 2016: 54). Reflecting the active role of government agencies as funders of aged care (Productivity Commission, 2017; ACFA, 2016a), this figure was much lower among aged care charities: only 34.8% received no income from government grants. This decreased with size, smaller aged care charities were the most likely to report no government grants in 2015 (see Figure 5.23). For example, 73.6% of extra small aged care charities received no government grants and only 12.1% received more than half of their income from government. By contrast, among the 28 XXL aged care charities (with incomes over $100 million) only 17.9% received no income from government and 64.3% received more than half of their income from government (see Figure 5.23).
When looking at those aged care charities that reported no income from government grants, as well as being smaller, these charities were often involved in a narrower range of activities. There were also slightly higher proportions performing housing activities, religious activities and international activities. In addition, they are generally concentrated in a single state or territory (93.2%), and slightly fewer were based in major cities (50.8% compared with 54.2% of all aged care charities).
39

Figure 5.23 Aged care charities for which government grants comprised more than 50% of total income, 2015 (%)
XS S M L XL XXL Total0%
10%
20%
30%
40%
50%
60%
70%
80%
90%
100%
73.6
40.9
21.5 26.1 21.5 17.9
34.8
14.3
30.9
19.2 13.1 19.917.9
18.1
12.128.2
59.4 60.8 58.6 64.3
47.1
No income from government grantsGovernment grants constitute less than 50% of incomeGovernment grants constitute more than 50% of income
Notes: n=1,394, based on charities with reported income data only.
Donations and bequestsAged care charities receive a relatively small proportion of income from donations and bequests, perhaps reflecting the presence of a significant stream of funding from government. Among all charities, 62.8% received some amount of income from donations and bequests, amounting to $11.2 billion, or 8.3% of charities’ total income. Among aged care charities, however, donations amounted to just $168.9 million, or 1.4% of aged care charities’ total income.
Among all charities, around 1 in 4 (26.0%) depended on donations and bequests for 50% or more of their total income (see Cortis et al, 2016: 57). In contrast this was much smaller for aged care charities: only 5.0% of aged care charities depended on donations and bequests for more than half of their income (see Figure 5.24).
The proportion of aged care charities for which donations and bequests accounted for less than 50% of total income increased with the size of the aged care charity. Correspondingly, the proportion which received more than half of total income from donations decreased with the size of aged care charities (Figure 5.24). While this may reflect barriers to accessing donations across aged care, more likely it reflects that aged care charities have lesser need for income from donations due to high levels of income from government funds and other income sources such as client fees.
For the aged care charities that received more than half of their income from donations and bequests, around half were extra small (54%) and half had been established for over 20 years (52%). In addition, higher proportions of donor-dependent charities were concentrated in major cities (66.8% compared with 54.2% of all aged care charities).
40

Figure 5.24 Aged care charities for which donations and bequests comprised more than 50% of total income, 2015 (%)
XS S M L XL XXL Total0%
10%
20%
30%
40%
50%
60%
70%
80%
90%
100%
41.633.2 34.7
21.813.1
27.3
42.4 58.6 61.677.2
86.4100.0
67.8
16.08.2 3.7 1.0 0.5 5.0
No income from donations Donations contributed under 50% of total incomeDonations contributed more than 50% of total income
Notes: n=1,394, based on reported data only.
Other income and revenueApart from government grants and donations, charities’ income was captured in three other AIS line items called: ‘other income/receipts’, ‘other revenue’ and ‘other income’. We refer to these together as ‘other income’. Charities were directed to include all other income and revenue at this item that was not from government grants, donations and bequests. Items within these AIS line items could include a variety of income sources such as those from ordinary activities including sale of goods, user contributions to services rendered, member fees, interest, dividends, as well as income earned outside of ordinary activities such as gains received from the sale of assets. As such, this can be considered an indication of charities’ market or commercial income. Future development of the AIS should provide more detailed breakdown of ‘other income’, given that this is the most commonly reported source of income and comprises a significant portion of the sector’s total income.
Compared with all charities, aged care charities were more likely to receive ‘other income’ (97.9% compared to 91.2% for all charities. The average amount received was also considerably higher, with aged care charities receiving an average of $4.3 million compared to the average of $1.3 million in the whole charities sector.
Other income contributed less than 50% of income for more than half of aged care charities (54.1%). However, 45.9% of aged care charities reported high reliance on ‘other income’ (Figure 5.25). This demonstrates that aged care charities utilize a diverse range of income sources to fund their activities.
The proportion of aged care charities that did not receive other income tended to be small. For charities in all other size categories, there was not much difference in the proportions reliant on other income, with around close to a third in each of these categories reporting a high reliance (Figure 5.25).
41

Figure 5.25 Proportion of total income from ‘other income’ by size of aged care charity, 2015 (%)
XS S M L XL XXL Total0%
10%
20%
30%
40%
50%
60%
70%
80%
90%
100%
8.7 3.6 0.2 2.1
24.2 35.0
65.8 62.0 61.3 64.352.0
67.1 61.4
34.3 37.8 38.7 35.745.9
No other income or revenueOther income or revenue contributed to less than 50% of incomeOther income or revenue contributed to more than 50% of revenue
Notes: n=1,394, based on reported data only.
42

6. How do Australian aged care charities allocate their funds?
As part of the AIS, charities were required to specify how they allocate their funds. This is captured as part of the income statement, under expenses/payments. Categories were:
Employee expenses/payments Grants and donations made by the registered entity for use in Australia Grants and donations made by the registered entity for use outside Australia Other expenses / payments.
These were then added to indicate total expenses.
In the following section, the analysis will compare expenses with total income to indicate net surplus / deficit.
Total expensesIn total, Australia’s aged care charities spent around $11.7 billion pursuing their purposes over the 2015 reporting period (see Figure 6.26). While aged care charities accounted for 2.9% of all charities, they accounted for 9.5% of the charity sector’s total spending. The main type of spending among aged care charities was employee expenses, which accounted for around two thirds of spending (66.3%). Very little was spent on grants and donations, and around a third was spent on other expenses (33.4%).
Spending behaviour differed across the size categories (Figure 6.27). The vast majority of spending, in terms of volume, was by charities in the XL and XXL categories (with incomes of more than $10 million). These aged care charities accounted for 80.9% of all aged care charities’ expenditure. Figure 6.26 Summary of expenditure, 2015 ($)
Expenditure Total expenses ($) Mean % of aged care charities’ spending
Employee expenses 7,760,768,456 $5,297,453 66.3Grants and donations 37,011,914 25,264 0.3Other expenses 3,911,151,058 2,669,728 33.4Total aged care charities 11,708,664,627 7,992,263 100.0Total all charities 122,768,180,845 2,411,570 -
Notes: n=1,465. Due to discrepancies in charities’ reporting of each expense source and totals, figures for employee expenses, grants and other expenses may not sum to the total.
Figure 6.27 Mean total expenditure by size, 2015 ($)
Charity size Total expenses ($) Mean ($) % of aged care charities’ spending
XS 8,051,358 31,451 0.1S 33,618,243 141,253 0.3M 129,369,279 557,626 1.1L 2,066,897,295 4,013,393 17.7XL 4,774,993,266 24,362,211 40.8XXL 4,695,735,186 167,704,828 40.1Total 11,708,664,627 7,992,263 100.0
Notes: n=1,465.
43

Spending on employeesAged care organisations would be expected to have high employee expenses relative to other charities, as their activities tend to involve employing paid staff to deliver direct care services to older people. Most aged care charities reported employment related expenses (77.5%), which is much higher than across all charities (only 38.8% reported employee expenses), demonstrating the importance of paid employees to aged care charities. Figure 6.28 shows that as charities income increased, the proportion which spent more than half their income on employees increased, from 6.1% among XS charities to 100% in XXL charities.
Figure 6.28 Aged care charities for which employee expenses were zero, 2015 (%)
XS S M L XL XXL Total0%
10%
20%
30%
40%
50%
60%
70%
80%
90%
100%
87.0
34.1
11.42.4 1.1
22.5
7.0
37.3
34.7
14.55.2
18.5
6.1
28.6
53.9
83.293.7 100.0
59.0
No Spending on employeesSpending on employees contributed to less than 50% of total spendingSpending on employees contributed to more than 50% of total spending
Notes: n=1,393 (reporting charities only).
Spending on grants and donations The AIS also asked about spending on grants and donations made by the charity for use within Australia, and for use outside Australia. Spending on grants by aged care charities was relatively small, amounting to a total of $37.0 million. This consisted of $33.6 million for use in Australia, and $3.5 million for use outside Australia (Figure 6.29). Case Study 5 (below) presents an example large aged care charity spends their income on their charitable purpose, including through issuing grants.Figure 6.29 Expenditure on grants, 2015 ($)
Expenditure on grants Total expenses ($) Mean ($)For use in Australia 33,556,496 22,905
For use outside Australia 3,455,418 2,359Total 37,011,914 25,264
Notes: n=1,465.
44

Case Study 5: Resthaven Incorporated (Resthaven)
Established in 1935, Resthaven has supported older people and sustained their quality of life for more than 80 years. As only one in five aged care charities have been established for 50 years or more, Resthaven is one of the older charities in the sector.
Resthaven is a major employer within the South Australian aged care sector, with approximately 2,000 staff, nearly 500 volunteers and relationships with thousands of residents, clients and carers. It delivers the range of Commonwealth-funded aged care services, such as residential aged care homes, home care packages, Veterans’ Home Care and Home Nursing, respite for carers and independent retirement living options.
A substantial income supports Resthaven’s activities and workforce. In 2015 its reported total income was $115.8 million, making it one of just 28 aged care charities with reported income in excess of $100 million. Nearly all of Resthaven’s income came from Commonwealth government funding. However, the level of user contributions it receives is growing.
Unsurprisingly, 75% of the charity’s 2015 income was devoted to employee expenses. Expenditure on employees is fairly common within the aged care sector – 77.5% of aged care charities reported staff-related expenses, compared to 38.8% across all charities. Resthaven also devotes income to supporting workforce development in the aged care sector. The charity has provided students with on-site placements, and also sets aside grant funding for student scholarships. These include two perpetual scholarships established specifically for Indigenous students at two universities.
Resthaven’s involvement in grantmaking is rare for aged care charities – so rare that Resthaven is the only one of 93 aged care charities in Australia that reported grantmaking as an activity. The amount it devotes to grantmaking is significant too – Resthaven spent around $370,000 in 2015 on grants, compared to the average of $22,905 for all aged care charities.
Resthaven is keenly aware of the important role charitable aged care providers have in offering critical support to some of the most vulnerable Australians at their time of need. Ensuring good stewardship of resources and being socially responsible in its activities means the vulnerable people it supports are protected.
In addition, the charity has been actively involved in advocating on aged care issues, as well as in supporting research to build awareness and understanding. Since 2013, Resthaven has participated in important discussions on reforms to Australia’s aged care sector. The charity hopes this work builds a greater appreciation of the important contributions older people make to their community and that their place in society should be continuously respected throughout the ageing process.
45

7. A closer look at the finances of Australia’s aged care charities
As demand for aged care grows and the aged care industry transitions to new funding arrangements associated with consumer-based care, the financial status of service provider organisations provides important insight into viability and sustainability issues. As a significant area of government expenditure, aged care financing is routinely monitored, including through the annual reports of the ACFA (2016a) and the Productivity Commission’s Review on Government Services. This report builds on the detailed information contained in those reports by contributing information focused on charities providing aged care services. In particular, it contributes information about aged care charities’ financial status, which can be used to assess how the sector is positioned to sustain their activities and advance its purpose.
There is no simple, universally applicable way of assessing the financial sustainability of organisations (whether they are charities or for-profit businesses), and many factors impact on the financial health of aged care and other charities. The material in this report should be considered a general snapshot of the financial status of Australia’s aged care charities, which should be considered alongside more detailed assessments of aged care providers’ financial arrangements.
Income and expenditureInformation about charities’ income and expenditure, and their assets and liabilities provides insight into their financial status and performance.
Net Income Ratio by Size
A charity’s Net Income Ratio17 summarises the ratio of the charity’s surplus or deficit to its total income in the financial year. Aged care charities’ net income ratio was 6.4% (indicating an average surplus equivalent to 6.4% of total income). By contrast, across the whole charity sector charities had an average surplus equivalent to 8.7% of total income. Rather than poor performance, this may indicate a range of circumstances, including the importance of government funding in aged care charities’ income mix, and should be interpreted in the context of a charity’s financial strategy, assets, and growth.
Net Income Ratio varied by charities’ size, as shown in Figure 7.30. The 208 extra small aged care charities had a high deficit relative to total income, indicated by the net income ratio of -66.3. However, as shown in (refer to extra small charities report), the incomes and expenditure of the smallest charities tend to fluctuate. Negative net income ratio of small aged care charities is of little concern in the context of these fluctuations, as they are caused by relatively small amounts of money, and may reflect the use of cash rather than accrual accounting. The deficit may also reflect set up costs of new charities. Given these range of factors, caution should be exercised when interpreting this finding. The financial performance of extra small aged care charities is nonetheless worth monitoring over time, to assess the growth and lifecycle dynamics of these charities.
While small and medium aged care charities had smaller deficits relative to income, of note is the solid financial status of the largest charities. Charities with over $1 million had net income ratios of between 5.2% and 8.1% (see Figure 7.30), perhaps reflecting fluctuations in the incomes of smaller charities, or deficits as they attempt to grow.
17 In the ACNC’s Annual Information Statement form financial data may have different labels; for example, “Net Income” is Net Surplus/Deficit; “Total Income” is Total Gross Income for Medium and Large charities and Total Income/Receipts for Small charities.
46
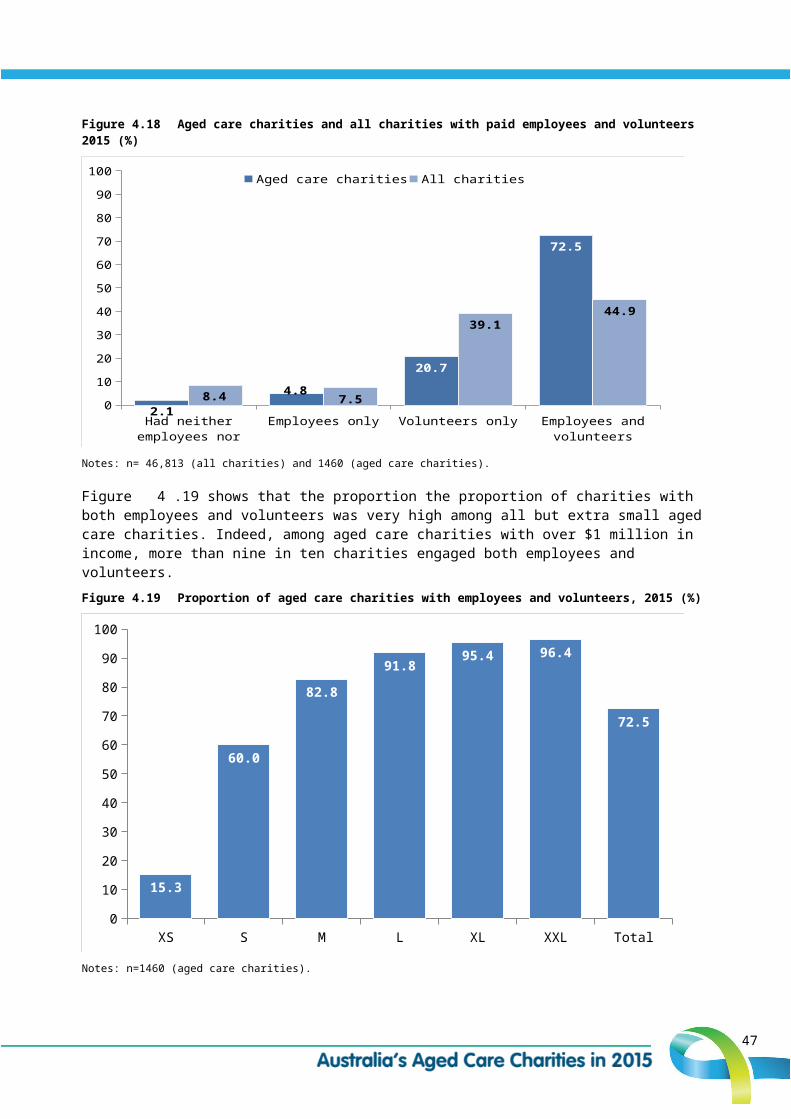
Figure 7.30 Average Net Income Ratio by Size, Aged Care Charities, 2015 (%)18
Total
XS
S
M
L
XL
XXL
-80 -70 -60 -50 -40 -30 -20 -10 0 10 20
6.4
-6.7
-3.2
5.8
8.1
5.2
Notes: n=1,465.
Assets While analysis of net income tells us something about financial performance, the information provided by charities as part of the balance sheet component of the AIS provides a clearer picture of charities’ financial position. In this section we analyse indicative ratios of aged care charities’ long term financial position (net asset ratio). It is not possible to look at the short term financial position of the sector, as small charities are not required to provide detailed balance sheet information in the AIS.
Net assets and net asset ratioThe AIS information on assets and liabilities provides insight into the financial position of Australia’s charities. Australia’s aged care charities had assets of $37.0 billion, which constituted 13.8% of all charities’ total assets.
Aged care charities reported net assets (total assets minus total liabilities) of $16.0 billion at the end of the 2015 reporting period (Figure 7.31). Overall, the Net Asset Ratio19 of aged care charities was 43.2% (indicating that net assets were 43.2% of total assets). This compares to 69.7% for all charities. As such, aged care charities have higher liabilities relative to assets than other charities, most likely reflecting the characteristics of their activities, such as their use of physical facilities for residential care provision.
Figure 7.31 Summary of assets and liabilities, aged care charities 2015 ($)
$Total Assets 36,975,559,728 Total Liabilities 20,987,743,730 Net Assets 15,988,132,716 Net Asset Ratio 43.2 %
Notes: n=1,465.
Figure 7.32 provides a breakdown of the proportion of aged care charities with liabilities which were less than half or more than half of the value of their assets, and the very small proportion which had liabilities exceeding the value of their assets. As the size of aged care charities increases, there were
18 Calculated as the total of net income for charities in a group, divided by total income for charities in that group.19 The net asset ratio is calculated as net assets as a percentage of total assets.
47

also increases in the proportion of charities with liabilities between 50% and 100% of the value of their assets. This may reflect debt financing among larger charities. Figure 7.32 Net Asset Ratio by Size, 2015
XS S M L XL XXL Total0%
10%
20%
30%
40%
50%
60%
70%
80%
90%
100%
90.4 87.580.4
60.7
43.228.6
69.5
7.2 10.216.0
37.5
54.771.4
28.2
2.4 2.3 3.7 1.8 2.1 2.3
Liabilities less than 50% of the value of assets Liabilities between 50% and 100% of the value of assetsLiabilities more than the value of assets
Notes: n=1,365
Expense ratiosTo examine sustainability, we use a measure that assesses the value of assets relative to annual expenses to determine, theoretically, how many years of expenses (at the 2015 level) the net assets would cover for the charity. This provides a hypothetical measure of how long net assets could cover expenses and enable the charity to continue to function, should income dry up (and assuming assets are unfixed).
Overall, a large proportion of aged care charities would only be able to cover their expenses for less than one year using net assets, with 4.2% reporting no net assets and 40.3% having assets amounting to less than one year’s worth of expenses. A further 34.2% could cover expenses for one to three years, and almost a quarter of aged care charities (21.3%) could cover expenses for over three years. There was some variation by size, shown Figure 7.33. Among smaller aged care charities, relatively high proportions could cover expenses for over three years. This was the case for 45.8% of extra small aged care charities, and 32.9% of small aged care charities, compared with 21.3% of all aged care charities.
48

Figure 7.33 Years assets could cover expenses, by size of aged care charities, 2015
XS S M L XL XXL Total0%
10%
20%
30%
40%
50%
60%
70%
80%
90%
100%
12.04.1 3.7 2.0 2.6 4.2
20.4 34.3
53.446.3
37.7 46.4 40.3
21.8
28.8
24.2 39.648.7
53.6
34.2
45.832.9
18.712.1 11.0
21.3
Zero or no net assets Less than one year One to three years Over three years
Notes: n=1,378
Figure 7.34 shows the number of years charities could cover their expenses with their net assets, according to the charities’ age. In general, higher proportions of Australia’s oldest charities could cover over three years of expenditure. This was the case for 26.8% of charities aged between 50 and 100, and 30% of charities aged over 100 years. However, significant proportions of these older charities had less than one year’s expenditure, and many had no net assets (see Figure 7.34).
49

Figure 7.34 Years assets could cover expenses, by years since aged care charities were established, 2015
Less than 1 year
1 to less than 5 years
5 to less than 10
years
10 to less than 20
years
20 to less than 50
years
50 to less than 100
years
100 years or more
Total0%
10%
20%
30%
40%
50%
60%
70%
80%
90%
100%
50.0
14.36.9 7.9 2.9 4.1 6.7 4.3
50.0
17.9 20.6 26.318.9
26.8 30.021.6
53.6
35.641.5
43.629.2
40.0 40.3
14.3
37.0 24.3 34.7
39.923.3 33.8
Zero or no net assets Less than one year One to three years Over three years
Notes: n=1,301 (age of establishment data was missing for 77 charities)
50

8. How are Australia’s Aged Care charities changing?This section examines how Australia’s aged care charities changed from 2014 to 2015. It uses a specially constructed matched panel dataset. This matched panel dataset was initially analysed for all charities (see Australian Charity Report 2015) and consisted of 29,829 charities which reported financial data in both 2014 and 2015.20 For this report, we use a subset of the dataset: 1,269 aged care charities which reported in both years.
Change in total incomeIn total, the total incomes of aged care charities in the dataset grew from $9.6 billion to $10.2 billion, which represents an annual growth rate of 6.6%. This is much higher than the growth across all charities from 2014 to 2015 (2.0%).
Among aged care charities, total incomes grew in all size categories. This is shown in Figure 8.35. Growth in incomes was highest among those aged care charities which were extra small in 2014 (21.7%) and lowest among charities in the medium category (incomes between $250,000 and $1 million) (2.3%).
In terms of the sources of income, donations and bequests grew rapidly from 2014 to 2015 (28.1%), although this was the smallest income source for aged care charities (totaling $99.6 million in 2014 and $127.6 million in 2015, for the 1,171 charities in the panel). Notably, donations and bequests almost doubled for the largest aged care charities, growing by 94.5% from 2014 to 2015.21 Note that one very large charity which had no donations and bequests in 2014 reported a large donation in 2015, which may account for this large increase.
Government grants grew by 11.8%, from $4.1 billion in 2014 to $4.6 billion in 2015. As for donations and bequests, growth was apparent in all size categories. Growth in ‘other income’, a major source of income for aged care charities was modest (2.2%, from $5.4 billion to $5.5 billion). The growth in this income source was not universal across all size categories, with some categories experiencing a loss. Figure 8.35 Percentage change in income among aged care charities, 2014 to 2015
Size % change in government grants
% change in donations and
bequests
% change in other income
% change in total income
XS 33.2 16.1 20.5 21.7S 0.3 86.5 2.4 6.5M 5.9 19.4 -4.0 2.3L 10.0 24.5 9.2 9.8XL 19.1 7.8 -0.1 8.0XXL 4.0 94.5 1.4 3.0Total 11.8 28.1 2.2 6.6
Change in employment in aged care charitiesThere were 1,236 aged care charities in the matched panel dataset which reported employment numbers in both years. Together, these charities, reported 142,679 paid staff in 2014 and 147,006 in 2015 (growth of 3.0%). This was much higher than employment growth across all charities (0.7%) and, perhaps, reflects the growing demand in aged care services. The mean number of employees per aged care charity grew from 114.8 in 2014 to 118.3 in 2015.
20 Further information on how the matched panel dataset was constructed is in Australian Charities Report 2015. 21 Note that if this charity is excluded, the % change in donations for XXL charities changes from 94.5% to -6.8%. This reflects both the growth in donated revenue for one organisation, and the low sample size (there were only 20 XXL aged care charities in the panel).
51

However, most growth in aged care employment was in casual positions. The number of full time staff in aged care charities fell by 10.3% from 2014 to 2015, while growth in part time staff was modest (2.6%). Growth in casual staff was much higher, at 16.0% from 2014 to 2015. In the largest charities (incomes over $100 million), most growth in employment occurred among casual staff. While full time staff in the largest charities fell by 14.0% (from 9,290 to 7,994), the numbers of casual staff grew by 31.8% from 2014 to 2015, from 7,734 to 10,194.
Change in volunteersDue to changes in the AIS, the way volunteer numbers were reported differed between 2014 and 2015. The AIS in 2014 asked for the numbers of volunteers in categories, while the total figure was required in the 2015 AIS. As such, net increases and decreases in volunteers cannot be shown. However, movement between categories can be analysed.
Most aged care charities fell into the same category in both years, reflecting general stability in volunteer numbers, as in the wider charity sector. Among those with no volunteers in 2014, 72.9% still had no volunteers the following year, while 27.1% had engaged volunteers in the subsequent year. Many charities which had 1 to 10 volunteers in 2014 had more volunteers the following year (18.4%). However, a significant proportion of charities engaging large numbers of volunteers had fewer volunteers in 2015 than 2014. Among those charities with volunteer numbers between 50 and 100 in 2014, 22.1% had fewer volunteers in 2015, and 12.4% of those with over 100 volunteers in 2014 reported fewer in 2015. Figure 8.36 Percentage change in volunteers, 2014 to 2015
Volunteers in 2015
Volunteers in 2014 n (2014) Same volunteers (%) Fewer volunteers (%) More volunteers (%)
No volunteers 70 72.9 NA 27.11–10 volunteers 321 76.0 5.6 18.411–50 volunteers 441 80.5 10.2 9.351 to 100 volunteers 172 67.4 22.1 10.5More than 100 volunteers 185 87.6 12.4 NA
Notes: n=1198. Data missing for 71 charities.
52

9. ConclusionThe report underlines the important contribution charities make to Australia’s aged care industry, and through the case studies, provides examples of the diversity of aged care charities. As well as delivering residential aged care and care to older people in their homes, charities contribute to the health, wellbeing and connectedness of older people through a range of activities, including recreation, culture, social services and religion.
While aged care charities make up 2.9% of all charities, they are an economically significant sector, accounting for a high share of income, expenditure and employment. Aged care charities received 9.3% of the charity sector’s total income, and 10.8% of the charity sector’s income from government. Aged care charities accounted for 9.5% of the charity sector’s total expenditure; and employed 14.1% of all employees in Australia’s charities.
Aged care charities differ from the wider charity sector in some important ways. Compared with all charities, aged care charities are larger, and more likely to receive government income and ‘other income’. Philanthropy, captured as donations and bequests, makes a relatively small contribution to the total income of aged care charities.
Aged care charities also employ high numbers of staff, relative to other charities. However, from 2014 to 2015, most growth came from employment of casual employees.
While aged care services and activities to benefit older people are provided by government and private providers, as well as charities and not-for-profits, a number of factors are likely to have a critical impact on the future of charities delivering aged care. This includes the ageing population and necessary expansion of the sector to support this, as well as government policy, including the shift to consumer based funding.
Overall, the report has provided a profile of Australia’s aged care charities, defined as charities registered with the ACNC which reported aged care as their main activity in 2015. The report builds on the material contained in the Australian Charities 2015 Report . You can read more about the data and methodological details in the main report. It is also complemented by interactive data resources available at http://australiancharities.acnc.gov.au/.
53

ReferencesABS. (2011) Australian Statistical Geography Standard (ASGS): Volume 5 - Remoteness Structure, Cat. No.
1270.0.55.005. Canberra: Australian Bureau of Statistics.
ABS. (2016) Australian Demographic Statistics, Dec 2015, Cat. No. 3101.0. Canberra: Australian Bureau of Statistics.
ACNC. (2015a) Reporting – due dates. Available at: http://acnc.gov.au/ACNC/Manage/Reporting/Reporting/ACNC/Report/ReportDue.aspx?hkey=8cb2363b-95e9-4c4e-84b7-c5b27ccd9c36.
ACNC. (2015b) Factsheet: Deductible gift recipients (DGRs) and the ACNC. Available at: http://acnc.gov.au/ACNC/FTS/Fact_DGR.aspx.
Aged Care Financing Authority (2016a) Fourth report on the Funding and Financing of the Aged Care Sector, Australian Government, July 2016, Accessed online 28th February 2017 https://agedcare.health.gov.au/sites/g/files/net1426/f/documents/12_2016/2015-16_report-on-the-operation-of-the-aged-care-act-1997.pdf.
Aged Care Financing Authority (2016b) Financial Issues Affecting Rural and Remote Aged Care Providers, Australian Government, February 2016, Accessed online 28th February 2017 https://www.dss.gov.au/sites/default/files/documents/02_2016/11415_acfa_financial_report.pdf
Cortis, N., Young, A., Powell, A.. Reeve, R., Simnett, R., Ho, K., and Ramia, I. (2016) Australian Charities Report 2015. Centre for Social Impact and Social Policy Research Centre, UNSW Australia. Accessed online 28th February 2017 http://www.csi.edu.au/media/Australian_Charities_Report_2015_Web_ND8DU2P.pdf
Deloitte (2016) Australia’s aged care sector: economic contribution and future directions. Aged Care Guild. Deloitte Access Economics, Sydney. Accessed online 28th February 2017 https://agedcare.health.gov.au/sites/g/files/net1426/f/documents/12_2016/aged_care_guild_-_enclosure_1_-_deloitte_access_economics_-_australia_s_.pdf
Department of Health (2016) Report on the Operation of the Aged Care Act 1997, Commonwealth of Australia. Accessed online 28th February 2017 https://agedcare.health.gov.au/sites/g/files/net1426/f/documents/12_2016/2015-16_report-on-the-operation-of-the-aged-care-act-1997.pdf
Productivity Commission (2017) ‘Aged Care Services’ in Report on Government Services 2017, Volume F Chapter 14, Accessed online 28th February 2017 http://www.pc.gov.au/research/ongoing/report-on-government-services/2017/community-services/aged-care-services/rogs-2017-volumef-chapter14.pdf
54

Appendix A: Supplementary tablesFigure A. 1 Staff in aged care charities by size
Full time Part time Casual TotalSum Mean Sum Mean Sum Mean Sum Mean
XS (Under $50,000) 43 0.2 172 0.7 116 0.5 331 1.3S ($50,000 to $250,000) 387 1.6 670 2.8 415 1.8 1,472 6.2M ($250,000 to $1 million) 369 1.6 1,101 4.7 575 2.5 2,045 8.8L ($1 million to $10 million) 4,505 8.7 19,678 38.2 8,247 16.0 32,430 63.0XL ($10 million to $100 million) 10,832 55.3 41,536 211.9 15,844 80.8 68,212 348.0XXL (more than $100 million) 12,085 431.6 41,122 1,468.6 14,166 505.9 67,373 2406.2Total 28,221 19.3 104,279 71.3 39,363 27.0 171,863 117.5
Figure A. 2 Aged care charities with no paid staff by size
Total nNo paid staff
n %XS (Under $50,000) 256 211 82.4S ($50,000 to $250,000) 236 86 36.4M ($250,000 to $1 million) 232 23 9.9L ($1 million to $10 million) 515 10 1.9XL ($10 million to $100 million) 196 4 2.0XXL (more than $100 million) 28 0 0.0Total 1463 334 22.8
Figure A. 3 Expenditure on grants by aged care charities
Grants and donations in Australia
Grants and donations outside Australia All grants and donations
Sum Mean Sum Mean Sum MeanXS (Under $50,000) 988,360.5 3,861 54,664 214 1,043,025 4,074S ($50,000 to $250,000) 5005,702 21,032 209,917 882 5,215,619 21,914M ($250,000 to $1 million) 2,638,701 11,374 326,918 1,409 2,965,619 12,783L ($1 million to $10 million) 12,005,670 23,312 72,250 140 12,077,920 23,452XL ($10 million to $100 million) 6,839,094 34,893 2,791,669 14,243 9,630,763 49,137
XXL (more than $100 million) 6,078,968 217,106 0 0 6,078,968 217,106Total 33,556,496 22,905 3,455,418 2,359 37,011,914 25,264
55

Appendix B: Aged care Charities by highest incomeAll data below includes reported data only and only charities who have consented to have their data included in the ACNC Register.
All XXL charities whose reported main activity was Aged Care by total gross income
Charity name Total gross income ($)Uniting NSW.ACT (group reporter) 694,223,000The Trustee For R.S.L (QLD) War Veterans' Homes Trust 276,669,000Catholic Healthcare Limited 268,133,838BaptistCare NSW & ACT 267,220,000Ozcare 224,579,699Silver Chain Group Limited 207,191,000Rsl Lifecare Limited 204,074,428Anglican Community Services 197,067,900HammondCare (group reporter) 187,052,000The Corporation of the Synod of the Diocese of Brisbane (group reporter) 167,869,437Illawarra Retirement Trust 165,674,067Baptcare Ltd 150,079,000Southern Cross Care (NSW & Act) Ltd 145,912,120Mercy Aged and Community Care Limited 140,814,000Brightwater Care Group Limited 140,625,541Uniting Church Homes 138,159,761Southern Cross Care (S.A. & N.T.) Incorporated 136,929,222The Whiddon group (group reporter) 129,019,000Royal District Nursing Service Limited 126,155,094Baptistcare Inc 123,240,000The Corporation Of The Trustees Of The Roman Catholic Archdiocese Of Brisbane 116,703,000Resthaven Incorporated 115,748,452The Bethanie Group Inc 113,077,599Aged Care & Housing Group Inc 111,204,000Anglican Aged Care Services Group 103,786,751Uniting AgeWell Victoria 102,033,834Amana Living Incorporated 101,463,000Royal Freemasons' Benevolent Institution 101,121,296
56

Appendix C: Further methodological detailsAll quantitative data analysis was undertaken in Stata version 14.0.
Data inclusionCharities in scope for this report are charities which were registered with the ACNC at the end of their 2015 financial year22, excluding:
Charities that report to Office of the Registrar of Indigenous Corporations (ORIC)
Charities that failed to provide both their 2014 or 2015 Annual Information Statements and were liable for revocation at the end of the 2015 year (“double-defaulters”).
For each charity, the most recent data was used in the following order of preference:
2015 Annual Information Statement – Groups Data
2015 Annual Information Statement
2014 Annual Information Statement
2013 Annual Information Statement
ACNC Register information.
In addition, data about tax concessions and entity type from the Australian Business Register, based on a charity’s ABN.
Group dataThe ACNC Act 2012 allows some charities to request group reporting. If approved, one Annual Information Statement report is provided for two or more charities. In the 2015 AIS data 114 Groups reported for a total of 885 individual charities.
If at least one charity in each group had DGR status then the group was considered to have DGR status. The ACNC also provided a location as the “head office” for each Group.
Some data cannot be inferred for the group as a whole, for example, type of entity. These are treated as missing in the associated analyses.
Data cleaning - ACNCErrors in Annual Information Statement data for the 2014 and 2015 years were corrected by the ACNC as follows:
Errors/potential errors in financial data were identified; for example, where totals did not agree with the data provided or where financial data provided was materially inconsistent with other data (for example, reported charity size);
Charities were contacted by email and/or phone about the potential errors and invited to correct errors. In correcting potential errors in the 2015 AIS (for example) 7,085 charities were contacted and invited to complete an online form correcting one or more potential errors in the submitted AIS.
Corrected/amended data was uploaded to the ACNC Register by the ACNC prior to data being provided to the research team.
22 Charities financial years vary; the end of the 2015 financial year may be 30 June 2015 for many, but can also be 31 December 2015 or any other date. Charities were included based on their registration status on the last day of the Charity’s financial year.
57

Data cleaning/omission – Research teamThe research team received the data from the ACNC in separate data files (see Data inclusion above) and combined the data into a consolidated dataset for analysis (see Data inclusion above).
The team then conducted an analysis to identify remaining errors and/or outliers:
Financial errors, where data provided did not match sub-totals or totals provided;
Materially inconsistent data, for example, where a Charity reported its size as Small but had Total Revenue over $10m.
Where one or more errors were identified:
Data was examined record-by-record for errors over $30m. Where data could be amended with confidence it was corrected (for example, where an error in a sub-total could be corrected, and the resulting sub-total agreed with both the data adding to the sub-total and in the resulting overall total); otherwise the data was excluded.
For financial data errors below $30m, data was excluded based on its significance in relation to the calculated size of the charity (generally excluded if the largest error was more than half the minimum total income figure for the calculated size segment):
o Error of at least $50m for XXL charities (income over $100m)o Error of at least $5m for XL charities (income over $10m)o Error of at least $0.5m for L charities (income over $1m)o Error of at least $125k for M charities (income over $250k)o Error of at least $25k for S charities (income over $50k)o Error of at least $5k for XS charities (income more than $0 but less than $50k)
In addition, the research team consulted with the ACNC data details for cleaning:
The ACNC advised the research team which fields contained blank, zero or ‘null’ responses by default so that non-reporting could be separated from actual zeros in the data.
Data for volunteers in prior years was reported in ranges (for example, 1-10, and 11-50), and the 2015 AIS as an estimated number (eg 36). Data provided in ranges was converted to an estimated value using the midpoint of the range (eg 31 if 11-50).
Inconsistencies in reporting were amended for consistency; for example, reporting ‘Victoria’ instead of ‘VIC’ and binary data in the forms of Y/N and 1/0.
Some missing data was added where it could be inferred; for example, a missing State added where the postcode was present.
Estimation modelThe consolidated dataset includes over 50,000 records, of which 25% have no reported financial data either because they have not reported financial data (e.g. Basic Religious Charities or other exemption; have not yet submitted an 2015 or 2014 Annual Information Statement, or had large errors in financial data and so data was excluded.
For charities without reported financial data, financial data was estimated using mean values from a two-dimensional segmentation model based on “sector” (category of main activity eg Health, Social Services) and income segment (XS, S, M, L, XL or XXL):
Charities were allocated estimated values for financial data based on their reported size and main activity.
In addition, charities within the “Small” size group were allocated at random into XS and S income segments, and charities in the “Large” group were allocated at random into L and XL income segments in proportion to the segmentation model data.
58

Sensitivity testing was conducted on the estimated model. In spite of the fact that 25% of charities did not report financial data, and so their data was estimated, a disproportionate number of these are small. As a result the contribution of the estimated financial data to overall sector totals is of the order of 4-6% and so the uncertainty introduced by the model is very low. Averages (e.g. for total income) by income size (XS, S, M, L, XL, XXL) or sector of main activity (Health, Social Services etc) are not affected.
Estimated model data is used to calculate sector and segment financial totals (estimating the value of the whole charity sector) and averages (where the model does not affect the outcome). Reported data is used to calculate medians and for categorical data such as staff, volunteers, and beneficiaries.
Change over time model The change over time model used a specially constructed matched panel dataset consisting of the 41,908 charities which provided an AIS in both 2014 and 2015. This was constructed by matching ABNs. Data was cleaned using the same methods described above, so data excluded from the 2015 dataset was also excluded in the panel dataset. Additional exclusion criteria were applied to financial data. To summarise:
Charities with financial data in 2014 AND 2015 was used as the starting point (~31,000). Charities whose 2014 data had errors above the same thresholds used in the 2015 analysis
were excluded. Balance sheet data was excluded for any charity with all zeros in either year or both years.
The counts were 2,933 in 2014, 2,322 in 2015, and 3,388 excluded as a result. Income Statements excluded where the statement was zero in either or both years (346
excluded) Then the size of the change was considered:
o The top 1% of changes in the Income Statement were excluded for each Segment (XS, S, M, L, XL, XXL) –the whole income statement for these was excluded, but the balance sheet was retained
o The top 1% of changes in the Balance Sheet were excluded for each Segment - the whole balance sheet for these was excluded, but the income statement was retained
o For the largest segment, changes exceeding $500 million were also excluded (one case).
59

60