contents2pq +q2=1 thefrequencies of the dominant and recessive alleles are represented by p and...
TRANSCRIPT

Advanced Placement Biology SeriesLaboratory EightPopulation Genetics and Evolution
ContentsIntroduction page 2Additional Readings
Introduction to Mendelian Genetic page 3Mendel's Experiments page 3Principles of Heredity page 4Law of Segregation ...............•.......................•................ page 4Law of Independent Assortment page 4Heredity of Human Traits page 4Example of a Pedigree page 4Mutation and Natural Selection page 4Using Punnett Squares page 5Pre-Lab Exercise page 6Anton van Leeuwenhoek 1632-1723 page 9Jean Baptiste Lamarck 1744-1829 page 9
Learning Objectives page 10Time Requirements page 10Materials Requirements page 10Experiments
Calculating Allele Frequencies Using the Hardy-Weinberg Principle ••page 10Testing the Hardy-Weinberg Principle •••••••••••••••••••••••••••••••••••••••• page 11
Questions page 14Further Investigations page 15Related Materials page 16Glossary ••••••••••••••••••••••••••••••••••••••••••••••••••••••••••••••••••••page 16Population Genetics and Evolution page 1

Introduction
As early as the 500s B.C.,several Greek philosophers theorized about the union of male and female traitsto form offspring. In the 17th century, Leeuwenhoek concluded that semen and eggs carried hereditary fac-tors conveyed to the offspring. Throughout the next century, scientists developed theories on the processesof development; LaMarck was one of the first to discuss the possibility of acquiring changed traits fromparents. For example, he thought that if giraffes had to stretch to eat the tops of trees, their offspring wouldbe born with longer necks.
During the 19th century, Darwin published his theory of evolution, stating that members of a populationvary considerably in their genetic makeup. Those that are the "fittest" for their environment are better ableto survive and reproduce, and therefore pass these suitable traits on to the next generation. This "naturalselection" creates a population that is different from the previous generations. Since Darwin's theories werepublished, several others have expounded on his work, leading to the ideas of adaptation and mutation.Recent research has determined that chromosomes, present in each sex's reproductive material, carry thegenes that determine individual characteristics.
A population-all the individuals of a species that live in the same place at the same time-are affected bytheir own characteristics. Population genetics is the effect that heredity has on a population. What happensto that group of people over the course of a number of generations is expressed mathematically.
There are three key elements of any population: size, density, and dispersion. Population size is importantto the groups' ability to reproduce without a lot of inbreeding. Inbreeding can be the downfall of a popula-tion if recessive traits, many of which are harmful, become a common occurrence. Population density canaffect the ability of individuals to reproduce, based on whether they ever encounter another to mate with.Dispersion, or how populations are arranged, can also affect populations.
Populations evolve by responding to their surroundings through natural selection. This change actuallyoccurs in the frequency of gene alleles in the population. William Castle, an American scientist; GeoffreyHardy, a British mathematician; and Wilhelm Weinberg, a German physician, independently determined thatthe frequencies of genes in a population remain constant unless certain forces act on the population.Dominant alleles will not replace recessive alleles, and the ratio of heterozygous and homozygous individu-als does not change over the course of several generations. This theory has come to be known as theHardy-Weinberg principle; it is the basis of the study of population genetics.
The Hardy-Weinberg principle is normally stated as a mathematical equation:
p2 + 2pq + q2 = 1
The frequencies of the dominant and recessive alleles are represented by p and q, respectively. Forexample, if a diploid individual has two alleles,"A" and "a';at a particular locus, only three possible genotypescan be the result: AA, Aa, and aa.The probability of receiving the "A" alleles from both parents is p x p, or p2;forthe "a" alleles, q x q, or q2.Those who received the Aa combination are described by 2pq, since it is possible forthe "A" or the "a" to come from either parent, thereby doubling the chance.
To apply the principle, at least one of the allele frequencies must be known. For example, if the frequencyof the recessive allele for cystic fibrosis is one in 2,080 Caucasian North Americans, or 0.00048, this is equal toq2.After calculating the square root, q = 0.022. Then the frequency of the dominant allele is calculated: sincep + q = 1,P = 1 - q or p = 1 - 0.022, P = 0.978.
Having identified the values of p and q, the frequency of heterozygotes in the population can bedetermined: 2pq = 2(0.978)(0.022) = 0.043. Therefore, 43 out of every 1,000 Caucasian North Americans areheterozygous for cystic fibrosis.
If the relationship between p and q are constant through randomly mating generations, the populationis said to be in Hardy-Weinberg equilibrium; no evolution occurs. However, five evolutionary forces act on apopulation to affect it: mutation, migration, non-random mating, genetic drift, and natural selection. If any of
Population Genetics and Evolution page2

these conditions are present, the proportions of heterozygotes and homozygotes can differ. Therefore, theHardy-Weinberg principle is a useful tool for measuring the degree of genetic change or evolution occurringin a population.
Mutations are the basic source of evolutionary change, but they do not occur often enough tosignificantly change gene frequencies on their own. However, gene frequencies can be significantly changedcausing evolution through several other factors. Natural selection is the primary force for evolutionarychange. An allele can increase or decrease in frequency based on its usefulness in reproduction and survival,and this can change form generation to the next or from one population through the migration of individu-als between populations. This type of change in the allele frequency is called gene flow. Other possibleways that gene frequency can be changed within a population are non-random mating and genetic drift.Non-random mating can be the result of either inbreeding or an organism's ability to choose a mate basedon certain characteristics based on size, coloration, or lifestyle. In either case, the proportion of homozygotescan increase.upsettinq the equilibrium. Genetic drift refers to the possibility that certain alleles could beeliminated form a population by chance. For example, two heterozygous parents, Aa, could possibly havetwo AA children, thus eliminating the aa allele from the next generation. Normally, this is balanced by similarevents that might eliminate the A allele from another family, but in small populations it is possible to losethe same allele at a large number of loci.}
If the relationship between p and q are constant through randomly mating generations, the population issaid to be in Hardy-Weinberg equilibrium, and no evolution occurs. However, five evolutionary forces act ona population to affect it: mutation, migration, non-random mating, genetic drift, and natural selection. If anyof these conditions are present, the proportions of heterozygotes and homozygotes can differ. Therefore, theHardy-Weinberg principle is a useful tool for measuring the degree of genetic change or evolution occurringin a population.
Introduction to Mendelian Genetics
Scientists throughout history have attempted to understand the process of heredity, and use it totheir advantage to create improved varieties of plants and animals. Until Gregor Mendel conducted hisexperiments in the 1850's, no one had actually quantified the results into probability ratios for inheritedtraits. He used pea plants to conduct his experiments since they are quick growing, there are many varietieswith easily observable traits, and if left on their own they self-pollinate, so there was no danger of cross-pollination when it wasn't desired. His results led to a greater understanding of heredity and the workingsof genetics.
Mendel's ExperimentsMendel's experiments consisted of crossing different varieties of pea plants and studying the results.
He observed them for seven characteristics: seed form and color, flower position and color, pod form andcolor, and stem length. Before beginning, he allowed the plants to self-pollinate and create several genera-tions of offspring to ensure that the traits he wanted to observe were true to that plant, or in other words,that that plant always produced the same results. For example, that a plant with purple flowers would staytrue to purple flowers.
To create the first generation, Mendel manually cross-fertilized two parent plants (P) to create off-spring (F,).These plants ofthe F, generation always displayed only one of the parental traits. When theseF, plants were then allowed to self-pollinate, their offspring (F
2) began to show some ofthe other original
traits from the other P generation parent.This led to Mendel's definitions of dominant and recessive traits. Hedetermined that in the F2 generation the plants displayed traits in a 3:1 ratio, dominant traits to recessive. Thishe broke down further, suggesting that it was truly a 1:2:1 ratio; 1 true breeding dominant: 2 mixed dominantplants: 1 true breeding recessive.
Mendel published his findings in 1866, but was not favored with much response. He died in anonim-ity, and it was not until the early 1900'sthat his work was rediscovered and accepted asthe great sciencethat it is today.
Population Genetics and Evolution page 3

Principles of Heredity
Mendel's theory of heredity has become the foundation of modern genetics. He said that parentspass on units of information, now known as genes, that operate in the offspring to produce traits. For eachtrait, an individual has two genes, one from its mother, one from the father. These as individuals are termedalleles. Each allele can be passed on, when the individual reproduces, in the form of gametes with varyinggenetic makeup.
Law of Segregation
This has come to be known as Mendel's First Law. It states that an organism carries a pair of genesfor each trait and these segregate during the formation of gametes. If both alleles of the pair of genes arethe same, the individual is homozygous for that trait. Conversely, if the pair is not the same, the individual isheterozygous for that trait. Upon segregation, if two recessive gametes come together, one from the male,one from the female, only then will the recessive trait be displayed.
Law of Independent Assortment
Mendel's Second Law states that members of each pair of genes are distributed independently whenthe gametes are formed. Basically this means that for pairs of traits studied, inheritance of one trait did notinfluence the inheritance of other traits. We now know that this applies only to genes located on differentchromosomes or those separated by distance on the same chromosome.
Heredity of Human Traits
Human traits are passed on in the same fashion Mendel discovered with his pea plants. The mainconsideration with human heredity is the consequences of defective alleles. In order for a person to developand function normally, his/her genes must create the proper proteins that contribute to the processes of thehuman body. If genes are damaged or incorrectly copied, the proteins are encoded wrong. This is called amutation. Not all mutations are serious; however, many do lead to serious disorders. Some examples of thisare Cystic Fibrosis, hemophilia, and sickle-cell anemia.
Scientists cannot cross humans at will to determine the traits that exist. Therefore they need to createa diagram of one's family history, called a pedigree, to be able to predict genetic disorders. USing a pedigreethey can determine if traits are dominant or recessive, sex-linked or autosomal (on a chromosome otherthan the sex determiner). It is also possible to infer if a family member is homozygous or heterozygousfor a trait.
Genetic counseling is now available to determine if there are genetic disorders in your family pedi-gree that you may not wish to pass on. In this case many people choose not to have children. Once childrenare born, some disorders are treatable, and others can be cured by a new process called gene transfertherapy. Through medical means, a copy of a healthy gene replaces a gene that is defective. This technologyhas shown itself effective, yet costly. Scientists still have much to learn in the area of human genetics.
Example of a PedigreeThis shows the transmission pattern of a dominant trait in humans. Individuals showing the trait are
indicated by solid squares and circles.
Mutation and Natural Selection
A mutation is defined as a change in the genetic information of an organism. Mutations generallyproduce harmful effects, such as birth defects, diseases, or death. Some examples of the most commongenetic disorders are: Cystic Fibrosis, Sickle-cell Anemia, Phenylketonuria, Hemophilia, Huntington's disease,Muscular Dystrophy and Tay-Sachs disease. Some of these are treatable, but others can lead to almost certaindeath.
On the other hand, some mutations can enable an offspring to better adapt to its environment thanits parents. This actually is the raw material for natural selection, the basic process of evolution. In general,diseases related to recessive genes are more frequent than those of dominant, because they are not exposedas much to the process of natural selection.
Population Genetics and Evolution page4

Mutations can be caused by errors in DNA replication, or others by environmental influences such asradiation or chemical agents. Some mutations can be avoided or repaired by enzymes within a cell.
Using Punnett Squares
Biologists can use a diagram called a Punnett Square to predict the probable outcome of a cross. Amonohybrid cross, a cross that provides data about one trait, is the simplest form of a Punnett Square.
genotype of tall plant (TT)
genotype of short plant (tt)
Each box has a letter from the left side, and one from the top. These are the possible genotypes of theoffspring. In the case of this cross, 100% of the offspring are expected to be heterozygous (Tt), and expressthe dominant trait of tallness.
To show further crosses, such as a heterozygous cross, follow the same steps.
Tt (tall plant)
Tt (tall plant)
Here the ratio is _
Dominant
Homozygous:
Dominant
Heterozygous:
_Recessive
Homozygous
Population Genetics and Evolution page 5
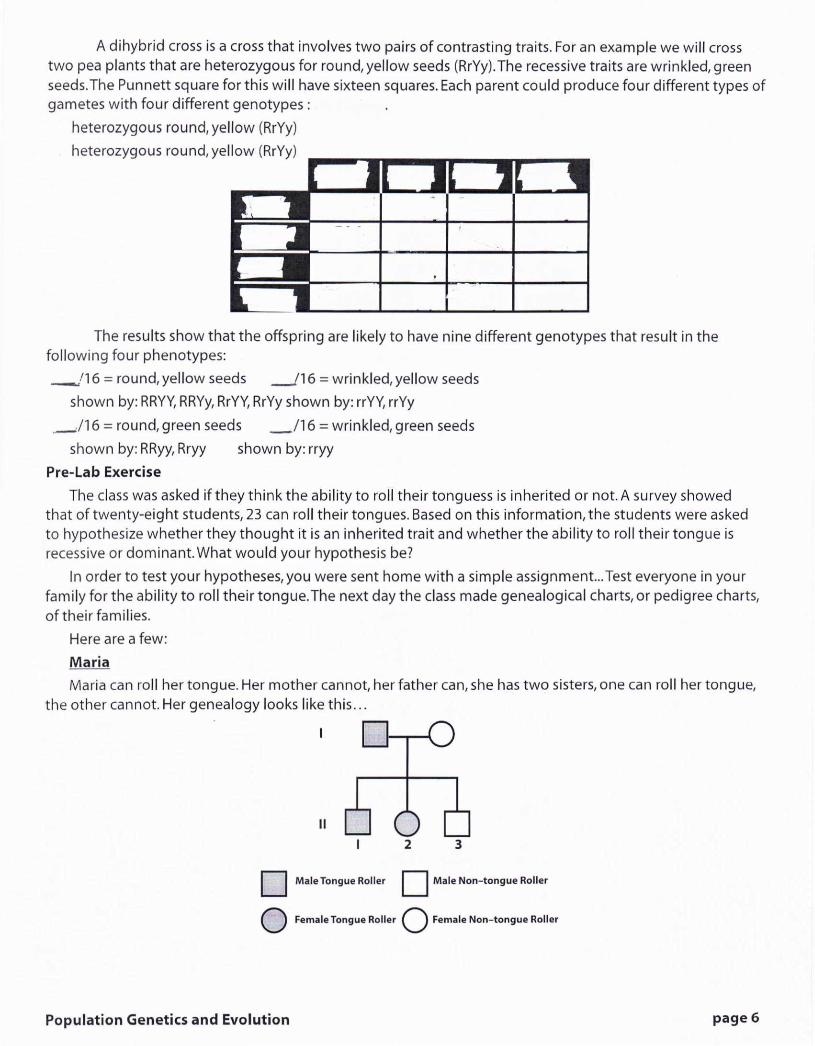
A dihybrid cross is a cross that involves two pairs of contrasting traits. For an example we will crosstwo pea plants that are heterozygous for round, yellow seeds (RrYy).The recessive traits are wrinkled, greenseeds. The Punnett square for this will have sixteen squares. Each parent could produce four different types ofgametes with four different genotypes:
heterozygous round, yellow (RrYy)
heterozygous round, yellow (RrYy)
The results show that the offspring are likely to have nine different genotypes that result in thefollowing four phenotypes:
_'16 = round, yellow seeds --'16 = wrinkled, yellow seeds
shown by: RRYY,RRYy,RrYY,RrYy shown by: rrYY, rrYy
.-1/16 = round, green seeds _/16 = wrinkled, green seeds
shown by: RRyy,Rryy shown by: rryy
Pre-Lab Exercise
The class was asked if they think the ability to roll their tonguess is inherited or not. A survey showedthat of twenty-eight students, 23 can roll their tongues. Based on this information, the students were askedto hypothesize whether they thought it is an inherited trait and whether the ability to roll their tongue isrecessive or dominant. What would your hypothesis be?
In order to test your hypotheses, you were sent home with a simple assignment ...Test everyone in yourfamily for the ability to roll their tongue. The next day the class made genealogical charts, or pedigree charts,of their families.
Here are a few:
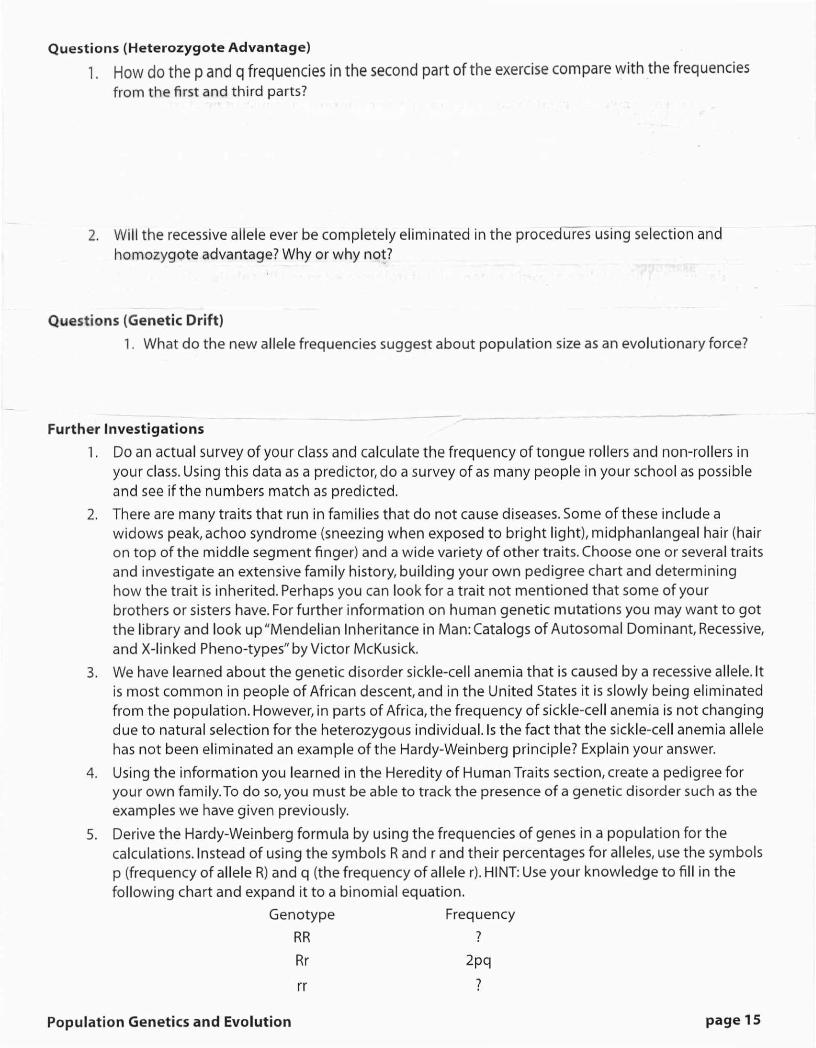
MariaMaria can roll her tongue. Her mother cannot, her father can, she has two sisters, one can roll her tongue,
the other cannot. Her genealogy looks like this ...
II
2 3
D Male Tongue Roller DMale Non-tongue Roller
o Female Tongue Roller 0Female Non-tongue Roller
Population Genetics and Evolution page6

Maria's hypothesis was that tongue rolling is an inherited trait and the ability to roll (R) is dominant overinability to roll (r). She feels that her genealogy supports her hypothesis. If Maria is indeed correct, fill in thegenotypes of her family below:
Mother- Maria-- -Father- Tongue rolling sister-_- Non-rolling sister- _
Using the Punnett Square below, and assuming that Maria was correct, show the cross of Maria's parentsand
the possible offspring produced. Circle the genotype that produced Maria.
Corey
Corey is a tongue roller. Both parents are tongue rollers. His sister is not a tongue roller. Draw a pedigreechart of Corey's family. Use the same symbols as were used for Maria's family.
II2
EJ\ Male Tongue Roller 0Male Non-tongue Roller
o Female Tongue Roller 0Female Non-tongue Roller
Assuming Maria was correct about tongue rolling being dominant, give the genotypes of the membersof Corey's family.
Father-_
Mother-_
Sister--Can Corey's exact genotype be determined? Explain.
If Maria were wrong, could tongue rolling be recessive based on Corey's family? Explain.
After analyzing the family trees of everyone in class, it was concluded that Maria was indeed correct,and the ability to roll your tongue seemed to be a dominant trait. The class went on to determine what
Population Genetics and Evolution page 7

percent of the students was rollers and what percent was non-rollers. When just the class data was collected,there were 23 rollers and 5 non-rollers. This means that out of 28 people, 5 were non-rollers. This meansthat 18% of the class were non-rolling students, BUT that only tells us the frequency of non-rollers, not thefreq uency of the gene.
Again, 23 students out of 28 were rollers, Calculate the percentage of students who were rollers.
What could the genotypes of the rollers be?
At this point all that we know is that the population of students in the class is 18% non-rollers 82% rollers.Is there a way to determine how many of the class are Rr? For this the class must use the Hardy-WeinbergTheory.
The Hardy-Weinberg Theory is a way to predict how frequently a gene will arise in a given population.We
base these predictions on sample populations. It is a fairly simple theory that says the following:
q= frequency of a recessive gene in a population
p= frequency of a dominant gene in a population
If there are only two possible genes for a given trait (i.e., Ror r), then it stands to reason that the frequencyof p added to the frequency of q should represent all of the genes for that trait or in other words p+q=100% or in decimal form, p+q=I:
If the frequency of a recessive gene in a population is 0.62 what is the frequency of the dominant gene?
How would you get the frequency of a gene when all you have are genotypes?
RR+Rr+rR+rr - all of the genes for tongue rolling in a population
Using the frequency symbols from above, RRbecomes pp. Since these frequencies are numbers, ppbecomes p2,rr becomes qq or q2,and the two heterozygous conditions can become 2pq. The Hardy-Weinberg Theory thus comes out looking like this:
To apply the Hardy-Weinberg Theory the class started out with the known homozygous recessivegenotype.
Recessive Genotype frequency = '_---This corresponds to q'. To find q, the class simply found the square root of q", which of course gave them
the value of q or the frequency of the recessive gene.
Frequency of Recessive gene = _Remembering that p + q = l;the frequency of p can be calculated by some simple math;
f'=-Frequency of Dominant Gene = (-FJ"c;:v>-I. /'Yll)(_;-/a'.s c../?!Js hvt _J,re/r.s)Now the frequency of heterozygous individuals can be calculated simply by plugging numbers into 2pq.Frequency of heterozygotes = : ................~ "'"
Population Genetics and Evolution pageS

To determine the actual number of Rr in the class all we now need to do is figure out what 48.7% ofthe population is.
Number of Rr = .487 x 28 + 13.6.They can expect about 13-14 members of the class to be Rr.
The class knew that they needed more data than just 28 individuals. To do this they pooled their familytrees and had a total of 140 individuals. Of these 140 individuals 21 were non-rollers. Using the techniquesabove the class set out to answer two problems.
1. What percent of the population covered in the survey was Rr?
2. How many Rr individuals would you expect in a city of 500,000?
To do this calculate as above in the following sequence:
Percent of homozygous recessives (rr) =15qq =q=p=
2pq =2pq x 500,000 =
)Anton van Leeuwenhoek 1632-1723
Leeuwenhoek was a pioneer in numerous scientific areas. He made discoveries with protozoa, red bloodcells, and the life cycles of insects. He magnified objects through his tiny, double convex lenses in his hobby-crafted microscope. He confirmed and developed the discovery by Italian anatomist Marcello Malpighi ofcapillary systems in 1668 by demonstrating how red blood cells circulated through the capillaries of arabbit's ear. He then observed what he called animalcules, known today as protozoa and bacteria,in pondwater, and in 1677 he described the spermatozoa of both insects and humans.
Leeuwenhoek was against the prevalent theory of spontaneous generation and demonstrated thatweevils, fleas, and mussels are not created from wheat grains and sand but develop from tiny eggs. Hedescribed the life cycle of ants, showing how the larvae and pupae develop from eggs. Leeuwenhoek wasmade a fellow of the Royal Society of England for his discoveries.
Jean Baptiste Lamarck 1744-1829Lamarck was a French botanist and invertebrate zoologist who formulated one of the earliest ideas of
evolution. He is best known for his theoretical work on evolution and published a seven volume work titledthe Natural History of Animals without Backbones, 1815-1822. Lamarck accepted the view that animals innature were arranged on one continuous natural scale. According to his ideas, once nature formed life, thearrangement of all subsequent 'forms of life was the result of time and environment interacting with theorganization of organic beings. From the simplest forms of life, more complex forms emerged naturally.
In 1809, Lamarck explained in greater detail, when he published his Zoological Philosophy, by saying thathis scale of nature was controlled by three biological laws: environmental influence on organ development,change in body structure based on use and disuse of parts, and the inheritance of acquired characteristics.However, Lamarck's ideas were never clearly presented and as a result not seriously accepted during hislifetime. It was not until the 20th century that Lamarck's ideas were seriously reconsidered.
Population Genetics and Evolution page9

Learning Objectives
Students will simulate random mating patterns and utilize the Hardy-Weinberg principle to determineallele frequencies, the effect natural selection has on allelic frequencies, how natural selection reduces thefrequency of recessive traits, and how the Hardy-Weinberg law of genetic equilibrium can help determinewhether evolution is occurring.
Calculating Allele Frequencies Using the Hardy-Weinberg Principle
15 minutes
Testing the Hardy-Weinberg Principle30 minutes for each cross
Materials RequirementsMaterials Included in the Kit
100 Strips of PTCPaper
100 Strips of Control Paper
100 Index Cards
Materials Needed but Not ProvidedCalculator
Calculating Allele Frequencies Using the Hardy-Weinberg Principle
Testing different individuals' ability to taste PTC (phenylthiocarbamide) is a good way to demonstratethe Hardy-Weinberg principle. Homozygous-dominant (AA) and heterozygous (Aa) individuals can taste thisbitter chemical, although homozygous-recessive (aa) individuals cannot. Use your class as a representativepopulation to calculate the frequencies of the two alleles with the Hardy-Weinberg equation.
1. Obtain a piece of PTCtest paper.
2. Place it on your tongue and note whether you can detect a bitter taste.
3. (Optional) Obtain a piece of control paper and place it on your tongue. Comparing the controlpaper with the PTCpaper will help determine whether you detected a taste on the PTCpaper.
4. Record your results in Table 1.
5. Combine the entire class's results to calculate allele frequency.
Analysis1. Calculate the frequency of people who can taste PTe (p?+2pq) by dividing the number of people
who can taste PTC by the total number in the class. Because those that can taste PTCcan be eitherhomozygous dominant (AA) or heterozygous (Aa), the only known genotype is for people whocan't taste PTC(aa).Therefore, the value for q must be used to determine the value for p in theHardy-Weinberg equation. Divide the number of people who cannot taste PTCby the total numberof students in the class to obtain the q2value. Calculate the square root to determine the value forq, the frequency for the a allele. Record it in Table 1.
2. Since p + q = 1, P = 1 - q. Using the value for q, calculate the value for p, the frequency for theA allele. Record it in Table 1.
Table One
Population Genetics and Evolution page 10

Testing the Hardy-Weinberg Principle
Testing an Ideal Population
Note: The entire class will be used as a representative population. The four cards each studentuses, two '~" and two "a",represent haploid chromosomes contributed by parents in a simu-lated breeding exercise. Each parent begins with the genotype Aa, providing initial genotypefrequencies of 0.25 AA, 0.50 Aa, and 0.25 aa. Have students record these frequencies on theirdata sheets.
1. Obtain four index cards.Label two "A"and two "a".Thesewill be your haploid chromosomes.2. Randomly pair off with another student for "breeding". Chooseany other student; your gender and
genotype, and your partner's, don't matter in the simulation.3. Turn your cards upside down and shuffle them. Turn over the top card in your pile. Pairthis card
with your partner's card; this will be the genotype of your first offspring. Record this on your datasheet.
4. Turn over the next card in your pile. Pairthis card with your partner's card; this will be the genotypeof your second offspring. Recordthis on your data sheet.
5. Now begin the second generation, taking the genotype of your offspring. Forexample, if youproduced offspring with the genotype AA, begin the next generation with four A cards.
6. Repeat the above procedure for the second generation. Recordthe genotypes on your data sheet.7. Repeat the procedure for three more generations, for a total of five generations. Recordthe
genotypes for each.8. Combine your fifth generation results with the rest of the students'fifth generation results.
Analysis1. Use the table below to calculate allele frequencies after five generations of random mating.
Remember,the total number of alleles in the population is twice the number of students.
Calculating Allele Frequencies after Five Generations
Number of "A"Alleles Present at the Fifth GenerationNumber of genotype AA x 2 = A allelesNumber of genotype Aa x 1 = A alleles
Total = A alleles
Total Number of "A"Allelesp=---------------=Total Number of Alleles in the Population
Number of "a"Alleles Presentat the Fifth GenerationNumber of genotype aa x 2 = a allelesNumber of genotype Aa x 1= a alleles
Total = a alleles
Total Number of "a"Allelesq==----:--:-:---:----::'-:-:-:'--:----:---:---:::-----;----:--=Total Number of Alleles in the Population
Population Genetics and Evolution page 11

Selection
The previous exercise was conducted with ideal parameters. For a more realistic situation, selection mustbe used. There is 100% selection against homozygous-recessive offspring. If offspring are double recessive (ifthey receive two mutated alleles), they will never live long enough to reach a reproductive age; offspring thatare either heterozygous or homozygous dominant will survive long enough to reproduce.
Note: Because selection can lead to the elimination of certain alleles, it will be necessary tohave extra alleles (index cards) in the event of death of an offspring.
1. Follow the same procedure as the previous exercise, with one difference: If offspring is producedwith the genotype aa, this offspring will not survive; eliminate the alleles from the population. Tomaintain population size, you must produce two surviving offspring. If two alleles are eliminated,draw two new alleles from the extra cards.
2. Repeat the procedure for a total of five generations, selecting against homozygous-recessiveoffspring in each generation. Record the genotypes.
3. Combine your fifth generation results with the rest of the students' fifth generation results.
4. Use the table below to calculate the new allele frequencies after five generations of randommating.
Calculating Allele Frequencies after Five Generations
Number oflA" Alleles Present at the Fifth GenerationNumber of genotype AA x 2 = A allelesNumber of genotype Aa x 1 = A alleles
Total = A alleles
Total Number of"A" Allelesp= =Total Number of Alleles in the Population _
Number of"a" Alleles Present at the Fifth GenerationNumber of genotype aa x 2 = a allelesNumber of genotype Aa x 1 = a alleles
Total = a alleles
Total Number of"a" Allelesq==---:--:-:----:-----;:'-::-:-:--:---:----:-----:::-----:---:--=Total Number of Alleles in the Population _
Heterozygote AdvantageThe previous exercise showed how selection against homozygous-recessive individuals clearly alters
the allelic frequencies in a population. Another form of selection that operates within a gene pool isdisease. For example, a deadly form of malaria, affects homozygous-dominant individuals more severely thanheterozygous individuals. The heterozygote is therefore favored in a population.
Note: Since selection can lead to the elimination of certain alleles, it will be necessary to haveextra alleles (index cards) in the event of death of an offspring.
1. Follow the same procedure, eliminating homozygous-recessive individuals as before. In addition,if a homozygous-dominant individual is produced, flip a coin. If the result is heads, the offspringdies; if it is tails, the offspring survives.
2. Repeat the procedure for a total offive generations. Record the genotypes.
Population Genetics and Evolution page 12

3. Combine your fifth generation results with the rest of the students' fifth generation results,andcalculate the new allele frequencies.
4. Continue the procedure for five more generations, for a total of ten generations, this time startingwith the genotypes from the end of the fifth generation. Record the genotypes.
5. Combine your tenth generation results with the rest of the students' tenth generation results,andcalculate the new allele frequencies.
Analysis
1. Usethe table below to calculate the new allele frequencies after five generations of randommating.
2. Usethe table below to calculate the new allele frequencies after ten generations of randommating.
Calculating Allele Frequencies after Five Generations
Number of "A"Alleles Presentat the Fifth GenerationNumber of genotype AA x 2 = A allelesNumber of genotype Aa x 1= A alleles
Total = A alleles
Total Number of "A"Allelesp=--:------:-----:-:--:--------=Total Number of Alleles in the Population
Number of "a"Alleles Present at the Fifth GenerationNumber of genotype aa x 2 = a allelesNumber of genotype Aa x 1= a alleles
Total = a alleles
Total Number of "a"Allelesq = =----:-:-:------:-----:-~~~--:-~--:---,-- =Total Number of Alleles in the Population
Genetic DriftGenetic drift is a phenomenon where an allele is lost solely from chance instead of through selection.The
most important factor in genetic drift is population size;smaller populations have a much greater potentialfor genetic drift.
Note: Divide the class into several smaller populations; for example, if you have a class of thirtystudents, divide them into three groups often.
1. Your instructor will divide the classinto severalsmaller populations. Within your smaller popula-tion, follow the mating procedure, as in the first exercise,for a total of five generations. Recordthe genotypes.
2. Combine your group's fifth generation results with those of the other small populations andcalculate the new allele frequencies.
Population Genetics and Evolution page 13

r .
Analysis1. Use the table below to calculate the new allele frequencies after five generations of random
mating.Calculating Allele Frequencies after Five Generations
Number of "A" Alleles Present at the Fifth GenerationNumber of genotype AA x 2 = A allelesNumber of genotype Aa x 1= A alleles
Total = A alleles
Total Number of "A"Allelesp= =Total Number of Alleles in the Population _
Number of "a" Alleles Present at the Fifth GenerationNumber of genotype aa x 2 = a allelesNumber of genotype Aa xl = a alleles
Total = a alleles
Total Number of "a"Allelesq= :-~~~-~~~~~~~~~- =Total Number of Alleles in the Population _
Questions (Testing an Ideal Populationv)1. In an ideal Hardy-Welnberq population, what would be the expected values for p and q?
2. How close was your class's results to an ideal population? What factors were ignored that couldlead to a variation in allele frequency?
----~~-Questions (Selection)1. How do these new frequencies of p and q compare to the initial frequencies in the previous
exercise?
2. Has the allele freauency in the population changed? Why or why not?
3. What would happen to the frequencies of p and q if you continued this simulation through severalmore generations?
Population Genetics and Evolution page 14
Questions (Heterozygote Advantage)1. How do the p and q frequencies in the second part of the exercise compare with the frequencies
from the first and third parts?
2. Will the recessive allele ever be completely eliminated in the procedures using selection anahomozygote advantage? Why or why not?
Questions (Genetic Drift)1. What do the new allele frequencies suggest about population size as an evolutionary force?
Further Investigations1. Do an actual survey of your class and calculate the frequency of tongue rollers and non-rollers in
your class. Using this data as a predictor, do a survey of as many people in your school as possibleand see if the numbers match as predicted.
2. There are many traits that run in families that do not cause diseases. Some of these include awidows peak, achoo syndrome (sneezing when exposed to bright light), midphanlangeal hair (hairon top of the middle segment finger) and a wide variety of other traits. Choose one or several traitsand investigate an extensive family history, building your own pedigree chart and determininghow the trait is inherited. Perhaps you can look for a trait not mentioned that some of yourbrothers or sisters have. For further information on human genetic mutations you may want to gotthe library and look up "Mendelian Inheritance in Man: Catalogs of Autosomal Dominant, Recessive,and X-linked Pheno-types" by Victor McKusick.
3. We have learned about the genetic disorder sickle-cell anemia that is caused by a recessive allele. Itis most common in people of African descent and in the United States it is slowly being eliminatedfrom the population. However, in parts of Africa, the frequency of sickle-cell anemia is not changingdue to natural selection for the heterozygous individual.ls the fact that the sickle-cell anemia allelehas not been eliminated an example of the Hardy-Weinberg principle? Explain your answer.
4. Using the information you learned in the Heredity of Human Traits section, create a pedigree foryour own family. To do so, you must be able to track the presence of a genetic disorder such as theexamples we have given previously.
5. Derive the Hardy-Weinberg formula by using the frequencies of genes in a population for thecalculations. Instead of using the symbols Rand r and their percentages for alleles, use the symbolsp (frequency of allele R)and q (the frequency of allele r). HINT: Use your knowledge to fill in thefollowing chart and expand it to a binomial equation.
Genotype
RR
Rr
Frequency
?
rr
2pq
?
Population Genetics and Evolution page 15
6. In review,the Hardy-Weinberg principle states that the proportion of alleles of any gene in apopulation with random mating will remain constant.Thinking critically, determine if it is possiblein a naturally occurring population for the Hardy-Weinberg principle to hold true. Explain youranswer
Related MaterialsWARD'Sprovides the following related materials to aid in your students learning of the concepts of
genetics and heredity.36W 7106 Population Genetics and Evolution APLab #8
Combination Multimedia Lab CD-ROMand KitGenetics and Heredity VHSPrinciples of Mendelian GeneticsPopulation Genetics and Evolution, Demo singlePopulation Genetics and Evolution, ClasssingleHeredity of Human TraitsSickle Cell Anemia Chance Inheritance Activity
36W 714019W013736W 122336W151036W151136W 121936W 2020
GlossaryAllele-One of a pair of factors for genes;each allele is provided by a parent. Alleles are located at thesame position on a set of chromosomes.
Allele Frequency-The relative abundance of an allele of a gene within a population, expressed asapercentage. Shown in the Hardy-Weinberg equation as p and q.SeeHardy-Weinberg Principle.
Charles Darwin (1809-1882)-An English naturalist who at the age of 22, traveled the world onthe ship, HMSBeagle.At the start of the journey, Darwin accepted the prevailing theory of divinecreation. However, upon encountering fossil evidence around the world, he began to change hismind. On the Galapagos Islands he found the most convincing evidence of evolution. Here he didthe most extensive work on his theory of evolution. He referred to this as"descent with modifica-tion." Darwin's ideaswere published in 1859 under the title: On the Origin of Speciesby Means ofNatural Selection.
Dominant Alleles-These are the alleles that if present will be the ones that are expressed.Whatevertrait they represent will be commonly expressed in the population.
Evolution-A change in the genetic makeup of a population or species over time.Gene-The section of a chromosome that contains coding for a trait. The information encoded inDNA isorganized into genes,which transmit information from the parent to the offspring.
Gene Flow-The movement of alleles in or out of a population.Genotype-The set of alleles in an individual.Hardy-Weinberg Principle-A mathematical equation used to show the degree of genetic changeor evolution in a population over a number of generations. p2+ 2pq + q2= 1The more common, or dominant, allele is represented by p.The rarer,or recessive,allele is repre-sented by q.Becausethere are only two alleles,p + q = 1.
Heterozygous-The condition of an individual that hasalleles with different information for a giventrait, such aseye color.
Homozygous-The condition of an individual that hasalleles with the same information for a giventrait.
Population Genetics and Evolution page 16

Inbreeding-To breed or reproduce by continual mating of individuals of the same or closely relatedstocks. In humans, this is considered any close blood relation, and in many countries is illegal ortaboo. Inbreeding over many generations can cause genetic maladies such as hemophilia.
Loci-plural of locus. A locus is the position on a chromosome occupied by a particular gene. Humangeneticists work on plotting out the 23 human chromosomes and which genes for which traits arelocated on each. Each trait has a particular locus that remains constant.
Mutation-A change in DNA of a gene or chromosome.
Natural Selection-This is one of the fundamentals of Darwin's theory of evolution. He figured thatindividuals that possess superior physical or behavioral attributes are more likely to survive thanthose that lack these qualities. By surviving they are able to pass on these favorable characteristicsand ensure the success of their offspring. This will eventually change the nature of the population.
Phenotype-The physical appearance of an individual, created by the genotype.
Population Genetics-The study of the effect of heredity on a population.
Recessive Alleles-These alleles represent the traits that are less common, but rarely disappear froma population. For a recessive allele to be expressed the organism must have received the samerecessive allele from both parents. No dominant allele can be present for that trait
Population Genetics and Evolution page 17