contents annual report.pdf · asset quality key ratios source of funds liquidity profitability...
TRANSCRIPT

CONTENTSChairman’s Letter
ManagementFinancial Highlights Evolution of Key Indicators Selected Financial Data Asset Quality Key Ratios Source of Funds Liquidity Profitability Ratios Board of DirectorsMajor Shareholders and General ManagementCorporate GovernanceExcerpts from BBAC’s Ordinary General Assembly of Shareholders
Management Discussion and AnalysisBasis of PresentationCorporate Profile Mission Statement Business Overview Corporate and Commercial Banking Retail Banking Private Banking Treasury and Capital Markets Insurance Services Information Technology Compliance Risk Management Human Resources Management Corporate Social ResponsibilityFinancial Activities and Performance Highlights Breakdown of Assets and Liabilities Asset and Liability Management Profitability and Efficiency
Auditors’ ReportIndependent Auditors’ Report Balance Sheet Statement of Comprehensive Income Statement of Changes in EquityStatement of Cash Flows Notes to the Financial Statements
NetworkBranch NetworkCorrespondent BanksSubsidiaries
2
466889
10111112131415
161818181919192021212222232626 28282930
32353637383941
104106107108

2
The struggling world economy and continued political instability in some Arab countries was countered this year with signs of a slow recovery. The banking sector in Lebanon has again proved its resilience. The sector continues to be the solid backbone, which is holding an active economic cycle, and playing a stabilizing role for the Lebanese financial sector as a whole. BBAC’s achievements for 2015 confirm once again that the strategic direction for the bank continues to deliver continued growth and solid results, which have secured the bank’s position among the top 10 in Lebanon, with active growth in emerging markets in the Arab World and beyond.
BBAC’s figures for 2015 reflected solid gains and a continuation of a long standing pattern of sustainable growth. Total assets recorded a remarkable growth of 11.60%, from LBP 8,227 billion in 2014, to reach LBP 9,181 billion in 2015. This has placed BBAC in second place among the Alpha Group banks in terms of growth in total assets. This increase in total assets is attributed to an increase in deposits, which grew by 12.68% from LBP 7,146 billion in 2014, reaching LBP 8,052 billion by the end of December 2015. The distinguished rate of growth in deposits also earned BBAC the top spot among all Alpha Group banks in that measure. BBAC’s consolidated loans and advances to customers reached LBP 2,473 billion, a growth rate of 11.78% from 2014 LBP 2,212 billion, earning the bank the third place among the Alpha Group banks in regards to growth of total loans.
The outstanding financial results went hand in hand with advancements in technology and banking practices. BBAC expanded its presence into the digital world throughout the year. Notable in 2015, is the successful completion by the IT department of the foundation of a new banking technology strategy, and upgrade to the core banking system to the most cutting edge version. These advancements provide customers, individuals and corporates, with mobile banking and digital payment platforms, which will allow customers to execute a variety of transactions via their smart phones. These digital platforms have been fortified with robust security systems that ensure layers of added safety measures.
BBAC has always been vigilant about the safety and the reputation of its stakeholders. It has constantly maintained a sustained growth strategy that accounts for the nature of its clients and their activities. The bank has even before
the onset of advanced compliance and the regulatory safeguards of the international financial system, set very high standards for insuring the integrity of its transactions and those of its clients. The adoption of the AML (Anti-Money-Laundering) Lebanese Law was a welcome development in protecting the Lebanese banking industry and mitigating banking risk as well as credit risk.
Furthermore, BBAC is equipping departments with tools and software to maintain the highest levels of compliance. These developments are aimed to continuously improve by regularly conducting compliance awareness seminars to train staff to deal with sanctions, anti-money laundering procedures, terrorism financing as well as legal compliance and FATCA.
The regulatory environment has not deterred the bank from seeking further growth. The bank’s expansion strategy continues to pave the way for additional success in the future. BBAC increased its branch network in Lebanon to reach 39 branches, with the latest opening in Hazmieh, an up and coming suburb of Beirut.
In addition to its domestic network, its foreign expansion remains active and with substantial growth in returns on investment; BBAC commenced its operations via a new branch in Sulaymaniyah, and will officially launch its complete operation there in 2016. This branch will add to its growing network in Iraq, which now includes a branch in Erbil, north of Iraq, and another one in the capital, Baghdad.
International growth continues to be a main driver for the future positioning of the bank. Thus, in addition to its branch in Limassol-Cyprus and its representative office in Abu Dhabi-UAE, BBAC opened another representative office in Lagos-Nigeria and looks forward to diversifying its revenue base and risk profile, by focusing on new opportunities abroad, waiting for the right chance to expand and ensuring its presence in promising emerging markets.
Faced with complex conditions, the bank continues to shoulder its social responsibilities and continuously tailor its social and development role by heavily investing in Corporate Social Responsibility through supporting community development, preserving the environment, promoting arts, culture and education and contributing to charitable organizations.
Our progress would not be possible without the unstinting support of our stakeholders. We would particularly like to thank our clients for their ongoing loyalty and confidence, our employees for their efforts led by great experience and our cohesive management team for their continuous professionalism, dedication and commitment to their work.
As 2015 lends itself to a promising 2016, our confidence in the strategic direction of the bank is delivering returns that are recognizable by our clients, our staff, and results. BBAC is constantly evolving its internal structures, adopting new technologies, and branching out into new countries; a track record that continues to fortify the bank’s solid standing among its peers in Lebanon. As a an Alpha Group bank, we have performed in 2015 on top of that group, and in 2016, we look forward to delivering results that will prove BBAC’s commitment to be ‘Your Caring Bank’.
Sincerely,
Ghassan T. AssafChairman and General Manager

4

6
Financial Highlights
Evolution of Key Indicators (LBP billion)
Assets
Loans
Deposits
Shareholders’ Equity
Net Profit
425493 513 500
565 588 655740
9061,003
1,2811,592
454
1,7662,015
2,212 2,473
1،8052،024
2،2212،457 2،796 3،087
3،2883،419
3،7074،332
4،990
5،514 5،763
6,4646,785 7,146 8,052
2,1322,340
2,535 2,8333,201
3,4603,818
4,0544,398
4,8885,617
6,190 6,507
7,3707,699
8,2279,181
1999 2000 2001 2002 2003 2004 2005 2006 2007 2008 2009 2010 2011 2012 2013 2014 2015
1999 2000 2001 2002 2003 2004 2005 2006 2007 2008 2009 2010 2011 2012 2013 2014 2015
1999 2000 2001 2002 2003 2004 2005 2006 2007 2008 2009 2010 2011 2012 2013 2014 2015
11.6
17.9
17.4
15.7
15.1
22.2
26.4
25.6
32.0
38.1
54.0
58.0
58.1
65.0
65.4
127
141
153
161
170
187
204
300
324
358
426
465
481
576
624721
1999 2000 2001 2002 2003 2004 2005 2006 2007 2008 2009 2010 2011 2012 2013 2014 2015
1999 2000 2001 2002 2003 2004 2005 2006 2007 2008 2009 2010 2011 2012 2013 2014 2015
673
67.1
Total Assets
Loans to Customers and Related Parties
Deposits from Customers and Related Parties
67.26
Shareholders’ Equity
Net Profit

8
Key RatiosLiquidity Ratios (%) 2015 2014Net LBP Liquidity 87.61% 87.48%
Net FC (Foreign Currency) Liquidity 69.51% 69.80%
Net Liquidity (Total) 76.87% 76.90%
Loans / Deposits (LBP) 20.44% 21.17%
Loans / Deposits (FC) 37.74% 37.52%
Loans / Deposits (Total) 30.71% 30.96%
Liquid Assets / Total Assets 70.54% 70.24%
Asset Quality Ratios1 (%) 2015 2014Gross Doubtful and Bad Loans / Gross Loans 4.37% 4.17%
Gross Non-Performing Loans / Gross Loans 4.56% 4.75%
Provisions for Doubtful and Bad Loans / Gross Doubtful and Bad Loans 79.11% 86.36%
Provisions for Loans / Gross Loans 4.75% 5.03%
Net Doubtful and Bad loans/ Total Assets 0.26% 0.16%
Net Non-Performing Loans / Total Assets 0.30% 0.30%
Capital Adequacy Ratios (%) 2015 2014Capital Adequacy Ratio According to Basel II 13.59% 13.93%
Profitability 2015 2014Average Assets 8,703,691 7,962,942
Average Equity 696,993 648,396
Return on Average Assets ROAA after Tax (%) 0.77% 0.84%
Return on Average Equity ROAE after Tax (%) 9.65% 10.35%Number of Common Shares Outstanding (million) 144 144Number of Preferred Shares “B” Outstanding (million) 8 8
Earnings per Common Share (EPS) in LBP2 467 466
Earnings per Common Share (EPS) in LBP3 408 407
Dividends per Common Share (DPS) in LBP4 70 70
Dividends per Preferred Share “B” in LBP 1,055 1,055
Dividends Payout Ratio 27.54% 27.60%
Retention Ratio 72.46% 72.40%
Book Value per Common Share in LBP5 4,170 3,834
Management Efficiency Ratios (%) 2015 2014Interest Paid / Interest Received 70.96% 68.91%
Net Commissions / Income6 19.75% 18.13%
Cost / Income6 56.88% 55.89%
Cost per Average Branch (LBP million) 2,568 2,511
1 Non-accrual interest is included in non-performing loans; unrealized interest is included in provisions2 Before allocation of any dividends3 After the allocation of dividends on Preferred Shares4 An interest payment of LBP 1.4 million was made on Cash Contribution for the year 20155 Before distribution of dividends6 Income before “Operating Expenses” and “Taxes”
Selected Financial Data(LBP million) Growth
2015 2014 2015-2014Total Assets 9,180,741 8,226,641 11.60 %Total Loans 2,472,772 2,212,239 11.78%Total Deposits ¹ 8,051,972 7,145,699 12.68%Net Liquid Assets ² 6,189,585 5,494,909 12.64%Shareholders’ Equity 721,299 672,687 7.23%Net Profit 67,264 67,108 0.23%
1 Exclude financial liabilities held at fair value through profit or loss (FVTPL)2 “Liquid assets” less “Deposits from banks and financial institutions”
Loan Quality: Loans and Advances by BDL Classification
(LBP million) Growth2015 2014 2015-2014
Net Regular Loans (1) 2,445,431 2,187,417 11.80% Add Collective Impairment on Loans and Advances 32,154 31,440 2.27%
Gross Regular Loans (2) 2,477,585 2,218,857 11.66%Net Substandard Loans (3) 3,635 11,579 -68.61% Add Unrealized Interest 1,304 1,980 -34.14%
Gross Substandard Loans (4) 4,939 13,559 -63.57%Net Doubtful and Bad Loans (5) 23,706 13,243 79.01% Add Unrealized Interest 36,492 31,220 16.89% Add Provisions 53,286 52,649 1.21%Gross Doubtful and Bad Loans (6) 113,484 97,112 16.86%Net Non-Performing Loans (3+5) 27,341 24,822 10.15%Net Loans 2,472,772 2,212,239 11.78%Gross Loans 2,596,008 2,329,528 11.44%Net Non-Performing to Gross Loans (3+5)/(2+4+6) 1.05% 1.07% -0.01 %
Asset Quality
Net regular loans in 2015 grew by 11.80% compared with a 9.56% growth in 2014, ranking BBAC the third bank among Lebanese Alpha Group banks in terms of loan growth.
The Bank’s net substandard loans decreased by 68.81% and net doubtful and bad loans increased by 79.01% in 2015 in comparison with -29.50% and 443.41% in 2014, respectively, resulting in a growth of 10.15% in net non-performing loans compared with 31.61% in 2014. The ratio of gross non-performing loans to gross loans decreased from 4.75% in 2014 to 4.56% in 2015.
Gross loans recorded a growth of 11.44% in 2015, largely driven by 11.66% growth in gross regular loans which resulted in an improvement in loan portfolio quality as shown in a decrease in net non-performing to gross loans ratio from 1.07% to 1.05% in 2015.

10
Sources of Funds
The largest and main source of funds for commercial banks so far is customers’ deposits. The Bank’s deposits showed a substantial growth of 12.68% compared with 5.32% only in 2014, ranking BBAC first among Lebanese Alpha Group banks (banks with deposits over USD 2 Billion). This growth is fundamentally driven by term deposits, which constitute 73.37% of total deposits growing by 18.58% from their 2014 balance. As to their maturity, 96.95% of deposits are current with 89.53% mature in a period ranging from 1 to 12 months showing a decrease from 2014 ratios of 97.29% and 92.72%, respectively. 40.66% of deposits are denominated in LBP and the rest (59.34%) in foreign currencies without any significant changes from 2014. There was a substantial increase in the Bank’s share of Alpha Group banks’ deposits from 2.94% in 2014 to 3.17% in 2015.
Shareholders’ equity has shown a compound annual growth rate of 9.18% over a 5-year period (2010-2015). As of 2015, it has increased from LBP 672,687 million to LBP 721,299 million reaching a growth of 7.23%. This growth in equity was largely the result of an internally generated organic growth of 13.01% in retained earnings, which constitute 36.50% of total equity. An equal growth of 7.23% was achieved in total regulatory capital also driven by retained earnings. As a result of the growth in equity, book value per common share increased from LBP 3,834 to LBP 4,170 in 2015.
Breakdown of Customers’ Deposits by Type and Currency Mix
Customers’ Deposits by Type and Currency Mix(LBP million) Structure % Change
2015-20142015 2014 2015 2014Term Deposits 5,907,565 4,981,860 73.37% 69.72% 18.58%
Current / Settlement Accounts 1,389,272 1,325,025 17.25% 18.54% 4.85%
Deposits Held as Collateral 537,368 687,946 6.67% 9.63% -21.89%
Deposits from Related Parties 183,421 123,845 2.28% 1.73% 48.11%
Accrued Interest Payable 34,346 27,023 0.43% 0.38% 27.10%
Total 8,051,972 7,145,699 100% 100% 12.68%Of which current 7,806,144 6,952,072 - - -
Of which non-current 245,828 193,627 - - -
Denominated as follow LBP 40.66% 40.15% - - -
Foreign Currencies 59.34% 59.85% - - -
Liquidity
Liquidity represents the bank’s ability to fulfill its financial obligations and liabilities when they fall due, and is a core determinant of its success. To mitigate and manage liquidity risk, the bank must hold a diversified portfolio of cash and high quality liquid securities, such as cash and balances with Central Banks, LBP and foreign currency denominated Treasury Bills and short term placements with banks.
BBAC’s ability to maintain high liquidity levels, to minimize risk and to ensure high quality of assets has been at the center of liquidity management and core objectives of the Bank. The Bank has successfully recorded ample liquidity in 2015 where overall liquidity stood at 76.87% compared with 76.90% in 2014. As such, Lebanese pound liquidity ratio (including Lebanese government Treasury Bills) is at 87.61% in 2015 compared with 87.48% in 2014, while foreign currency liquidity recorded 69.51% in 2015 compared with 69.80% in 2014.
Total liquid assets grew by 12.07% from their 2014 balances compared with a growth of 5.39% in 2014. The largest share of liquid assets goes to Investment Securities, which constitute 57.28% of total liquid assets followed by cash with Central Banks for a 22.97% share. Net liquid assets increased by 12.64% in 2015 compared with 3.67% in 2014, but liquidity ratio decreased slightly from 2014 (76.87% vs. 76.90%) due to an increase of 12.68% in customers’ deposits.
70.54% of total assets are liquid assets in 2015 compared with 70.24% in 2014. BBAC has a stronger liquidity position in foreign currency since 55% of its liquid assets are maintained in foreign currency and 45% in LBP.
Loans to deposits ratio slightly decreased from 30.96% in 2014 to 30.71% in 2015 due to the fact that deposits grew at 12.68% in 2015 against a growth of 11.78% in total loans. The Bank’s liquid assets to deposits ratio is 80.42% affirming its strong liquidity position.
Profitability Ratios
Net profit showed a compound annual growth rate of 3.01% from 2010 till 2015; however, it did not show any significant growth in 2015. The growth in net operating income in 2015 declined to 2.94% from a growth of 6.35% in 2014 due to the buildup of credit impairment charges. On the other hand, operating expenses grew by only 4.76% in 2015 compared with 9.15% in 2014 due to a decline in personnel expenses.
Return on average assets (ROAA) in 2015 was 0.77% compared with 0.84% in 2014. This decrease was due to the growth of 9.30% in average assets. As to Return on average equity (ROAE), it also decreased from 10.35% in 2014 to 9.65% in 2015 as a result of a 7.50% increase in average equity against an insignificant growth in net profit.
Dividend payout ratio (27.54%) and retention ratio (72.46%) did not show any significant changes from 2014 levels (27.60% and 72.40% respectively), due to the almost stable net profit for the year, knowing that the amount of dividend paid did not change in 2015.
Term deposits
Current/settlement accounts
Deposits held as collateral
Deposits from related parties
Accrued interest payable

12
Major Shareholders and General ManagementMajor ShareholdersAssaf Family 54.453%Fransabank s.a.l. 37.068%Other Shareholders 8.479%
SolicitorsMe. Chafic Khalaf Me. Paul MorcosMe. Amine Rizk Me. Mazen TajeddineMe. Ramzi Haykal Me. Bassam DayeMe. Assaad Najm Me. Adnan Jisr
AuditorsPricewaterhouseCoopers - KPMG
Executive Advisors to the ChairmanMr. Georges Mirza Credit AffairsMr. Omar Saab Business Development Dr. Amalia Azoury Economic Affairs
General ManagementMr. Nadim Hamadeh Assistant General Manager - BankingMr. Chawki Badr Assistant General Manager - External ExpansionMr. Marwan Abou Assi Assistant General Manager - Finance and AdministrationMrs. Lina Makarem Assistant General Manager - TreasuryMr. Anwar Abou Ghaida Accounting and Financial Control DivisionMr. Raja Makarem Project Finance and SME Division Mr. Camille Moujaes Branch Network DivisionMs. Wafaa Abed Group Internal AuditMr. Bachir Yakzan Risk Management Department – CROMs. Najwa Kaedbey Human Resources DepartmentMr. Ali Al Danaf Recovery and Restructuring DepartmentMr. Marwan Abou Assi Compliance DepartmentMr. Salim Karam Insurance UnitMr. Francois Balaa Information Technology DepartmentMrs. Sabah Khatounian Administration DepartmentMr. Tarek Bilal Marketing DepartmentMs. Nahed Zeid Cards and Electronic Banking DepartmentMr. Ibrahim Itani Private Banking UnitMrs. Hilda Ashkar Operations DepartmentMr. Georges Moarbes SME Credit DepartmentMr. Elias Moukayed Branch Management and Support Department Mr. Ayman Fatayri Corporate Credit Department Mr. Maher Rahhal Subsidized and Kafalat Loans DepartmentMr. Salah Saab Market Intelligence DepartmentMrs. Joyce Abdelnour Consumer Credit DepartmentMr. Fadi Barakeh Organization and Methods DepartmentMs. Nawal Aziz Project Finance DepartmentMr. Wissam Al Aridi Project Management UnitMrs. Hiam Halabi Management Information System UnitMr. Labib Abou Dehn Customers’ Rights Protection Unit
Board of Directors
Chairman - General ManagerSheikh Ghassan T. Assaf
Vice ChairmanJudge Abbas Al Halabi
Mr. Walid T. Assaf Member
Mr. Ali Assaf Member
Mr. Marc Maamary Member
Mr. Ali Ghandour Member
Assaf Holding Company S.A.L. Member
Mr. Farouk Mahfouz Member
Mr. Michel Tueni Member
Me. Amine Rizk Secretary of the Board

14
Excerpts from BBAC’s Ordinary General Assembly of Shareholders
Held on May 23, 2016
Resolution No. 1
The Ordinary General Assembly of BBAC Shareholders approved the activities, accounts, balance sheet and the profit and loss statements for the year ending December 31, 2015.
Resolution No. 2
The Ordinary General Assembly of BBAC Shareholders resolved the appropriation of the profits for the year 2015 as follows:
(LBP thousands) 2015Profits for the Year 2015 67,265,419Less: Appropriation of Reserves for “General Banking Risks” 9,000,000
Appropriation of Reserves for “Legal Reserves” 6,726,542 Appropriation of Reserves for “Property in Settlement of Debt” 1,224,794 Appropriation of Reserves for “Retail Portfolio” 1,354,728
Unrealised Gain on Financial Instruments Held at Fair Value through Profit or Loss 4,628,017Profits after Allocations 44,331,338Add: Retained Earnings - December 2015 218,939,744Total Retained Earnings - December 2015 263,271,082Less: Dividends on Preferred Shares B 8,442,000 Dividends on Common Shares 10,080,000 Interest on Cash Contribution 1,405Retained Earnings Carried Forward 244,747,677
Corporate Governance
BBAC believes in the importance of sound Corporate Governance that guides the Bank forward while promoting the highest standards of conduct. Corporate Governance is a set of laws, regulations, and policies that define the functions of the Board of Directors (BOD) and the top management of the Bank. These policies also govern the relationship between the BOD, senior management, shareholders, and other related parties.
BBAC recognizes that the key to its long-term success is to sustain public trust in the Bank which is accomplished through serving the Bank’s clients and communities in the best way with the right values. Holding the highest standards of corporate governance and ethical conduct requires a set of strong corporate governance practices that allocate rights and responsibilities among the Bank’s stockholders, BOD, and management in a manner that enhances shareholder value.
The Bank’s management’s processes, structures, and policies help ensure compliance with laws and regulations and provide clear lines of responsibility, decision-making and accountability. Accordingly, corporate governance practices are designed not just to satisfy regulatory requirements, but also to provide effective oversight and management of the Bank as a trustee for all stakeholders.
BBAC builds and protects its culture by aggressively promoting its core values and Code of Conduct to employees. Moreover, the Bank’s current organizational structure aims to divide the different functions and responsibilities between the BOD, Executive Management, Operating Management, Board Committees, and Management Committees, which are involved in decision making; by setting clear grounds for control, separation of authorities, job specialization, responsibility and accountability. These functions ensure that the values of the clients and shareholders are preserved and that the resources are utilized in the most effective and appropriate manner.

16

18
The extent of the Bank’s success in attaining this objective is reflected positively in the measure of its growth.Business Overview
BBAC offers clients a wide range of financial products and services that varies from the traditional banking activities to the most recent financially engineered products. These are provided through:
Corporate and Commercial Banking
Fulfilling its role in stimulating the growth of the Lebanese economy, BBAC continuously seeks to provide existing and potential participants in the economy with optimum solutions for their business needs. By supporting and funding clients’ business plans, whether they are business-oriented individuals or organizations, BBAC is able to capitalize on development opportunities.
BBAC continued to expand its credit portfolio benefiting from its high liquidity and its excess in deposits. In this regard, 2015 witnessed an increase in Commercial and Corporate portfolio, mainly due to the extension of new loans to corporate clients as well as to small and medium enterprises (SMEs), whilst preserving the conservative credit practices of the Bank.
Despite the continuing economic challenges and political conditions prevailing in several key markets that triggered a slowdown in new lending in some markets and a decrease of exposure in other markets, BBAC managed to sustain a solid growth of lending which was the outcome of a strategy followed by the Corporate and Commercial Banking department to maintain a strong relationship with customers during those challenging times and provide them with suitable solutions across the Bank’s network.
In fulfilling the diverse needs of its clients, BBAC offers short and long term loans as well as a variety of fixed and variable repayment loans. In addition, the range of facilities at BBAC extends from simple lines of credit and term loans to the more advanced forms of financing. These products are granted to entities in numerous industries, such as real estate development, construction, manufacturing, trading, among many others.
Moreover, as a way to support SMEs, BBAC presents various types of specialized loans, such as Kafalat loans and Subsidized loans for non-costly financing. These loans benefit from interest rate subsidies and expand to industries, such as tourism and agriculture, which are considered key players in increasing Lebanon’s GDP and providing job opportunities to the population.
BBAC extended new loans covering a variety of sectors including fertilizer production, retail and commercial development, construction and contracting, real estate, and is currently processing to mandate and participate in several syndicated loans to finance oil drill and gas projects.
High expertise, integrity and quality of service represent the basis of the Corporate and Commercial Banking department’s philosophy, whilst strictly adhering to the regulatory environment and internal policies governing project finance activities.
Retail Banking
At Retail Banking, BBAC offers a wide variety of innovative products and services, including retail loans, credit cards, mortgages and savings and term deposit accounts to serve the various financial needs of customers and help them reach their goals and aspirations.
BBAC is committed to building long-term relationships with its customers, and aims to making daily banking and financial decisions easier and creating the best experience for its customers across all touch points. In 2015, BBAC continued to pursue these goals through geographic expansion and digital solutions.
Basis of Presentation
The discussion and analysis that follows have been prepared by the management and are based on the audited financial statements of the Bank as at December 31, 2015.
The Bank’s financial statements have been prepared in accordance with International Financial Reporting Standards (IFRS).
This analysis highlights the performance of BBAC in 2015.
Any reference to “BBAC” or the “Bank” stands for BBAC s.a.l. and its international branches and any reference to “BDL” signifies the Central Bank of Lebanon. Any reference to “Central Banks” implies BDL as well as the Central Banks, in countries where BBAC’s branches operate.
Unless otherwise indicated, all figures are expressed in Lebanese Pounds, whereas all US Dollar amounts have been translated at the closing exchange rate which is published by BDL at the relevant dates, which remained at LBP 1507.50 / USD.
Corporate Profile
BBAC s.a.l was established as a commercial bank in 1956 under the name of “Bank of Beirut and the Arab Countries” by a group of prominent investors headed by Sheikh Toufic Assaf, Mr. Nashaat Sheiklard and Mr. Jamal Shehaiber. Currently, 54.453 % of the Bank’s shares are owned by the Assaf family, 37.068% are owned by Fransabank s.a.l. and the remaining 8.479 % are held by other shareholders.
BBAC offers a broad range of commercial and personal financial services including Retail Banking, Corporate and Commercial Banking, Trade Finance, Private Banking, Treasury and Capital Markets, and Insurance products.
Throughout the years, the Bank followed an expansion strategy that focuses mainly on penetrating the local as well as the international markets. BBAC is rigorously following this strategy, where the most recent local branch was opened in Hazmieh area, and other branches will be inaugurated in the near future. Furthermore, various existing branches were being renovated or even relocated, with the specific aim of enhancing customer convenience and better catering to the clients’ needs along with reorganizing the branches inside out, in order to convey the Bank’s image in accordance with its brand strategy.
As a part of its continued growth strategy, BBAC is constantly seeking opportunities to establish new branches in targeted areas in Lebanon, as well as in key regional markets, in addition to its existing three international branches; one in Limassol-Cyprus, two in Iraq; Erbil and Baghdad and a representative office in Abu Dhabi, UAE.
Mission Statement
Integrity BBAC believes that a sound banking relationship is built on integrity and trust. Trust is achieved by conducting clients’ personal and business transactions efficiently and with strict confidentiality.
Service
BBAC constantly strives to recognize and satisfy evolving customers’ needs by developing services, products and solutions tailored to meet their requirements.
Growth
BBAC is committed to being a leading participant in the economic development of the community where it is present.

20
focusing particularly on the needs of the young demographic.Private Banking
The Private Banking unit offers personal financial and investment services to the Bank’s high-net-worth clients through a dedicated professional team. The timely services are rendered with confidentiality and trust and include trade execution, portfolio administration and advice on investment opportunities and market insights.
The Private Banking team performs global market research to identify new active markets in financial services; in addition to monitoring money and capital markets and carrying out market studies and technical analysis. The Private Banking unit offers a wide variety of trading services in several simple and sophisticated financial products such as derivatives, futures, options, equities, and commodities.
The Private Banking unit has a wide client base and it is continuously targeting for high-net-worth individuals by promoting the Bank’s financial products and wealth management services, which allows the Bank to constantly improve its profitability and financial stability.
Treasury and Capital Markets
The main function of the Treasury department is to manage the Bank’s liquidity and cash position by evaluating the daily liquidity report and interest rate fluctuations. Through its various sections, the Treasury department engages in several foreign exchange, money market and capital market operations guided by the regulatory authorities’ rules and regulations and the policies and procedures set by concerned committees such as the Board of Directors and Asset Liability Management Committee (ALCO).
When conducting its transactions, the Treasury department aims at maximizing the Bank’s return and profit by seeking suitable market opportunities and investments given the Bank’s risk exposure limits.
The Treasury department manages a diversified investment portfolio with various asset classes including equities and fixed income securities, aiming at investing excess liquidity to generate high returns in compliance with ALCO and the Board of Directors’ decisions. The Treasury department also identifies placements and borrowing needs in line with the Bank’s policies in order to maintain a strong liquidity position.
The Treasury department performs its trading and investment activities through Beirut Stock Exchange, regional and international exchanges and major correspondent banks. It provides the Bank’s clients with round-the-clock services in FX spots, forwards and financial instruments, among others. The transactions are executed in a fast and accurate manner ensuring high quality customer service.
Insurance Services
BBAC differentiates itself by providing its clients with ultimate customer care and a broad portfolio of products and services that address the entire range of its clients’ financial well-being objectives. Accordingly, the Bank offers insurance services as well as savings plans throughout its branch network in partnership with insurers known for their solidity, security, and expertise.
In collaboration with The Capital Insurance and Reinsurance Co. s.a.l., a subsidiary of BBAC, the Bank offers flexible and competitive insurance products that are especially designed to satisfy all clients’ requirements in terms of premium, cover, security, and services. These products include: (1) Term Life Insurance & Personal Accidents; (2) Private Car Insurance (All Risk, TPL, Total Loss, Orange Card); (3) Cargo & Marine Insurance (Sea Freight, Air Freight, Hull & Machinery); (4) Public Liability; (5) Workmen’s Compensation (Employer’s Liability); (6) Money Insurance & Financial Risks (Cash in Safe, Cash in Transit, Fidelity Guarantee); (7) Foreign Domestic Helper Insurance (life and medical expenses covering domestic workers); (8) Home Insurance (Burglary, Fire, Neighbors, Earthquake & Allied Perils); (9) Travel Insurance;
BBAC strengthened its presence in strategic locations in Lebanon by opening a new branch in Hazmieh area. With the opening of the Hazmieh branch, the number of local branches has reached 39 with 61 ATMs distributed all over the Lebanese regions.
BBAC also launched the second generation of its Online Banking service for personal and business customers along with its new Mobile Payment and Mobile Banking services. The Bank has tailored this collection of secure electronic banking services to provide supreme comfort and satisfaction to its customers, as well as accelerate and facilitate the completion of banking operations wherever they are and at any time. BBAC has also taken every precaution necessary to ensure a climate of trust and to protect the confidentiality and the security of its customers’ financial and payment information.
In order to match the customers’ needs and preferences, BBAC recommends customized banking accounts and products to clients who wish to control their payments, save money or make future plans. These particular accounts and products are comprised of domiciliation accounts, current accounts, savings accounts and fixed term accounts, in addition to the direct debit of service bills.
BBAC also offers a number of personal loans, such as Public Sector loan, Private Sector loan, Small Business loan, Educational loans and Outlet loans to meet consumers’ different plans easily. With a strong emphasis on providing unparalleled customer service, the Bank continually invests in evolving its products and services to meet the changing needs of its customers.
Morevoer, BBAC strives to meet the increasing financial demands of the Lebanese housing sector through various mortgage offers, including the Iskan Housing loan, Military Housing loan, Internal & General Security Forces Housing loan, BDL Housing loan, Expatriate Housing Loan and BBAC’s own housing loan program. Building on a strong track record of success, an increase of 14.5% in the year 2015 was achieved in housing loan programs.
BBAC has always demonstrated its commitment to women through an array of products and services designed to cater to their banking and financial needs. Through the ‘Mother Account’, BBAC became the first bank in Lebanon to welcome and allow mothers to open an account for their children independent of the father’s legal consent. Moreover, BBAC dedicates each year the whole month of March to honor and celebrate women by presenting exclusive offers on a uniquely arranged bouquet of banking products that suit their tastes and meet their financial needs. In parallel, the Bank also offers the “Diamond Card”, which is designed exclusively for women and offered to them free of charge for life with a chance to win valuable prizes of jewelry and diamonds.
In light of the growing payment services, BBAC also offers a diversified payment cards portfolio such as the ‘Classic’, ‘Gold’ and ‘Platinum’ credit cards designed to offer financial flexibility and purchasing power relative to need and lifestyle. Other credit cards are also available, such as the ‘Euro’ card for travel enthusiasts, which help avoid the hassle of exchange rates when travelling to Europe. BBAC also provides its elite customers with the ‘Visa Infinite’ card, which offers a range of exclusive services that fall in line with their distinctive and luxurious lifestyle. For customers looking for a secure online shopping experience, BBAC offers the ‘Internet’ card, which is a charge card designed to provide a sense of confidence and flexibility when making purchases over the Internet.
Always keeping in mind the responsibility it bears as a Lebanese institution, BBAC offers its clients an opportunity to contribute to humanitarian causes through the following two credit cards: the ‘CCCL’ card that donates 1% of the purchases made to the Children’s Cancer Center of Lebanon (CCCL) to help treat children with cancer; and the ‘Kunhadi’ card that grants 1% of the purchases made to the Kunhadi Association for youth awareness on road safety.
BBAC consistently introduces seasonal offers to double the value-added benefits on its credit cards. In an effort to provide its clients with the utmost banking experience, BBAC is planning to launch a loyalty program through which the Bank will offer new benefits to all cardholders. The Bank is also working on introducing new types of cards,

22
The Compliance Function is independent from any other business or control activity of the Bank, and reports the deviations and Compliance Issues to the Bank’s Compliance Committee and Senior Management, and has an essential role in assisting the Senior Management to identify and mitigate the Compliance risks.
Moreover, and in order to ensure that the Bank is compliant with the FATCA requirements, a FATCA section was established under BBAC Compliance Department, along with its existing AML/CFT & Sanctions Section and Legal Compliance Section.
Risk Management
BBAC continues to improve its risk management practices through updating its policies and procedures, enhancing its controls, and developing its stress-testing framework. In 2015, the Bank set the roadmap for the implementation of IFRS9 standard for which new methodologies in credit risk are under development in an attempt to enhance credit risk measurement and comply to the accounting standard.
BBAC continues to set high standards of corporate governance and ethical conduct through regularly updating its Code of Corporate Governance, which clearly segregates the functions and responsibilities between the Board of Directors (BOD) and the executive management. A clear separation of functions also exists between front office, control, and support functions, to ensure proper and transparent management of the Bank.
The responsibilities of BBAC’s Risk Management Department are based on a three-line defense model, where the relationship between these functions is clearly defined and responsibilities are properly divided. The Bank regularly updates its well-structured authorization matrix to ensure its alignment with the Bank strategy and organizational changes.
Risk Organization
The Risk Management Department is an independent function headed by the Chief Risk Officer (CRO) who reports directly to the Chairman-General Manager and to the Board Risk Committee.
The department ensures that effective risk management practices and processes are in place; risk management policies are compliant with the Bank’s risk appetite and risks and limits are monitored properly. However, the department deploys risk management above and beyond compliance activities, as the chances of achieving organizational objectives while protecting enterprise value will be maximized by having a clear grasp on business risks and controls and tying risk tolerance to performance. Besides, the department is in continuous development of risk measurement techniques for different types of risks.
The role of the Board Risk Committee reflects the constructive Board engagement, which is actively and concurrently exercising judgment as to any change in the risk profile of the Bank. The committee meets regularly to discuss the different risk reports, study and approve risk management policies, risk limits and methodologies, ICAAP reports, and give directions and recommendations on risk related issues to the executive management.
Credit Risk
Credit Risk is managed through defined Credit Risk Appetite and prudent credit risk policy; both reflected by the high quality portfolio of loans and advances to the private sector.
Well-controlled, yet quick and efficient credit granting and underwriting processes with clear approval limits support the credit policy. Credit processes ensure credit exposures are regularly monitored, exposures with counterparts adhere to the set limits and credit worthiness of counterparts is continually assessed. Approval limits are monitored on an ongoing basis and are reviewed on annual basis.
The Bank uses Moody’s Risk Analyst as an internal rating system for rating its Corporate and Commercial borrowers. The internal rating system supports the Bank in assessing the quality of its portfolio and sets the plan to
(10) Engineering Risks (C.A.R., E.A.R., Machinery Breakdown, Electronic Equipment All Risks).BBAC continues to offer two investment plans; JANA Retirement Plan and NAJAH Education Plan, in partnership with Allianz SNA s.a.l. These plans are designed to give BBAC’s clients and their families’ protection and guaranteed benefits, offering the opportunity to safeguard their financial future.
Information Technology
Throughout 2015, and in-line with increasing competition and new trends in the market, the Information Technology (IT) department has developed and set up the foundation of the Bank’s technology strategy to make a real transformation in the Bank’s operations behavior. This strategy is spread across the coming years, up to 2018.
This transformation stressed on enhancing the basic and primary banking domain such as upgrading the core banking system to the latest version and providing customers, individuals and corporates, with a new Online/Mobile Banking and Payment platform.
This transformation process will provide the critical basis for the next phase of the strategic development and abilities of the Bank in conjunction with the ongoing growth of the digital channels and increasing customer demand to more convenient and self-service facilities. Consequently, the Bank has been developing technology-based products and services on regular basis in order to enhance the customer experience and appetite.
This new Online Banking platform offering a wide variety of services that are being continuously expanded and improved is nowadays empowered with a high level of security controls. These restrict the customer to provide his username and password, in addition to an SMS-based One-Time Password (OTP) sent to his mobile phone for authentication. Moreover an online real-time SMS alerting system was integrated to instantly inform customers about any or specific movements/operations on all/selected accounts or cards.
On the other hand, the IT department was highly committed to maintaining and enhancing the IT infrastructure by integrating additional layers to defend, prevent and alert security threats on all customer channels and services that are provided online, as well as improving the hardening of internal application platforms. It is worth mentioning that the IT department is committed to the business owners and to the Bank’s control functions in order to achieve effective execution of the Bank’s plans and objectives.
In order to ensure the continuity of the Bank’s business services, BBAC successfully tested the scenario of being fully operational from the Disaster Recovery Site for a whole business day, covering all the activities of essential business units in charge of keeping the Bank in operational mode. This test is repeated on yearly basis.
From a governance and regulatory compliance perspective, the Bank is implementing IT Governance Directives to comply with all regulatory matters requested by the Internal and External Auditors as well as the Banking Control Commission.
Compliance
The mission of the Compliance Function at BBAC is to ensure that the Bank and its subsidiaries are compliant with the local and international laws and regulations in order to protect the integrity and reputation of the Bank, avoid financial losses, protect correspondent banking relationships, and enhance its credibility towards its stakeholders.
The Compliance Function ensures that the Bank applies what is required by the Central Bank of Lebanon (BDL) specifically concerning Anti-Money Laundering (AML) and Counter Financing of Terrorism (CFT). In this respect, the Bank has implemented a Compliance Program, which comprises of the Policies and Procedures related to AML/CFT and Sanctions, Legal Compliance, and FATCA; in addition, to the designated Compliance Officers who are required to be certified in AML through the Certified Anti-Money Laundering Specialists (CAMS) certification as per a BDL Directive. The Compliance Program is subject to regular independent reviews by the Bank’s Internal Auditors, External Auditors, and FIU (SIC).

24
Information security monitoring is being performed continuously on a daily basis, along with security review and hardening for the IT infrastructure, additionally to all necessary security testing for all applications supporting the launching of its new e-services.
To preserve the high quality of service to its customer and ensure the continuity of its business operations, the Bank has established a disaster recovery site, along with a detailed business continuity plan that is tested regularly. The Bank has also drafted an evacuation procedure, which was tested through fire drills conducted to ensure the safety of its personnel.
Other Risks
The Bank always monitors its exposure to other types of risks, and takes the necessary measures to properly mitigate them. In fact, all material risks from concentration, legal, compliance and others are subject to routine and stringent process of identification, assessment and quantification where possible, and as a result, proper controls are added to ensure optimum mitigation of these risks.
Internal Capital Adequacy Assessment Process
BBAC strictly complies with local regulatory requirements, as well as Basel guidelines. The Bank addresses Pillar 1 of Basel II by measuring credit risk and market risk using the standardized approaches, and operational risk using the basic indicator approach. The Bank also addresses Pillar 2 of Basel II by developing and maintaining a comprehensive model for the Internal Capital Adequacy Assessment Process (ICAAP).
The Bank benefits from the ICAAP to assess the adequacy of its capital on the basis of an evaluation of its risk profile. A set of stress tests applied to ensure the adequacy of the capital base in stressful situations complements this process. This makes it an integral part of the capital planning process.
Capital Adequacy
The Bank aims to maintain a strong capital base that will ensure the adequate level of capital needed to support its growth strategies, while complying with regulatory requirements.
By the end of 2015, the three capital adequacy ratios were well above the regulatory requirements set by Banque du Liban circular No. 44. Total Capital Adequacy Ratio reached 13.59%, Tier 1 ratio reached 13.38% and Common Equity Tier 1 constitutes the bulk of this capital with a CET1 ratio of 10.92%.
Capital Funds as per Basel III (LBP million)As of December 31 2015 2014Net Common Equity Tier One Capital 535,467 490,518
Net Tier One Capital 656,331 611,382
Total Capital 666,331 621,382
Capital Adequacy Ratio as per Basel IIIAs of December 31 2015 2014Net Common Equity Tier 1/ Total Risk Weighted Assets 10.92% 11%
Net Tier 1 / Total Risk Weighted Assets 13.38% 13.71%
Total Capital/ Total Risk Weighted Assets 13.59% 13.93%
Basel III Implementation in Lebanon as per BDL circular No.442012 2013 2014 2015
Common Equity Tier 1 CAR 5% 6% 7% 8%
Tier 1 CAR 8% 8.50% 9.50% 10%
Total Capital CAR 10% 10.50% 11.50% 12%
adopt internal rating-based approaches under Basel II accord. In addition, the Bank conducts regular impairment tests assessing all credit facilities for objective evidence of impairment.
In relation to Retail Credit Risk, to assess the creditworthiness of its borrowers, the bank has an in-house developed application scorecard and is setting the floor to acquire a behavioral scorecard application, which will serve as a dynamic indicator of the credit quality of the retail exposures.
Market Risk
The Bank updated its Market Risk Management policy that details the roles and responsibilities and sets clear limits for the allowed investments. In this regard, the Bank maintains a relatively small trading portfolio (FVTPL) that does not have a substantial impact on the overall performance of the Bank or on its capital adequacy. The biggest part of the financial securities is held at amortized cost.
In its preparation for IFRS 9 standard adoption, the Bank is considering changing its business model to establish a portfolio of Fair Value through other Comprehensive Income (FVTOCI) securities.
Liquidity Risk
Liquidity Risk Management is implemented through the Liquidity Risk policy, which sets internal liquidity risk limits and early warning indicators, in addition to a Contingency Funding Plan.
The Bank maintains a high level of liquidity reflected by internal ratios that considerably exceed the regulatory minimum set by the local regulations. The Bank has also adopted Liquidity Coverage Ratio and Net Stable Funding Ratio that were introduced by Basel III, yet while applying major haircuts on High Quality Liquid Assets. Both ratios are well above the minimum requirements.
Interest Rate Risk in the Banking Book
Interest Rate Risk in the Banking Book is managed through limits for the impact on the Net Interest Income and the Economic Value of the Equities. The impact of changes in market on Interest Rate Risk in the Banking Book is captured by stress tests, which are carried out on a regular basis.
The Bank is currently in the process of acquiring an Asset and Liability Management tool to generate and monitor interest rate in the banking book.
Operational Risk
The Operational Risk Section conducts risk and control assessments on all operational units at the Bank. It maintains a detailed Loss Incidents database that is supported by well-applied event capturing procedures and continuous awareness sessions. Key risk indicators are being defined for key risks identified. Thorough operational risk assessments are being done on all new products applied by the Bank before launching them. Action plans to enhance controls and propose risk mitigants are initiated by certain incidents, KRIs or risk and control assessments.
During 2015, the Operational Risk department embarked in a vendor selection process for the implementation of Operational Risk Management software. The new software is set to be implemented in 2016.
Information Security and Business Continuity
The Bank is continuously enhancing its management information systems and information security systems by investing in new state-of the art solutions that serve in adopting advanced risk management methodologies and help in establishing a more controlled environment. Necessary IT measures are also taken to keep improving and refining the quality of data. Strategically, the Bank is following the ISO27001 international standard as an Information Security Management System and practicing it in its day-to-day business. Security Policies and Procedures have been updated, and comprehensive IT Risk assessments have been conducted along with physical security visits and reporting to all local and foreign branches.

26
The major exposure of the Bank is the credit risk, being 90.5% of total risk weighted assets. The major component of credit risk weighted assets bear the sovereign risk in the form of Central Bank Placements, Certificates of Deposits and Eurobonds issued by the Lebanese government. They constitute 32.7% of credit risk weighted assets. The corporate portfolio represents 15.2% and the remaining credit portfolio, which includes SME, Retail, Housing and Claims Secured by Commercial Real Estate, represents 30.4%.
Risk Weighted Assets (LBP million)As of December 31 2015 % of total RWA * 2014 % of total RWA Credit Risk 4,439,849 90.5% 4,070,507 91.25%
Market Risk 151,593 3.1% 86,860 1.95%
Operational Risk 313,132 6.4% 303,002 6.8%
Total Risk Weighted Assets 4,904,574 100% 4,460,368 100%
*RWA: Risk Weighted Assets
Human Resources Management
By the end of 2015, BBAC had a total workforce of 823 employees; 50% of which falling under the age of 40 years and 75% of which are university degree holders.
The gender distribution was similar to 2014 with Males constituting 57% of the staff and Females 43% of the total staff population.
At BBAC, we are very keen on providing equal career and growth opportunities for all employees regardless of gender and this is clearly reflected in the high percentage of females currently occupying managerial positions at the Bank.
BBAC has always been committed to developing its workforce and encouraging its employees to evolve both on a professional and personal level by offering them the financial support needed to pursue post graduate studies or certifications.
Throughout 2015, BBAC took part in the annual job fairs of major universities such as the American University of Beirut (AUB), Lebanese American University (LAU), École Supérieure des Affaires (ESA), Sagesse University and Modern University for Business and Science (MUBS), in an effort to continuously connect with graduating students and attract potential talent for various positions.
BBAC also offered summer internships at its different branches during which interns were given the opportunity to learn about the various banking operations and activities offered by the Bank.
Corporate Social Responsibility
Since its inception in 1956, BBAC has been committed to serving the financial needs of its customers, while still upholding the highest ethical standards, and remaining supportive and engaged in local communities. As one of the leading banks in Lebanon, BBAC is cognizant that a responsible approach to business is a decisive factor in determining the long-term viability and success of the Bank. For this reason, BBAC’s dedication to sustaining a sound financial standing and performance, providing the best banking solutions to its customers and practicing responsible employment comes in concurrence with a commitment to preserve the common interests of all its stakeholders through a best practice corporate governance framework that sets the tone and provides the foundation for all its banking and Corporate Social Responsibility (CSR) activities.
For BBAC, CSR is not a choice; it is a central business need. The Bank believes that its core responsibility as a corporation goes beyond having a purely financial impact and must also have a social impact. The two go hand in hand because it is only by delivering social and economic value today that the Bank can create long-term sustainable benefits for tomorrow. Over the course of almost 60 years, BBAC has consistently enhanced its ethical standards and has balanced social and economic imperatives to address the concerns and expectations of all its stakeholders. Today, it is advancing on its sustainable journey by setting CSR commitments across the whole business because BBAC understands that it is only through its own exemplary actions that it can continue to prove its reputation as Lebanon’s ‘Caring Bank’.
As part of its community development and strategic philanthropy efforts, BBAC actively engages in a range of well-selected and tailored CSR initiatives. Among some of its most prominent areas of engagement are health and the environment, economic affairs, humanitarian and social issues in addition to contributions in the arenas of culture and arts, sports, education and youth programs.
In addition to having a positive impact in the communities it serves through a spectrum of donations and sponsorships, BBAC relies on the valuable volunteering and fundraising efforts of its employees. It also engages in various types of partnerships with leading Lebanese non-governmental organizations (NGOs) and initiatives to maximize its reach and impact on the country’s most vulnerable and disadvantaged community groups.
In another dimension, BBAC aims to contribute to economic growth and revitalization through varied and multiple contributions and targeted initiatives that help stimulate entrepreneurship and job creation. BBAC is specifically keen on assisting small and medium-sized enterprises (SMEs), which are considered the backbone of the national economy.
In this context, BBAC continued to promote various loans that possess socially responsible attributes, thus offering borrowers favorable conditions such as interest rate subsidies. The Kafalat loan is one example, which is offered to SMEs operating throughout Lebanon in sectors such as tourism, agriculture, industry, high technology and crafts. These loans also encourage environmentally friendly investments and empower startups by committing the Bank’s investments directly into different venture capital funds. The ultimate goal is to energize Lebanon’s future economic development by creating an ecosystem that promotes investment and production in the country.
BBAC also supports the local economy in other ways, including meeting people’s financial needs at the various stages of their business and personal life cycles and helping them reach their goals, whether they want to buy a home, expand their business, pay for college or plan for retirement.
BBAC is making steady progress with regard to social and economic responsibilities; however, it still has much work ahead before making sustainability a mainstream component of its business. Its continued growth and sustainability journey is sure to present challenges as well as opportunities especially amid the still-difficult economic, social, environmental and political climate facing Lebanon. But whatever lies ahead, BBAC’s commitment to responsible banking and its caring nature for the community will remain solid. That’s BBAC’s responsibility, that’s its promise and the mission that it inspires it to succeed.
Banking Operations, E-Banking & International Banking
Credit
Finance, Audit, Accounting, Economics & Insurance, and ABL (DESB & DSGB)
Risk Management
Management, Behavior, Marketing, HR & Procedures & Restructuring
Legal and Fiscal
Information Technology
Languages
Secretariat/Filing/Archiving/Training Center Meetings/Knowledge Evaluation
Distribution of Training Hours According to Training Subjects for 2014
2%
44%
2%
Secretariat/Filing/Archiving/Training Center Meetings/
Knowledge Evaluation
Finace, Audit,Accounting, Economics& Insurance, and ABL
(DESB & DSGB)
LanguagesBanking Operations,
E Banking & International Banking
Credit
19%
4%
12%
10%
Information Technoogy
Legal and Fiscal
Risk Management2%
5%
Management, Behavior,Marketing,
HR and Procedures &Restructuring

28
Financial Activities and Performance Highlights
Overview of the Lebanese Economy and Banking Sector
During 2015, Lebanon suffered from continued regional uncertainties and disturbances on several levels. The country is widely affected by unfavorable political, economic and social consequences of the Syrian war. The number of refugees has amounted to almost quarter of the Lebanese population, imposing a substantial burden on public spending, resources, environment and unemployment.Most of the economic indicators underperformed in 2015 compared with 2014, supporting slower economic growth with real GDP growth rate less than 1% and inflation close to zero percent in 2015. The government fiscal deficit increased to reach 7.7% of GDP. The wider deficit affected the moderate growth in gross public debt which reached LBP 105,994 billion (5.6% growth from 2014) exceeding the growth in nominal output and thus Debt to GDP ratio mounted to around 138.5% in 2015. Government revenues, including budget revenues and treasury receipts, summed up to LBP 14,435 billion in 2015 compared to LBP 16,400 billion in 2014. On the other hand, government expenditures reached LBP 20,393 billion as of December 2015 against LBP 21,032 billion in 2014. As such, total deficit increased from LBP 4,632 billion to LBP 5,958 billion in 2015.
The Lebanese banking sector maintained high liquidity levels in 2015 and remained committed to financing part of the government deficit and credit needs of the private sector, maintaining stable interest rates. Deposits of commercial banks’ customers grew by 5 % in 2015, down from 6 % in 2014, to reach USD 159 billion. The key performance metrics for the banking sector improved in 2015 in relation to the previous year with Return on average assets at 1.02 % (0.97% in 2014) and Return on equity at 11.63 % (11.32 % in 2014). Loans to deposits ratio scored 35.77% at the end of 2015 implying above benchmark liquidity levels. Total assets of commercial banks reached LBP 280,379 billion growing by 5.9% over 2014. Loans granted by commercial banks to the private sector grew by 6.5% scoring LBP 81,744 billion by year end. On the other hand, private sector deposits amounted to LBP 228,515 billion at the end of December 2015 increasing by 4.96% from 2014 figures.
Despite all the challenges and difficulties, the Lebanese banking sector remains robust and strong supported by the Central Bank which continuously issues circulars and laws to ensure compliance with the international standards and practices and to promote financial stability and well-being of the banking sector.
Breakdown of Assets and Liabilities
The Bank manages its asset base in a prudent and effective way, allocating 90.29% of its mix of assets to interest earning assets which reached a growth of 13.02% in 2015 in comparison with 6.86% in 2014. Trading and investment securities comprise 44.26% of interest earning assets growing by 6.50% from 2014 consequently contributing the most to interest income. Loans and advances to customers and related parties grew by 12.36% in 2015 taking a share of 29.40% of interest earning assets. In 2015, BBAC’s total assets share of Alpha Banks increased to 2.99% from the 2014 ratio of 2.81%.
Breakdown of Assets by Interest-Earning and Non-Interest Earning Accounts
Interest and Non-Interest Earning Assets(LBP million) Structure % Change
2015-20142015 2014 2015 2014Balances with Central Banks 1,081,022 976,998 11.77% 11.88% 10.65%
Due from Banks and Financial Institutions 1,102,553 743,778 12.01% 9.04% 48.24%
Trading and Investment Securities 3,668,671 3,444,675 39.96% 41.87% 6.50%
Loans and Advances to Customers & Related Parties 2,437,279 2,169,222 26.55% 26.37% 12.36%
Total Interest Earning Assets 8,289,525 7,334,673 90.29% 89.16% 13.02%Total Non-Interest Earning Assets 891,216 891,968 9.71% 10.84% -0.08%Total Assets 9,180,741 8,226,641 100.00% 100.00% 11.60%
Asset and Liability Management
1. Use of Funds
In 2015, BBAC’s assets grew by 11.60% with loans and advances to banks scoring the highest growth rate of 38.25% among all other asset classes. As such, its share of total assets grew by 11.24% in 2014 and by 13.93% in 2015. Investment securities made up 40.40% of total assets in 2015, compared to 42.27% in 2014, of which 93.82% are invested at amortized cost and 6.18% at fair value through profit or loss. Loans and advances to customers’ share of total assets increased slightly in 2015 to reach 26.93% compared to 26.89% in 2014.
2. Loans and Advances by Currency / Type
BBAC ranked in third place in loans and advances to customers growth among Alpha Banks in 2015. 95.44% of the Banks total gross loans are performing loans and 4.56% are non- performing loans compared to 95.25% and 4.75% in 2014, respectively. Almost 95% of loans and advances to customers in 2015 are granted in two major currencies LBP and USD. 67.58% of total loans are denominated in USD in 2015, compared with 66.25% in 2014. This increase came at the expense of LBP loans which share decreased from 28.66% in
2014Cash and balanceswith Central Banks
Loans and advances to banks
Loans and advances to customers
Investment securities
Other assets
2015
2.53% 2.87%16.20% 16.73%
13.93% 11.24%
26.93% 26.89%
40.40% 42.27%
Cash and balanceswith Central Banks
Loans and advances to banks
Loans and advances to customers
Investment securities
Other assets
By Currency By Type - 2014
4.89%
28.35%
28.34%
38.42%
Individual
Corporate
SME
Kafalat and Subsidized Loans
2014
2015
LBP USD Other

30
Breakdown of Investment Securities by Type2. Profit before Income Tax
Total operating income increased by 7.68% in 2015 compared with 4.91% in 2014, but this growth was offset by net credit impairment charges, resulting in 2.94% growth in net operating income against 6.35% in 2014. Total operating expenses have increased by 4.76% only versus 9.15% in 2014. That is mainly due to a decline in personnel expenses by 1.93% in 2015, which constitute 56.25% of total operating expenses. As a result, profit before income tax amounting to LBP 81,246 million made a minimal increase of 0.63% over 2014 figure. 3. Management Efficiency Ratios
Efficiency measures how well a bank calculates its assets and liabilities internally. BBAC’s interest paid to interest received ratio, closing at 68.91% in 2014, has increased in 2015 to 70.96%. That is due to the 13.26% increase in interest paid compared to 10 % increase in interest received. This was mainly driven by the superior 12.68% growth in deposits. On the other hand, net commission to income scored 19.75% in 2015 in comparison with 18.13% in 2014, as a result of the 12.11% growth in net fee and commission income. Higher cost to income in 2015 was caused mainly by a reduction in income due to net credit impairment charges.
Distribution of Liquid Assets
Net Interest and Similar Income
Interest and similar income witnessed a growth of 10% against 8.17% in 2014. Interest from loans and advances comprises 46.62% of total interest and similar income, and it rose by 11.80% in 2015 against 9.98% in 2014, mainly driven by 12.19% growth in interest from loans to customers and 155.55% growth in reverse repos. 53.38% of interest and similar income come from financial assets at fair value through profit or loss and amortized cost, and have increased by 8.47% in comparison with 6.68% in 2014. Interest income from financial assets at fair value through profit or loss reached LBP 12,078 million in 2015 growing by 185.80% over LBP 4,226 million in 2014.
2014 to 27.07% in 2015. Loans granted in other currencies, mainly EUR, also witnessed an increase in 2015.The loan portfolio witnessed a huge shift of loans from corporate to SME loans. Corporate loans decreased from 49.96% in 2014 to 28.34% of total loans in 2015. On the other hand, SME to total loans ratio increased from 17.06% to 38.42% in 2015. This reclassification of loans between SME and Corporate was in line with revised BDL circular number 396 issued in September 2015.
3. Interest-Earning Loans by Geography
87.03% of the total loan portfolio, of LBP 2,472,772 million, granted in 2015 and amounting to LBP 2,152,007 million, are concentrated in Lebanon compared to 86.90% in 2014, followed by 9.46% to Arab countries. There was a slight increase of 0.28% in loans granted to European countries, which comprise 2.34% of total loans and sum to LBP 57,922 million.
Profitability and Efficiency
1. Interest Margin Analysis
(LBP million) 2015Total
2014Total
Average Interest Earning Assets 7,812,099 7,099,405Interest Paid 314,821 277,953
Interest Received 443,663 403,331
Net Interest Received 128,842 125,378
Cost of Average Interest Earning Assets (in %) 4.03% 3.92%
Return on Average Interest Earning Assets (in %) 5.68% 5.68%
Gross Interest Margin (in %) 1.65% 1.77%Net Releases (Provisions) on Loans and Advances (7,572) 1,084
Net Interest Margin (in %) 1.55% 1.78%Average Interest Earning Assets to Average Assets (in %) 89.76% 89.16%
Gross Spread (in %) 1.48% 1.57%
Net Spread (in %) 1.39% 1.59%
Net interest received increased by 2.76% in 2015 to reach LBP 128,842 million compared to a 6.69% growth in 2014. This is due to a 13.26% growth in interest paid surpassing the 10% growth in interest received as a result of the huge growth of 12.68% in deposits in 2015 compared to 5.32% only in 2014.
Cost of average interest earning assets increased from 3.92% to 4.03% due to the 13.26% growth in interest paid. Return on average interest earning assets remained unchanged in 2015. As a result, gross interest margin decreased from 1.77% to 1.65% in 2015. The net provisions on loans and advances coupled with high average interest earning assets caused the net interest margin to decrease by 0.23% from 2014 ratio to reach 1.55% in 2015. This was also reflected in net spread ratio which declined to 1.39% in 2015.
2014
2015
Cash with centralbanks
Loans to banks Invest. portfolio
Treasury Bills
CD’s & other Debt Securities
Equity Securities
Securitisation Funds
Treasury Bills
CD’s & other Debt Securities
Equity Securities
Securitisation Funds
201420150.48% 0.59%
61.04% 65.26%37.38% 33.23%1.10% 0.93%

32

34
PricewaterhouseCoopers Saba House Building, Block B/C Said Freiha St., Hazmieh, Lebanon P.O.Box 11-3155, Beirut, Lebanon
Independent Auditors’ Report to the Shareholders of BBAC S.A.L.Report on the separate financial statements
We have audited the accompanying separate financial statements of BBAC S.A.L. (“the Bank”), which comprise the balance sheet as at 31 December 2015 and the statements of comprehensive income, changes in equity and cash flows for the year then ended and a summary of significant accounting policies and other explanatory notes.
Management’s responsibility for the financial statements
Management is responsible for the preparation and fair presentation of these financial statements in accordance with the International Financial Reporting Standards (IFRSs), and for such internal control as management determines is necessary to enable the preparation of financial statements that are free from material misstatement, whether due to fraud or error.
Auditors’ responsibility
Our responsibility is to express an opinion on these separate financial statements based on our audit. We conducted our audit in accordance with International Standards on Auditing. Those standards require that we comply with ethical requirements and plan and perform the audit to obtain reasonable assurance about whether the financial statements are free from material misstatement.
An audit involves performing procedures to obtain audit evidence about the amounts and disclosures in the financial statements. The procedures selected depend on the auditors’ judgement, including the assessment of the risks of material misstatement of the financial statements, whether due to fraud or error. In making those risk assessments, the auditors consider internal control relevant to the entity’s preparation and fair presentation of the financial statements in order to design audit procedures that are appropriate in the circumstances, but not for the purpose of expressing an opinion on the effectiveness of the entity’s internal control. An audit also includes evaluating the appropriateness of accounting policies used and the reasonableness of accounting estimates made by management, as well as evaluating the overall presentation of the financial statements.
We believe that the audit evidence we have obtained is sufficient and appropriate to provide a basis for our audit opinion.
Opinion
In our opinion, the accompanying separate financial statements present fairly, in all material respects, the financial position of the Bank as at 31 December 2015, and of its financial performance and its cash flows for the year then ended in accordance with International Financial Reporting Standards (IFRSs).
PricewaterhouseCoopers
Beirut, Lebanon10 May 2016
KPMG
CONTENTSChairman’s Letter
ManagementFinancial Highlights Evolution of Key Indicators Selected Financial Data Asset Quality Key Ratios Source of Funds Liquidity Profitability Ratios Board of DirectorsMajor Shareholders and General ManagementCorporate GovernanceExcerpts from BBAC’s Ordinary General Assembly of Shareholders
Management Discussion and AnalysisBasis of PresentationCorporate Profile Mission Statement Business Overview Corporate and Commercial Banking Retail Banking Private Banking Treasury and Capital Markets Insurance Services Information Technology Compliance Risk Management Human Resources Management Corporate Social ResponsibilityFinancial Activities and Performance Highlights Breakdown of Assets and Liabilities Asset and Liability Management Profitability and Efficiency
Auditors’ ReportIndependent Auditors’ Report Balance Sheet Statement of Comprehensive Income Statement of Changes in EquityStatement of Cash Flows Notes to the Financial Statements
NetworkBranch NetworkCorrespondent BanksSubsidiaries
2
466889
10111112131415
161818181919192021212222232626 28282930
32353637383941
104106107108
36
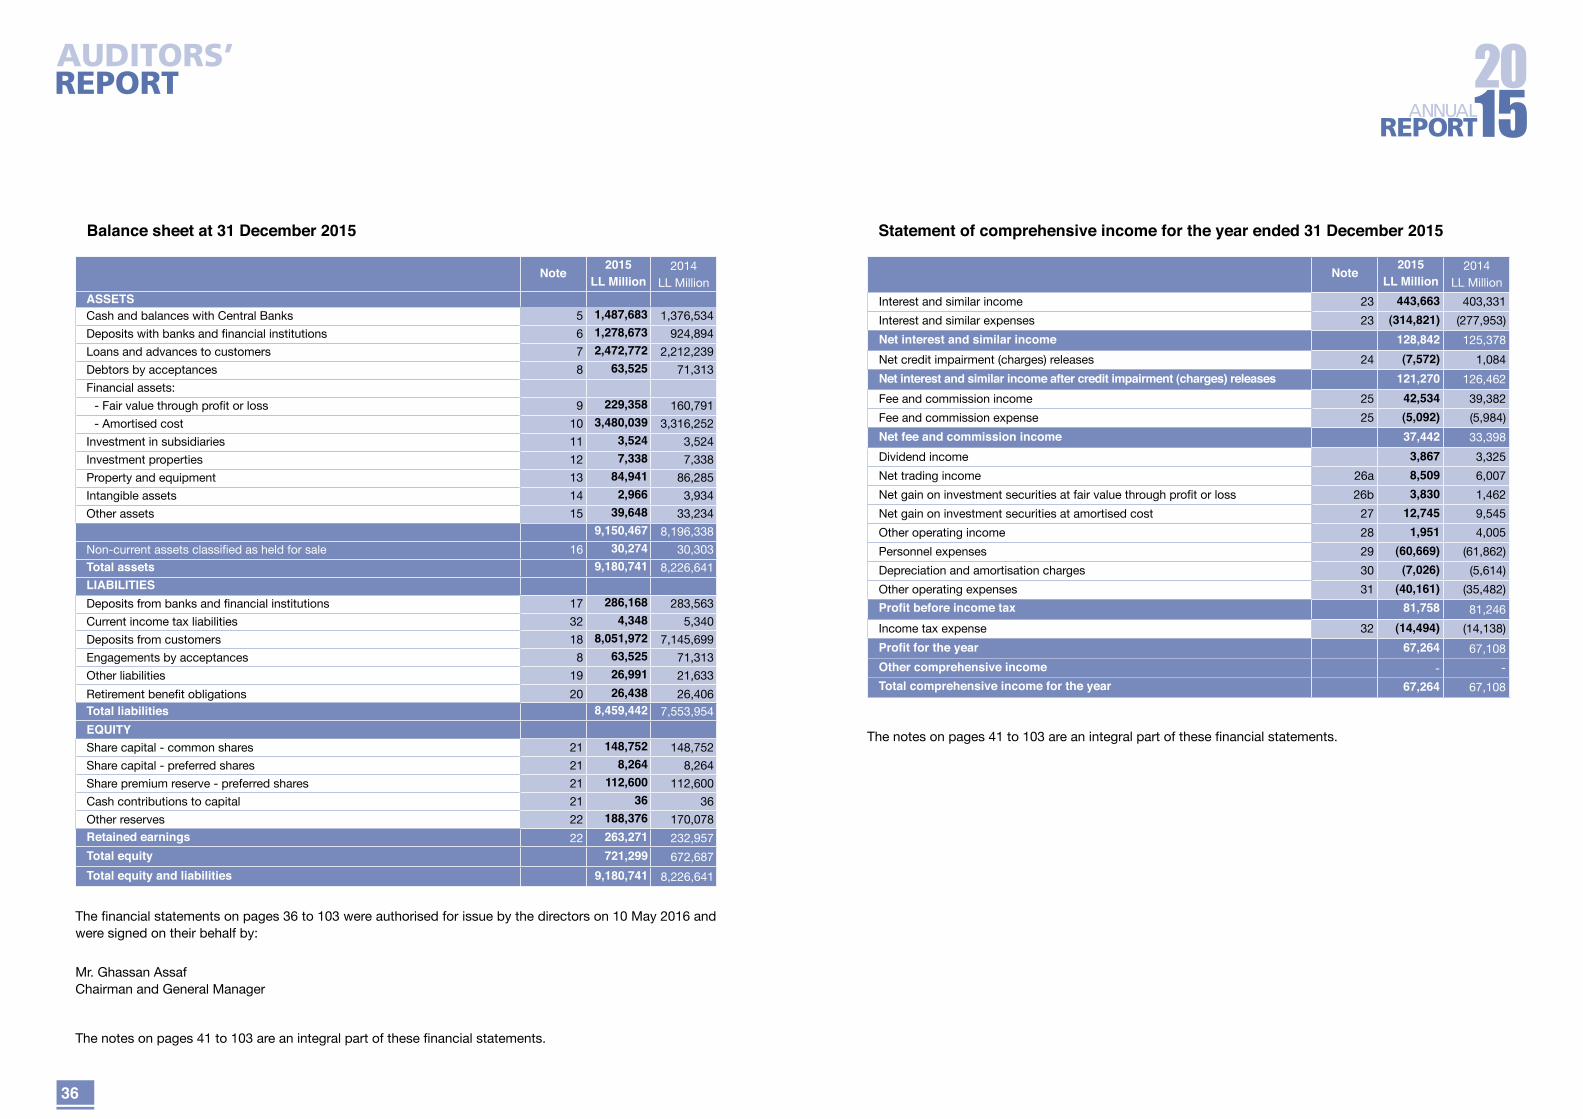
Statement of comprehensive income for the year ended 31 December 2015
Note 2015LL Million
2014LL Million
Interest and similar income 23 443,663 403,331
Interest and similar expenses 23 (314,821) (277,953)
Net interest and similar income 128,842 125,378
Net credit impairment (charges) releases 24 (7,572) 1,084
Net interest and similar income after credit impairment (charges) releases 121,270 126,462
Fee and commission income 25 42,534 39,382
Fee and commission expense 25 (5,092) (5,984)
Net fee and commission income 37,442 33,398
Dividend income 3,867 3,325
Net trading income 26a 8,509 6,007
Net gain on investment securities at fair value through profit or loss 26b 3,830 1,462
Net gain on investment securities at amortised cost 27 12,745 9,545
Other operating income 28 1,951 4,005
Personnel expenses 29 (60,669) (61,862)
Depreciation and amortisation charges 30 (7,026) (5,614)
Other operating expenses 31 (40,161) (35,482)
Profit before income tax 81,758 81,246
Income tax expense 32 (14,494) (14,138)
Profit for the year 67,264 67,108
Other comprehensive income - -
Total comprehensive income for the year 67,264 67,108
The notes on pages 41 to 103 are an integral part of these financial statements.
Balance sheet at 31 December 2015
Note 2015LL Million
2014LL Million
ASSETSCash and balances with Central Banks 5 1,487,683 1,376,534
Deposits with banks and financial institutions 6 1,278,673 924,894
Loans and advances to customers 7 2,472,772 2,212,239
Debtors by acceptances 8 63,525 71,313
Financial assets:
- Fair value through profit or loss 9 229,358 160,791
- Amortised cost 10 3,480,039 3,316,252
Investment in subsidiaries 11 3,524 3,524
Investment properties 12 7,338 7,338
Property and equipment 13 84,941 86,285
Intangible assets 14 2,966 3,934
Other assets 15 39,648 33,2349,150,467 8,196,338
Non-current assets classified as held for sale 16 30,274 30,303
Total assets 9,180,741 8,226,641
LIABILITIESDeposits from banks and financial institutions 17 286,168 283,563
Current income tax liabilities 32 4,348 5,340
Deposits from customers 18 8,051,972 7,145,699
Engagements by acceptances 8 63,525 71,313
Other liabilities 19 26,991 21,633
Retirement benefit obligations 20 26,438 26,406Total liabilities 8,459,442 7,553,954
EQUITYShare capital - common shares 21 148,752 148,752
Share capital - preferred shares 21 8,264 8,264
Share premium reserve - preferred shares 21 112,600 112,600
Cash contributions to capital 21 36 36
Other reserves 22 188,376 170,078
Retained earnings 22 263,271 232,957
Total equity 721,299 672,687
Total equity and liabilities 9,180,741 8,226,641
The financial statements on pages 36 to 103 were authorised for issue by the directors on 10 May 2016 and were signed on their behalf by:
Mr. Ghassan AssafChairman and General Manager
The notes on pages 41 to 103 are an integral part of these financial statements.

38
Statement of cash flows for the year ended 31 December 2015
Note 2015LL Million
2014LL Million
Cash flows from operating activitiesProfit before income tax 81,758 81,246
Adjustments for non cash-items:
Net client impairment charges (releases) 24 629 (1,084)
Allowance on impairment of balances with central Bank of Iraq (Kurdistan) charges 24 6,943 -
Depreciation charge 13 5,813 4,640
Amortisation charge 14 1,213 974
Loss on disposal of property and equipment 28 61 21
Gain on disposal of assets classified as held for sale 28 (156) (316)
Net gain on investment securities at fair value through profit or loss (3,050) (1,027)
Net gain on investment securities at amortised cost 27 (12,745) (9,545)
Dividends income (3,867) (3,325)
Provision for retirement benefit obligations 20 2,560 4,446
Other (129)79,030 76,030
Change in operating assets and liabilities:
Balances with Central Banks 5 (18,875) (24,245)
Deposits with banks and financial institutions 6 (76,119) (141,421)
Investment securities at fair value through profit or loss 9 (65,517) (80,119)
Loans and advances to customers 7 (261,593) (200,841)
Investment securities at amortised cost 10 (151,042) (247,983)
Other assets 15 (6,414) (1,564)
Deposits from banks and financial institutions 17 2,605 101,309
Deposits from customers 18 906,273 360,983
Other liabilities 19 5,358 (6,081)
Dividends received 3,867 3,325
Employee benefits paid 20 (2,528) (1,743)
Income taxes paid 32 (15,486) (16,036)
Net cash generated from (used in) operating activities 399,559 (178,386)
Cash flows from investing activitiesPurchase of intangible assets 14 (245) (1,823)
Purchase of property and equipment 13 (5,651) (10,771)
Proceeds from disposal of property and equipment 1,121 198
Proceeds from disposal of assets classified as held for sale 616 710Net cash used in investing activities (4,159) (11,686)
Statement of changes in equity for the year ended 31 December 2015
Share capital - Commonshares
LL Million
Share capital -
Preferred shares
LL Million
Share premium reserve
LL Million
Cash contributions
to capitalLL Million
Other reservesLL Million
Retained earningsLL Million
Total equity
LL Million
At 1 January 2014 148,752 8,264 112,600 36 151,505 202,947 624,104
Total comprehensive income for the year
- - - - - 67,108 67,108
Transactions with owners of the Bank:
Appropriations of retained earnings (note 22)
- - - - 18,573 (18,573) -
Dividends declared relating to 2013 (note 33)
- - - - - (18,524) (18,524)
Interest paid on cash contributions to capital (note 33)
- - - - - (1) (1)
At 31 December 2014 148,752 8,264 112,600 36 170,078 232,957 672,687
At 1 January 2015 148,752 8,264 112,600 36 170,078 232,957 672,687Total comprehensive income for the year
- - - - - 67,264 67,264
Transactions with owners of the Bank:
Appropriations of retained earnings (note 22)
- - - - 18,305 (18,305) -
Dividends declared relating to 2013 (note 33)
- - - - - (18,522) (18,522)
Interest paid on cash contributions to capital (note 33)
- - - - - (1) (1)
Other - - - - (7) (122) (129)
At 31 December 2015 148,752 8,264 112,600 36 188,376 263,271 721,299
The notes on pages 41 to 103 are an integral part of these financial statements.

40
Notes to the financial statements for the year ended 31 December 2015
1 General information
BBAC S.A.L. (“the Bank”) provides retail, private and corporate banking services through its head office in Beirut and its network of thirty nine branches across Lebanon, in addition to a branch in Cyprus and two branches in Iraq (Erbil and Baghdad).
The Bank was incorporated in Lebanon in 1956 and registered at the Commercial Court in Beirut under No. 6196. It is registered under number 28 on the list of Lebanese banks at the Central Bank of Lebanon. The address of its registered office is as follows: P.O. Box: 11-1536, Clemenceau, Beirut - Lebanon.
2 Summary of significant accounting policies
The principal accounting policies applied in the preparation of these financial statements are set out below. These policies have been consistently applied to all the years presented, unless otherwise stated.
2.1 Basis of preparation
The financial statements relate to the Bank and are presented on a non-consolidated basis. The Bank also separately prepares consolidated financial statements in accordance with International Financial Reporting Standards (“IFRS”) and IFRS Interpretations Committee (IFRS IC) for the Bank and its subsidiaries (“the Group”).
The consolidated financial statements can be obtained from BBAC S.A.L. registered office: P.O. Box: 11-1536, Clemenceau, Beirut - Lebanon.
Users of the separate financial statements should read them together with the Group’s consolidated financial statements for the year ended 31 December 2015 in order to obtain full information on the balance sheet, results of operations and changes in balance sheet of the Group as a whole.
The financial statements have been prepared in accordance with International Financial Reporting Standards (“IFRS”) as issued by the International Accounting Standards Board (“IASB”). The financial statements have been prepared under the historical cost convention, as modified by the revaluation of financial assets at fair value through profit or loss.
The disclosures on risks from financial instruments are presented in the financial risk management report contained in note 3.
The preparation of financial statements in conformity with IFRS requires the use of certain critical accounting estimates. It also requires management to exercise its judgement in the process of applying the Bank’s accounting policies. Changes in assumptions may have a significant impact on the financial statements in the period the assumptions changed. Management believes that the underlying assumptions are appropriate and that the Bank’s financial statements therefore present the balance sheet and results fairly. The areas involving a higher degree of judgement or complexity, or areas where assumptions and estimates are significant to the financial statements are disclosed in note 4.
Statement of cash flows (continued) for the year ended 31 December 2015
Note 2015LL Million
2014LL Million
Cash flows from financing activitiesInterest paid on cash contributions to capital (1) (1)
Dividends paid 33 (18,522) (18,524)
Net cash used in financing activities (18,523) (18,525)
Cash and cash equivalents at beginning of year 34 1,037,598 1,246,195
Net cash generated from (used in) operating activities 399,559 (178,386)
Net cash used in investing activities (4,159) (11,686)
Net cash used in financing activities (18,523) (18,525)
Cash and cash equivalents at end of year 34 1,414,475 1,037,598
The principal non cash transaction was mainly the acquisition of properties in settlement of non-performing loans amounting to LL 431 million (2014 – LL 5.07 billion)
The notes on pages 8 to 80 are an integral part of these financial statements.

42
2.2 Investment in subsidiaries
Subsidiaries are all entities over which the Bank has control. The Bank controls an entity when the Bank is exposed to, or has rights to, variable returns from its involvement with the entity and has the ability to affect those returns through its power over the entity. Subsidiaries are fully consolidated on the date on which control is transferred to the Bank. They are deconsolidated from the date that control ceases.
The Bank has elected to account for its investments in subsidiaries under the cost method, and accordingly:
If the ownership interest in the subsidiary is reduced but significant influence/control is retained, the difference between the carrying value of the portion sold and the amount received on sale is recognised in profit or loss as ‘gain/loss on sale of shares in subsidiary’ within ‘other operating income/loss’.
The Bank determines at each reporting date whether there is any objective evidence that the investment in the subsidiary is impaired. If this is the case, the Bank calculates the amount of impairment as the difference between the recoverable amount of the subsidiary and its carrying value and accordingly the loss is recognised in the profit or loss as ‘impairment loss on investment in subsidiary’ within ‘other operating income/loss’. The Bank does not recognise further losses, unless it has incurred legal or constructive obligations or made payments on behalf of the subsidiary.
Dividend income is recognised when the right to receive payment is established. A listing of the Bank’s subsidiaries is shown in note 11.
2.3 Foreign currency
(a) Functional and presentation currency
Items included in the financial statements of the Bank are measured using the currency of the primary economic environment in which the entity operates (“the functional currency”). The financial statements are presented in Lebanese pounds, which is the Bank’s functional and presentation currency.
(b) Transactions and balances
Foreign currency transactions are translated into the functional currency using the exchange rates prevailing at the dates of the transactions or valuation where items are re-measured.
Monetary items denominated in foreign currency are translated with the closing rate as at the reporting date. Non-monetary items measured at historical cost denominated in a foreign currency are translated with the exchange rate as at the date of initial recognition; non-monetary items in a foreign currency that are measured at fair value are translated using the exchange rates at the date when the fair value was determined.
Foreign exchange gains and losses resulting from the settlement of foreign currency transactions and from the translation at year-end exchange rates of monetary assets and liabilities denominated in foreign currencies are recognised in the profit or loss.
Translation differences on non-monetary items, such as equities held at fair value through profit or loss, are reported as part of the fair value gain or loss.
2.1.1 Changes in accounting policy and disclosures
(a) New and amended standards adopted by the Bank for the financial year beginning on 1 January 2015
There are no IFRS’s or IFRIC interpretations that are effective for the first time for the financial year beginning on or after 1 January 2015 that would be expected to have a material impact on the Bank’s financial statements.
(b) New standards, amendments and interpretations issued but not effective for the financial year beginning
on or after 1 January 2015 and not early adopted by the Bank: • IFRS 9, ‘Financial instruments’ was issued in July 2015. The Banks are currently required to
apply phase I of IFRS 9 issued in November 2009 which only addressed the classification and measurement of financial assets. This version of the standard established only two primary measurement categories for debt instruments. The complete version issued in 2015 establishes three primary measurement categories for financial assets that are debt instruments: amortised cost, fair value through OCI and fair value through P&L. The basis of classification depends on the entity’s business model and the contractual cash flow characteristics of the financial asset. There is now a new expected credit losses model that replaces the incurred loss impairment model used in IAS 39. For financial liabilities, the only change was the recognition of changes in own credit risk in other comprehensive income, for liabilities designated at fair value through profit or loss. The IFRS 9 complete version relaxes the requirements for hedge effectiveness. It requires an economic relationship between the hedged item and hedging instrument and for the ‘hedged ratio’ to be the same as the one management actually use for risk management purposes. The complete version of the standard is effective for accounting periods beginning on or after 1 January 2018 with early adoption permitted. The Bank is assessing the potential impact on its financial statements resulting from the application of IFRS 9. This standard is expected to have a significant impact on the Bank’s financial statements, specifically in the level of impairment allowances under the expected loss model.
• IFRS 15, ‘Revenue from contracts with customers’ establishes a comprehensive framework for determining whether, how much and when revenue is recognised. It replaces existing revenue recognition guidance, including IAS 18 ‘Revenue’, IAS 11 ‘Construction contracts’ and IFRIC 13 ‘Customer loyalty programmes’. IFRS 15 is effective for annual reporting periods beginning on or after 1 January 2017 with early adoption permitted. The Bank is assessing the potential impact on its financial statements resulting from the application of IFRS 15.
• IFRS 16, ‘Leases’, (effective 1 January 2019) replaces the current standard on leasing, IAS 17. Under IFRS 16, a contract is, or contains, a lease if the contract conveys the authorisation to control the use of an identified asset for a period of time in exchange for consideration. For lessors, the accounting stays almost the same. However, as the IASB has updated the definition of a lease, lessors will be affected by the new standard. For lessees, the changes are more far-reaching. Under IAS 17, lessees were required to make a distinction between a finance lease (on balance sheet) and an operating lease (off balance sheet). IFRS 16 now requires lessees to recognise a lease liability reflecting future lease payments and a corresponding asset for the ability to use the asset for virtually all lease contracts. The standard includes an optional exemption for certain short-term leases and leases of low-value assets; however, this exemption can only be applied by lessees, not the lessors. The impact of this amendment is not expected to be significant on the Bank’s financial statements.
There are no other IFRSs or IFRIC interpretations that are not yet effective that would be expected to have a material impact on the Bank.

44
through the amortisation process using the effective interest rate method.
The Bank subsequently measures all equity investments at fair value. Where the Bank’s management has elected to present unrealised and realised fair value gains and losses on equity investments in other comprehensive income, there is no subsequent recycling of fair value gains and losses to profit or loss. Dividends from such investments continue to be recognised in profit or loss as long as they represent a return on investment.
The Bank is required to reclassify all affected debt investments when and only when its business model for managing those assets changes.
2.4.2 Financial liabilities
The Bank’s holding in financial liabilities is in financial liabilities at amortised cost. Financial liabilities are derecognised when extinguished.
Financial liabilities measured at amortised cost are deposits from banks or customers (even those deposits with embedded derivatives, where the derivative was separated from the host contract and accounted for as a trading derivative), debt securities in issue for which the fair value option is not applied, convertible bonds and subordinated debts.
2.4.3 Determination of fair value
For financial instruments traded in active markets, the determination of fair values of financial assets and financial liabilities is based on quoted market prices or dealer price quotations.
A financial instrument is regarded as quoted in an active market if quoted prices are readily and regularly available from an exchange, dealer, broker, industry group, pricing service or regulatory agency, and those prices represent actual and regularly occurring market transactions on an arm’s length basis.
If the above criteria are not met, the market is regarded as being inactive. Indications that a market is inactive are when there is a wide bid-offer spread or significant increase in thebid-offer spread or there are few recent transactions.
For all other financial instruments, fair value is determined using valuation techniques. In these techniques, fair values are estimated from observable data in respect of similar financial instruments, using widely recognised models to estimate the present value of expected future cash flows or other valuation techniques, using inputs (for example, LIBOR yield curve, FX rates, credit default swap spreads) existing at the dates of the balance sheet. 2.4.4 Derecognition
Financial assets are derecognised when the contractual rights to receive the cash flows from these assets have ceased to exist or the assets have been transferred and substantially all the risks and rewards of ownership of the assets are also transferred (that is, if substantially all the risks and rewards have not been transferred, the Bank tests control to ensure that continuing involvement on the basis of any retained powers of control does not prevent derecognition).
Financial liabilities are derecognised when they have been redeemed or otherwise extinguished.
2.4 Financial assets and liabilities
2.4.1 Classification and measurement
In accordance with IFRS 9, all financial assets and liabilities - which include derivative financial instruments - have to be recognised in the balance sheet and measured in accordance with their assigned category.
(a) Debt investments
(i) Invetsment securities at amortised cost
A debt investment is classified as ‘amortised cost’ only if both of the following criteria are met: the objective of the Bank’s business model is to hold the asset to collect the contractual cash flows; and the contractual terms give rise on specified dates to cash flows that are solely payments of principal and interest on the principal outstanding. The nature of any derivatives embedded in the debt investment are considered in determining whether the cash flows of the investment are solely payment of principal and interest on the principal outstanding and are not accounted for separately.
(ii) Invetsment securities at fair value
If either of the two criteria above is not met, the debt instrument is classified as ‘fair value through profit or loss’.
(b) Equity investments
All equity investments are measured at fair value. Equity investments that are held for trading are measured at fair value through profit or loss. For all other equity investments, the Bank can make an irrevocable election at initial recognition to recognise changes in fair value through other comprehensive income rather than profit or loss.
(c) Recognition, measurement and reclassification
Regular purchases and sales of financial assets are recognised on the trade-date, the date on which the Bank commits to purchase or sell the asset. Financial assets are derecognised when the rights to receive cash flows from the investments have expired or have been transferred and the Bank has transferred substantially all risks and rewards of ownership.
At initial recognition, the Bank measures a financial asset at its fair value plus, in the case of a financial asset not at fair value through profit or loss, transaction costs that are directly attributable to the acquisition of the financial asset.
Transaction costs of financial assets held at fair value though profit or loss is expensed in the profit or loss.
A gain or loss on a debt investment that is subsequently measured at fair value and is not part of a hedging relationship is recognised in profit or loss and presented in the statement of comprehensive income within ‘Net gain on investment securities at fair value through profit or loss’ in the period in which they arise.
A gain or loss on a debt investment that is subsequently measured at amortised cost and is not part of a hedging relationship is recognised in profit or loss when the financial asset is derecognised or impaired and

46
2.7 Offsetting financial instruments
Financial assets and liabilities are offset and the net amount reported in the balance sheet when there is a legally enforceable right to offset the recognised amounts and there is an intention to settle on a net basis, or realise the asset and settle the liability simultaneously. The legally enforceable right must not be contingent on future events and must be enforceable in the normal course of business and in the event of default, insolvency or bankruptcy of the Bank or the counterparty.
Income and expenses are presented on a net basis only when permitted under IFRS, or for gains and losses arising from a group of similar transactions such as in the Bank’s trading activity.
2.8 Impairment of financial assets
(a) Assets carried at amortised cost
The Bank assesses at the end of each reporting period whether there is objective evidence that a financial asset or group of financial assets is impaired. A financial asset or a group of financial assets is impaired and impairment losses are incurred only if there is objective evidence of impairment as a result of one or more events that occurred after the initial recognition of the asset (a ‘loss event’) and that loss event (or events) has an impact on the estimated future cash flows of the financial asset or group of financial assets that can be reliably estimated.
Evidence of impairment may include indications that the debtors or a group of debtors is experiencing significant financial difficulty, default or delinquency in interest or principal payments, the probability that they will enter bankruptcy or other financial reorganisation, and where observable data indicate that there is a measurable decrease in the estimated future cash flows, such as changes in arrears or economic conditions that correlate with defaults.
For the purposes of a collective evaluation of impairment, financial assets are grouped on the basis of similar credit risk characteristics (i.e., on the basis of the Bank’s grading process that considers asset type, industry, geographical location, collateral type, past-due status and other relevant factors). Those characteristics are relevant to the estimation of future cash flows for groups of such assets by being indicative of the debtors’ ability to pay all amounts due according to the contractual terms of the assets being evaluated.
When a loan is uncollectible, it is written off against the related allowance for loan impairment. Such loans are written off after all the necessary procedures have been completed and the amount of the loss has been determined. Impairment charges relating to deposits with banks and financial institutions and customers are classified in “Net loan impairment charges” whilst impairment charges relating to investment securities are classified in “Net gains on investment securities at amoritsed cost”. If, in a subsequent period, the amount of the impairment loss decreases and the decrease can be related objectively to an event occurring after the impairment was recognised (such as an improvement in the debtor’s credit rating), the previously recognised impairment loss is reversed by adjusting the allowance account. The amount of the reversal is recognised in the statement of comprehensive income.
The amount of the loss is measured as the difference between the asset’s carrying amount and the present value of estimated future cash flows (excluding future credit losses that have not been incurred) discounted at the financial asset’s original effective interest rate. The carrying amount of the asset is reduced and the amount of the loss is recognised in the statement of comprehensive income.
2.5 Reclassification of financial assets
When and only when, an entity changes its business model for managing financial assets it shall reclassify all affected financial assets. An entity shall not reclassify any financial liability nor equity instruments.
If an entity reclassifies financial assets, it shall apply the reclassification prospectively from the reclassification date. The entity shall not restate any previously recognised gains, losses or interest.
If an entity reclassifies a financial asset so that it is measured at fair value, its fair value is determined at the reclassification date. Any gain or loss arising from a difference between the previous carrying amount and fair value is recognised in profit or loss.
If an entity reclassifies a financial asset so that it is measured at amortised cost, its fair value at the reclassification date becomes its new carrying amount.
2.6 Classes of financial instruments
The Bank classifies the financial instruments into classes that reflect the nature of information and take into account the characteristics of those financial instruments. The classification made can be seen in the table below:
Category(as defined by IFRS 9)
Class (as determined by the Bank) Subclass
Financial assets
At amortised cost
Deposits with banks and financial institutions
Loans and advances to customers
Loans to individuals
- Overdraft- Credit cards- Personal loans- Housing loans
Loans to corporate entities
- SMEs - Large corporate entities
Investment securities - debt instruments Unlisted and Listed
At fair value through profit or loss
Investment securities:Equity instruments
Debt securitiesUnlisted and Listed
Financial liabilities
Financial liabilities at amortised cost
Deposits from banks
Deposits from customers and financial institutions
Off-balance sheet
financial instruments
Loan commitments
Guarantees and other financial facilities
48
2.12 Impairment of non-financial assets
Intangible assets that have an indefinite useful life are not subject to amortisation and are tested annually for impairment. Assets are reviewed for impairment whenever events or changes in circumstances indicate that the carrying amount may not be recoverable. An impairment loss is recognised for the amount by which the asset’s carrying amount exceeds its recoverable amount. The recoverable amount is the higher of an asset’s fair value less costs to sell and value in use. For the purposes of assessing impairment, assets are grouped at the lowest levels for which there are separately identifiable cash inflows (cash-generating units).
The impairment test also can be performed on a single asset when the fair value less cost to sell or the value in use can be determined reliably. Non-financial assets other than goodwill that suffered impairment are reviewed for possible reversal of the impairment at each reporting date. No non-financial assets were impaired in 2015 and 2014.
2.13 Cash and cash equivalents
Cash and cash equivalents comprise balances with less than three months’ maturity from the date of acquisition, including cash in hand, deposits held at call with banks and other short-term highly liquid investments with original maturities of three months or less.
2.14 Repossessed property
In certain circumstances, property is repossessed following the foreclosure on loans that are in default. Repossessed properties are measured at the lower of carrying amount and fair value less costs to sell and reported within “non-current assets classified as held for sale”.
2.15 Leases
Leases in which a significant portion of the risks and rewards of ownership are retained by the lessor, are classified as operating leases. Payments made under operating leases (net of any incentives received from the lessor) are charged to the profit or loss on a straight-line basis over the period of the lease. These charges are recorded within ‘other operating expenses’.
When an operating lease is terminated before the lease period has expired, any payment required to be made to the lessor by way of penalty is recognised as an expense in the period in which termination takes place.
2.16 Investment properties
Properties that are held for long-term rental yields or for capital appreciation or both, and that are not occupied by the Bank, are classified as investment properties. Investment properties comprise office buildings and retail parks leased out under operating lease agreements.
Some properties may be partially occupied by the Bank, with the remainder being held for rental income or capital appreciation. If that part of the property occupied by the Bank can be sold separately, the Bank accounts for the portions separately. The portion that is owner -occupied is accounted for under IAS 16, and the portion that is held for rental income or capital appreciation or both is treated as investment property under IAS 40.
If, in a subsequent period, the amount of the impairment loss decreases and the decrease can be related objectively to an event occurring after the impairment was recognised (such as an improvement in the debtor’s credit rating), the reversal of the previously recognised impairment loss is recognised in the statement of comprehensive income.
(b) Renegotiated loans
If the terms of a financial asset are renegotiated or modified (mainly applicable on facilities provided to clients, who are facing financial difficulties), then an assessment is made of whether the financial asset should be derecognised. If the cash flows of the renegotiated asset are substantially different, then the contractual rights to cash flows from the original financial asset are deemed to have expired. In this case, the original financial asset is derecognised and the new financial asset is recognised at fair value. The impairment loss before an expected restructuring is measured as follows:
• If the expected restructuring will not result in derecognition of the existing asset, then the estimated cash flows arising from the modified financial asset are included in the measurement of the existing asset based on their expected timing and amounts discounted at the original effective interest rate of the existing financial asset.
• If the expected restructuring will result in derecognition of the existing asset, then the expected fair value of the new asset is treated as final cash flow from the existing financial asset at the time of derecognition. This amount is discounted using the original effective interest rate of the existing financial asset.
2.9 Interest income and expense
Interest income and expense for all interest-bearing financial instruments are recognised within “interest and similar income” and “interest and similar expenses” in the statement of comprehensive income using the effective interest method.
The effective interest method is a method of calculating the amortised cost of a financial asset or a financial liability and of allocating the interest income or interest expense over the relevant period.
The effective interest rate is the rate that exactly discounts estimated future cash payments or receipts through the expected life of the financial instrument or, when appropriate, a shorter period to the net carrying amount of the financial asset or financial liability.
Once a financial asset or a group of similar financial assets has been written down as a result of an impairment loss, interest income is recognised using the rate of interest used to discount the future cash flows for the purpose of measuring the impairment loss.
2.10 Fees and commissions
Fees and commissions are generally recognised on an accrual basis when the service has been provided.
Portfolio and other management advisory and service fees are recognised based on the applicable service contracts, usually on a time-apportionate basis. 2.11 Dividend income
Dividends are recognised in the statement of comprehensive income when the Bank’s right to receive payment is established. Usually, this is the ex-dividend date for quoted equity securities.

50
amount is greater than its estimated recoverable amount (note 2.12).
Gains and losses on disposals are determined by comparing proceeds with carrying amount and are recognised within ‘other operating income’ in the statement of comprehensive income.
When revalued assets are sold, the amounts included in other reserves are transferred to retained earnings.
2.18 Intangible assets
Intangible assets comprise separately identifiable intangible items arising mainly from computer software licences. Intangible assets are recognised at cost. These intangible assets have a definite useful life and are amortised using the straight-line method over their estimated useful economic life, generally not exceeding 5 years.
2.19 Non-current assets classified as held for sale
Non-current assets held for sale represent properties acquired from customers in settlement of their debt. The Bank exercises its ownership rights over the real estate collateral or acquires the customer’s real estate property when it exhausts all other reasonable means for collecting non-performing loans.
Non-current assets are classified as assets held for sale when their carrying amount is to be recovered principally through a sale transaction and a sale is considered highly probable. They are stated at the lower of carrying amount and fair value less cost to sell if their carrying amount is to be recovered principally through a sale transaction rather than through continuing use.
2.20 Income tax
The tax expense for the period comprises current and deferred tax. Tax is recognised in the profit or loss, except to the extent that it relates to items recognised in other comprehensive income or directly in equity. In this case, tax is also recognised in other comprehensive income or directly in equity, respectively.
(a) Current income tax
The current income tax charge is calculated on the basis of the tax laws enacted or substantively enacted at the balance sheet date in the countries where the Bank operates and generate taxable income. Management periodically evaluates positions taken in tax returns with respect to situations in which applicable tax regulation is subject to interpretation. It establishes provisions where appropriate on the basis of amounts expected to be paid to the tax authorities.
(b) Deferred income tax
Deferred income tax is provided in full, using the asset and liability method, on temporary differences arising between the tax bases of assets and liabilities and their carrying amounts in the financial statements. Deferred income tax is determined using tax rates (and laws) that have been enacted or substantially enacted by the date of the balance sheet and are expected to apply when the related deferred income tax asset is realised or the deferred income tax liability is settled.
When the portions cannot be sold separately, the whole property is treated as investment property only if an insignificant portion is owner-occupied. The Bank considers the owner-occupied portion as insignificant when the property is more than 5% held to earn rental income or capital appreciation. In order to determine the percentage of the portions, the Bank uses the size of the property measured in square meter. Recognition of investment properties takes place only when it is probable that the future economic benefits that are associated with the investment property will flow to the entity and the cost can be measured reliably. This is usually the day when all risks are transferred.
Investment properties are measured initially at cost, including transaction costs. The carrying amount includes the cost of replacing parts of an existing investment property at the time the cost has incurred if the recognition criteria are met; and excludes the costs of day-to-day servicing of an investment property. Subsequent to initial recognition, investment properties are stated at cost less accumulated depreciation and impairment if any.
Land is not depreciated. Depreciation on buildings is calculated using the straight line method to allocate the residual values over their estimated useful lives.
Subsequent expenditure is included in the asset’s carrying amount only when it is probable that future economic benefits associated with the item will flow to the Bank and the cost of the item can be measured reliably.
All other repairs and maintenance costs are charged to the profit or loss during the financial period in which they are incurred.
2.17 Property and equipment
Land and buildings comprise mainly branches and offices and are accounted for using the revaluation model. All other items in property and equipment are accounted for using the cost model (i.e. at historical cost less accumulated depreciation and net of impairment charges, if any).
Subsequent costs are included in the asset’s carrying amount or are recognised as a separate asset, as appropriate, only when it is probable that future economic benefits associated with the item will flow to the Bank and the cost of the item can be measured reliably. The carrying amount of the replaced part is derecognised. All other repairs and maintenance are charged to other operating expenses during the financial period in which they are incurred.
Land is not depreciated. Depreciation of other assets is calculated using the straight-line method to allocate their cost or revalued amounts to their residual values over their estimated useful lives, as follows:
YearsBuildings 50
Computer equipment 5
Furniture, fixtures and equipment 12 - 13
Vehicles 10
Leasehold improvements 5 - 8
The assets’ residual values and useful lives are reviewed, and adjusted if appropriate, at each balance sheet date.
An asset’s carrying amount is written down immediately to its recoverable amount if the asset’s carrying

52
2.23 Financial guarantee contracts
Financial guarantee contracts are contracts that require the issuer to make specified payments to reimburse the holder for a loss it incurs because a specified debtor fails to make payments when due, in accordance with the terms of a debt instrument. Such financial guarantees are given to banks, financial institutions and other bodies on behalf of customers to secure banking facilities and/or commercial transactions.
Financial guarantees are initially recognised in the financial statements at fair value on the date the guarantee was given. The fair value of a financial guarantee at the time of signature is zero because all guarantees are agreed on arm’s length terms and the value of the premium agreed corresponds to the value of the guarantee obligation.
The fee income earned is recognised on a straight-line basis over the life of the guarantee. No receivable for the future premiums is recognised. Subsequent to initial recognition, the Bank’s liabilities under such guarantees are measured at the higher of the amortised amount and the present value of any expected payment to settle the liability when a payment under the contract has become probable. These estimates are determined based on experience of similar transactions and history of past losses, supplemented by the judgement of management.
2.24 Share capital
(a) Share issue costs
Incremental costs directly attributable to the issue of new shares are shown in equity as a deduction, net of tax, from the proceeds.
(b) Dividends on ordinary shares
Dividends on ordinary shares are recognised in equity in the period in which they are approved by the Bank’s shareholders. Dividends for the year that are declared after the date of the balance sheet are dealt with in the subsequent events note.
(c) Cash contributions to capital
Cash contributions to capital are classified as equity. A part of these cash contributions generates interest charges paid to the respective shareholders.
3 Financial risk management
The Bank’s business involves taking on risks in a targeted manner and managing them professionally. The core functions of the Bank’s risk management are to identify all key risks for the Bank, measure these risks, manage the risk positions and determine capital allocations. The Bank regularly reviews its risk management policies and systems to reflect changes in markets, products and best market practice.
The Bank’s aim is to achieve an appropriate balance between risk and return and minimise potential adverse effects on the Bank’s financial performance.
The Bank’s board of directors provides written principles for overall risk management, as well as guidance covering specific areas, such as foreign exchange risk, interest rate risk, credit risk, use of derivative and non-derivative financial instruments.
Deferred income tax assets are recognised to the extent that it is probable that future taxable profit will be available against which the temporary differences can be utilised.
Deferred income tax assets and liabilities are offset when (i) there is a legally enforceable right to offset current tax assets against current tax liabilities and (ii) when the deferred income taxes assets and liabilities relate to income taxes levied by the same taxation authority and (iii) where there is an intention to settle the balances on a net basis.
2.21 Employee benefits
The Bank is subscribed to the compulsory defined benefit plan of the National Social Security Fund.
IAS 19 ‘Employee benefits’ requirements:
A defined benefit plan is a pension plan that defines an amount of pension benefit that an employee will receive on retirement, usually dependent on one or more factors such as age, years of service or compensation. The liability recognised in the balance sheet in respect of the defined benefit plan is the present value of the defined benefit obligation at the balance sheet date less contributions to the NSSF. The present value of the defined benefit obligation is determined by discounting the estimated future cash outflows using interest rates of government securities that have terms to maturity approximating the terms of the related pension liability and are denominated in the currency in which the benefits will be paid.
Local requirements:
With reference to the directives of the National Social Security Fund and Labour laws, the Bank is required to record a provision for staff termination indemnities as if the employment of all staff were to be terminated at the balance sheet date. This provision is calculated as the difference between total indemnities due (a factor of number of years of service and the average monthly salary, based on the last 12 months remunerations) and the total monthly contributions paid to the NSSF (which represents 8.5% of the paid employee benefits).
The difference between the two bases set out above tends not to be significant. The Bank is therefore materially in compliance with the requirements IAS 19.
2.22 Provisions
Provisions for restructuring costs and legal claims are recognised when: the Bank has a present legal or constructive obligation as a result of past events; it is more likely than not that an outflow of resources will be required to settle the obligation; and the amount has been reliably estimated. The Bank recognises no provisions for future operating losses.
Where there are a number of similar obligations, the likelihood that an outflow will be required in settlement is determined by considering the class of obligations as a whole. A provision is recognised even if the likelihood of an outflow with respect to any one item included in the same class of obligations may be small.
Provisions are measured at the present value of the expenditures expected to be required to settle the obligation using a pre-tax rate that reflects current market assessments of the time value of money and the risks specific to the obligation. The increase in the provision due to passage of time is recognised as interest expense.

54
collateral(s) in place; and• Bad – the probability of repayment is low and almost nil.
These credit risk classifications are taken into consideration when measuring the impairment allowances required under IAS 39. Impairment losses are based on losses that have been incurred at the balance sheet date (the ‘incurred loss model’).
(b) Debt securities
For debt securities, external rating such as Standard & Poor’s rating or their equivalents are used by the Asset and Liability Committee for managing the credit risk exposures.
3.1.2 Risk limit control and mitigation policies
The Bank manages, limits and controls concentrations of credit risk wherever they are identified - in particular, to individual borrowers, groups, industries, countries and types of facilities.
The Bank structures the levels of credit risk it undertakes by placing limits on the amount of risk accepted in relation to one borrower, or groups of borrowers, and to geographical and industry segments. Such risks are monitored on a revolving basis and subject to an annual or more frequent review, when considered necessary. Limits on the level of credit risk by product, industry sector and country are set by the Board of Directors, (in compliance with the requirements of BDL basic circulars no. 48, 62 and 81). In addition,the exposure to any one borrower or related borrowers is further restricted by sub-limits covering on and off-balance sheet exposures, in compliance with the requirement of BDL basic circular no. 48.
Lending limits are reviewed in the light of changing market and economic conditions and yearly credit reviews of outstanding facilities to clients.
Some other specific control and mitigation measures are outlined below:
(a) Collateral
The Bank employs a range of policies and practices to mitigate credit risk. The most traditional of these is the taking of security for funds advances, which is common practice. The Bank implements guidelines on the acceptability of specific classes of collateral or credit risk mitigation. The principal collateral types for loans and advances are:
• Mortgages over residential properties (housing loans);• Mortgages over commercial properties (corporate loans);• Cash collaterals;• Bank and public sector guarantees;• Pledged assets such as premises, inventory, accounts receivable, commercial bills, machinery,
vehicles, trade rights; and• Pledged financial instruments such as debt securities and equities.
Longer-term finance and lending to corporate entities are generally secured; revolving individual credit facilities are generally unsecured. In addition, in order to minimise the credit loss the Bank will seek additional collateral from the counterparty as soon as impairment indicators are identified for the relevant individual loans and advances.
The Bank has established the Risk Committee to assist the Board in assessing the different types of risk to which the Bank is exposed, as well as its risk management structure, organisation and processes.
The Board’s Risk committee is responsible for monitoring compliance with the Bank’s risk management policies and procedures, and for reviewing the adequacy of the risk management framework in relation to the risks faced by the Bank.
The Board Audit Committee is assisted in its oversight role by the Internal Audit Unit. The Internal Audit Unit undertakes both regular and ad hoc reviews over risk management controls and procedures, the results of which are reported to the Audit Committee.
The Bank defines risk as the possibility of losses or profits foregone, which may be caused by internal or external factors.
The risks arising from financial instruments to which the Bank is exposed are financial risks, which include credit risk, liquidity risk, market risk and operational risk.
3.1 Credit risk
Credit risk is the risk of suffering financial loss, should any of the Bank’s customers, clients or market counterparties fail to fulfill their contractual obligations to the Bank. Credit risk arises mainly from corporate and consumer loans and advances, credit cards, and loan commitments arising from such lending activities, but can also arise from credit enhancement provided, financial guarantees, letters of credit, and acceptances.
The Bank is also exposed to other credit risks arising from investments in debt securities and other exposures arising from its trading activities (“trading exposures”), including non-equity trading portfolio assets, derivatives, settlement balances with market counterparties and repurchase agreements.
Credit risk is the single largest risk for the Bank’s business; management therefore carefully manages its exposure to credit risk.
3.1.1 Credit risk measurement
(a) Loans and advances to customers (including loan commitments and guarantees)
With respect to loans and advances to customers, the Bank rates its counterparties based on its internal rating system (established by reference to the Supervisory Rating Model set by the Central Bank of Lebanon):
Performing loans:
• Normal – the loan is expected to be repaid on a timely and consistent basis;• Follow-up – the loan is expected to be repaid but the client’s file is not complete;• Special mention – the loan is expected to be repaid but current conditions lead to believe that the
probability of repayment would be lowered;
Non-performing loans:
• Sub-standard – client’s ability to repay is dependent on the amelioration of financial position or liquidation of collateral(s) on hand;
• Doubtful – probability of loss upon settlement of loan even after taking into consideration liquidation of

56
Bank’s rating (based on the Supervisory Grading System)
2015Credit risk exposure
(%)
2015 Impairment provision
(%)1
2014Credit risk exposure
(%)
2014 Impairment provision
(%)1
1. Performing (normal, follow up & special mention) 95% 1% 95% 1%
2. Sub-standard 1% 26% 1% 15%
3. Doubtful 3% 71% 3% 81%
4. Bad 1% 100% 1% 100%
100% 100%
The total impairment constitutes 5% (2014 - 5%) of the total gross loans portfolio.
3.1.4 Maximum exposure to credit risk before collateral held or other credit enhancements
Credit risk exposures relating to on-balance sheet assets are as follows:
Maximum exposure2015
LL Million2014
LL Million
AssetsBalances with Central Banks 1,377,507 1,285,756
Deposits with banks and financial institutions 1,278,673 924,894
Loans and advances to customers
Loans to individuals
- Mortgages 435,293 379,784
- Personal 112,634 103,548
- Car 101,590 89,676
- Other Retail 51,586 43,988
Loans to corporate entities
- Large corporate customers 700,780 1,105,232
- Small and medium size enterprises (“SMEs”) 950,060 377,389
- Subsidised loans 98,734 89,821
- Kafalat loans 22,095 22,801
Debtors by acceptances 63,525 71,313
Investment securities at fair value through profit or loss (debt securities) 188,632 128,423
Investment securities at amortised cost 3,480,039 3,316,252
Other assets 23,750 19,494
At 31 December 8,884,898 7,958,371
Collateral held as security for financial assets other than loans and advances to customers is determined by the nature of the instrument. Debt securities, treasury and other eligible bills are generally unsecured. Reverse repurchase agreements are collateralised by the Central Bank of Lebanon Certificates of Deposit (note 6) for the period of the facility.
(b) Master netting arrangements
The Bank further controls its exposure to credit losses by entering into master netting arrangements with counterparties with which it undertakes a significant volume of transactions. Master netting arrangements do not generally result in an offset of balance sheet assets and liabilities, as transactions are usually settled on a gross basis. However, the credit risk associated with favourable contracts is reduced by a master netting arrangement to the extent that if a default occurs, all amounts with the counterparty are terminated and settled on a net basis.
(c) Financial covenants (for credit related commitments and loan books)
The primary purpose of these conditions is to ensure that funds are available to a customer as required. Guarantees and standby letters of credit carry the same credit risk as loans. Documentary and commercial letters of credit - which are written undertakings by the Bank on behalf of a customer authorising a third party to draw drafts on the Bank up to a stipulated amount under specific terms and conditions - are collateralised by the underlying shipments of goods to which they relate in addition to a cash collateral as set by the credit committee (based on the credit rating of the customer, usually a margin of no less than 15% is requested in compliance with BDL basic circular no. 52) and therefore carry less risk than a direct loan.
Commitments to extend credit represent unused portions of authorisations to extend credit in the form of loans, guarantees or letters of credit. With respect to credit risk on commitments to extend credit, the Bank is potentially exposed to loss in an amount equal to the total unused commitments.
The Bank monitors the term to maturity of credit commitments because longer-term commitments generally have a greater degree of credit risk than shorter-term commitments.
3.1.3 Impairment and provisioning policies
Impairment allowances are only recognised for losses that have been incurred at the date of the balance sheet based on objective evidence of impairment (refer to note 2.11). Accordingly, the internal and external rating systems described in note 3.1.1 are used as indicators for impairment.
The impairment allowance shown in the separate financial statements at year-end is derived from each of the six internal supervisory rating grades of loans. The largest component of impairment allowance comes from the doubtful grade. The table below shows the percentage of loans and advances and the associated impairment provision for each of the Bank’s internal rating categories:
1 The impairment provision is shown above as a percentage of gross loans in their respective categories.

58
Lebanon LL Million
Arab countries LL Million
United States
LL Million
European countries LL Million
Other countries LL Million
Total LL Million
Financial assetsBalances with Central Banks 1,298,145 78,781 - 581 - 1,377,507
Deposits with banks and financial institutions 659,091 208,049 261,998 143,200 6,335 1,278,673
Loans and advances to customers 2,152,007 233,912 790 57,922 28,141 2,472,772
Debtors by acceptances 50,202 6,705 - 5,355 1,263 63,525
Investment securities at fair value through profit or loss (debt securities)
188,632 - - - - 188,632
Investment securities at amortised cost 3,391,396 7,707 25,509 47,779 7,648 3,480,039
Other assets 23,608 8 - 134 - 23,750
At 31 December 2015 7,763,081 535,162 288,297 254,971 43,387 8,884,898Financial assetsBalances with Central Banks 1,165,784 119,493 - 479 - 1,285,756
Deposits with banks and financial institutions 533,552 28,618 235,532 123,137 4,055 924,894
Loans and advances to customers 1,922,466 212,931 1,008 45,602 30,232 2,212,239
Debtors by acceptances 62,370 7,260 - - 1,683 71,313
Investment securities at fair value through profit or loss (debt securities)
128,423 - - - - 128,423
Investment securities at amortised cost 3,196,421 12,415 10,863 85,690 10,863 3,316,252
Other assets 19,010 8 - 476 - 19,494
At 31 December 2014 7,028,026 380,725 247,403 255,384 46,833 7,958,371
3.1.5 Loans and advances
Loans and advances are summarised as follows:
2015 2014
Loans and advances to customers LL Million
Loans and advances to banks LL Million
Loans and advances to customers LL Million
Loans and advances to
banks LL Million
Neither past due nor impaired 2,330,207 1,278,673 2,116,893 924,894
Past due but not impaired 147,380 - 101,964 -
Individually impaired 118,421 - 110,671 -
Gross 2,596,008 1,278,673 2,329,528 924,894
Less: allowance for impairment (123,236) - (117,289) -
Net 2,472,772 1,278,673 2,212,239 924,894
Individually impaired (91,082) - (85,849) -
Collective allowance (32,154) - (31,440) -
Total (123,236) - (117,289) -
Credit risk exposures relating to off-balance sheet items are as follows:
Maximum exposure
2015LL Million
2014LL Million
Loan commitment (unused facilities) 472,733 426,580
Letters of guarantee 190,160 180,960
Letters of credit 120,447 106,336
783,340 713,876
The above table represents a worst case scenario of credit risk exposure to the Bank at 31 December 2015 and 2014, without taking account of any collateral held or other credit enhancements attached. For on-balance sheet assets, the exposures set out above are based on net carrying amounts as reported in the balance sheet.
The above table for 2015 shows the split between large corporate and SME loans based on the revised BDL circular no. 396 issued on 8 September 2015. 2014 figures have not been restated in line with the new circular.
As shown above, 41% of the total maximum exposure is derived from investment securities (2014 - 43%); 28% is derived from loans and advances to customers (2014 - 28%) and 16% is derived from balances with Central Banks (2014 - 16%).
Management is confident in its ability to continue to control and sustain acceptable exposure of credit risk to the Bank resulting from both its loans and advances portfolio and debt securities based on the following:
• 61% of the Bank’s debt securities portfolio is allocated to Lebanese treasury bills (2014 - 65 %), of which 61% is denominated in Lebanese pounds (2014 - 62%), whose risk of default is considered nil, and
• 35% of the Bank’s debt securities portfolio classified at amortised cost is allocated to certificates of deposits issued by the Central Bank of Lebanon (2014 - 30%), of which 80% is denominated in Lebanese pounds (2014 - 79%), whose risk of default is considered nil.
• 95% of the loans and advances portfolio is categorised in the top two grades of the internal rating system i.e. classified as performing (2014 - 95%);
• 48% of the gross loans and advances portfolio is fully collateralised and the net exposure (gross loan amount less provisions and collaterals) represents 1% of the total gross loans and advances portfolio;
• 90% of the loans and advances portfolio are considered to be neither past due nor impaired (2014 - 91%); • 30% of balances with Central Banks are placed in local currency, whose risk of default is considered nil.
Concentration of risks of financial assets with credit risk exposure
The following table breaks down the Bank’s credit exposure at their carrying amounts (without taking into account any collateral held or other credit support), as categorised by geographical region as at 31 December 2015 and as at 31 December 2014. For this table, the Bank has allocated exposures to regions based on the destination of use of funds.

60
(b) Loans and advances past due but not impaired
Late processing and other administrative delays on the side of the borrower can lead to a financial asset being past due but not impaired. Therefore, loans and advances past due are not usually considered impaired, unless other information is available to indicate the contrary. Gross amount of loans and advances to customers that were past due but not impaired broken down by class were as follows:
Individuals (retail customers) Corporate entities
Mortgages LL
Million
Personal LL
Million
Car LL
Million
OtherRetail
LL Million
Large corporate customers
LL Million
SMEs LL
Million
Subsidized LL
Million
Kafalat LL
Million
Total LL
Million
Past due:
Up to 30 days 10,350 10,110 4,694 2,462 38,373 17,481 9,100 645 93,215
30-60 days - 259 483 368 4,413 26,124 - 418 32,065
60-90 days - 67 75 69 - 4,859 400 - 5,470
Above 90 days - 142 536 172 698 14,090 834 158 16,630
At 31 December 2015 10,350 10,578 5,788 3,071 43,484 62,554 10,334 1,221 147,380Fair value of collateral 14,271 7,453 31,712 3,060 74,066 105,009 26,867 1,514 263,952
Individuals (retail customers) Corporate entities
Mortgages LL
Million
Personal LL
Million
Car LL
Million
OtherRetail
LL Million
Large corporate customers
LL Million
SMEs LL
Million
Subsidized LL
Million
Kafalat LL
Million
Total LL
Million
Past due:
Up to 30 days 8,128 10,530 3,275 1,855 19,877 6,343 6,128 1,020 57,156
30-60 days - 665 1,045 355 4,575 4,219 - 224 11,083
60-90 days - 249 177 72 11,151 2,025 - - 13,674
Above 90 days 233 459 341 208 7,161 9,989 1,465 195 20,051
At 31 December 2014 8,361 11,903 4,838 2,490 42,764 22,576 7,593 1,439 101,964Fair value of collateral 12,533 9,168 18,540 2,679 108,554 48,488 13,033 1,255 214,250
The above table for 2015 shows the split between large corporate and SME loans based on the revised BDL circular no. 396 issued on 8 September 2015.2014 figures have not been restated in line with the new circular.
Upon initial recognition of loans and advances, the fair value of collateral is based on valuation techniques commonly used for the corresponding assets. In subsequent periods, the fair value is assessed by reference to market price or by using valuation techniques with updated market data.
The total impairment charge for loans and advances is LL 123.24 billion (2014 - LL 117.29 billion) of which LL 91.08 billion (2014 - LL 85.85 billion) represents the individually impaired loans and the remaining amount of LL 32.15 billion (2014 - LL 31.44 billion) represents the collective allowance. Further information of the impairment allowance for loans and advances with banks and financial institutions and to customers is provided in notes 6 and 7.
During the year 31 December 2015, the Bank’s total loans and advances increased by 20% as a result of the expansion of the lending business in Baghdad and Lebanon branches and focused efforts in retail business.
(a) Loans and advances neither past due nor impaired
The credit quality of the portfolio of loans and advances to customers that were neither past due nor impaired can be assessed by reference to the internal rating system adopted by the Bank.
Individuals (retail customers) Corporate entities
Mortgages LL
Million
Personal LL
Million
Car LL
Million
OtherRetail
LL Million
Large corporate customers
LL Million
SMEs LL
Million
Subsidized LL
Million
Kafalat LL
Million
Total LL
MillionGrades:
1. Normal 420,094 102,268 96,270 48,269 546,012 776,185 81,770 18,973 2,089,841
2. Follow-up 6,573 677 144 711 48,282 26,012 5,084 827 88,310
3. Special mention 2,522 440 377 191 72,676 75,850 - - 152,056
At 31 December 2015 429,189 103,385 96,791 49,171 666,970 878,047 86,854 19,800 2,330,207
Individuals (retail customers) Corporate entities
Mortgages LL
Million
Personal LL
Million
Car LL
Million
OtherRetail
LL Million
Large corporate customers
LL Million
SMEs LL
Million
Subsidized LL
Million
Kafalat LL
Million
Total LL
MillionGrades:
1. Normal 367,629 92,794 85,607 41,421 1,033,314 348,436 77,633 18,865 2,065,699
2. Follow-up 7,145 251 184 600 23,134 2,137 3,480 529 37,460
3. Special mention 519 15 37 76 10,434 2,652 - 1 13,734
At 31 December 2014 375,293 93,060 85,828 42,097 1,066,882 353,225 81,113 19,395 2,116,893
The above table for 2015 shows the split between large corporate and SME loans based on the revised BDL circular no. 396 issued on 8 September 2015.2014 figures have not been restated in line with the new circular.

62
2015LL Million
2014 LL Million
Loans and advances to customers - individualsTerm loans - performing loans 1,715 1,030
Term loans - non-performing loans 4,206 3,916
5,921 4,946
3.1.6 Debt securities
The table below presents an analysis of debt securities by rating agency designation at 31 December 2015 and 2014, based on Standard & Poor’s ratings:
From AAA+
to AAA- LL
Million
From AA+ to
AA- LL
Million
From A+ to A-
LL Million
From BBB+ to
BBB-LL
Million
From BB+
to BB-LL
Million
From B+ to B-
LL Million
TotalLL
MillionInvestment securities at fair value through profit or loss (debt securities)
- - - - - 188,632 188,632
Investment securities at amortised cost - - 56,253 28,232 3,044 3,392,510 3,480,039
At 31 December 2015 - - 56,253 28,232 3,044 3,581,142 3,668,671
From AAA+
to AAA- LL
Million
From AA+ to
AA- LL
Million
From A+ to A-
LL Million
From BBB+ to
BBB-LL
Million
From BB+
to BB-LL
Million
FromB+ to B-
LLMillion
TotalLL
MillionInvestment securities at fair value through profit or loss (debt securities)
- - - - - 128,423 128,423
Investment securities at amortised cost - 6,208 99,320 11,199 3,104 3,196,421 3,316,252
At 31 December 2014 - 6,208 99,320 11,199 3,104 3,324,844 3,444,675
3.1.7 Repossessed collateral
The Bank obtained assets by taking possession of collateral held as security, as follows:
2015LL Million
2014LL Million
Nature of assetsResidential property- carrying amount 431 5,066
Under the requirements of the Central Bank of Lebanon, repossessed properties (against facilities provided locally) should be sold as soon as practicable, with the proceeds used to reduce the outstanding indebtedness. Repossessed property is classified in the balance sheet within assets classified as held for sale (note 16).
(c) Loans and advances individually impaired
The breakdown of the gross amount of individually impaired loans and advances by class, along with the fair value of related collateral held by the Bank as a security, are as follows:
(i) Loans and advances to customers
At 31 December 2015
Individuals (retail customers) Corporate entities
Mortgages LL
Million
Personal LL
Million
Car LL
Million
OtherRetail
LL Million
Large corporate customers
LL Million
SMEs LL
Million
Subsidized LL
Million
Kafalat LL
Million
TotalLL
MillionGross amount 2,549 1,418 1,078 462 - 104,556 5,388 2,970 118,421Fair value of collateral 3,586 12 3,284 339 - 62,415 4,383 2,048 76,067
At 31 December 2014
Individuals (retail customers) Corporate entities
Mortgages LL
Million
Personal LL
Million
Car LL
Million
OtherRetail
LL Million
Large corporate customers
LL Million
SMEs LL
Million
Subsidized LL
Million
Kafalat LL
Million
TotalLL
MillionGross amount 2,540 1,291 1,030 161 41,227 56,840 4,001 3,581 110,671Fair value of collateral 3,022 7 1,645 58 21,211 43,260 4,432 2,082 75,717
The above table for 2015 shows the split between large corporate and SME loans based on the revised BDL circular no. 396 issued on 8 September 2015.2014 figures have not been restated in line with the new circular.
(ii) Loans and advances to banks and financial institutions
The total amount of individually impaired balances with banks and financial institutions as at 31 December 2015 was nil (2014 - nil). No collateral is held by the Bank, and no impairment provision (2014 - nil) has been recognised.
(d) Loans and advances renegotiated
Restructuring activities include extended payment arrangements, approved external management plans, modification and deferral of payments. Following restructuring, a previously overdue customer account is reset to a normal status and managed together with other similar accounts. Restructuring policies and practices are based on indicators or criteria that, in the judgement of management, indicate that payment will most likely continue. Restructuring is most commonly applied to term loans. As shown below, restructuring is not proving to be effective as the asset continues to be impaired:

64
• Net exposure by currencies should not exceed 1% of Tier I capital.• Gross exposure (in absolute terms) by currencies should not exceed 40% of Tier I capital (as defined by
BDL circular no. 43).
The above mentioned limits are set with reference to BDL basic circular no. 32. These limits are closely monitored on a daily basis by the Bank’s Treasury department on a daily basis.
The table below summarises the Bank’s exposure to foreign currency exchange rate risk at31 December 2015 and 2014. Included in the table are the Bank’s financial instruments at carrying amounts, categorised by currency.
At 31 December 2015
LBP LL Million
USD LL Million
EUR LL Million
GBP LL Million
Others LL Million
Total LL Million
FINANCIAL ASSETSCash and balances with Central Banks 449,710 909,525 90,203 730 37,515 1,487,683
Deposits with banks and financial institutions 69,127 1,084,710 78,751 24,181 21,904 1,278,673
Loans and advances to customers 669,279 1,671,097 70,037 49,144 13,215 2,472,772
Debtors by acceptances - 48,922 10,254 - 4,349 63,525
Investment securities at fair value through profit or loss (debt securities)
161,304 18,897 8,431 - - 188,632
Investment securities at amortised cost 2,254,392 1,146,785 74,193 4,669 - 3,480,039
Other assets 10,685 11,999 144 - 922 23,750
Total financial assets 3,614,497 4,891,935 332,013 78,724 77,905 8,995,074FINANCIAL LIABILITIESDeposits from banks and financial institutions 67,951 136,778 81,396 1 42 286,168
Deposits from customers 3,273,621 4,407,499 243,019 75,959 51,874 8,051,972
Engagements by acceptances - 48,922 10,254 - 4,349 63,525
Other liabilities 9,908 1,690 806 - 83 12,487
Total financial liabilities 3,351,480 4,594,889 335,475 75,960 56,348 8,414,152Net on-balance sheet financial position 263,017 297,046 (3,462) 2,764 21,557 580,922Credit commitments 69,222 622,106 63,027 352 28,633 783,340
3.2 Market risk
The Bank takes on exposure to market risks, which is the risk that the fair value or future cash flows of a financial instrument will fluctuate because of changes in market prices. Market risks arise from open positions in interest rate, currency and equity products, all of which are exposed to general and specific market movements and changes in the level of volatility of market rates or prices such as interest rates, foreign exchange rates and equity prices. The Bank separates exposures to market risk into either trading or non-trading portfolios.
The Board of Directors sets limits for the acceptable level of risks that can be assumed on the trading book. ALCO is responsible of managing the Bank’s exposure to the various market risk and to ensure that risks are within acceptable limits.
Trading portfolios include those positions arising from market-making transactions where the Bank acts as principal with clients or with the market. Non-trading portfolios primarily arise from the interest rate management of the entity’s retail and commercial banking assets and liabilities. Non-trading portfolios also consist of foreign exchange and equity risks arising from the Bank’s investment securities.
3.2.1 Market risk measurement techniques
The major measurement technique used to measure and control market risk is outlined below.
Sensitivity analysis
A technique used to determine how different values of an independent variable will impact a particular dependent variable under a given set of assumptions. This technique is used within specific boundaries that will depend on one or more input variables, such as the effect that changes in interest rates will have on a bond’s price. Sensitivity analysis is a way to predict the outcome of a decision if a situation turns out to be different compared to the key predictions. The Bank performs this analysis for each type of market risk to which the Bank is exposed at each reporting date, showing how profit or loss and equity would have been affected by changes in the relevant risk variable that were reasonably possible at that date.
Interest rate risk
If the interest rate increases/decreases by 2%, the net effect [gain/(loss)] is as follows:
2015 2014
USD LL Million
LBPLL Million
USD LL Million
LBPLL Million
Effect on profit 100 (10,980) 591 (5,745)
There is no impact on Lebanese denominated financial instruments as they are held at amortised cost and carry fixed interest rates.
3.2.2 Foreign exchange risk
The Bank takes on exposure to the effects of fluctuations in the prevailing foreign currency exchange rates on its balance sheet and cash flows. The Board of Directors sets limits on the level of exposure by currency as follows:

66
At 31 December 2015
Up to 1 month
LL Million
1 – 3 months
LL Million
3 – 12 months
LL Million
1 – 5 years
LL Million
Over 5 years
LL Million
Non interest bearing
LL MillionTotal
LL MillionFINANCIAL ASSETSCash and balances with Central Banks
135,349 91,034 62,207 515,278 277,154 406,661 1,487,683
Deposits with banks and financial institutions
658,912 237,372 204,666 1,603 - 176,120 1,278,673
Loans and advances to customers 861,494 229,578 806,298 461,205 78,704 35,493 2,472,772
Debtors by acceptances - - - - - 63,525 63,525
Investment securities at fair value through profit or loss (debt securities)
- 5,143 - 20,134 163,355 - 188,632
Investment securities at amortised cost
17,177 41,447 203,355 1,748,402 1,469,658 - 3,480,039
Other assets - - - - - 23,750 23,750
Total financial assets 1,672,932 604,574 1,276,526 2,746,622 1,988,871 705,549 8,995,074FINANCIAL LIABILITIESDeposits from banks and financial institutions
185,977 50,213 41,918 6,628 - 1,432 286,168
Deposits from customers 5,798,384 648,572 761,637 240,887 4,940 597,552 8,051,972
Engagements by acceptances - - - - - 63,525 63,525
Other liabilities - - - - - 12,487 12,487
Total financial liabilities 5,984,361 698,785 803,555 247,515 4,940 674,996 8,414,152 Total interest repricing gap (4,311,429) (94,211) 472,971 2,499,107 1,983,931
At 31 December 2014
LBP LL Million
USD LL Million
EUR LL Million
GBP LL Million
Others LL Million
Total LL Million
FINANCIAL ASSETSCash and balances with Central Banks 378,099 841,042 100,545 1,349 55,499 1,376,534
Deposits with banks and financial institutions 55,062 770,364 43,166 15,365 40,937 924,894
Loans and advances to customers 634,083 1,465,603 51,809 40,751 19,993 2,212,239
Debtors by acceptances 25 65,816 3,875 31 1,566 71,313
Investment securities at fair value through profit or loss (debt securities)
106,265 12,515 9,643 - - 128,423
Investment securities at amortised cost 2,103,498 1,138,949 73,805 - - 3,316,252
Other assets 7,822 10,241 486 - 945 19,494
Total financial assets 3,284,854 4,304,530 283,329 57,496 118,940 8,049,149FINANCIAL LIABILITIESDeposits from banks and financial institutions
134,756 76,488 56,993 1 15,325 283,563
Deposits from customers 2,868,818 3,916,497 226,720 58,105 75,559 7,145,699
Engagements by acceptances 25 65,816 3,875 31 1,566 71,313
Other liabilities 8,887 1,807 779 - 301 11,774
Total financial liabilities 3,012,486 4,060,608 288,367 58,137 92,751 7,512,349Net on-balance sheet financial position 272,368 243,922 (5,038) (641) 26,189 536,800Credit commitments 69,741 545,306 60,357 6,925 31,547 713,876
3.2.3 Interest rate risk
There is no cash flow interest rate risk on Lebanese denominated financial instruments as they are held at amortised cost and carry fixed interest rates. Fair value interest rate risk is the risk that the value of a financial instrument will fluctuate because of changes in market interest rates. The Bank takes on exposure to the effects of fluctuations in the prevailing levels of market interest rates on both its fair value and cash flow risks. Interest margins may increase as a result of such changes but may reduce losses in the event that unexpected movements arise. The Board sets limits on the level of mismatch of interest rate repricing that may be undertaken, which is monitored daily by the Treasury department.
The table below summarises the Bank’s exposure to interest rate risks. It includes the Bank’s financial instruments at carrying amounts, categorised by the earlier of contractual repricing (for example for floating rate notes) or maturity dates.

68
3.3.1 Liquidity risk management process
The Bank’s liquidity management process, as carried out within the Bank and monitored by the Treasury department, includes:
• Day-to-day funding, managed by monitoring future cash flows to ensure that requirements can be met.This includes replenishment of funds as they mature or are borrowed by customers. The Bank maintains an active presence in global money markets to enable this to happen;
• Maintaining a portfolio of highly marketable assets that can be easily liquidated as protection against any unforeseen interruption to cash flow;
• Monitoring the liquidity ratios of the balance sheet against internal and regulatory requirements (BDLbasic circulars no. 72, 73, 84, 86 and 87); and
• Managing the concentration and profile of debt maturities.
Monitoring and reporting take the form of cash flow measurement and projections for the next day, week and month respectively, as these are key periods for liquidity management. The starting point for those projections is an analysis of the contractual maturity of the financial liabilities and the expected collection date of the financial assets (note 3.3.3).
3.3.2 Non-derivative financial liabilities and assets held for managing liquidity risk
The table below presents the cash flows payable by the Bank under non-derivative financial liabilities and assets held for managing liquidity risk by remaining contractual maturities at the date of the balance sheet. The amounts disclosed in the table are the contractual undiscounted cash flows, whereas the Bank manages the liquidity risk based on a different basis (see note 3.3.1), not resulting in a significantly different analysis.
At 31 December 2015
Up to 1 month
LL Million
1 – 3 months
LL Million
3 – 12 months
LL Million
1 – 5 years
LL Million
Over 5 years
LL MillionTotal
LL MillionASSETSCash and balances with the Central Banks 541,165 90,494 61,920 530,847 478,607 1,703,033
Deposits with banks and financial institutions 833,825 237,492 206,179 1,859 - 1,279,355
Investment securities at fair value through profit or loss (debt securities)
373 6,126 11,892 70,927 217,546 306,864
Investment securities at amortised cost 31,269 81,898 376,552 2,384,360 1,770,603 4,644,682
Total financial assets 1,406,632 416,010 656,543 2,987,993 2,466,756 7,933,934LIABILITIESDeposits from banks and financial institutions 186,970 50,156 41,925 6,953 - 286,004
Deposits from customers 6,378,578 650,995 781,393 273,400 8,821 8,093,187
Engagements by acceptances 63,525 - - - - 63,525
Other liabilities 12,487 - - - - 12,487
Total liabilities 6,641,560 701,151 823,318 280,353 8,821 8,455,203Net financial (liabilities) / assets (5,234,928) (285,141) (166,775) 2,707,640 2,457,935 (521,269)
At 31 December 2014
Up to 1 month
LL Million
1 – 3 months
LL Million
3 – 12 months
LL Million
1 – 5 years
LL Million
Over 5 years
LL Million
Non interest bearing
LL MillionTotal
LL MillionFINANCIAL ASSETSCash and balances with Central Banks
37,957 106,279 53,139 502,281 277,342 399,536 1,376,534
Deposits with banks and financial institutions
440,731 140,201 160,843 2,003 - 181,116 924,894
Loans and advances to customers 717,845 221,421 722,290 416,278 91,388 43,017 2,212,239
Debtors by acceptances - - - - - 71,313 71,313
Investment securities at fair value through profit or loss (debt securities)
- - 10,274 25,354 92,795 - 128,423
Investment securities at amortised cost
85,385 36,386 275,037 1,438,995 1,480,449 - 3,316,252
Other assets - - - - - 19,494 19,494
Total financial assets 1,281,918 504,287 1,221,583 2,384,911 1,941,974 714,476 8,049,149FINANCIAL LIABILITIESDeposits from banks and financial institutions
264,411 4,601 568 6,618 - 7,365 283,563
Deposits from customers 5,489,976 458,520 676,827 192,963 664 326,749 7,145,699
Engagements by acceptances - - - - - 71,313 71,313
Other liabilities - - - - - 11,774 11,774
Total financial liabilities 5,754,387 463,121 677,395 199,581 664 417,201 7,512,349Total interest repricing gap (4,472,469) 41,166 544,188 2,185,330 1,941,310
3.3 Liquidity risk
Liquidity risk is the risk that the Bank is unable to meet its obligations when they fall due as a result of customer deposits being withdrawn, cash requirements from contractual commitments, or other cash outflows, such as debt maturities. Such outflows would deplete available cash resources for client lending, trading activities and investments. In extreme circumstances, lack of liquidity could result in reductions in the balance sheet and sales of assets, or potentially an inability to fulfill lending commitments. The risk that the Bank will be unable to do so is inherent in all banking operations and can be affected by a range of institution-specific and market-wide events including, but not limited to, credit events, merger and acquisition activity, systemic shocks and natural disasters.

70
Quoted market prices – Level 1
Financial instruments are classified as Level 1 if their value is observable in an active market. Such instruments are valued by reference to unadjusted quoted prices for identical assets or liabilities in active markets where the quoted price is readily available, and the price represents actual and regularly occurring market transactions on an arm’s length basis. An active market is one in which transactions occur with sufficient volume and frequency to provide pricing information on an ongoing basis.
This category includes liquid government and corporate bonds actively traded through an exchange or clearing house, and actively traded listed equities.
Valuation technique using observable inputs – Level 2
Financial instruments classified as Level 2 have been valued using models whose most significant inputs are observable in an active market. Such valuation techniques and models incorporate assumptions about factors observable in an active market, which other market participants would use in their valuations, including interest rate yield curve, exchange rates, volatilities, prepayment and defaults rates.
This category includes liquid treasury and corporate bonds, certificates of deposits and balances with banks and the Central Banks.
Valuation technique using significant unobservable inputs – Level 3
Financial instruments are classified as Level 3 if their valuation incorporates significant inputs that are not based on observable market data (unobservable inputs). A valuation input is considered observable if it can be directly observed from transactions in an active market, or if there is compelling external evidence demonstrating an executable exit price. An input is deemed significant if it is shown to contribute more than 10% to the valuation of a financial instrument.
Unobservable input levels are generally determined based on observable inputs of a similar nature, historical observations or other analytical techniques.
The objective of the valuation techniques is to arrive at a fair value measurement that reflects the price that would be received to sell the assets or paid to transfer the liability in an order by transaction between market participants at the measurement date.
Availability of observable market prices and model inputs reduces the need for management judgment and estimation and also reduces the uncertainty associated with determining fair values.
(b) Financial instruments not measured at fair value
The following table sets out the fair values of financial instruments not measured at fair value and analyses them by the level in the fair value hierarchy into which each fair value measurement is categorized at 31 December 2015.
At 31 December 2014
Up to 1 month
LL Million
1 – 3 months
LL Million
3 – 12 months
LL Million
1 – 5 years
LL Million
Over 5 years
LL MillionTotal
LL MillionASSETSCash and balances with the Central Banks 437,225 105,552 52,785 523,773 453,858 1,573,193
Deposits with banks and financial institutions 621,267 140,363 162,284 2,389 - 926,303
Investment securities at fair value through profit or loss (debt securities)
45 163 19,140 57,690 128,120 205,158
Investment securities at amortised cost 97,036 82,116 427,603 2,060,800 1,759,511 4,427,066
Total financial assets 1,155,573 328,194 661,812 2,644,652 2,341,489 7,131,720LIABILITIESDeposits from banks and financial institutions 271,717 4,615 570 7,089 - 283,991
Deposits from customers 5,803,057 460,461 694,628 214,943 1,310 7,174,399
Engagements by acceptances 71,313 - - - - 71,313
Other liabilities 11,774 - - - - 11,774
Total liabilities 6,157,861 465,076 695,198 222,032 1,310 7,541,477Net financial (liabilities) / assets (5,002,288) (136,882) (33,386) 2,422,620 2,340,179 (409,757)
3.3.3 Assets held for managing liquidity risk
The Bank holds a diversified portfolio of cash and high-quality liquid securities to support payment obligations and contingent funding in a stressed market environment. The Bank’s assets held for managing liquidity risk comprises:
• Cash and balances with Central Banks;
• Lebanese treasury bills denominated in foreign currency that are easily liquidated in the secondarymarkets; and
• Secondary sources of liquidity in the form of current accounts and short-term placements (with maturities less than 3 months) with foreign banks.
• Lebanese Treasury bills denominated in local currency that are easily absorbed by the Central Bank of Lebanon in case of exceptional deposits withdrawals.
3.4 Fair value of financial instruments
The fair values of financial instruments that are traded in active markets are based on quoted market prices or dealer price quotations.
(a) Valuation models
The Bank measures fair values using the following fair value hierarchy, which reflects the significance of the inputs used in making the measurements.

72
The estimated fair value of fixed interest bearing deposits is based on discounted cash flows using prevailing money-market interest rates for debts with similar credit risk and remaining maturity.
(ii) Loans and advances to customers
Loans and advances are net of charges for impairment. The estimated fair value of loans and advances excluding overdrafts and impaired loans represents the discounted amount of estimated future cash flows expected to be received. Expected cash flows are discounted at current market rates to determine fair value.
The carrying amount of overdrafts is a reasonable approximation of fair value. For collateral-dependent impaired loans, the fair value is measured based on the value of the underlying collateral.
(iii) Investment securities at amortised cost
The fair value is based on market prices or broker/dealer price quotations. Where this information is not available, fair value is estimated using quoted market prices for securities with similar credit, maturity, and yield characteristics. For more information, refer to step (ii) above.
(iv) Deposits from banks and financial institutions and deposits from customers
The estimated fair value of deposits with no stated maturity, which includes non-interest-bearing deposits, is the amount repayable on demand.
The estimated fair value of fixed interest-bearing deposits is based on discounted cash flows using interest rates for new debts with similar remaining maturity.
(c) Financial instruments measured at fair value
At 31 December 2015
Level 1 LL Million
Level 2 LL Million
Total LL Million
Investment securities at fair value through profit or loss:
- Debt securities 27,327 161,305 188,632
- Equity securities 6,043 34,683 40,726
Total assets measured at fair value 33,370 195,988 229,358
At 31 December 2014
Level 1 LL Million
Level 2 LL Million
Total LL Million
Investment securities at fair value through profit or loss:
- Debt securities 22,157 106,266 128,423
- Equity securities 6,034 26,334 32,368
Total assets measured at fair value 28,191 132,600 160,791
At 31 December 2015
Level 1LL Million
Level 2LL Million
Totalfair valuesLL Million
Totalcarryingamount
LL MillionASSETSBalances with Central Banks (i) - 1,484,029 1,484,029 1,377,507
Deposits with banks and financial institutions (i) - 1,279,325 1,279,325 1,278,673
Loans and advances to customers (ii) - 2,516,052 2,516,052 2,472,772
Investment securities at amortised cost (iii) 1,195,003 2,182,351 3,377,354 3,480,039
Total financial assets 1,195,003 7,461,757 8,656,760 8,608,991LIABILITIESDeposits from banks and financial institutions (iv) - 286,168 286,168 286,168
Deposits from customers (iv) - 8,068,247 8,068,247 8,051,972
Total financial liabilities - 8,354,415 8,354,415 8,338,140
The following table sets out the fair values of financial instruments not measured at fair value and analyses them by the level in the fair value hierarchy into which each fair value measurement is categorized at 31 December 2014.
At 31 December 2014
Level 1LL Million
Level 2LL Million
Totalfair valuesLL Million
Totalcarryingamount
LL MillionASSETSBalances with Central Banks (i) - 1,292,062 1,292,062 1,285,756
Deposits with banks and financial institutions (i) - 926,304 926,304 924,894
Loans and advances to customers (ii) - 2,248,091 2,248,091 2,212,239
Investment securities at amortised cost (iii) 1,095,686 2,046,158 3,141,844 3,316,252
Total financial assets 1,095,686 6,512,615 7,608,301 7,739,141LIABILITIESDeposits from banks and financial institutions (iv) - 283,990 283,990 283,563
Deposits from customers (iv) - 7,159,706 7,159,706 7,145,699
Total financial liabilities - 7,443,696 7,443,696 7,429,262
The fair value of financial assets and liabilities reflects the amount at which the instrument could be exchanged in a current transaction between willing parties, other than in a forced or liquidation sale. Financial assets and liabilities are classified according to a hierarchy that reflects the significance of observable market inputs.
(i) Balances with Central Banks and deposits with banks and financial institutions
The carrying amount of floating rate placements, overnight deposits, items in the course of collection, and current accounts (i.e. maturity less than 1 year) is a reasonable approximation of fair value.

74
Common Equity Tier 1 (“CET 1”)
2015LL Million
2014LL Million
Share capital and contributions to capital 149,439 149,439
Reserves (excluding profit for the year) 161,166 143,834
Retained earnings 229,821 204,149
Less: regulatory adjustmentsIntangible assets (4,959) (6,904)
Total CET 1 535,467 490,518
Additional Tier 1 Capital (“AT 1”)
Non-cumulative preferred shares and similar financial instruments 120,864 120,864
Total qualifying Tier 1 Capital 656,331 611,382
Tier 2 Capital (real estate revaluation reserve) 10,000 10,000
Total regulatory capital (Tier1 + Tier2) 666,331 621,382
Risk- weighted assets
2015LL Million
2014LL Million
Credit risk 4,439,849 4,070,507
Market risk 151,593 86,860
Operational risk 313,132 303,002
Total risk-weighted assets 4,904,574 4,460,368
The Bank’s capital adequacy ratios as compared to supervisory requirements are shown below:
BBAC Supervisory Basel III2015 2014 2015 2014 2015
Common Equity Tier 1 Ratio 10.92% 11.0% 8% 7% 4.5%Tier 1 Capital Ratio 13.38% 13.71% 10% 9.5% 6%Total Capital Ratio 13.59% 13.93% 12% 11.5% 8%
4 Critical accounting estimates and judgements
Estimates and judgements are continually evaluated and are based on historical experience and other factors, including expectations of future events that are believed to be reasonable under the circumstances.
3.5 Operational risk
Operational risk is the risk of loss arising from inadequate or failed internal processes, systems failure, human error, or from external events. When controls fail to perform, it can lead to legal or regulatory implications, or financial/reputational loss. The Bank has set its policies and procedures to identify, assess, monitor, control and mitigate operational risk in addition to other types of risks relating to the banking and financial activities of the Bank as part of overall risk management activities.
Within the risk management framework the operational risk section, performs its functions in accordance with BCC circular no. 252. This section is continuously working on the following areas:
• Update of the comprehensive loss events database and creation of risk registers;• Risk and controls self-assessments;• Thorough assessment for all new products introduced by the Bank;• Business continuity planning; and• Training and awareness sessions.
Compliance with the Bank’s policies and procedures and regulatory requirements are supported by a program of periodic reviews undertaken by the internal audit department. The results of Internal Audit reviews are discussed with the Audit Committee and senior management of the Bank and action plans are set for resolution of any issues. Insurance coverage is used as an external mitigation and is set in line with the Bank’s depth of operations.
3.6 Capital management
The Bank’s objectives when managing capital, which is a broader concept than the ‘equity’ on the face of the Balance sheet, are:
• To comply with the capital requirements set by the regulators of the banking markets where the Bank operates;• To safeguard the Bank’s ability to continue as a going concern so that it can continue to provide returns for shareholders and benefits for other stakeholders; and• To maintain a strong capital base to support the development of its business.
Capital adequacy and the use of regulatory capital are regularly managed by the Bank’s management, employing techniques, as requested by the Central Bank of Lebanon, (based on the guidelines developed by the Basel Committee). The required information is filed with the regulator on a semi-annual basis.
As per the Central Bank of Lebanon directives, all banks are required to hold a minimum level of regulatory capital of LL 10 billion for the head office and LL 500 million per local branch and LL 1.5 billion per foreign branch. In addition all the Bank’s branches located outside Lebanon are subject to capital requirements of their respective jurisdiction (i.e. Cyprus and Iraq).
The regulatory capital requirements are strictly observed when managing economic capital. The Bank complied with all capital ratios requirements throughout the period.
The table below summarises the composition of regulatory capital ratios for the years ended 31 December 2015 and 2014. The computation of the capital adequacy ratio was performed in accordance with the directives issued by the Banking Control Commission of Lebanon (BCCL memo no. 5/2016).

76
Lebanese government securities that have terms to maturity approximating the terms of the related liability.
If the discount rate differed by +/- 0.5% from management’s estimates, the carrying amount of the pension obligations would decrease/increase by approximately LL 1,332 million.
4.2 Critical judgements in applying the Bank’s accounting policies
In the process of applying the Bank’s accounting policies, management has made the following judgments, apart from those involving estimations, which have the most significant effect in the amounts recognised in the financial statements:
Going concern
The Bank’s management has made an assessment of the Bank’s ability to continue as a going concern and is satisfied that the Bank has the resources to continue in business for the foreseeable future. Furthermore, management is not aware of any material uncertainties that may cast significant doubt upon the Bank’s ability to continue as a going concern. Therefore, the financial statements continue to be prepared on the going concern basis.
Business model
In making an assessment whether a business model’s objective is to hold assets in order to collect contractual cash flows, the Bank considers at which level of its business activities such assessment should be made. Generally, a business model is a matter of fact which can be evidenced by the way business is managed and the information provided to management. However, in some circumstances it may not be clear whether a particular activity involves one business model with some infrequent asset sales or whether the anticipated sales indicate that there are two different business models.
In determining whether its business model for managing financial assets is to hold assets in order to collect contractual cash flows the Bank considers:
• Management’s stated policies and objectives for the portfolio and the operation of those policies in practice; • how management evaluates the performance of the portfolio;• whether management’s strategy focuses on earning contractual interest revenues;• the degree of frequency of any expected asset sales;• the reason for any asset sales; and• whether assets that are sold are held for an extended period of time relative to their contractual maturity.
4.1 Critical accounting estimates and assumptions
The Bank makes estimates and assumptions concerning the future. The resulting accounting estimates will, by definition, seldom equal the related actual results. The estimates and assumptions that have a significant risk of causing a material adjustment to the carrying amounts of assets and liabilities within the next financial year are addressed below.
(a) Impairment losses on loans and advances to clients
The Bank reviews its loan portfolios to assess impairment at least on semi-annual basis. Specific impairment provisions are determined by assessing each client facility individually. The factors taken into consideration for the individual assessment include the counterparty’s credit limit, the counterparty’s ability to generate cash flows sufficient to settle his advances and the value of collateral and potential repossession.Loans and advances that have been assessed individually and found not to be impaired and all individually insignificant loans and advances are then assessed collectively, in groups of assets with similar risk characteristics, to determine whether provisions should be established due to incurred loss events for which there is objective evidence but whose effects are not yet evident. In assessing the need for collective provision, the Bank considers factors such as credit quality, portfolio size, concentrations and economic factors. To estimate the required allowance, assumptions are made to define how inherent losses are modeled and to determine the required input parameters, based on historical experience and current economic conditions. The accuracy of the collective provisions depends on the model assumptions and parameters used in determining the collective allowance.Where the net present value of estimated cash flows differs +/- 5%, the impairment loss is estimated LL 1,607 million lower or higher.
(b) Fair value of financial instruments
The fair values of financial instruments where no active market exists or where quoted prices are not otherwise available are determined by using discounted cash flow model. These cash flow models are based on underlying market prices for interest rates. Changes in market rates could affect the reported fair value of financial instruments.
(c) Income taxes
Significant estimates are required in determining the provision for income taxes. There are many transactions and calculations for which the ultimate tax determination is uncertain. Where the final tax outcome of these matters is different from the amounts that were initially recorded, such differences will impact the income tax and deferred tax provisions.
(d) Pension benefits
The present value of the pension obligations depends on a number of factors that are determined on an actuarial basis using a number of assumptions. The assumptions used in determining the net cost for pensions include the discount rate. Any changes in these assumptions will impact the carrying amount of pension obligations.
The Bank determines the appropriate discount rate at the end of each year. This is the interest rate that should be used to determine the present value of estimated future cash outflows expected to be required to settle the pension obligations. In determining the appropriate discount rate, the Bank considers the interest rates of
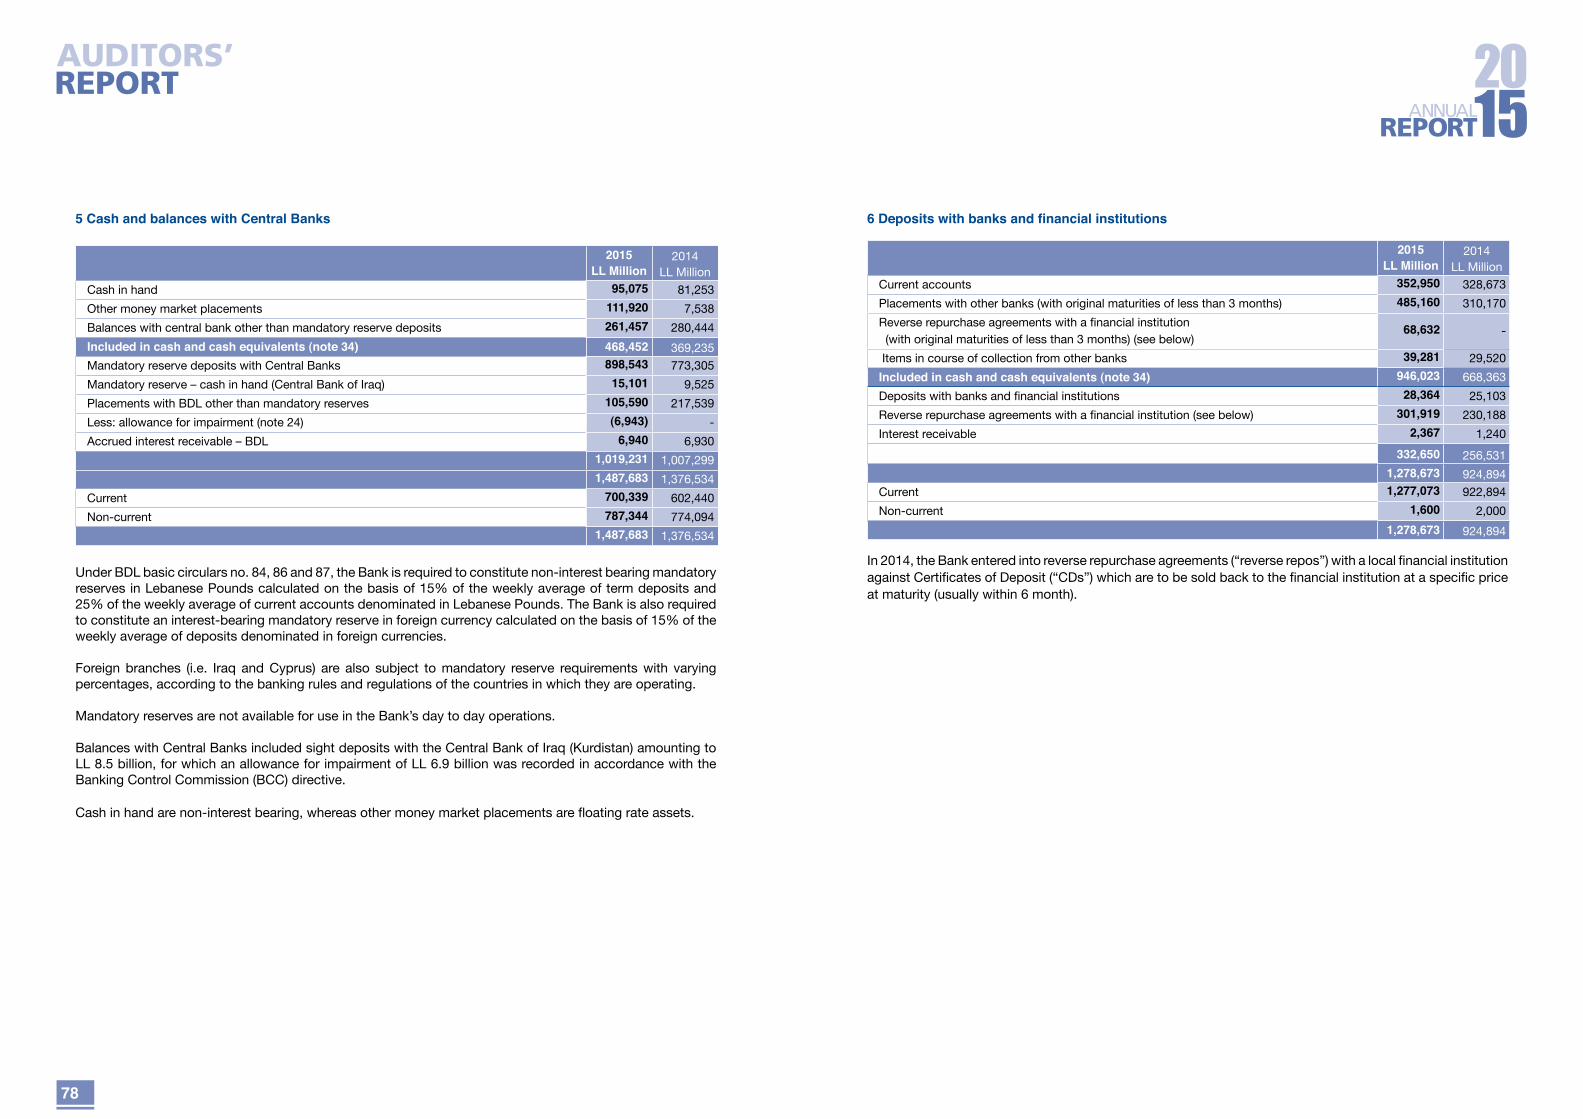
78
6 Deposits with banks and financial institutions
2015 LL Million
2014 LL Million
Current accounts 352,950 328,673
Placements with other banks (with original maturities of less than 3 months) 485,160 310,170
Reverse repurchase agreements with a financial institution (with original maturities of less than 3 months) (see below)
68,632 -
Items in course of collection from other banks 39,281 29,520
Included in cash and cash equivalents (note 34) 946,023 668,363
Deposits with banks and financial institutions 28,364 25,103
Reverse repurchase agreements with a financial institution (see below) 301,919 230,188
Interest receivable 2,367 1,240
332,650 256,531
1,278,673 924,894
Current 1,277,073 922,894
Non-current 1,600 2,000
1,278,673 924,894
In 2014, the Bank entered into reverse repurchase agreements (“reverse repos”) with a local financial institution against Certificates of Deposit (“CDs”) which are to be sold back to the financial institution at a specific price at maturity (usually within 6 month).
5 Cash and balances with Central Banks
2015 LL Million
2014 LL Million
Cash in hand 95,075 81,253
Other money market placements 111,920 7,538
Balances with central bank other than mandatory reserve deposits 261,457 280,444
Included in cash and cash equivalents (note 34) 468,452 369,235
Mandatory reserve deposits with Central Banks 898,543 773,305
Mandatory reserve – cash in hand (Central Bank of Iraq) 15,101 9,525
Placements with BDL other than mandatory reserves 105,590 217,539
Less: allowance for impairment (note 24) (6,943) -
Accrued interest receivable – BDL 6,940 6,930
1,019,231 1,007,299
1,487,683 1,376,534
Current 700,339 602,440
Non-current 787,344 774,094
1,487,683 1,376,534
Under BDL basic circulars no. 84, 86 and 87, the Bank is required to constitute non-interest bearing mandatory reserves in Lebanese Pounds calculated on the basis of 15% of the weekly average of term deposits and 25% of the weekly average of current accounts denominated in Lebanese Pounds. The Bank is also required to constitute an interest-bearing mandatory reserve in foreign currency calculated on the basis of 15% of the weekly average of deposits denominated in foreign currencies.
Foreign branches (i.e. Iraq and Cyprus) are also subject to mandatory reserve requirements with varying percentages, according to the banking rules and regulations of the countries in which they are operating.
Mandatory reserves are not available for use in the Bank’s day to day operations.
Balances with Central Banks included sight deposits with the Central Bank of Iraq (Kurdistan) amounting to LL 8.5 billion, for which an allowance for impairment of LL 6.9 billion was recorded in accordance with the Banking Control Commission (BCC) directive.
Cash in hand are non-interest bearing, whereas other money market placements are floating rate assets.

80
The collective provision on facilities provided locally includes an amount of LL 2.04 billion (2014 - LL 1.11 billion) against facilities provided to clients operating in Syria. The Bank computed the collective provision against Syrian facilities in accordance with requirements of BCC correspondence 512/14C (issued on April 2, 2012).
As for collective provision recorded against the facilities in Iraq, it represents 2% of the facilities granted in Iraq, as stipulated by the Central Bank of Iraq.
Reconciliation of allowance account for loans and advances to customers is as follows:
2015 Specific allowance for impairmentLL Million
2015 Collective allowance for impairmentLL Million
2014 Specific allowance for impairmentLL Million
2014 Collective allowance for impairmentLL Million
At 1 January 85,849 31,440 92,300 27,938
Increase in impairment allowances (note 24) 4,674 714 5,605 2,056
Unrealised interest 7,801 - 1,326 -
Reversal of impairment (note 24) (4,759) - (8,745) -
Transfers - - (1,446) 1,446
Write-off of non-performing loans (2,483) - (3,191) -
At 31 December 91,082 32,154 85,849 31,440
8 Debtors and engagements by acceptances
2015LL Million
2014 LL Million
Customers’ acceptances 63,525 71,313
Customers’ acceptances represent term documentary credits which the Bank has committed to settle on behalf of its customers against commitments provided by them, which are stated as a liability in the balance sheet under caption entitled “Engagements by acceptances”. Debtors and engagements by acceptances are considered as current assets and liabilities.
7 Loans and advances to customers
2015LL Million
2014 LL Million
Performing loans:
Medium and long term loans 1,978,565 1,815,527
Overdrafts 375,291 302,435
Short term loans 65,498 61,700
Scheduled loans 39,081 18,454
Discounted bills 4,365 5,599
Loans and advances to related parties (note 36) 6,013 4,734
Net debit against credit accounts – speculation accounts 279 220
Creditors accidentally debtors 1,146 1,789
Unpaid bills 932 2,541
Interest receivable 6,415 5,858
Non-performing loans:
- Substandard 4,939 13,559
- Doubtful 82,569 70,658
- Bad 30,915 26,454
Gross loans and advances to customers 2,596,008 2,329,528
Less: allowance for impairment (see below) (123,236) (117,289)
Net loans and advances to customers 2,472,772 2,212,239
Current 1,932,863 1,704,573
Non-current 539,909 507,666
2,472,772 2,212,239
Allowance for impairment is broken down as follows:
2015LL Million
2014 LL Million
Unrealised interest
Facilities rated substandard 1,304 1,980
Facilities rated doubtful 24,200 21,215
Facilities rated bad 12,292 10,005
37,796 33,200
Specific provision 53,286 52,649
Total specific allowance 91,082 85,849Collective allowance
Facilities provided locally 28,127 27,442
Facilities provided by foreign branches (Iraq) 3,080 3,051
Other 947 947
32,154 31,440
123,236 117,289

82
The movement in financial assets at amortised cost is summarised as follows:
2015 LL Million
2014LL Million
At 1 January 3,316,252 3,058,724
Additions 917,676 1,070,253
Sales (358,276) (363,526)
Redemptions (388,350) (444,581)
Exchange differences on financial assets (7,263) (4,618)
At 31 December 3,480,039 3,316,252
11 Investment in subsidiaries
% ownership
2015 LL Million
2014LL Million
The Capital for Insurance and Reinsurance Company S.A.L. (i) 80% 3,524 3,524
Informatics Co. S.A.R.L. (ii) 84% - -
Société Libanaise de Service S.A.R.L. (iii) 91% - -
3,524 3,524
(i) The Capital for Insurance and Reinsurance Company S.A.L. provides life and general insurance services for the local Lebanese market The Company’s equity amounted to LL 21.4 billion (2014 - LL 19.9 billion).
(ii) Informatics Co. S.A.R.L. was established to provide information technology services to the Bank. However, the Company ceased its operations in 1999 and is now only managing its cash balances. The Company’s equity amounted to LL 2.1 billion (2014 - LL 2 billion).
(iii) Société Libanaise de Service S.A.R.L. manages the properties of the Bank and third parties and provides security and maintenance services. The Company’s equity amounted to LL 5.5 billion (2014 - LL 5.3 billion).
12 Investment properties
LandLL Million
Buildings LL Million
TotalLL Million
At 1 January 2014 5,747 1,922 7,669
Transfer to property and equipment (note 13) - (331) (331)
At 31 December 2014 5,747 1,591 7,338At 1 January 2015 5,747 1,591 7,338At 31 December 2015 5,747 1,591 7,338
As at 31 December 2015, the fair value of this property amounted to LL 10.28 billion as determined by comparable market prices for similar plots. This is considered as a level 2 fair valuation, as the most significant input into the valuation model is the price per square metre of comparable plots in close proximity.
9 Financial assets at fair value through profit or loss
2015 LL Million
2014LL Million
Listed debt securitiesLebanese treasury bills (eurobonds) 27,328 22,157
Unlisted debt securitiesLebanese treasury bills 103,279 70,587
Certificates of deposit - BDL 58,025 35,679
161,304 106,266
Total debt securities at fair value through profit or loss 188,632 128,423
Equity securities
- Listed 6,043 6,034
- Unlisted 34,683 26,334
Total equity securities at fair value through profit or loss 40,726 32,368
Total investment securities at fair value through profit or loss 229,358 160,791
The above mentioned financial assets are held for trading purposes.
10 Financial assets at amortised cost
2015 LL Million
2014LL Million
Listed debt securities- Lebanese treasury bills (denominated in USD) 841,144 842,355
- Other debt securities 87,618 71,844
928,762 914,199
Unlisted debt securities- Lebanese treasury bills 1,292,615 1,333,934
- Certificates of deposit - BDL (denominated in LL) 970,565 772,676
- Certificates of deposit - BDL (denominated in USD) 236,981 192,510
- Certificates of deposit - commercial banks 15,079 18,125
- Securitisation funds 17,707 20,360
- Other debt securities 18,330 64,448
2,551,277 2,402,053
Total financial assets at amortised cost 3,480,039 3,316,252
Current 309,048 396,808Non-current 3,170,991 2,919,444
3,480,039 3,316,252
All debt securities have fixed coupons.
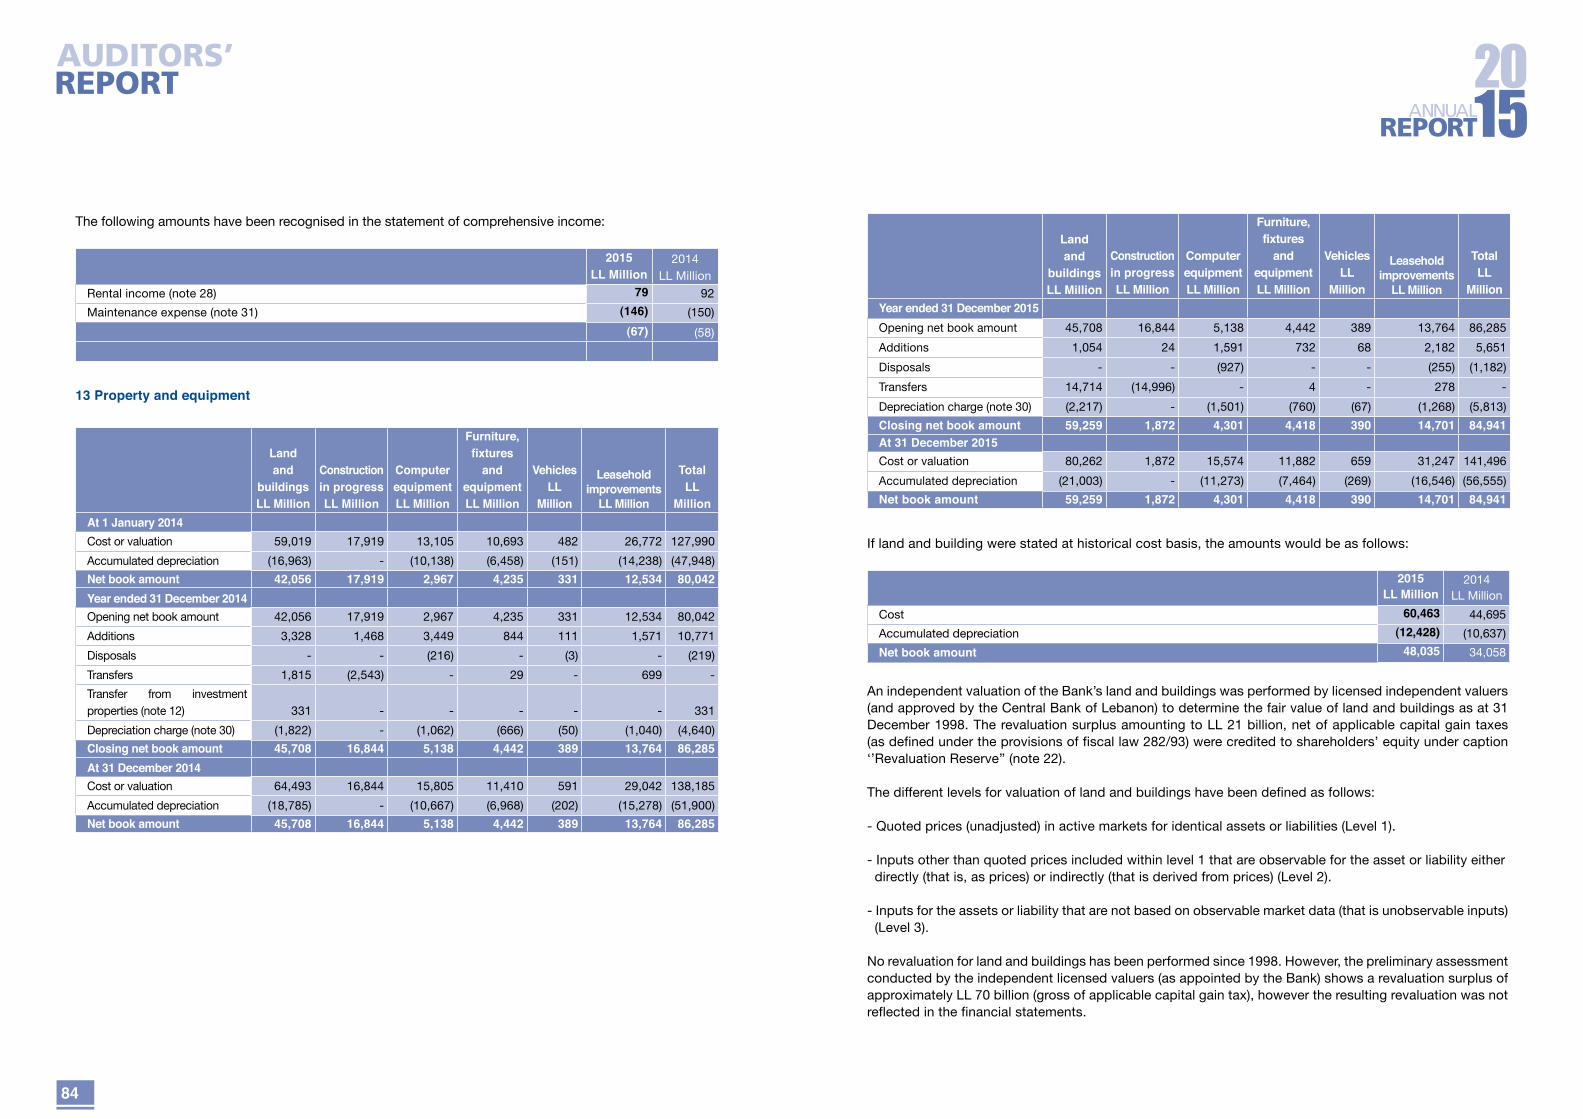
84
Land and
buildingsLL Million
Construction in progressLL Million
Computer equipmentLL Million
Furniture, fixtures
and equipmentLL Million
VehiclesLL
Million
Leasehold improvements
LL Million
TotalLL
MillionYear ended 31 December 2015Opening net book amount 45,708 16,844 5,138 4,442 389 13,764 86,285
Additions 1,054 24 1,591 732 68 2,182 5,651
Disposals - - (927) - - (255) (1,182)
Transfers 14,714 (14,996) - 4 - 278 -
Depreciation charge (note 30) (2,217) - (1,501) (760) (67) (1,268) (5,813)
Closing net book amount 59,259 1,872 4,301 4,418 390 14,701 84,941At 31 December 2015Cost or valuation 80,262 1,872 15,574 11,882 659 31,247 141,496
Accumulated depreciation (21,003) - (11,273) (7,464) (269) (16,546) (56,555)
Net book amount 59,259 1,872 4,301 4,418 390 14,701 84,941
If land and building were stated at historical cost basis, the amounts would be as follows:
2015 LL Million
2014LL Million
Cost 60,463 44,695
Accumulated depreciation (12,428) (10,637)
Net book amount 48,035 34,058
An independent valuation of the Bank’s land and buildings was performed by licensed independent valuers (and approved by the Central Bank of Lebanon) to determine the fair value of land and buildings as at 31 December 1998. The revaluation surplus amounting to LL 21 billion, net of applicable capital gain taxes (as defined under the provisions of fiscal law 282/93) were credited to shareholders’ equity under caption ‘’Revaluation Reserve’’ (note 22).
The different levels for valuation of land and buildings have been defined as follows:
- Quoted prices (unadjusted) in active markets for identical assets or liabilities (Level 1).
- Inputs other than quoted prices included within level 1 that are observable for the asset or liability either directly (that is, as prices) or indirectly (that is derived from prices) (Level 2).
- Inputs for the assets or liability that are not based on observable market data (that is unobservable inputs) (Level 3).
No revaluation for land and buildings has been performed since 1998. However, the preliminary assessment conducted by the independent licensed valuers (as appointed by the Bank) shows a revaluation surplus of approximately LL 70 billion (gross of applicable capital gain tax), however the resulting revaluation was not reflected in the financial statements.
The following amounts have been recognised in the statement of comprehensive income:
2015LL Million
2014LL Million
Rental income (note 28) 79 92
Maintenance expense (note 31) (146) (150)
(67) (58)
13 Property and equipment
Land and
buildingsLL Million
Constructionin progressLL Million
Computer equipmentLL Million
Furniture, fixtures
and equipmentLL Million
VehiclesLL
Million
Leasehold improvements
LL Million
TotalLL
MillionAt 1 January 2014Cost or valuation 59,019 17,919 13,105 10,693 482 26,772 127,990
Accumulated depreciation (16,963) - (10,138) (6,458) (151) (14,238) (47,948)
Net book amount 42,056 17,919 2,967 4,235 331 12,534 80,042Year ended 31 December 2014Opening net book amount 42,056 17,919 2,967 4,235 331 12,534 80,042
Additions 3,328 1,468 3,449 844 111 1,571 10,771
Disposals - - (216) - (3) - (219)
Transfers 1,815 (2,543) - 29 - 699 -
Transfer from investment properties (note 12) 331 - - - - - 331
Depreciation charge (note 30) (1,822) - (1,062) (666) (50) (1,040) (4,640)
Closing net book amount 45,708 16,844 5,138 4,442 389 13,764 86,285At 31 December 2014Cost or valuation 64,493 16,844 15,805 11,410 591 29,042 138,185
Accumulated depreciation (18,785) - (10,667) (6,968) (202) (15,278) (51,900)
Net book amount 45,708 16,844 5,138 4,442 389 13,764 86,285

86
(i) Advances on purchases of property and equipment include an amount of LL 5.4 billion (2014 - LL 5.4 billion) paid to a contractor in respect of the construction of a branch in Beirut Central District. The project was substantially completed at the end of 2014. The property has not yet been delivered to the Bank pending finalisation of negotiations around the contractual price.
(ii) This account represents transactions executed by the clients on their electronic cards but not yet allocated to their accounts.
(iii) This account represents medical expenses advanced by the Bank to the employees prior to collection from the National Social Security Fund.
(iv) This account includes: (i) doubtful receivables of LL 2.9 billion (2014 - LL 2.9 billion) from one of the Bank’s money dealers. Management recorded a provision of LL 1.8 billion (2014 - LL 1.8 billion) to cover the expected loss. (ii) an amount of LL 3.2 billion (2014 - LL 3.2 billion) that is fully provided for to cover losses incurred in connection with contentious depositors’ claims in one of the Bank’s branches. (iii) amounts receivable from two employees of LL 8.9 billion (2014 - LL 8.4 billion), who were involved in fraudulent activities. Management recorded a provision of LL 2.5 billion (2014 - LL 2.5 billion) against the uncovered exposure.
16 Non-current assets classified as held for sale
The movement of non-current assets classified as held for sale is as follows:
2015 LL Million
2014 LL Million
At 1 January 30,303 25,631
Acquisitions during the year 431 5,066
Disposals during the year (460) (394)
At 31 December 30,274 30,303
These assets represent properties acquired against settlement of defaulting clients’ facilities. As stipulated by the code of money and credit, banks have two years (from date of acquisition) to liquidate those assets, otherwise banks are required to constitute reserves (through appropriation from retained earnings) against these assets, prior to distribution of dividends (note 22).
In 2014, the bank appointed licensed independent valuers to revalue the above mentioned assets. The fair value has been measured using observable inputs, being the prices for recent sales of similar properties, and is therefore within level 2 of the fair value hierarchy. The fair value of the above mentioned properties was estimated at LL 37.24 billion. The Bank does not believe market prices differ materially in 2015.
14 Intangible assets
Computer Software Licenses LL Million
At 1 January 2014Cost 9,290
Accumulated amortisation (6,205)
Net book amount 3,085Year ended 31 December 2014Opening net book amount 3,085
Additions 1,823
Amortisation charge (note 30) (974)
Closing net book amount 3,934At 31 December 2014Cost 11,109
Accumulated amortisation (7,175)
Net book amount 3,934Year ended 31 December 2015Opening net book amount 3,934
Additions 245
Amortisation charge (note 30) (1,213)
Closing net book amount 2,966At 31 December 2015Cost 11,349
Accumulated amortisation (8,383)
Net book amount 2,966
15 Other assets
2015 LL Million
2014 LL Million
Advances on purchases of property and equipment (i) 12,695 11,637
Electronic card facilities – not yet allocated to client accounts (ii) 7,342 6,764
Prepaid expenses 3,203 2,103
Receivable from National Social Security Fund (iii) 2,776 2,464
Other receivables 6,309 3,458
Doubtful receivables (iv) 15,104 14,590
Less: allowance for impairment (7,781) (7,782)
39,648 33,234
Current 23,240 20,504
Non-current 16,408 12,730
39,648 33,234

88
19 Other liabilities
2015 LL Million
2014 LL Million
Due to credit card institution (see below) 5,479 4,636
Due to National Deposit Guarantee Institution 3,370 3,251
Withholding taxes and other charges 3,306 2,928
Due to employees 2,744 2,436
Penalty on currency auctions - Central Bank of Iraq (Baghdad) 2,315 -
Accrued expenses 2,137 3,523
Due to National Social Security Fund 690 751
Dividends payable and interest payable on cash contribution to capital 248 192
Other provisions 4,825 2,929
Other liabilities 1,877 987
26,991 21,633
The amount due to credit card institution of LL 5.48 billion represents transactions executed by the clients through their credit cards and not yet settled by the Bank.
Other liabilities are expected to be settled within no more than 12 months of the date of the balance sheet.
20 Retirement benefit obligations
Provision for retirement benefit obligations comprises the following:
2015LL Million
2014LL Million
Provision for retirement benefit obligations 26,643 26,611
Advances against retirement benefit obligations (205) (205)
26,438 26,406
The movement in provision for retirement benefit obligations can be summarised as follows:
2015LL Million
2014LL Million
At 1 January 26,611 23,908
Charge for the year (note 29) 2,560 4,446
Payments during the year (2,528) (1,743)
At 31 December 26,643 26,611
The principal assumptions used were as follows:
2015 2014
Discount rate 9% 9%
Future salary increases 6% 6%
17 Deposits from banks and financial institutions
2015 LL Million
2014 LL Million
Deposits from banks 267,063 267,537
Deposits from financial institutions 18,351 15,712
Interest payable 754 314
286,168 283,563
Current 279,558 276,953
Non-current 6,610 6,610
286,168 283,563
Deposits from banks and financial institutions are classified as liabilities at amortised cost and are set at fixed rates.
18 Deposits from customers
2015 LL Million
2014 LL Million
Term deposits 5,907,565 4,981,860
Current/settlement accounts (a) 1,389,272 1,325,025
Deposits held as collateral (b) 537,368 687,946
Deposits from related parties (note 36) 183,421 123,845
Accrued interest payable 34,346 27,023
Total deposits from customers 8,051,972 7,145,699
Current 7,806,144 6,952,072
Non-current 245,828 193,627
8,051,972 7,145,699
(a) Current/settlement accounts:Checking and current accounts 962,468 912,952
Saving accounts - demand 353,220 340,823
Debtors accidentally creditors 40,530 50,859
Payment orders 32,826 20,275
Public sector deposits 228 116
1,389,272 1,325,025
(b) Deposits held as collateral:Blocked accounts against credit facilities 468,647 595,564
Margins against issuance of documentary credits 39,795 64,672
Margins against issuance of letters of guarantee 26,953 25,730
Margins on speculation accounts 1,973 1,980
537,368 687,946
Deposits from customers only include financial instruments classified as liabilities at amortised cost. All deposits are at fixed interest rates.

90
22 Other reserves and retained earnings
2015LL Million
2014LL Million
ReservesReal estate revaluation reserve (a) 21,061 21,061
Legal reserve (b) 77,000 70,281
Reserve for unidentified banking risks (c) 75,969 66,969
Reserve for capital increase (d) 3,377 3,221
Reserve for liquidation of assets classified as held for sale (e) 7,288 6,321
Reserve against retail portfolio (f) 2,538 1,183
Other reserves 1,143 1,042
188,376 170,078Retained earnings (g)Retained earnings - available for distribution 251,535 225,600
Retained earnings - not available for distribution (h) 11,736 7,357263,271 232,957
(a) Real estate revaluation reserve
The revaluation reserve arose from the revaluation of investment properties and property and equipment. The revaluation was performed by an independent valuer under the provisions of fiscal law 282/93 based on the market values of 31 December 1993. This reserve is not available for distribution.
(b) Legal reserve In compliance with the requirements of Code of Commerce and Code of Money and Credit article number 132, banks are required to appropriate 10% of their annual profits as legal reserve. This reserve is not available for distribution.
(c) Reserve for unidentified banking risks In compliance with the Central Bank of Lebanon basic circular no. 50, banks are required to appropriate from annual profits an amount between 2 per mil and 3 per mil of risk-weighted assets (on and off balance sheet) as a reserve for unspecified banking risks. In addition, this reserve should not be less than 1.25% of the denominator at the end of the tenth financial years (i.e. 31 December 2007) and 2% of the denominator at the end of the twentieth financial years (i.e. 31 December 2017). This reserve is considered part of Tier I capital and is not available for distribution.
(d) Reserve for capital increase
In compliance with Banking Control Commission circular no. 173, all gains recognised on the sale of properties acquired in settlement of debt (note 16) should be appropriated from retained earnings and recorded as “Reserve for capital increase”.
21 Share capital and cash contributions to capital
2015LL Million
2014LL Million
Share capital:
Common shares (i) 148,752 148,752
Preferred shares (ii)Par value 8,264 8,264
Total share capital (i) + (ii) 157,016 157,016
Share premium:
Share premium reserve (iii) 112,600 112,600
Cash contributions to capital:
Cash contributions to capitalInterest bearing (5.5% per annum) 36 36
(i) The Bank’s common shares consist of 144,000,000 fully paid shares with a nominal value of LL 1,033 each.
(ii) The Bank’s preferred shares consist of 8,000,000 shares (preferred shares ‘B’) with a nominal value of LL 1,033 each and an issue price of LL 15,075 (USD 10 per share). These shares were fully issued and paid. These shares are (i) redeemable at the sole discretion of the issuer (after 5 years from issuance date) (ii) are non-cumulative (iii) distribution of returns to the holders is contingent on the distribution of dividends to the common stocks and adequacy of regulatory reserves and retained earnings. On that basis, the preferred shares are deemed to be equity instruments, specifically because payment on these shares is at the discretion of the Bank. BDL circular no.44 treats such preferred shares as “Additional Tier One Capital” for the purposes of computing the Regulatory Capital Adequacy Ratios.
(iii) The share premium reserve of LL 112.6 billion represents the premium on issuance of preferred shares at an amount of USD 10 per share

92
Movement on these retained earnings is summarised as follows:
2015LL Million
2014LL Million
At 1 January 7,357 5,613
Unrealised gain on investment securities at fair value through profit or loss (note 26) 4,628 1,860
Revaluation gains related to investment securities sold (transferred to realised) (249) (116)
At 31 December 11,736 7,357
23 Net interest and similar income
2015LL Million
2014LL Million
Interest and similar incomeLoans and advances:
- Customers 163,439 145,675
- Banks and financial institutions 36,144 36,299
- Reverse repos 6,974 2,729
- Loans and advances to related parties (note 36) 296 318
206,853 185,021
Financial assets at fair value through profit or loss 12,078 4,226
Financial assets at amortised cost 224,732 214,084
443,663 403,331
Interest and similar expensesDeposits from customers (306,699) (271,512)
Deposits from banks and financial institutions (1,822) (1,002)
Deposits from related parties (note 36) (6,300) (5,439)
(314,821) (277,953)
(e) Reserve for liquidation of assets classified as held for sale
In compliance with BDL basic circular no. 78, banks are required to deduct from annual profits an amount of 5% or 20% of the carrying value of its properties acquired in settlement of debt (note16), in case the Bank failed to liquidate the properties within 2 years from the date of acquisition. And, in accordance with the Banking Control Commission memo 4/2008 and 10/2008, the required reserves are established through appropriation of retained earnings. This reserve is not considered as part of the Bank’s Tier Capital nor is available for distribution. Upon disposal of these properties this reserve is transferred to a reserve specifically restricted to future increases in share capital.
(f) Reserve against retail portfolio
BCC circular no. 280 introduced the requirement to establish a reserve for performing retail portfolio (i.e. where late settlements do not exceed 30 days) equal to 0.5% of the carrying amount of the portfolio at 31 December 2015. This reserve amounted to LL 2.54 billion at the balance sheet date. Additional appropriations of 0.5% per annum are required for six consecutive years starting from 2015.
(g) Retained earnings
2015LL Million
2014LL Million
At 1 January 232,957 202,947
Profit for the year 67,264 67,108
Dividends declared (note 33) (18,522) (18,524)
Interest on cash contributions to capital (note 33) (1) (1)
Other (122) -
Transfers to other reserves:
Transfer to legal reserve (6,726) (7,075)
Transfer to reserve for unidentified banking risks (9,000) (9,000)
Transfer to reserve for liquidation of assets classified as held for sale (1,068) (999)
Transfer to reserve for capital increase (note 28) (156) (316)
Transfer to reserve for performing retail portfolio (1,355) (1,183)
(18,305) (18,573)
At 31 December 263,271 232,957
(h) Retained earnings - not available for distribution Cumulative unrealised gains (gross of losses) are treated as retained earnings not available for distribution under BCC circular no. 270 regulations. These gains will become available for distribution upon disposal of the related instrument.

94
26a Net trading income
2015LL Million
2014LL Million
Net gains on foreign exchange transactions (realised) 3,268 1,174
Net gains on foreign exchange translation (unrealised) 5,241 4,833
8,509 6,007
26b Net gain on investments at fair value through profit or loss
2015LL Million
2014LL Million
Unrealised loss on revaluation (1,578) (833)
Unrealised gain on revaluation (note 22) 4,628 1,860
Net unrealised gain 3,050 1,027
Realised gain on sale of investment securities 780 435
3,830 1,462
27 Net gain on investment securities at amortised cost
2015LL Million
2014LL Million
Sale of investment securities at amortised cost 12,745 9,545
During 2015, the Bank sold investment securities from its amortised cost portfolio. Management justifications are as follows:
• In May 2015, the Bank performed an exchange transaction with a local bank on a portion of its certificates of deposit and treasury bills portfolio with a nominal value of LL 165 billion. This transaction consisted of exchanging long term certificates of deposit and treasury bills with shorter term certificates of deposit and was made for maturity gap management purposes. This transaction generated a profit of LL 6.2 billion.
• In June 2015, the Bank performed an exchange transaction with a local bank on a portion of its certificates of deposit and treasury bills portfolio with a nominal value of LL 70 billion. This transaction included certificates of deposit and treasury bills with different maturities and was made for the purposes of maintaining the required liquidity. This transaction generated a profit of LL 3.5 billion.
• In June 2015, the Bank performed an exchange transaction with a local bank on a portion of its treasury bills portfolio with a nominal value of LL 55.5 billion. This transaction consisted of exchanging short term treasury bills with treasury bills having longer maturities and was made for maturity gap management purposes. This transaction generated a profit of LL 300 million.
24 Net credit impairment (charges) releases
2015LL Million
2014LL Million
Reversal of impairment (note 7) 4,759 8,745
Increase in impairment allowance - specific (note 7) (4,674) (5,605)
Increase in impairment allowance - collective (note 7) (714) (2,056)
Increase in impairment allowance - Central Bank of Iraq (Kurdistan) (note 5) (6,943) -
(7,572) 1,084
25 Net fee and commission income
2015LL Million
2014LL Million
Fee and commission incomeCommissions on banking operations 13,361 11,978
Credit-related fees and commissions 12,038 11,696
Commissions on letters of credit and guarantees 7,108 7,220
Commissions on transfers 5,938 4,700
Brokerage fees 3,535 3,213
Other 554 575
42,534 39,382
Fee and commission expenseCommissions on banking operations (3,029) (3,524)
Brokerage fees paid (1,956) (1,824)
Other (107) (636)
(5,092) (5,984)
Net fee and commission income 37,442 33,398

96
30 Depreciation and amortisation charges
2015LL Million
2014
LL Million
Depreciation charge (note 13) 5,813 4,640
Amortisation charge (note 14) 1,213 974
7,026 5,614
31 Other operating expenses
2015LL Million
2014
LL Million
Office supplies and utilities 5,180 5,601
Professional fees 4,769 3,421
Deposit guarantee premiums 3,370 3,253
Municipality and other taxes 2,698 2,184
Penalty on currency auctions - Central Bank of Iraq (Baghdad) (see below) 2,604 -
Advertising expense 2,218 2,311
Software costs 2,175 2,224
Repairs and maintenance 2,163 2,482
Travel expense and entertainment 1,981 2,023
Security Expense 1,736 1,651
Insurance expense (note 36) 1,470 1,140
Operating leases 1,359 1,291
Directors' remuneration (note 36) 1,350 1,348
Transportation expense 1,349 1,119
Subscriptions 874 934
Donations 728 873
Directors’ attendance fees (note 36) 654 653
Maintenance expense related to investment properties (note 12) 146 150
Other 3,337 2,824
40,161 35,482
The Bank was subject to a penalty of LL 2.6 billion by the Central Bank of Iraq (Baghdad) relating to currency auctions in prior years.
• In August and November 2015, the Bank performed an exchange transaction with a local bank on a portion of its treasury bills portfolio with a nominal value of LL 62.6 billion. This consisted of exchanging treasury bills with treasury bills having longer maturities and higher yields and was made for maturity gap management purposes. This transaction generated a profit of LL 2.7 billion.
During 2014, the Bank sold investment securities from its amortised cost portfolio. Management justifications are as follows:
• In March 2014, the bank performed an exchange transaction with a local bank on a portion of its certificates of deposit portfolio with a nominal value of LL 151 billion. This transaction consisted of exchanging short term certificates of deposit with certificates of deposits having longer maturities and was made for maturity gap management purposes. This transaction generated a profit of LL 8 billion.
• In November 2014, the bank sold Lebanese treasury bills with a nominal amount of LL 30 billion and acquired certificates of deposits with a nominal value of LL 30 billion with different maturities to adjust for the maturity mismatch between its assets and liabilities. This transaction resulted in a gain of LL 1 billion.
28 Other operating income
2015LL Million
2014
LL Million
Release from provision for liabilities and charges 1,120 2,997
Gain on disposal of assets classified as held for sale (note 22) 156 316
Rental income (note 12) 79 92
Loss on disposal of property and equipment (61) (21)
Other 657 621
1,951 4,005
29 Personnel expenses
2015LL Million
2014
LL Million
Wages and salaries 42,859 41,150
Social security costs 5,651 5,542
Scholarship 3,023 2,960
Pension costs - defined benefit plan (note 20) 2,560 4,446
Transportation 1,940 2,415
Medical expenses 1,597 1,716
Training expenses 326 321
Other employee benefits 2,713 3,312
60,669 61,862

98
The breakdown in the current income tax liability is as follows:
Lebanon branches (“Head Office”) 2,646 3,645
Foreign branches (Cyprus and Iraq) 1,702 1,695
At 31 December 4,348 5,340
The fiscal years from 2012 till 2015 for the Head Office remain subject to examination by the income tax authorities.
33 Dividends per share and interest on cash contributions
The following dividends were declared by the Bank and accounted for in the years shown below:
2015LL Million
2014LL Million
LL 70 (2014 - LL 70) per common share 10,080 10,080
LL 1,055 (2014- LL 1,055) per preferred share (designated ‘’B’’) 8,442 8,444
18,522 18,524
In addition the Bank paid interest on cash contribution of LL 1 million (2014 - 1 million).
After the reporting date, the following dividends were proposed by the board of directors. These dividends are subject to ratification by the General Assembly and are not yet recognised as liabilities in these financial statements.
LL MillionLL 70 per common share 10,080LL1,055 per preferred share (designated ‘’B’’) 8,442
18,522
34 Cash and cash equivalents
Cash and cash equivalents comprise balances with less than three months’ maturity from the date of acquisition, including cash in hand, deposits held at call with banks.
2015LL Million
2014LL Million
Cash and balances with Central Banks (note 5) 468,452 369,235
Deposits with banks and financial institutions (note 6) 946,023 668,363
1,414,475 1,037,598
32 Income tax expense
2015LL Million
2014
LL Million
Lebanon branches (“Head Office”) 12,902 12,594
Foreign branches (Cyprus and Iraq) 1,592 1,544
Tax charge for the year 14,494 14,138
The tax on the Bank’s profit differs from the theoretical amount that would arise using the basic tax rate applicable in the local jurisdiction (Lebanon) as follows:
2015LL Million
2014
LL Million
Profit before income tax 81,757 81,246
Less: profit before income tax foreign branches (11,094) (9,320)
Profit before income tax local branches 70,663 71,926
Tax using the local corporation tax rate of 15% 10,599 10,789
Add back charges not accountable for tax purposes:
Differences between accounting and fiscal depreciation 148 116
Net unrealised gain on investment securities and financial liabilities (462) (129)
Impairment on balances with Central Bank of Iraq (Kurdistan) 1,041 -
Penalty on currency auctions - Central Bank of Iraq (Baghdad) 304 -
Donations and other provisions 213 242
Other 1,059 1576
Local income tax 12,902 12,594
Foreign income tax 1,592 1,544
Total income tax expense 14,494 14,138
The movement in the current income tax liability is as follows:
2015LL Million
2014LL Million
At 1 January 5,340 7,238
Charge for the year 14,494 14,138
Payments during the year (15,486) (16,036)
At 31 December 4,348 5,340

100
36 Related-party transactions
The Bank is controlled by Assaf Holding S.A.L. (incorporated in Lebanon) which owns 46% of the ordinary shares, and Fransabank S.A.L. (incorporated in Lebanon) which owns 37% of the ordinary shares. The remaining 17% of the shares are widely held.
A number of banking transactions are entered into with related parties in the normal course of business. These include loans, deposits and other financial facilities (i.e. loan commitments, guarantees, etc.).
The volumes of related party transactions, outstanding balances at the year end, and related expenses and income for the year are as follows:
(a) Loans and advances to related parties
Directors and other key management personnel
(and close family members)
Related companies(associated companies
and subsidiaries)2015
LL Million2014
LL Million
2015LL Million
2014LL Million
Loans and advances to customers (note 7)
6,013 4,734 - -
Interest income (note 23) 296 318 - -
No provisions have been recognised in respect of loans given to related parties (2014 - nil).
Loans and advances to related parties comprise loans with fixed rates. The majority of these loans are secured by real estate mortgages.
As stipulated by Code of Money and Credit article 152, loans and advances to related parties are subject to general assembly approval on yearly basis.
(b) Deposits from related parties
Directors and other key management personnel
(and close family members)
Related companies(associated companies
and subsidiaries)2015
LL Million2014
LL Million2015
LL Million2014
LL Million
Deposits (note 18) 62,161 35,361 121,260 88,484
Interest expense (note 23) 2,623 2,014 3,677 3,425
Deposits from related parties are unsecured and comprise deposits with variable rates (repayable on demand), and fixed rates (repayable at maturity) of LL 26 billion (2014 - LL 23.5 billion) and LL 157 billion (2014 - LL 100 billion) respectively.
Interest incurred on related parties balances totaled LL 6,300 million (2014 - LL 5,439 million).
35 Contingent liabilities and commitments
(a) Legal proceedings
There were a number of lawsuits involving claims by and against the Bank at 31 December 2015, which arose in the ordinary course of business. The Bank does not expect these claims to give rise to any significant liability on the Bank.
(b) Loan commitments, guarantees and other financial facilities
At 31 December 2015 the following table indicates the contractual amounts of the Bank’s off-balance sheet financial instruments that commit it to extend credit to customers, guarantee and other facilities as follows:
2015LL Million
2014LL Million
Loan commitment (unused facilities) 472,733 426,580
Letters of guarantee (see below) 190,160 180,960
Letters of credit 120,447 106,336
783,340 713,876
The nature and the amounts of the letters of guarantee are as follows:
2015LL Million
2014LL Million
Guarantees given to customers 111,863 104,265
Guarantees against bank facilities 78,297 76,695
190,160 180,960

102
37 Events occurring after the reporting period
A recommendation by the Board of Directors to raise the Bank’s equity by an amount of up to USD 60 million through the issuance of a new series of preferred shares (Class “C”) is to be put to the Extraordinary General Assembly that is due to be held on 23 May 2016 for its ratification.
(c) Letters of guarantee
2015LL Million
2014LL Million
The Capital Insurance and Reinsurance Company S.A.L. 290 290
(d) Other transactions with related parties
2015LL Million
2014LL Million
The Capital Insurance and Reinsurance Company S.A.L.Commission income 3,109 2,789
Dividend income 1,800 1,800
Insurance expense - Bank (note 31) (1,470) (1,140)
Insurance expense - staff (260) (253)
OtherCost of other services received (629) (623)
Commissions paid (6) (10)
(e) Key management compensation
Directors' remuneration (note 31) 1,350 1,348
Directors' attendance fees (note 31) 654 653
Other key management compensation 3,596 3,561

104

106
Correspondent Banks
Abu DhabiNational Bank of Abu Dhabi
AmmanJordan Ahli Bank Plc
ColomboBank of Ceylon
CopenhagenDanske Bank A/S
DohaQatar National Bank SAQ
Dubai MashreqBank PSC
FrankfurtDeutsche Bank AGCommerzbank AG
GenevaCommerzbank AG, Frankfurt
Hong KongStandard Chartered Bank
KuwaitNational Bank of Kuwait SAK
LondonBarclays Bank PlcStandard Chartered Bank
MadridBBVA SA
MilanoIntesa Sanpaolo SpAUnicredit Bank
New YorkThe Bank of New York MellonCitibank N.A.JPMorgan Chase Bank N.A.Standard Chartered Bank
OsloDNB Nor Bank ASA
ParisSociété GénéraleBanque Audi Saradar France SA
RiyadhBanque Saudi Fransi
StockholmSkandinaviska Enskilda Banken AB
SydneyWestpac Banking Corporation
TokyoThe Bank of New York Mellon, London
TorontoBank of Montreal
ViennaUnicredit Bank Austria AG
Head Office250 Clemenceau StreetBBAC s.a.l. BuildingP.O.Box: 11-1536 Riad El SolhBeirut 1107 2080 LebanonTel: (01) 360460 - 366630/1Fax: (01) 365200Call Center: (04) 727747E-mail: [email protected]
BEIRUTClemenceau Central Branch(Head Office)Tel: (01) 360460 - 366630/1Fax: (01) 365200
Unesco (Corniche El Mazraa)Tel: (01) 867144/5/6 - 810390(03) 233733 Fax: (01) 790394
Hamra (Abd El Aziz Street)Tel: (01) 341280/2 - 351261(03) 414514 Fax: (01) 353745
Mazraa (Corniche El Mazraa,Cola Intersection)Telefax: (01) 818429/31- 302540Tel: (03) 265266
Achrafieh - Mar Nicolas (Charles Malek Avenue)Tel: (01) 201780/1- 331599(03) 541542 Fax: (01) 331690
Achrafieh - Istiklal (Al Istiklal Street near Rizk Hospital)Tel: (01) 203991/2 - 204016Fax: (01) 203987
Bliss (End of Bliss Street, Salman Building)Telefax: (01) 361088/98
Badaro - Sami El Solh (Sami El Solh Street, Ivoire Building)Tel: (01) 386285 - (71) 432666Fax: (01) 386284
MOUNT LEBANONMetn Zalka (Amaret Chalhoub, Haroun Hospital Street, Strassco Tower)Tel: (01) 893910 - 886764(03) 534111 Fax: (01) 893486
Dekwaneh (Boulevard Camille Chamoun)Tel: (01) 682391/2 - (03) 542543 Fax: (01) 682389
Elyssar - Mazraat Yachouh (Main Road)Telefax: (04) 913211/21Tel: (03) 714150
Sin El Fil (Al Hayek Crossroad, Lubnania Building)Telefax: (01) 488871/2
Dora (Dora Highway, St. Jacques Center)Telefax: (01) 255381/2
Baabda
Furn El Chebbak (Damascus Road)Tel: (01) 291528/9 - (03) 388611Fax: (01) 280906
Bir El Abed (Haret Hreik)Tel: (01) 548900 - 545435(03) 539540 Fax: (01) 548901
Chiyah (Al Arees Highway, Fawaz Building near the Ministry of Labor)Telefax: (01) 554172/3
Hazmieh (Damascus International Road, Kassis Center)Tel: (05) 951762/3/4
AleyAley - Saha (Aley Main Square)Tel: (05) 555433/4 - 557433(03) 548549 Fax: (05) 557434
Choueifat (Old Saida Road)Tel: (05) 433302 - 433600/1(03) 271194 Fax: (05) 433303
Metn - Hamana (Btekhnay Crossroad)Tel: (05) 530050 - 530822(03) 265504 Fax: (05) 530482
Aley - Baqaa (Bkheshtay Road)Tel: (05) 554701 - 557701/2(03) 563564 Fax: (05) 554432
Shahhar - Kabr Chmoun Tel: (05) 410281/2 - (03) 265509Fax: (05) 411190
ChoufBaakline (Main Road)Tel: (05) 300776 - 304060(03) 265503 Fax: (05) 300348
Bekaata (Main Road)Telefax: (05) 507587 - 500587 - 501587/706Tel: (03) 265506
Manassef - Kfarheem (Main Road)Telefax: (05) 720598/9Tel: (03) 220729
Keserwan/JbeilKaslik (Tripoli - Beirut Highway)Telefax: (09) 221437/8/9Tel: (03) 494495
Jbeil (Main Road)Telefax: (09) 546700/567/ 407 Tel: (03) 180250
BEKAAChtaura (Damascus Road)Tel: (08) 542451/3 - (03) 840844 Fax: (08) 542452
Bar Elias (Damascus Road)Tel: (08) 510014 - (03) 840842 Fax: (08) 511085
Rachaya El Wadi (Main Road)Telefax: (08) 561244 - 591243 - 590240Tel: (03) 840845
Jib Jannine (Main Road)Tel: (08) 660370/240 - (03) 840843 Fax: (08) 662740
Ferzol (Main Road)Tel: (08) 950850/1/2 - (03) 840841 Fax: (08) 950853
Baalbek (Main Road)Tel: (08) 374014 /5 - (03) 614899 Fax: (08) 374016
SOUTHSaida (Nejmeh Square) Telefax: (07) 723857 - 724369 - 734116 Tel: (03) 535536
Tyr - Buss (Main Road, Jal El Bahr)Tel: (07) 343651/2 - (03) 265505Fax: (07) 343650
Bint Jbeil (Main Road, Saff El Hawa, Bazzi Center)Telefax: (07) 450121/2Tel: (03) 499300
Hasbaya (Chehabi’s Sarail Road)Telefax: (07) 550272/3Tel: (03) 311788
NORTHTripoli - Tall (Tall Square)Telefax: (06) 430460/1Tel: (03) 388622
Tripoli - Mina (Al Mina Street, Dannaoui Building)Tel: (06) 200103/4/5/6 - (03) 566635Fax: (06) 611555
OVERSEASLimassol - Cyprus144 Archbishop Makarios III Avenue,BBAC Building, 3021 Limassol P.O.Box: 56201 3305 LimassolTel: (+357 ) 25 - 381290/369Telefax: (+357) 25 - 381584
Erbil - Iraq60 Meter Street, End of Iskan TunnelTel: (+964) 66 - 257 4300/400/500(+964) 750 - 765 8888
Baghdad - IraqAl Karrada Area, Al Arasat Street, BBAC BuildingTel: (+964) 782 - 333 3031 / 271 8199 (+964) 771 - 224 6496
Sulaymaniyah - IraqKing Mahmood Street, 60 Meter Roadnear Talary Hunar, Shazad BuildingTel: (+964) 53 – 319 6468 (+964) 771 - 642 8888
Abu Dhabi - United Arab Emirates(Representative Office)Mourour Street, C 60 Building, Mezzanine Floor P.O.Box: 41840 Abu DhabiTel: (+971) 2 - 446 1516/7Fax: (+971) 2 - 446 1518
Lagos - Nigeria(Representative Office)10/14 Abebe Court, Flat A5Bourdillon Road, IkoyiTel: (+234) 818 829 7124
Branch Network

108
Subsidiaries
• Informatics Co. s.a.r.l.
It is a software company that offers commercial and technical services. It was established in 1980 and is chaired by Sheikh Ghassan Assaf. BBAC owns 84 % of the company’s shares.
• Société Libanaise de Service s.a.r.l.
The company is active in real estate management. It was established in 1980 and is chaired by Sheikh Ghassan Assaf. BBAC owns 91 % of the company’s shares.
• The Capital Insurance and Reinsurance Co. s.a.l.
The company provides a full-range of insurance and reinsurance services. It is chaired by Mr. Assad G. Merza. BBAC owns 80% of the company’s shares.