contents of presentation...sas down 1,3 p.u. 41,3% (40,0%) main competitor down 3,1 p.u. 58,7%...
TRANSCRIPT

1999-11-16
ANA/11AUG99
DU/UZ/STU
DU/GR/UP
Contents of Presentation
The Quarter in
brief
SAS International
Hotels
The Scandinavian
base
Business Review
Strategic Financial
Base
Result Improvement
Program
Outlook
Appendices
Strategic Financial
Base
Result Improvement
Program
Outlook
Appendices
1999-11-16
ANA/11AUG99
DU/UZ/STU
DU/GR/UP
Events of Note 2nd Quarter
SAS and Singapore Airlines in strategic
alliance
Air New Zealand and Ansett Australia join
Star Alliance™
SAS order 5 additional DeHaviland Q400
Program of change; SAS 2000+
launched to customer May07

1999-11-16
ANA/11AUG99
DU/UZ/STU
DU/GR/UP
Business Highlights 2nd Quarter
Weak demand in
Business Class (RPK-C) up 0.4%
Over-capacity (Cabin-factor) down 3.9 p.u.
Yields under pressure down 2.1%
Unit Costs (vol. supported) down 2.4%
Income before depreciation down 30%
Result Improvement Program
under implementation
1999-11-16
ANA/11AUG99
DU/UZ/STU
DU/GR/UP
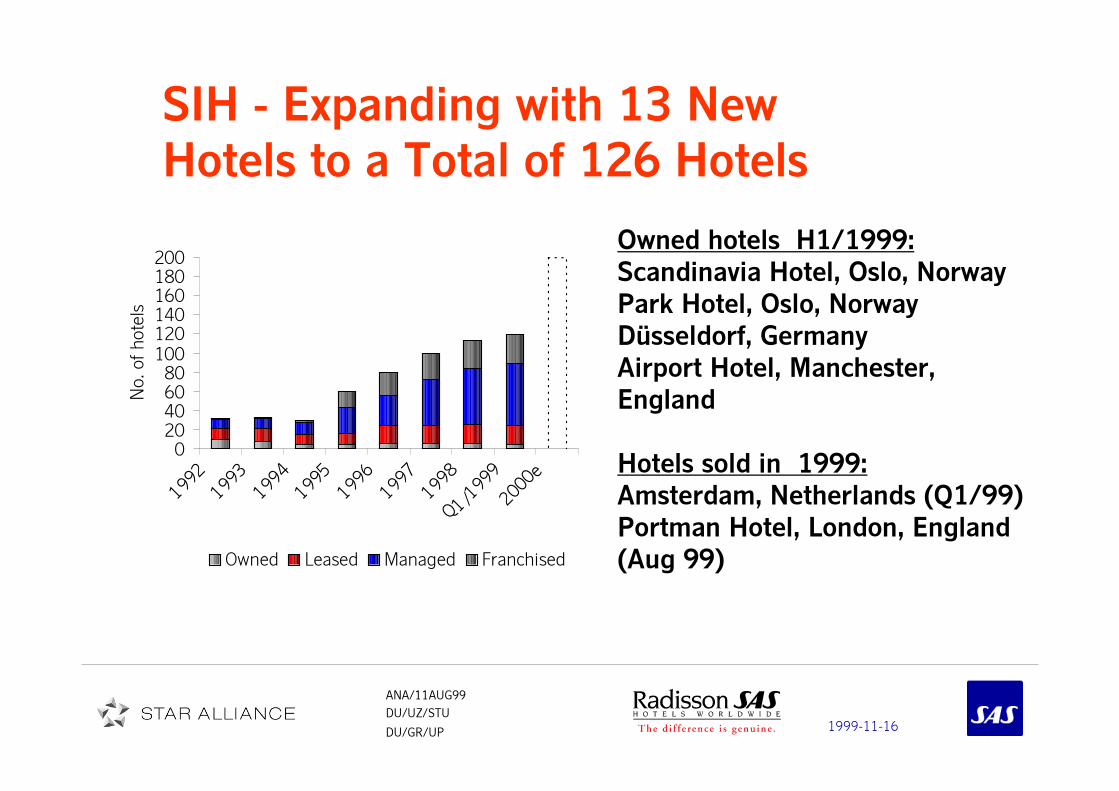
SIH - Expanding with 13 New
Hotels to a Total of 126 Hotels
Owned hotels H1/1999:
Scandinavia Hotel, Oslo, Norway
Park Hotel, Oslo, Norway
Düsseldorf, Germany
Airport Hotel, Manchester,
England
Hotels sold in 1999:
Amsterdam, Netherlands (Q1/99)
Portman Hotel, London, England
(Aug 99)
020406080
100120140160180200
1992
1993
1994
1995
1996
1997
1998
Q1/1999
2000e
No. of hotels
Owned Leased Managed Franchised
1999-11-16
ANA/11AUG99
DU/UZ/STU
DU/GR/UP
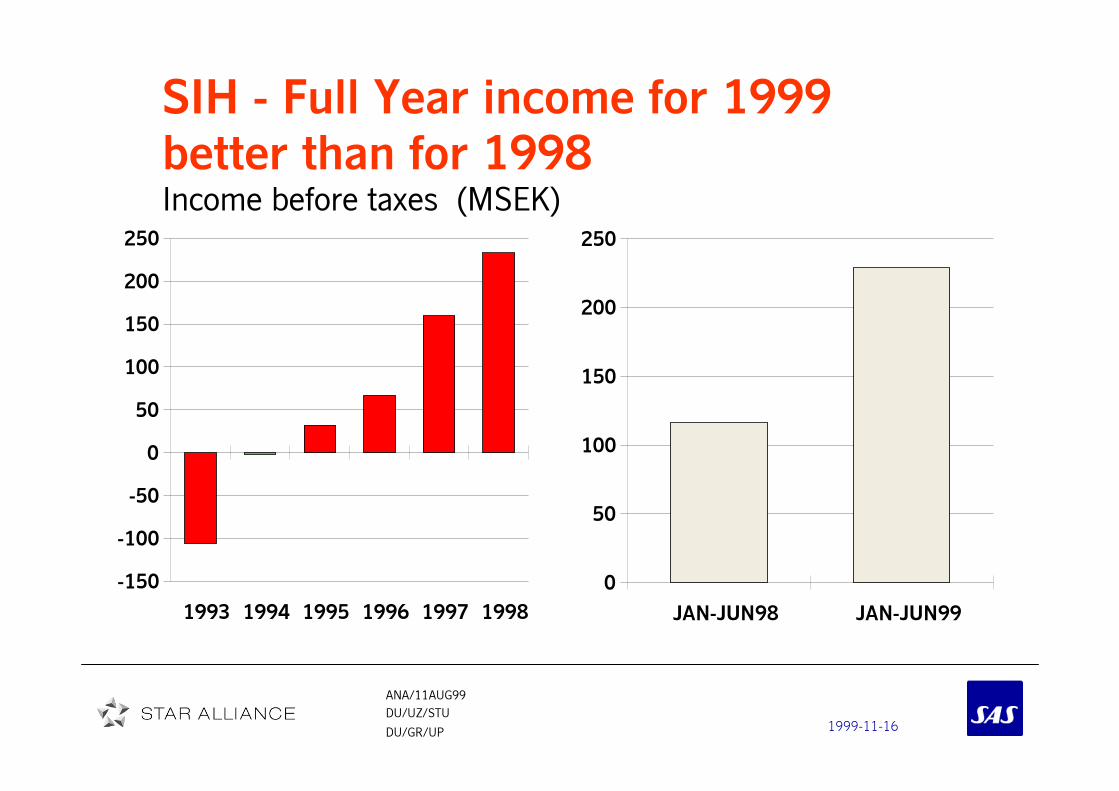
SIH - Full Year income for 1999
better than for 1998Income before taxes (MSEK)
-150
-100
-50
0
50
100
150
200
250
1993 1994 1995 1996 1997 1998
0
50
100
150
200
250
JAN-JUN98 JAN-JUN99

1999-11-16
ANA/11AUG99
DU/UZ/STU
DU/GR/UP
The Scandinavian Base

1999-11-16
ANA/11AUG99
DU/UZ/STU
DU/GR/UP
Norwegian domestic - continues
Development of market shares January - August 1999 v.s 1998
SAS down 1,3 p.u. 41,3% (40,0%)
Main competitor down 3,1 p.u. 58,7% (55,6%)
"New Entrant" up 3,1 p.u. 4,4% (0,2%)

1999-11-16
ANA/11AUG99
DU/UZ/STU
DU/GR/UP
SAS Traffic Flows
as % of Total Pax
Scandinavia-North America 3%
Scandinavia-Asia 2%
2%2%2%2%
REST. OF EUROPE
3%3%3%3% 4%4%4%4%
UK
7%7%7%7%
32%32%32%32%
Scandinavia
23%23%23%23%
19%19%19%19%
6%6%6%6%
InternationalInternationalInternationalInternational
DomesticDomesticDomesticDomestic

1999-11-16
ANA/11AUG99
DU/UZ/STU
DU/GR/UP
U.K. Largest European Market -
Germany no. 2 and France no. 3(% of total European RPK H1/99)
ITALYITALYITALYITALY
6%6%6%6%
SWITZERLANDSWITZERLANDSWITZERLANDSWITZERLAND
5%5%5%5%
FINLANDFINLANDFINLANDFINLAND
6%6%6%6%
BENELUXBENELUXBENELUXBENELUX
7%7%7%7%FRANCEFRANCEFRANCEFRANCE
13%13%13%13%
GERMANYGERMANYGERMANYGERMANY
16%16%16%16%
U.KU.KU.KU.K31%31%31%31%
ISRAELISRAELISRAELISRAEL
3%3%3%3%
OTHEROTHEROTHEROTHER
3%3%3%3%
SPAINSPAINSPAINSPAIN
5%5%5%5%
CISCISCISCIS
2%2%2%2%BATLICSBATLICSBATLICSBATLICS
2%2%2%2%AUSTRIAAUSTRIAAUSTRIAAUSTRIA
1%1%1%1%

1999-11-16
ANA/11AUG99
DU/UZ/STU
DU/GR/UP
SAS Partner Strategy
SAS Regional Partner Strategy
Important feeders in SAS’ traffic system.
Complement SAS’ traffic program by adding more
frequencies on existing routes, and/or by operating
new routes only profitable for smaller aircraft.
SAS’ (part-) ownership in its regional partners
ensures long-term commitment and stability.
Important feeders in SAS’ traffic system.
Complement SAS’ traffic program by adding more
frequencies on existing routes, and/or by operating
new routes only profitable for smaller aircraft.
SAS’ (part-) ownership in its regional partners
ensures long-term commitment and stability.

1999-11-16
ANA/11AUG99
DU/UZ/STU
DU/GR/UP
Joint Network of SAS,
Air Botnia &
Lufthansa
- an example of regional linked to a
global multi-hub system
Convenient connections to 200+
destinations in more than 70
countries
- with EuroBonus all the way.
Air Botnia
(100% owned)

1999-11-16
ANA/11AUG99
DU/UZ/STU
DU/GR/UP
Critical Success Criteria in the
Business Segment
Frequencies ✓
Punctuality ✓
Continuous product improvements - innovations ✓
World class loyalty program (awarded 3 times) ✓
Efficient distribution system (IT) ✓
Travel pass & tailored corporate agreements ✓
Seamless travel - global traffic systems through
alliances ✓
1999-11-16
ANA/11AUG99
DU/UZ/STU
DU/GR/UP
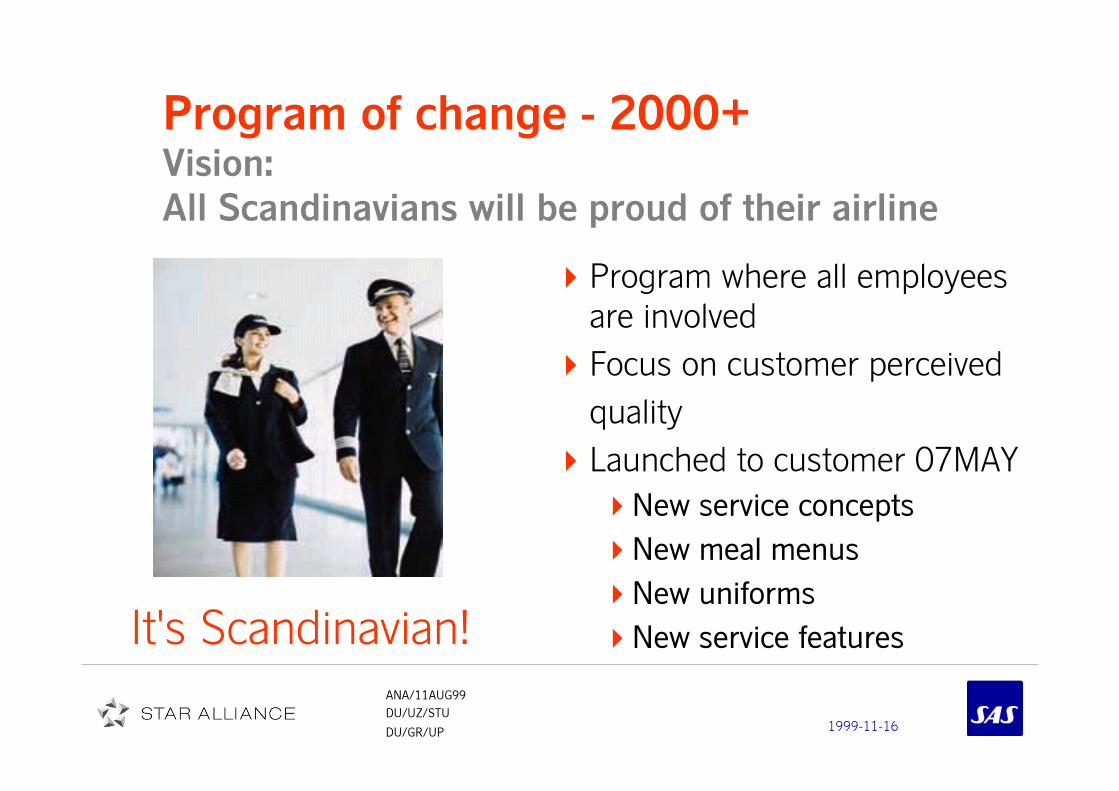
Program where all employees
are involved
Focus on customer perceived
quality
Launched to customer 07MAY
�New service concepts
�New meal menus
�New uniforms
�New service features
Program where all employees
are involved
Focus on customer perceived
quality
Launched to customer 07MAY
�New service concepts
�New meal menus
�New uniforms
�New service featuresIt's Scandinavian!
Program of change - 2000+Vision:
All Scandinavians will be proud of their airline
1999-11-16
ANA/11AUG99
DU/UZ/STU
DU/GR/UP
Business review

1999-11-16
ANA/11AUG99
DU/UZ/STU
DU/GR/UP
Main Points in Traffic Development
2nd Quarter 1999
Signs of recovery can be noted on traffic to/ from
Asia (Increased cabin factor)
Over-capacity on:
– North Atlantic (U.S.A in particular)
– Norwegian domestic
– Parts of European network
Continued strong development on Swedish
domestic
SAS growth lower than AEA average due to modest
capacity increase

1999-11-16
ANA/11AUG99
DU/UZ/STU
DU/GR/UP
Passenger Traffic 2nd Quarter 1999
� Q2/98 had about 5,5% traffic
reduction due to conflicts in
Denmark and Norway
� General decrease in business traffic
continues
� Growth in discounted traffic
continues - partly driven by
campaigns
� Q2 passenger load factor 65,8%
(down 3,9 p.u.)
� Q2 number of passengers up 6,4%-10%
-5%
0%
5%
10%
15%
Q1/99 Q2/99 JAN-JUN99
ASK RPK RPK-C RPK-M
Change vs last year

1999-11-16
ANA/11AUG99
DU/UZ/STU
DU/GR/UP
62%
63%
64%
65%
66%
67%
DEC94MAR JUN SEP DEC95MAR JUN SEP DEC96MAR JUN SEP DEC97MAR JUN SEP DEC98MAR JUN
Global over-capacity put pressure
On overall passenger load factorTotal System
Moving 12 months values

1999-11-16
ANA/11AUG99
DU/UZ/STU
DU/GR/UP
Cabin factors during 2nd Quarter
Positive areas:
Increased cabin factorThailand/ Singapore
– U.K
– Spain
– Finland
– Poland
– Hungary
– Estonia
– Danish domestic
Negative areas:
Decreased cabin factor
– U.S.A.
– The Netherlands
– Belgium
– Switzerland
– C.I.S.
– France
– Sweden - Norway v.v.
– Norwegian domestic
Negative areas:
Decreased cabin factor
– U.S.A.
– The Netherlands
– Belgium
– Switzerland
– C.I.S.
– France
– Sweden - Norway v.v.
– Norwegian domestic

1999-11-16
ANA/11AUG99
DU/UZ/STU
DU/GR/UP
SAS Performed Well on the
Competitive Routes Scandinavia - U.K.
The marketplace
� Highly competitive with
several majors and low
cost carriers present
• BA
• Go
• Finnair
• Braathens
• Debon Air
• Ryanair
• Easyjet
SAS Performance
� 5% capacity added (H1)
• Primarily Stansted
�M-class traffic up 14%
� Cabin factor up 1.7 p.u.
� C-class share >34%
• SAS focused as the
Premium carrier
• more than 60%
market share of total
Premium segment
SAS Performance
� 5% capacity added (H1)
• Primarily Stansted
�M-class traffic up 14%
� Cabin factor up 1.7 p.u.
� C-class share >34%
• SAS focused as the
Premium carrier
• more than 60%
market share of total
Premium segment

1999-11-16
ANA/11AUG99
DU/UZ/STU
DU/GR/UP
Business Class Development during
2nd Quarter
Positive areas:
Strongest Business Class
development
– Asia
– Israel
– Finland
– Poland
– Estonia
– Denmark- Sweden v.v
– Swedish domestic
– Danish domestic
Negative areas:
Weakest Business Class
development
– U.S.A.
– The Netherlands
– Switzerland
– C.I.S.
– France
– Sweden - Norway v.v
– Norwegian domestic
Negative areas:
Weakest Business Class
development
– U.S.A.
– The Netherlands
– Switzerland
– C.I.S.
– France
– Sweden - Norway v.v
– Norwegian domestic
1999-11-16
ANA/11AUG99
DU/UZ/STU
DU/GR/UP
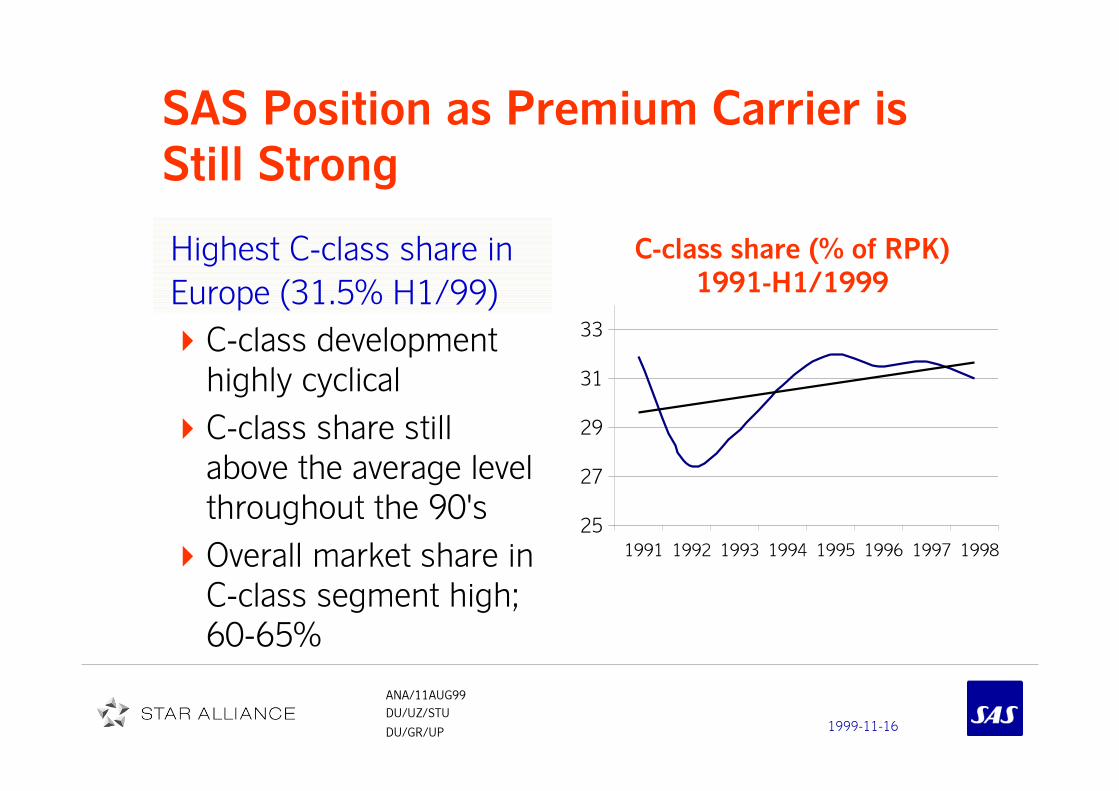
SAS Position as Premium Carrier is
Still Strong
Highest C-class share in
Europe (31.5% H1/99)
C-class development
highly cyclical
C-class share still
above the average level
throughout the 90's
Overall market share in
C-class segment high;
60-65%
25
27
29
31
33
1991 1992 1993 1994 1995 1996 1997 1998
C-class share (% of RPK)
1991-H1/1999
1999-11-16
ANA/11AUG99
DU/UZ/STU
DU/GR/UP
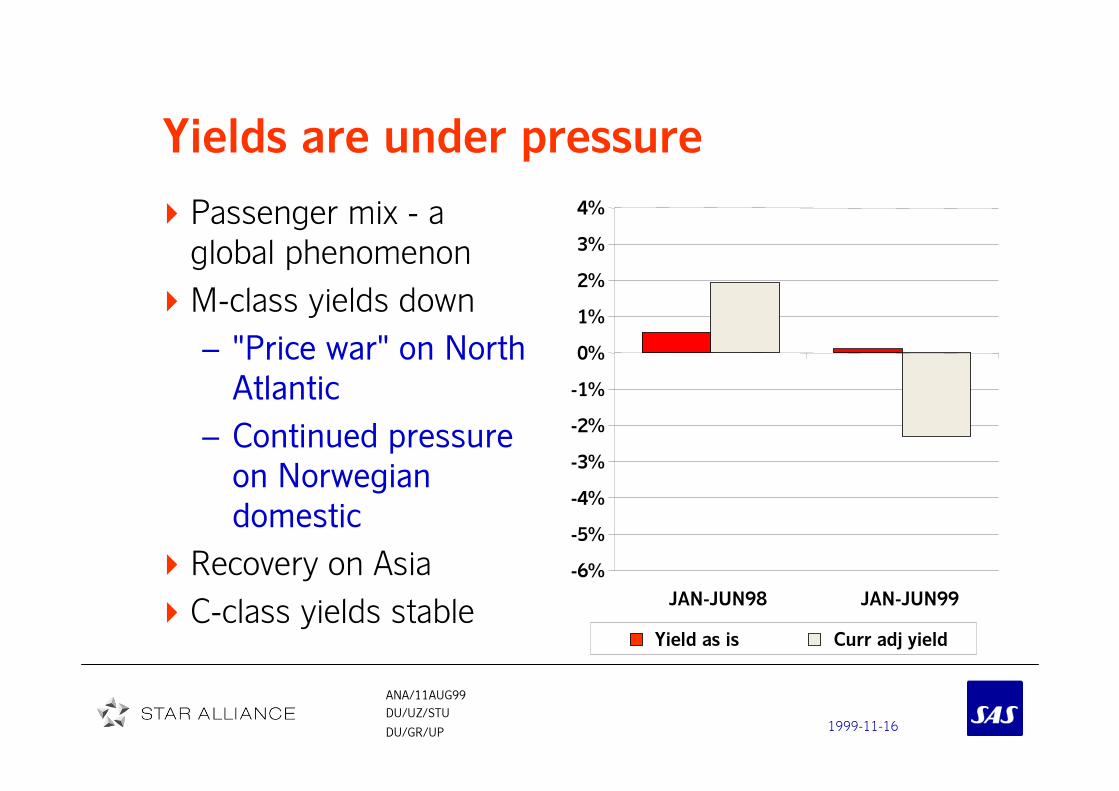
Yields are under pressure
Passenger mix - a
global phenomenon
M-class yields down
– "Price war" on North
Atlantic
– Continued pressure
on Norwegian
domestic
Recovery on Asia
C-class yields stable
Passenger mix - a
global phenomenon
M-class yields down
– "Price war" on North
Atlantic
– Continued pressure
on Norwegian
domestic
Recovery on Asia
C-class yields stable
-6%
-5%
-4%
-3%
-2%
-1%
0%
1%
2%
3%
4%
JAN-JUN98 JAN-JUN99
Yield as is Curr adj yield

1999-11-16
ANA/11AUG99
DU/UZ/STU
DU/GR/UP
The Alliance Picture is not Finalized...
AIR FRANCEAIR FRANCEAIR FRANCEAIR FRANCE DELTADELTADELTADELTA
KLMKLMKLMKLM ALITALIAALITALIAALITALIAALITALIA
NORTHWESTNORTHWESTNORTHWESTNORTHWEST CONTINENTALCONTINENTALCONTINENTALCONTINENTAL
CROSSAIR LAUDA AIR CROSSAIR LAUDA AIR CROSSAIR LAUDA AIR CROSSAIR LAUDA AIR TAP TAP TAP TAP
TYROLEAN TYROLEAN TYROLEAN TYROLEAN TURKISH TURKISH TURKISH TURKISH
AIR LITTORAL AIR LITTORAL AIR LITTORAL AIR LITTORAL AOM AOM AOM AOM
AUSTRIAN AUSTRIAN AUSTRIAN AUSTRIAN SWISSAIR SWISSAIR SWISSAIR SWISSAIR
SABENASABENASABENASABENA
'WINGS''WINGS''WINGS''WINGS'
LUFTHANSALUFTHANSALUFTHANSALUFTHANSA
SASSASSASSAS
UNITEDUNITEDUNITEDUNITED
VARIGVARIGVARIGVARIG
AIR CANADAAIR CANADAAIR CANADAAIR CANADA
THAITHAITHAITHAI
ANSETTANSETTANSETTANSETT
ALL NIPPONALL NIPPONALL NIPPONALL NIPPON
AIR NEW ZEALANDAIR NEW ZEALANDAIR NEW ZEALANDAIR NEW ZEALAND
BRITISH AIRWAYSBRITISH AIRWAYSBRITISH AIRWAYSBRITISH AIRWAYS
AMERICANAMERICANAMERICANAMERICAN
CANADIANCANADIANCANADIANCANADIAN
QANTASQANTASQANTASQANTAS
CATHAYCATHAYCATHAYCATHAY
FINNAIRFINNAIRFINNAIRFINNAIR
IBERIAIBERIAIBERIAIBERIA
1999-11-16
ANA/11AUG99
DU/UZ/STU
DU/GR/UP
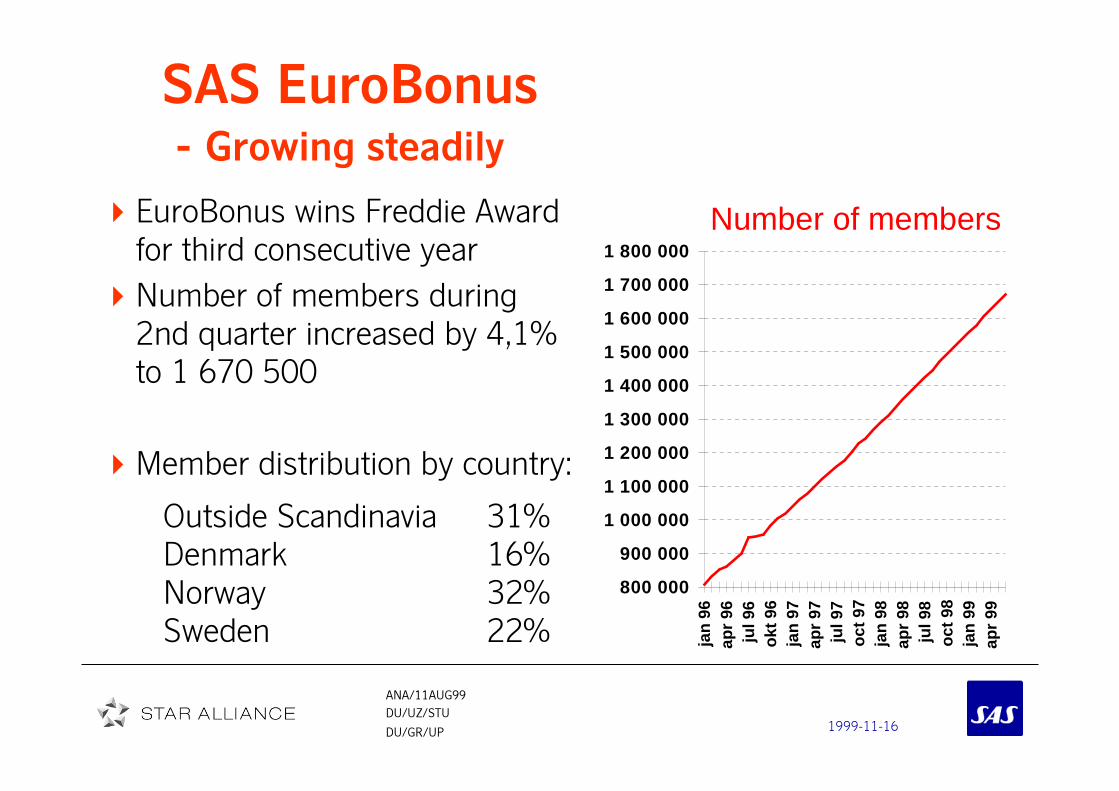
SAS EuroBonus
- Growing steadily
EuroBonus wins Freddie Award
for third consecutive year
Number of members during
2nd quarter increased by 4,1%
to 1 670 500
Member distribution by country:
Outside Scandinavia 31%
Denmark 16%
Norway 32%
Sweden 22%
Number of members
800 000
900 000
1 000 000
1 100 000
1 200 000
1 300 000
1 400 000
1 500 000
1 600 000
1 700 000
1 800 000
jan
96ap
r96
jul9
6ok
t96
jan
97ap
r97
jul9
7oc
t97
jan
98ap
r98
jul9
8oc
t98
jan
99ap
r99

1999-11-16
ANA/11AUG99
DU/UZ/STU
DU/GR/UP
Joint Ventures with Lufthansa and Air
CanadaScandinavia/Finland-Germany
Joint Venture with LHH1 1999 vs 1998
Passengers 1 225 000 +5.7%
Traffic, RPK +8.1%
Production, ASK +12.4%
Cabin Factor 59,4% vs 61,8%
H1 1999 vs 1998
Passengers 1 225 000 +5.7%
Traffic, RPK +8.1%
Production, ASK +12.4%
Cabin Factor 59,4% vs 61,8%
Scandinavia-Canada
Joint Venture with ACMay-June 1999
Cabin Factor 80%'s
1999-11-16
ANA/11AUG99
DU/UZ/STU
DU/GR/UP
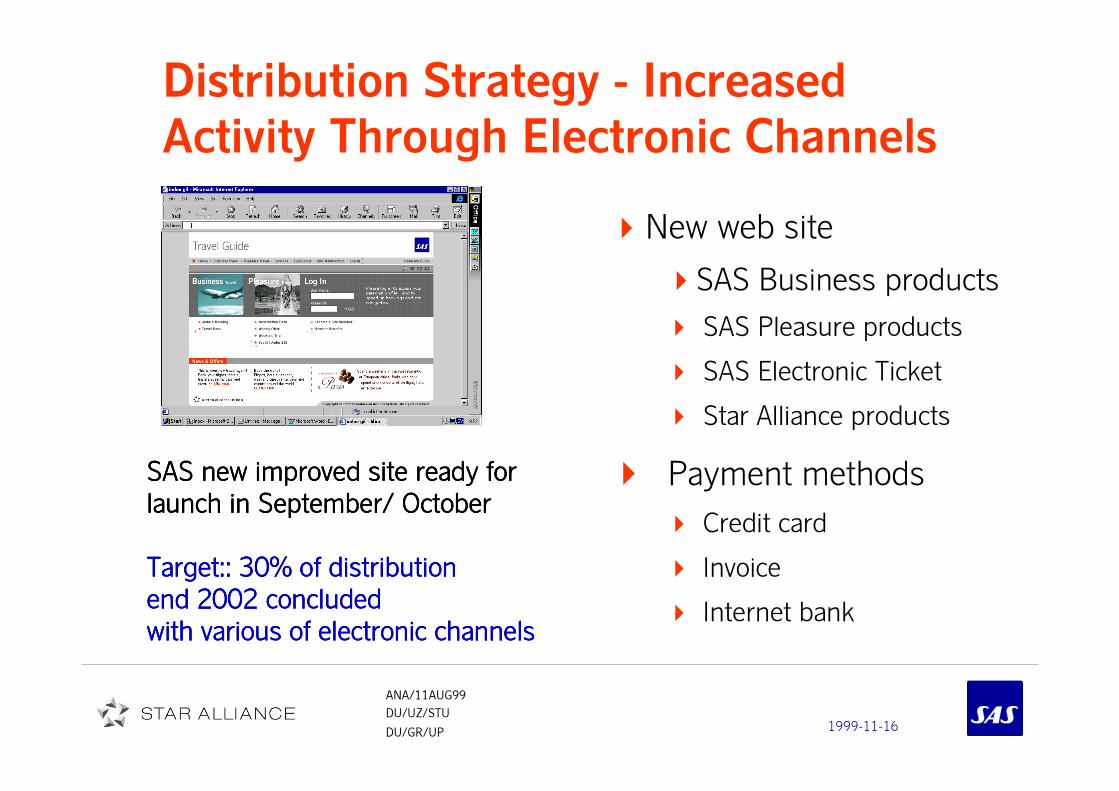
SAS new improved site ready forSAS new improved site ready forSAS new improved site ready forSAS new improved site ready for
launch in September/ Octoberlaunch in September/ Octoberlaunch in September/ Octoberlaunch in September/ October
Target:: 30% of distribution Target:: 30% of distribution Target:: 30% of distribution Target:: 30% of distribution
end 2002 concludedend 2002 concludedend 2002 concludedend 2002 concluded
with various of electronic channelswith various of electronic channelswith various of electronic channelswith various of electronic channels
Distribution Strategy - Increased
Activity Through Electronic Channels
New web site
�SAS Business products
� SAS Pleasure products
� SAS Electronic Ticket
� Star Alliance products
Payment methods
� Credit card
� Invoice
� Internet bank
New web site
�SAS Business products
� SAS Pleasure products
� SAS Electronic Ticket
� Star Alliance products
Payment methods
� Credit card
� Invoice
� Internet bank
1999-11-16
ANA/11AUG99
DU/UZ/STU
DU/GR/UP
Changes in Governmental fees and
airport charges
Tax-free ended July 1, for travel within EU
�1999 Negative Effect MSEK 40 (SAS Trading)
Copenhagen Airport (KLH) imposed charge increase
of 15% (1999) and 8 DKK/bag
� Under negotiation - decision fall 1999
� New fee structure proposed
Environmental tax in Sweden (Jet Fuel)
� EU ruling - positive effect MSEK 140 (H1/99)
Norwegian charges:
� Charge per seat changed to charge per passenger
� MSEK 137 positive effect on result (1999 - full year)
1999-11-16
ANA/11AUG99
DU/UZ/STU
DU/GR/UP
SAS started preparations in 1996
Aircraft fleet concluded
All data-systems are tested and approx. 600
modifications
Ongoing verification
Close co-operation with IATA, governments, suppliers,
partners etc.
"Business as usual"
SAS started preparations in 1996
Aircraft fleet concluded
All data-systems are tested and approx. 600
modifications
Ongoing verification
Close co-operation with IATA, governments, suppliers,
partners etc.
"Business as usual"
SAS and the millennium (Y2K)
1999-11-16
ANA/11AUG99
DU/UZ/STU
DU/GR/UP
Financial review
1999-11-16
ANA/11AUG99
DU/UZ/STU
DU/GR/UP
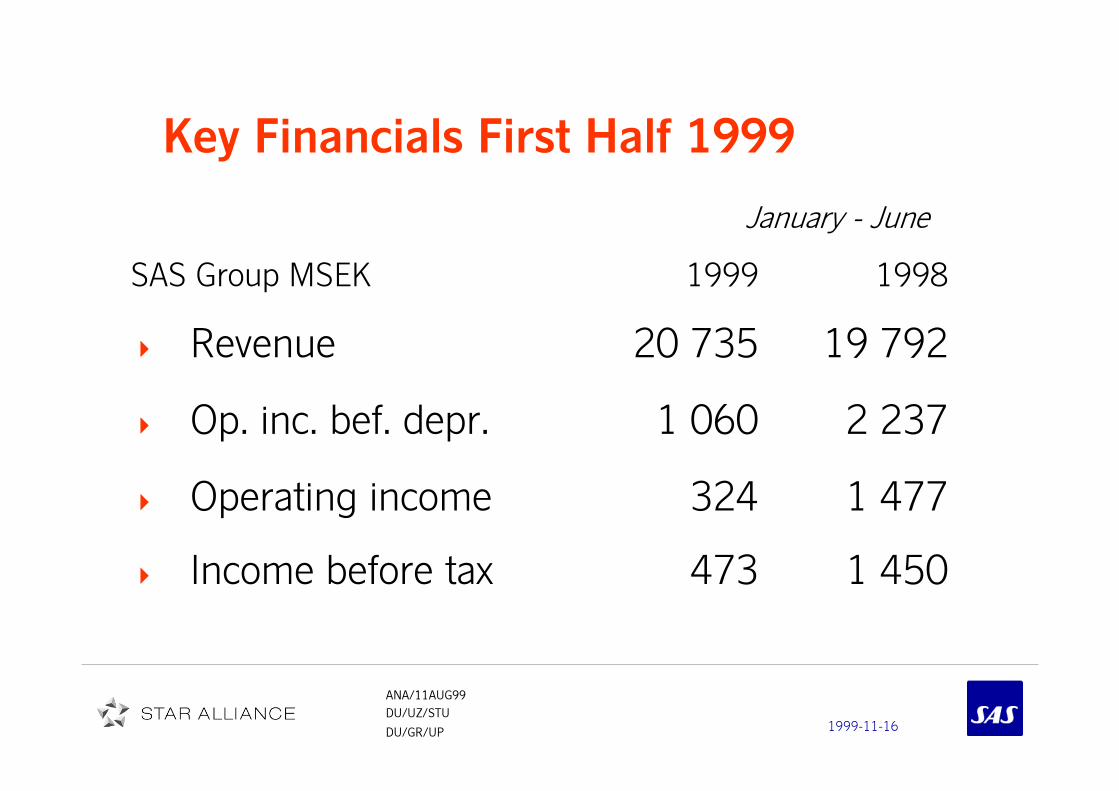
Key Financials First Half 1999
SAS Group MSEK 1999 1998
� Revenue 20 735 19 792
� Op. inc. bef. depr. 1 060 2 237
� Operating income 324 1 477
� Income before tax 473 1 450
January - June

1999-11-16
ANA/11AUG99
DU/UZ/STU
DU/GR/UP
Key Metrics Weaker in the CurrentIndustry Downturn
0%
5%
10%
15%
20%
25%
30%
35%
9906
9903
9812
9809
9806
9803
9712
9709
9706
9703
9612
9609
9606
9603
9512
CFROI ROCE, Market based
CFROICFROI
TARGET >17%TARGET >17%
ROCEROCE
TARGET >12%TARGET >12%
4 quarters moving values

1999-11-16
ANA/11AUG99
DU/UZ/STU
DU/GR/UP
Summary Key Financial Metrics January - June
1999 1998
Gross operating margin % 5 11
CFROI1) % 17 25
Market based ROCE1) % 15 18
ROCE1) % 9 12
1) 4 last quarters
1999-11-16
ANA/11AUG99
DU/UZ/STU
DU/GR/UP
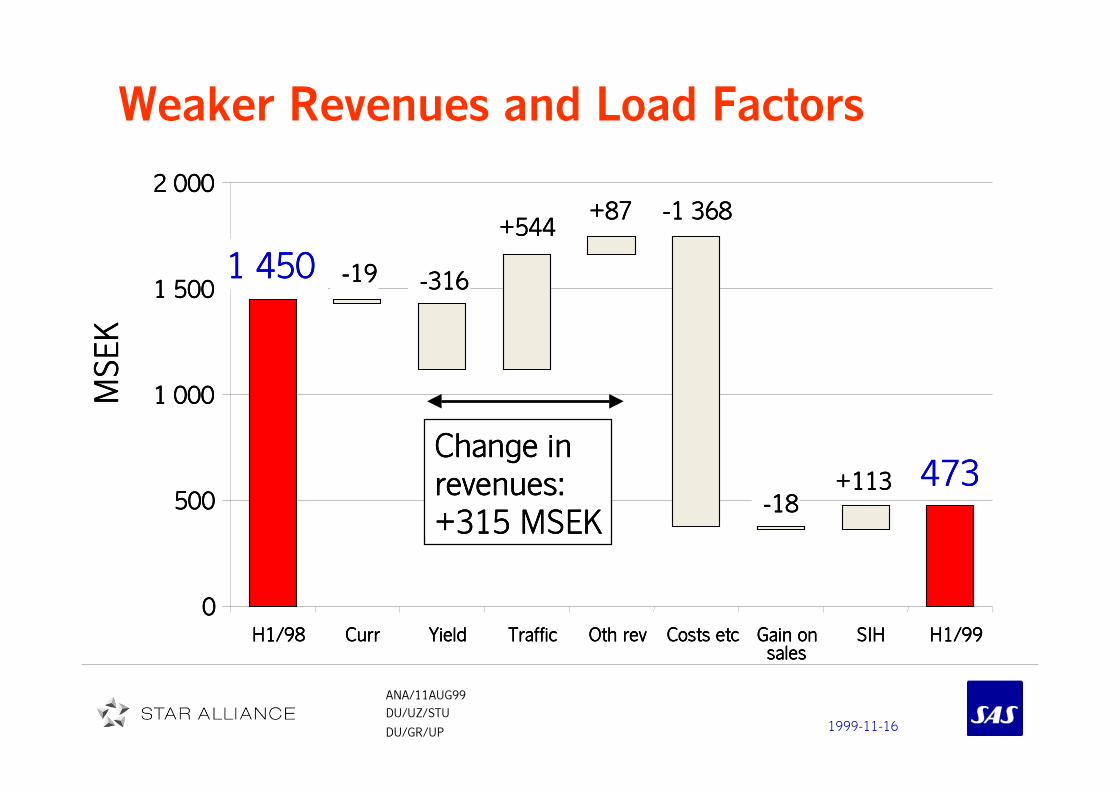
Weaker Revenues and Load FactorsMSEK
MSEK
MSEK
MSEK
0000
500500500500
1 0001 0001 0001 000
1 5001 5001 5001 500
2 0002 0002 0002 000
H1/98H1/98H1/98H1/98 CurrCurrCurrCurr YieldYieldYieldYield TrafficTrafficTrafficTraffic OthOthOthOth rev rev rev rev Costs etcCosts etcCosts etcCosts etc Gain onGain onGain onGain on
salessalessalessales
SIHSIHSIHSIH H1/99H1/99H1/99H1/99
-19-19-19-19 -316-316-316-316
+544+544+544+544+87+87+87+87 -1 368-1 368-1 368-1 368
-18-18-18-18+113+113+113+113
1 4501 4501 4501 450
473473473473Change inChange inChange inChange in
revenues:revenues:revenues:revenues:
+315 MSEK+315 MSEK+315 MSEK+315 MSEK

1999-11-16
ANA/11AUG99
DU/UZ/STU
DU/GR/UP
SAS Group Cash FlowNet Financing from ops + sales & Investments
MSEK
0
1 000
2 000
3 000
4 000
5 000
6 000
7 000
1995 1996 1997 1998
Generated cash flow Investments
0
500
1 000
1 500
2 000
2 500
3 000
3 500
JAN-JUN98 JAN-JUN99
Generated cash flow Investments

1999-11-16
ANA/11AUG99
DU/UZ/STU
DU/GR/UP
SAS Group
Changes in Financial Position
January - June
1999 1998
Cash flow from operations 900 2 122
Change in working capital - 247 + 35
Net financing from operations 653 2 157
Investments, advance payments - 3 003 - 2 249
Sales of fixed assets, etc. + 856 + 766
Payment to mother companies - 957 - 1 141
Financing surplus - 2 451 - 467Changes in external financing, net - 135 - 567
Change in liquid funds - 2 586 - 1 034
MSEKMSEKMSEKMSEK

1999-11-16
ANA/11AUG99
DU/UZ/STU
DU/GR/UP
Slightly Increased Unit Costs, but
improvements in Q2January - June 1999 vs 1998
MSEK
Volume = average growth in ASK and RPK = 6,0%
Adjusted Share of
H1/98 H1/99 Var. % total var %
Commissions 1 127 852 24.4% 1.9%
Fuel 1 220 1 020 16.4% 1.4%
Government charges 1 842 1 732 6.0% 0.8%
Personnel 6 161 6 489 (5.3%) (2.3%)
Other oper. net costs 4 026 4 404 (9.4%) (2.6%)
TOTAL 14 376 14 497 (0.8%) (0.8%)

1999-11-16
ANA/11AUG99
DU/UZ/STU
DU/GR/UP
Net Debt Increased to MSEK 4 526
0
2 000
4 000
6 000
8 000
10 000
12 000
14 000
16 000
18 000
dec-91
jun-92
dec-92
jun-93
dec-93
jun-94
dec-94
jun-95
dec-95
jun-96
dec-96
jun-97
dec-97
jun-98
dec-98
jun-99
MS
EK

1999-11-16
ANA/11AUG99
DU/UZ/STU
DU/GR/UP
Result Improvement Program
1999-11-16
ANA/11AUG99
DU/UZ/STU
DU/GR/UP
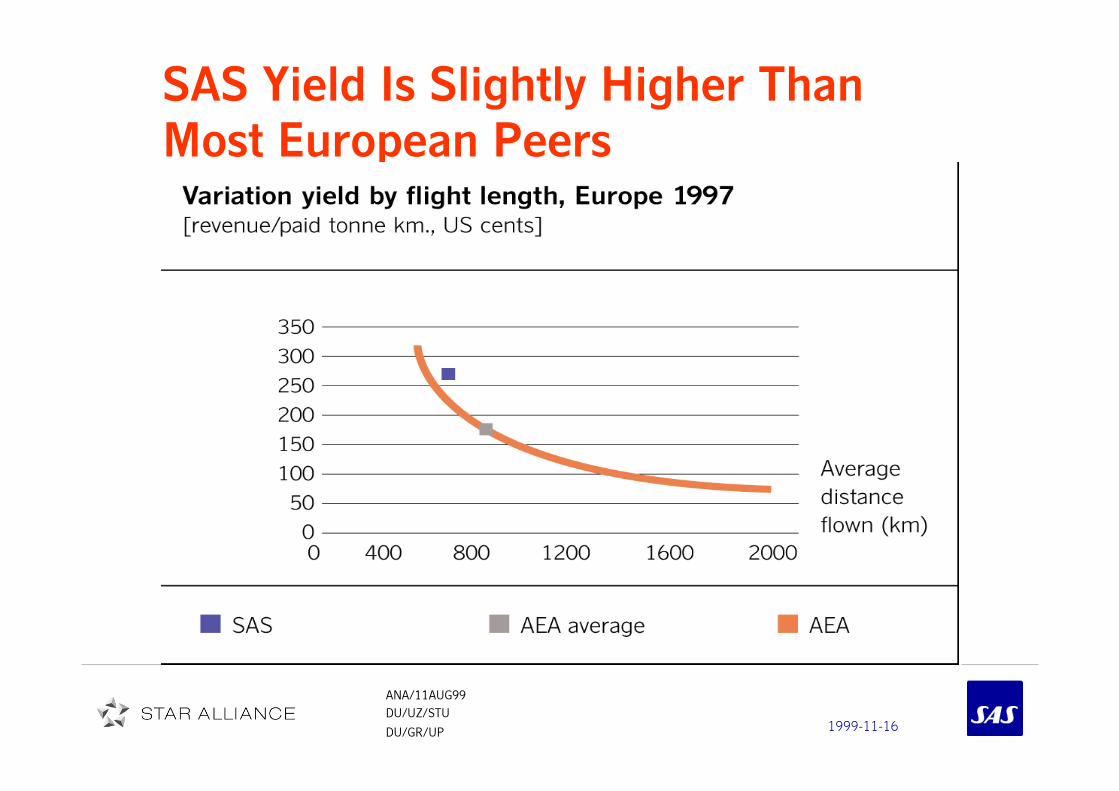
SAS Yield Is Slightly Higher Than
Most European Peers
1999-11-16
ANA/11AUG99
DU/UZ/STU
DU/GR/UP
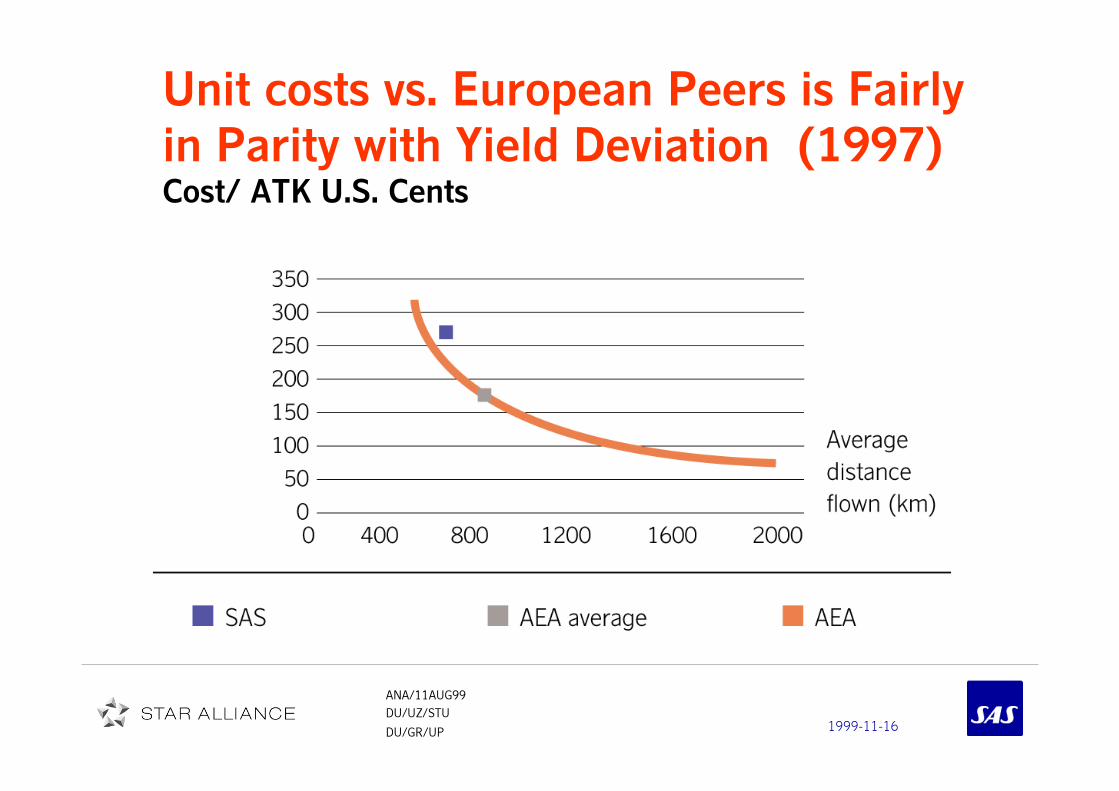
Unit costs vs. European Peers is Fairly
in Parity with Yield Deviation (1997)Cost/ ATK U.S. Cents

1999-11-16
ANA/11AUG99
DU/UZ/STU
DU/GR/UP
Shorter Stage Length and Business
Segment Focus = Higher Cost Base
Shorter average distance flown
– 1100 flights a day
– Limited intercontinental network
• Smaller aircraft size
• Smaller c-class share
Higher proportion C-class passengers
– 31% Europe/ 40% Intrascandinavian/ Domestic
• Higher catering cost
• Business lounges
• Service facilities
Shorter average distance flown
– 1100 flights a day
– Limited intercontinental network
• Smaller aircraft size
• Smaller c-class share
Higher proportion C-class passengers
– 31% Europe/ 40% Intrascandinavian/ Domestic
• Higher catering cost
• Business lounges
• Service facilities

1999-11-16
ANA/11AUG99
DU/UZ/STU
DU/GR/UP
Result Improvement Program
Critical in order to reach set return requirements
More than 100 projects identified as of date
Control and central follow up systems established
Critical in order to reach set return requirements
More than 100 projects identified as of date
Control and central follow up systems established
Program to increase gross profit margin
by 3 p.u. is to be completed during end 2000

1999-11-16
ANA/11AUG99
DU/UZ/STU
DU/GR/UP
Result Improvement Program
MSEK
Improved gross operating margin 3 p.u. 1 200
Inflatory increase of cost base 1999 (3%) 850
Inflatory increase of cost base 2000 (3%) 950
Total program 3000
MSEK
Improved gross operating margin 3 p.u. 1 200
Inflatory increase of cost base 1999 (3%) 850
Inflatory increase of cost base 2000 (3%) 950
Total program 3000
Total program of MSEK 3000 vs.
1998 cost base (level)

1999-11-16
ANA/11AUG99
DU/UZ/STU
DU/GR/UP
Result Improvement Program 1999/00
MSEK 3000 in potential identified as of H1/99:
Area Targeted effect vs. 1998
Cargo 100 MSEK
Catering & Inflight service 300 MSEK
IT & communications 180 MSEK
Distribution & Electronic channels 1000 MSEK
Air crew 420 MSEK
Ground handling 260 MSEK
Technical maintenance 340 MSEK
Overhead & other 400 MSEK
Total 3000 MSEK
Area Targeted effect vs. 1998
Cargo 100 MSEK
Catering & Inflight service 300 MSEK
IT & communications 180 MSEK
Distribution & Electronic channels 1000 MSEK
Air crew 420 MSEK
Ground handling 260 MSEK
Technical maintenance 340 MSEK
Overhead & other 400 MSEK
Total 3000 MSEK

1999-11-16
ANA/11AUG99
DU/UZ/STU
DU/GR/UP
Result Improvement Program 1999
MSEK 550 achieved so far H1/1999 1)
Target at year end 1999: 1 200 MSEK
Area Achieved effect vs. 1998
Cargo 40 MSEK
Catering & Inflight service 0 MSEK
IT & communications 0 MSEK
Distribution & Electronic channels 170 MSEK
Air crew 135 MSEK
Ground handling 60 MSEK
Technical maintenance 60 MSEK
Overhead & other 85 MSEK
Total 550 MSEK
Area Achieved effect vs. 1998
Cargo 40 MSEK
Catering & Inflight service 0 MSEK
IT & communications 0 MSEK
Distribution & Electronic channels 170 MSEK
Air crew 135 MSEK
Ground handling 60 MSEK
Technical maintenance 60 MSEK
Overhead & other 85 MSEK
Total 550 MSEK
1) Note: Compared with 1998 cost levels
1999-11-16
ANA/11AUG99
DU/UZ/STU
DU/GR/UP
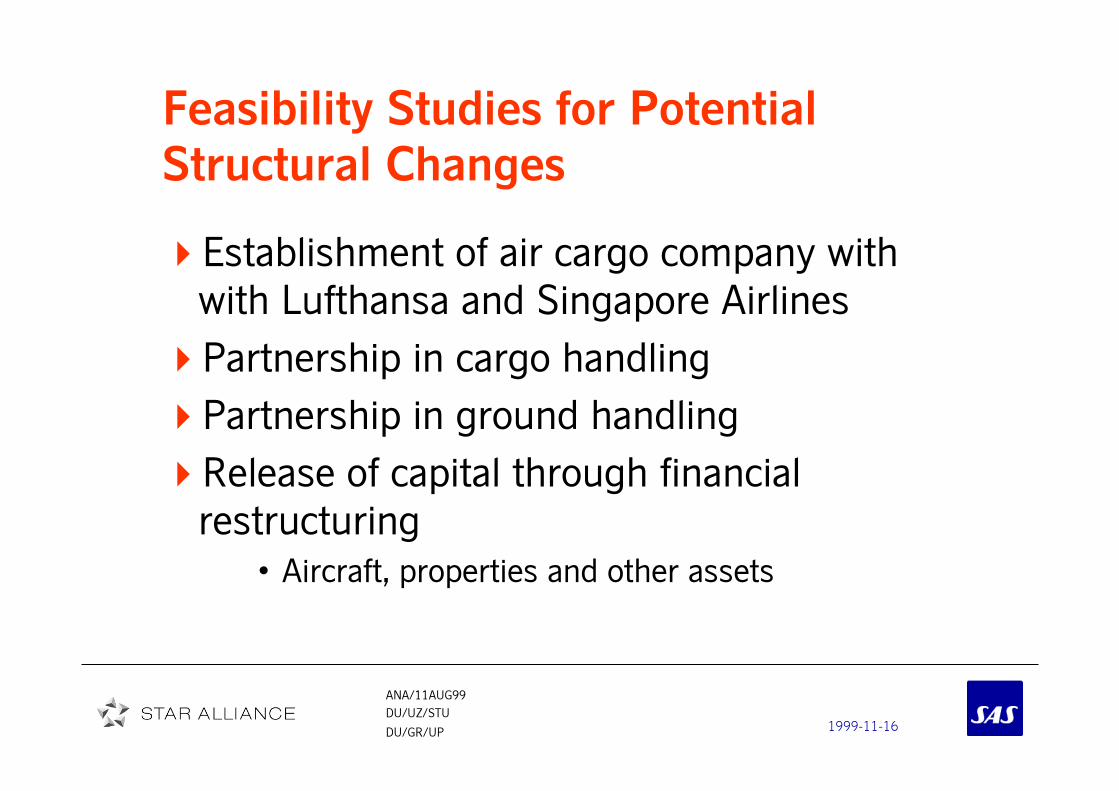
Feasibility Studies for Potential
Structural Changes
Establishment of air cargo company with
with Lufthansa and Singapore Airlines
Partnership in cargo handling
Partnership in ground handling
Release of capital through financial
restructuring
• Aircraft, properties and other assets
1999-11-16
ANA/11AUG99
DU/UZ/STU
DU/GR/UP
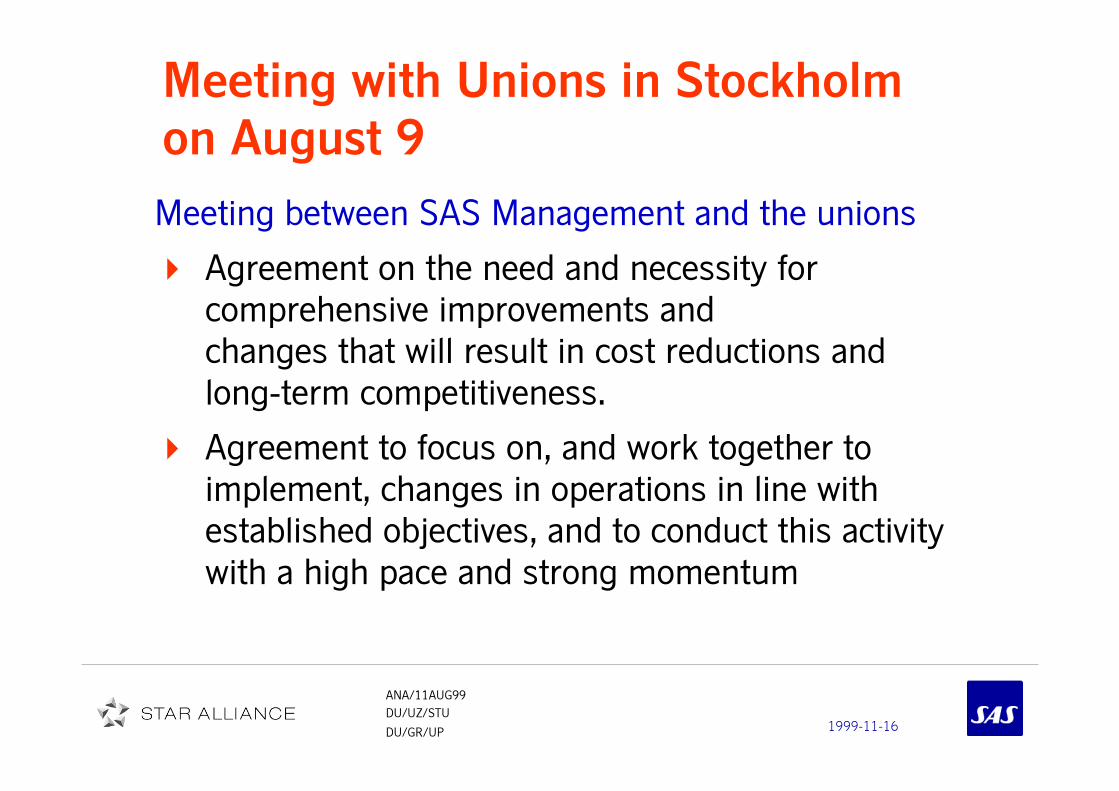
Meeting with Unions in Stockholm
on August 9
Meeting between SAS Management and the unions
Agreement on the need and necessity for
comprehensive improvements and
changes that will result in cost reductions and
long-term competitiveness.
Agreement to focus on, and work together to
implement, changes in operations in line with
established objectives, and to conduct this activity
with a high pace and strong momentum
1999-11-16
ANA/11AUG99
DU/UZ/STU
DU/GR/UP
Outlook 1999/00

1999-11-16
ANA/11AUG99
DU/UZ/STU
DU/GR/UP
56 next generation Boeing
737-600
– 11 B737-700/800
– 20 in traffic (Jun 99)
22 new deHaviland Q400
Replace F28-4000 and DC9-
21/41 + F50
Average age on owned fleet
down from 9 years to 6.5
years by the year 2000
56 next generation Boeing
737-600
– 11 B737-700/800
– 20 in traffic (Jun 99)
22 new deHaviland Q400
Replace F28-4000 and DC9-
21/41 + F50
Average age on owned fleet
down from 9 years to 6.5
years by the year 2000
Ongoing Renewal of SAS fleet
1999-11-16
ANA/11AUG99
DU/UZ/STU
DU/GR/UP
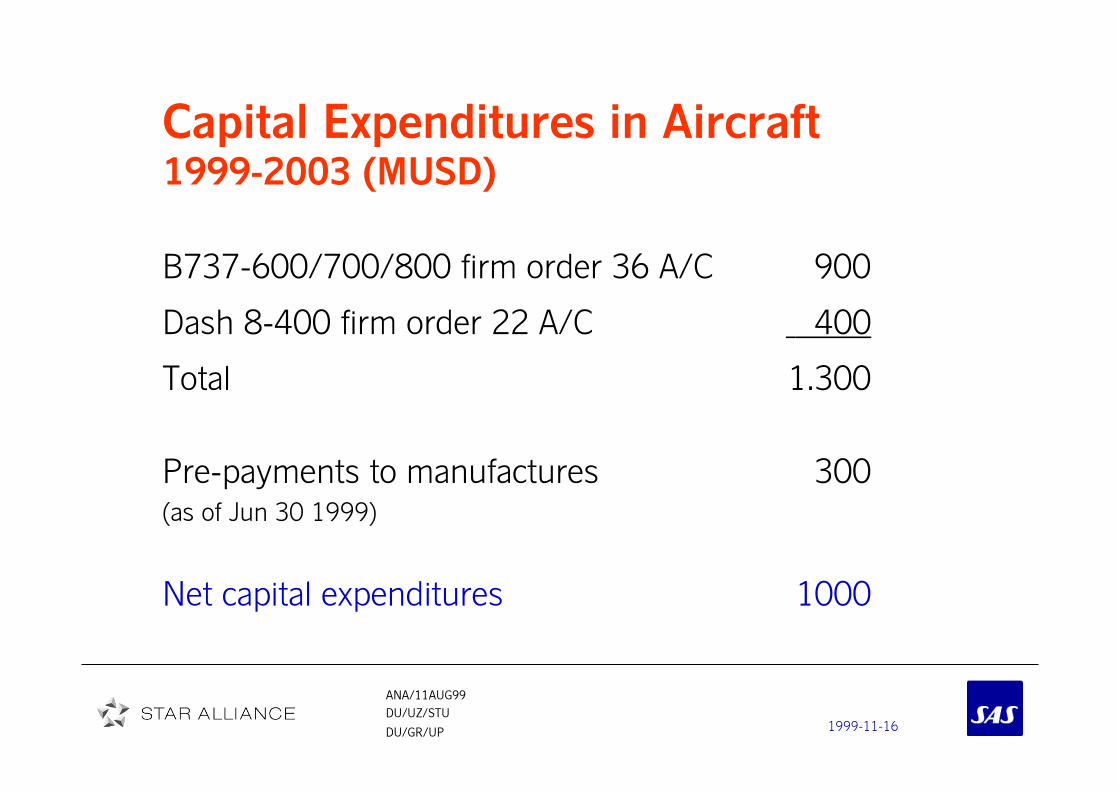
Capital Expenditures in Aircraft1999-2003 (MUSD)
B737-600/700/800 firm order 36 A/C 900
Dash 8-400 firm order 22 A/C 400
Total 1.300
Pre-payments to manufactures 300(as of Jun 30 1999)
Net capital expenditures 1000
1999-11-16
ANA/11AUG99
DU/UZ/STU
DU/GR/UP
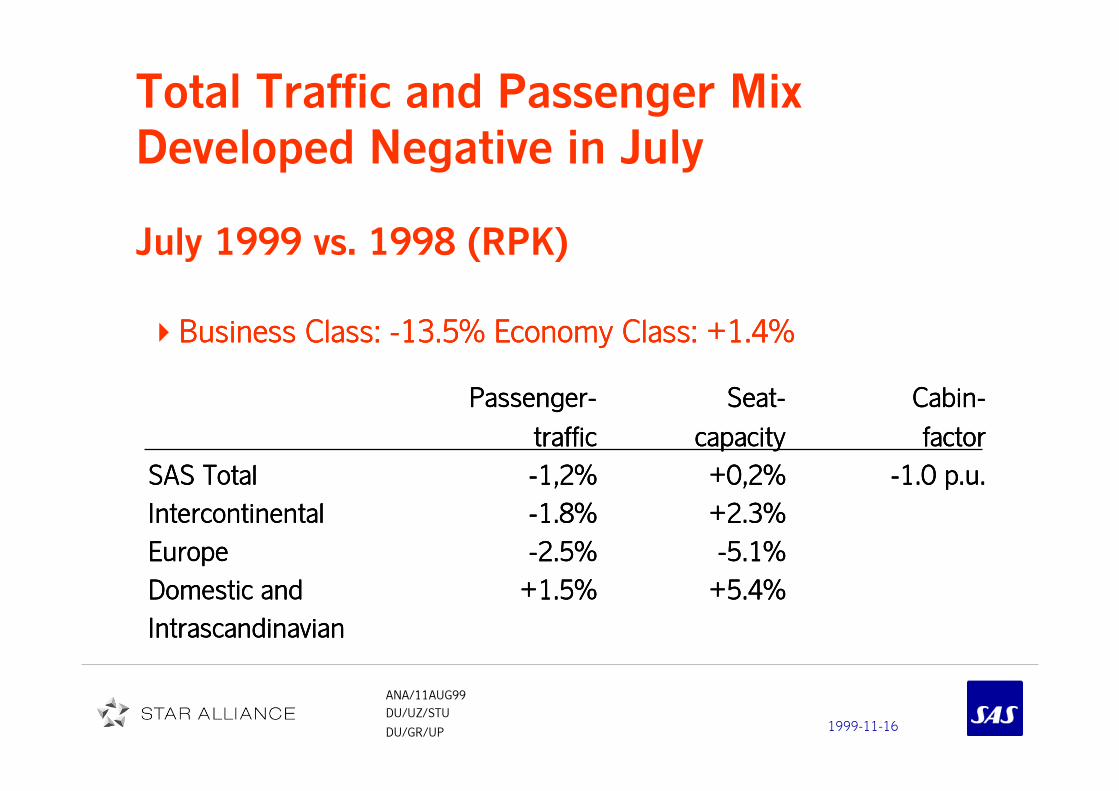
Total Traffic and Passenger Mix
Developed Negative in July
July 1999 vs. 1998 (RPK)
�Business Class: -13.5% Economy Class: +1.4%Business Class: -13.5% Economy Class: +1.4%Business Class: -13.5% Economy Class: +1.4%Business Class: -13.5% Economy Class: +1.4%
Passenger-Passenger-Passenger-Passenger- Seat-Seat-Seat-Seat- Cabin-Cabin-Cabin-Cabin-
traffictraffictraffictraffic capacity capacity capacity capacity factorfactorfactorfactor
SAS TotalSAS TotalSAS TotalSAS Total -1,2%-1,2%-1,2%-1,2% +0,2%+0,2%+0,2%+0,2% -1.0 p.u.-1.0 p.u.-1.0 p.u.-1.0 p.u.
IntercontinentalIntercontinentalIntercontinentalIntercontinental -1.8%-1.8%-1.8%-1.8% +2.3%+2.3%+2.3%+2.3%
EuropeEuropeEuropeEurope -2.5%-2.5%-2.5%-2.5% -5.1%-5.1%-5.1%-5.1%
Domestic andDomestic andDomestic andDomestic and +1.5%+1.5%+1.5%+1.5% +5.4%+5.4%+5.4%+5.4%
IntrascandinavianIntrascandinavianIntrascandinavianIntrascandinavian

1999-11-16
ANA/11AUG99
DU/UZ/STU
DU/GR/UP
Development of Passenger TrafficJanuary - July 1999 vs. 1998 (RPK)
�Negative passenger mix
�Business Class: -4.4% Economy Class: +6.5%Business Class: -4.4% Economy Class: +6.5%Business Class: -4.4% Economy Class: +6.5%Business Class: -4.4% Economy Class: +6.5%
Passenger-Passenger-Passenger-Passenger- Seat-Seat-Seat-Seat- Cabin-Cabin-Cabin-Cabin-
traffictraffictraffictraffic capacity capacity capacity capacity factorfactorfactorfactor
SAS TotalSAS TotalSAS TotalSAS Total +3,2%+3,2%+3,2%+3,2% +6,8%+6,8%+6,8%+6,8% -2.3 p.u.-2.3 p.u.-2.3 p.u.-2.3 p.u.
IntercontinentalIntercontinentalIntercontinentalIntercontinental +3.1%+3.1%+3.1%+3.1% +8.3%+8.3%+8.3%+8.3%
EuropeEuropeEuropeEurope +0.7%+0.7%+0.7%+0.7% +0.7%+0.7%+0.7%+0.7%
Domestic andDomestic andDomestic andDomestic and +6.3%+6.3%+6.3%+6.3% +13.1%+13.1%+13.1%+13.1%
IntrascandinavianIntrascandinavianIntrascandinavianIntrascandinavian

1999-11-16
ANA/11AUG99
DU/UZ/STU
DU/GR/UP
US:US:US:US:
• GDP +3.5% (unch.)
• Weaker/ flat USD
• Higher Interest rates
Current Macroeconomic Outlook
SAS' Main Markets (Consensus)
Euroland:
Moderate growth
Germany stronger
Asia excl. Japan:
• Recovery in most
regions
Japan:
• Slightly better
but from low
level
Norway:Norway:Norway:Norway:
• Oil Price strong
• Int. rates down
• Recovery
Sweden:Sweden:Sweden:Sweden:
• Export, consumption
and GDP
stronger
Denmark:Denmark:Denmark:Denmark:
• Slight
slowdown,
but stronger
prospects
UK:UK:UK:UK:
• GDP +1-2%
• V- shaped recovery
• Int. rates down
1999-11-16
ANA/11AUG99
DU/UZ/STU
DU/GR/UP
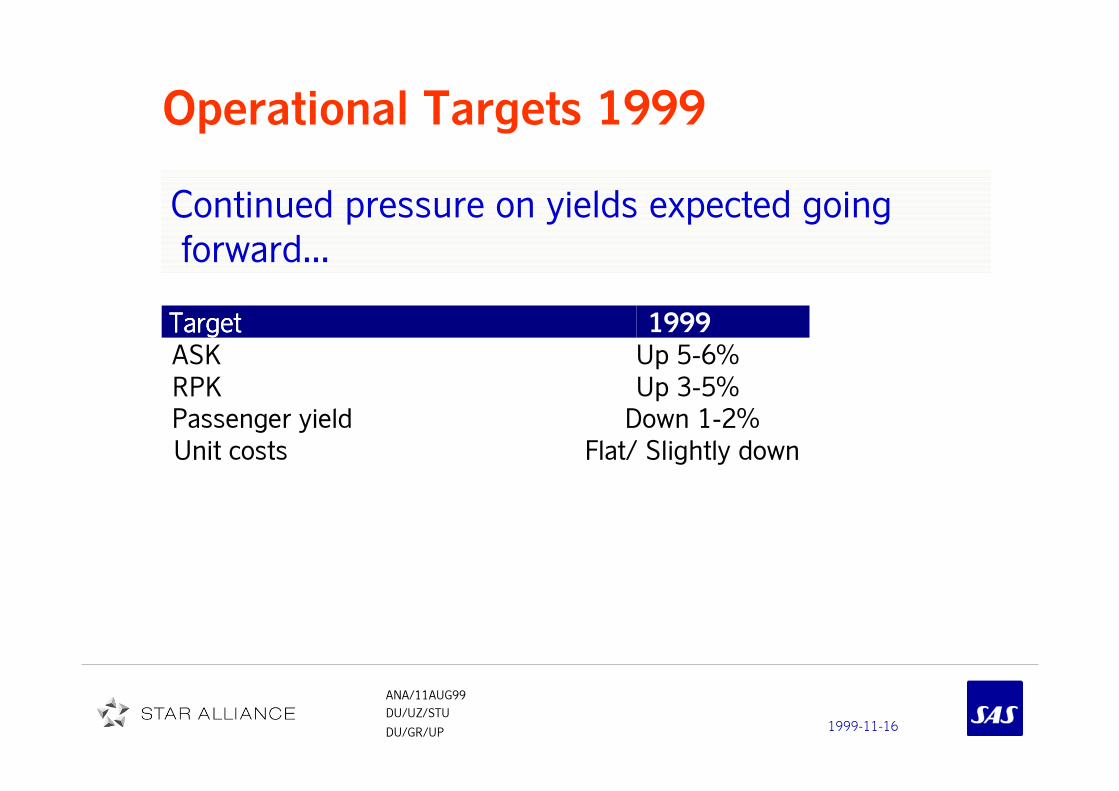
Operational Targets 1999
Continued pressure on yields expected going
forward...
1999
ASK Up 5-6%
RPK Up 3-5%
Passenger yield Down 1-2%
Unit costs Flat/ Slightly down
TargetTargetTargetTarget

1999-11-16
ANA/11AUG99
DU/UZ/STU
DU/GR/UP
Summary of Agenda Going Forward..
Strong momentum in the implementation
of Result Improvement Program and
potential structural changes
Maintain and develop market position in
core areas in order to be well positioned
for the expected future market growth
Further develop STAR and STAR synergies
Continued prime focus on the Premium
(Business class) segment

1999-11-16
ANA/11AUG99
DU/UZ/STU
DU/GR/UP
Outlook 1999
Continued weak demand in most markets
Business class growth slow
Over-capacity continue to put pressure on
passenger yields and cabin factor
Increased competition from new entrants
Increased Jet Fuel prices
Unit costs slightly down in 1999

1999-11-16
ANA/11AUG99
DU/UZ/STU
DU/GR/UP
The Board of Directors
Adheres to its Assessment for 1999 that:
Income before taxes will be considerably
below that of the previous year.
Assessment assumes no further capital
gains during second half of 1999

1999-11-16
ANA/11AUG99
DU/UZ/STU
DU/GR/UP
APPENDICESAPPENDICESAPPENDICESAPPENDICES
Share price dataShare price dataShare price dataShare price data
STARSTARSTARSTAR
Currency effectsCurrency effectsCurrency effectsCurrency effects
Financial dataFinancial dataFinancial dataFinancial data
Traffic & Yield dataTraffic & Yield dataTraffic & Yield dataTraffic & Yield data
Revenues & costs dataRevenues & costs dataRevenues & costs dataRevenues & costs data
Balance sheet dataBalance sheet dataBalance sheet dataBalance sheet data
DefinitionsDefinitionsDefinitionsDefinitions
SAS IRSAS IRSAS IRSAS IR

1999-11-16
ANA/11AUG99
DU/UZ/STU
DU/GR/UP
Share price dataShare price dataShare price dataShare price data

1999-11-16
ANA/11AUG99
DU/UZ/STU
DU/GR/UP
SAS Total Market Capitalization1997 - 1999
11.011.011.011.0
13.013.013.013.0
15.015.015.015.0
17.017.017.017.0
19.019.019.019.0
21.021.021.021.0
23.023.023.023.0
25.025.025.025.0
Jan97Jan97Jan97Jan97 Apr97Apr97Apr97Apr97 Jul97Jul97Jul97Jul97 Oct97Oct97Oct97Oct97 Jan98Jan98Jan98Jan98 Apr98Apr98Apr98Apr98 Jul98Jul98Jul98Jul98 Oct98Oct98Oct98Oct98 Jan99Jan99Jan99Jan99 Apr99Apr99Apr99Apr99
SEK SEK SEK SEK
((((mrdmrdmrdmrd.).).).)

1999-11-16
ANA/11AUG99
DU/UZ/STU
DU/GR/UP
DEN
NOR
SWE
SAS Share PricesSWE and NOR still 15-20% discount vs. DEN
-30.00%-30.00%-30.00%-30.00%
-25.00%-25.00%-25.00%-25.00%
-20.00%-20.00%-20.00%-20.00%
-15.00%-15.00%-15.00%-15.00%
-10.00%-10.00%-10.00%-10.00%
-5.00%-5.00%-5.00%-5.00%
0.00%0.00%0.00%0.00%
5.00%5.00%5.00%5.00%
10.00%10.00%10.00%10.00%
15.00%15.00%15.00%15.00%
20.00%20.00%20.00%20.00%
25.00%25.00%25.00%25.00%
30.00%30.00%30.00%30.00%
JJJJ MMMM MMMM JJJJ SSSS NNNN JJJJ MMMM MMMM JJJJ SSSS NNNN JJJJ MMMM MMMM
SASSASSASSAS Danmark Danmark Danmark Danmark A/S A/S A/S A/S SASSASSASSAS Norge Norge Norge Norge ASA ASA ASA ASA SASSASSASSAS Sverige Sverige Sverige Sverige AB AB AB AB
1999-11-16
ANA/11AUG99
DU/UZ/STU
DU/GR/UP
STARSTARSTARSTAR

1999-11-16
ANA/11AUG99
DU/UZ/STU
DU/GR/UP
Star Alliance SynergiesCode-Sharing with 20 Partners
Number of destinations
29MAR99 30JUN99
SAS network 95 98
SAS code-shared with LH +42 +43
SAS code-shared with other +88 +100
TOTAL 225 241
Number of frequencies/day
19-25APR99 28JUN-04JUL99
SAS operated, no code-sharing 493 495
Partner flts on SAS 458 492
SAS comm. flts on partners 914 978
TOTAL 1 865 1 965
1999-11-16
ANA/11AUG99
DU/UZ/STU
DU/GR/UP
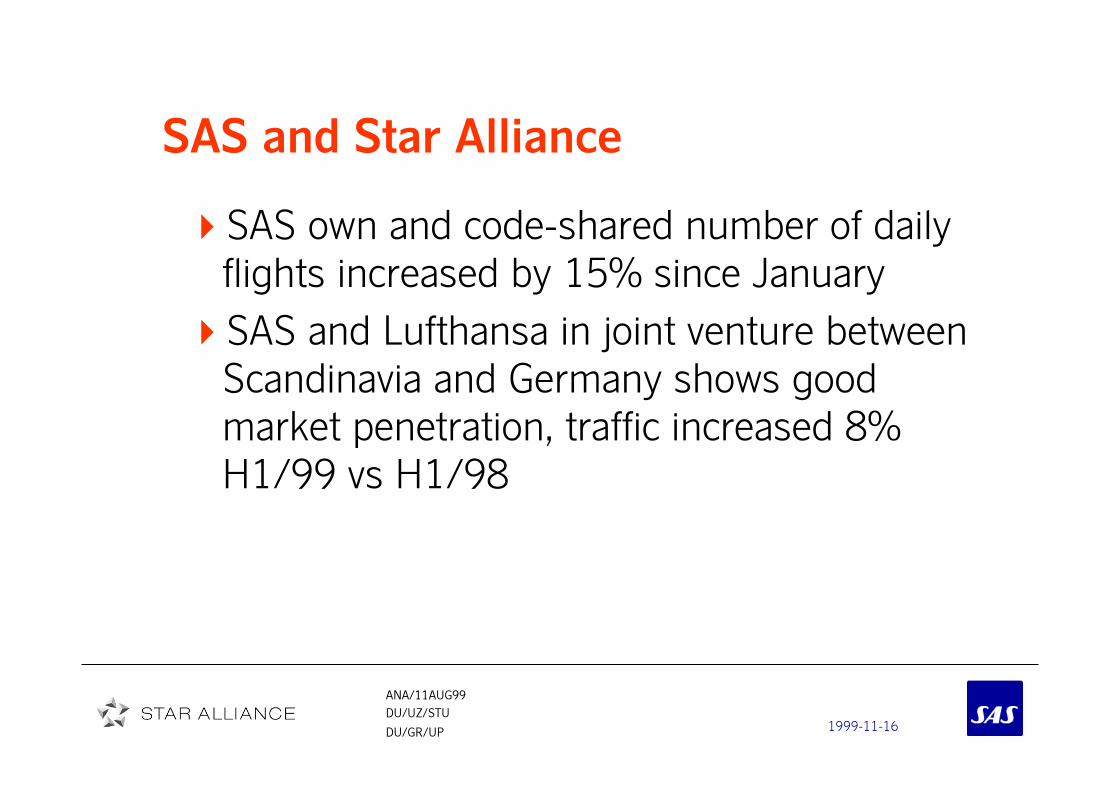
SAS and Star Alliance
SAS own and code-shared number of daily
flights increased by 15% since January
SAS and Lufthansa in joint venture between
Scandinavia and Germany shows good
market penetration, traffic increased 8%
H1/99 vs H1/98

1999-11-16
ANA/11AUG99
DU/UZ/STU
DU/GR/UP
Currency effectsCurrency effectsCurrency effectsCurrency effects

1999-11-16
ANA/11AUG99
DU/UZ/STU
DU/GR/UP
SAS Airline
Currency Distribution
Revenues CostsMajor deficiency currencies:
USD,DKK
34%
20%14%
19%
9%
4%
SEKNOKDKKUSDGBPother
28%
24%19%
14%
15%SEKDKKUSDNOKother

1999-11-16
ANA/11AUG99
DU/UZ/STU
DU/GR/UP
SAS Airline
Currency Effects 1999 vs 1998(MSEK)
2nd quarter 1st half
Total revenues + 333 + 456
Total costs - 321 - 449
Forward cover costs & working cap. - 6 - 6
Income bef. depr. + 6 + 1
Financial items - 3 - 20
Income before tax + 3 - 19
1999-11-16
ANA/11AUG99
DU/UZ/STU
DU/GR/UP
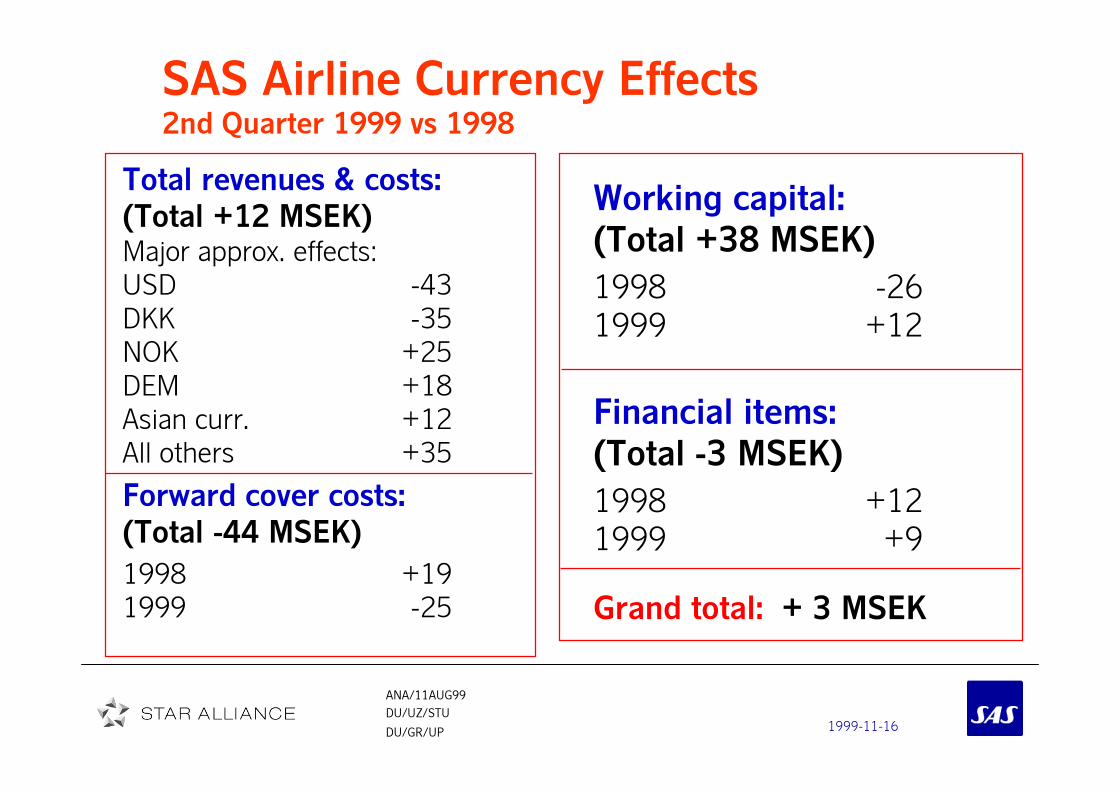
SAS Airline Currency Effects2nd Quarter 1999 vs 1998
Total revenues & costs:
(Total +12 MSEK)Major approx. effects:
USD -43
DKK -35
NOK +25
DEM +18
Asian curr. +12
All others +35
Forward cover costs:
(Total -44 MSEK)
1998 +19
1999 -25
Working capital:
(Total +38 MSEK)
1998 -26
1999 +12
Financial items:
(Total -3 MSEK)
1998 +12
1999 +9
Grand total: + 3 MSEK
1999-11-16
ANA/11AUG99
DU/UZ/STU
DU/GR/UP
Financial data
1999-11-16
ANA/11AUG99
DU/UZ/STU
DU/GR/UP
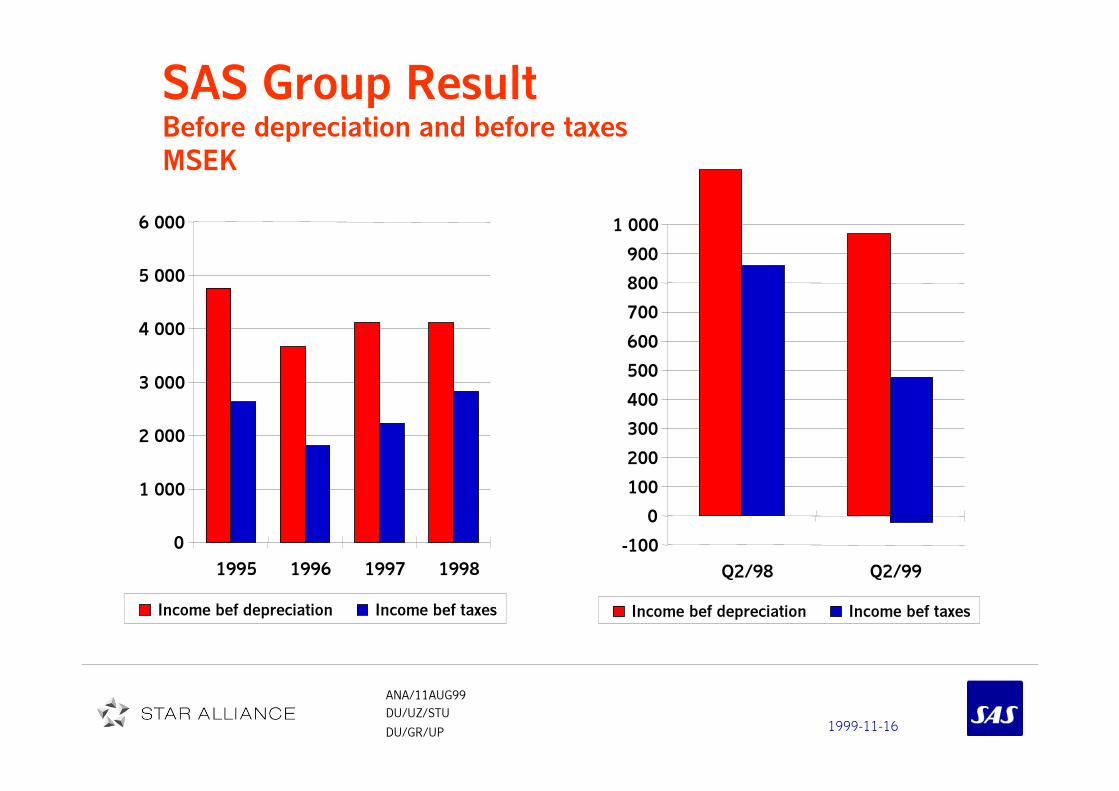
SAS Group ResultBefore depreciation and before taxes
MSEK
0
1 000
2 000
3 000
4 000
5 000
6 000
1995 1996 1997 1998
Income bef depreciation Income bef taxes
-100
0
100
200
300
400
500
600
700
800
900
1 000
Q2/98 Q2/99
Income bef depreciation Income bef taxes
1999-11-16
ANA/11AUG99
DU/UZ/STU
DU/GR/UP
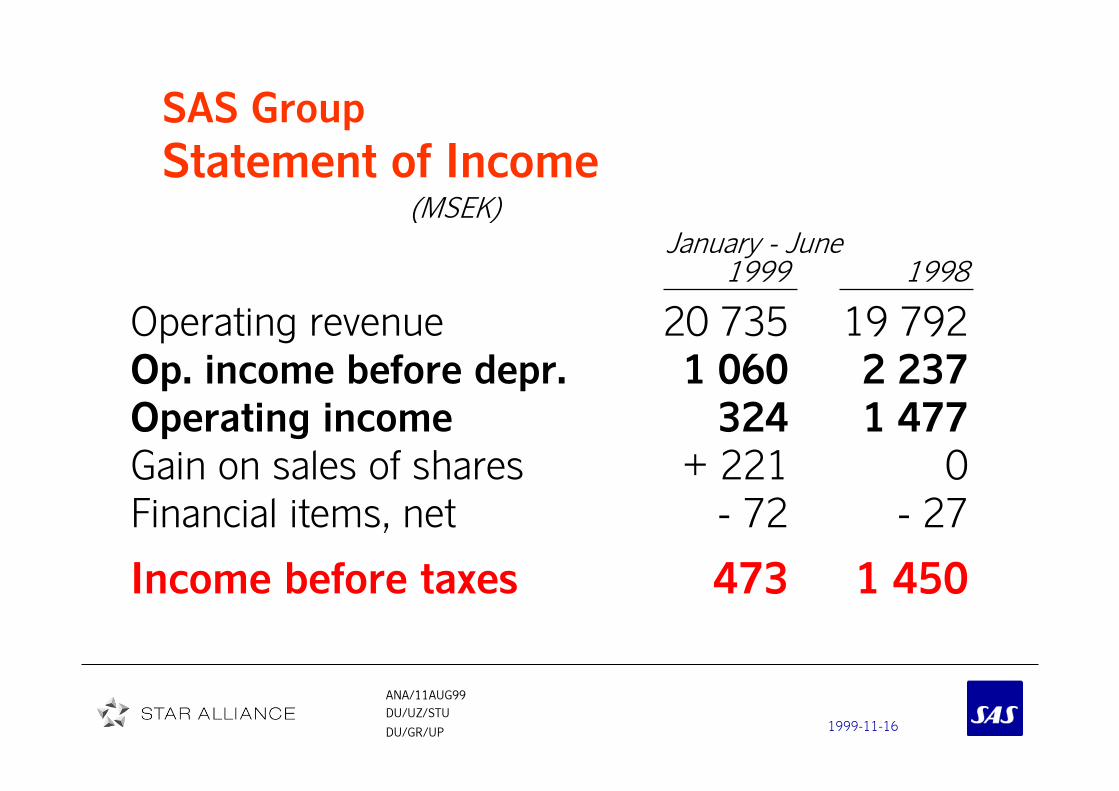
SAS Group
Statement of Income (MSEK)
January - June1999 1998
Operating revenue 20 735 19 792
Op. income before depr. 1 060 2 237
Operating income 324 1 477
Gain on sales of shares + 221 0
Financial items, net - 72 - 27
Income before taxes 473 1 450

1999-11-16
ANA/11AUG99
DU/UZ/STU
DU/GR/UP
SAS Group
Income by Business Unit
(MSEK)
January - June
1999 1998
SAS 254 1 330
SAS International Hotels 229 116
Other operations/Group elim. - 10 + 4
Income before taxes 473 1 450

1999-11-16
ANA/11AUG99
DU/UZ/STU
DU/GR/UP
SAS Group
Net Financial Items
(MSEK)
January - June
1999 1998
Interest net etc. - 91 -46
Currency differences + 19 + 19
Financial items, net - 72 - 27

1999-11-16
ANA/11AUG99
DU/UZ/STU
DU/GR/UP
SAS Group Investments
MSEKMSEKMSEKMSEK JAN-JUN99JAN-JUN99JAN-JUN99JAN-JUN99 JAN-JUN98JAN-JUN98JAN-JUN98JAN-JUN98
Aircraft and spare partsAircraft and spare partsAircraft and spare partsAircraft and spare parts 1 6901 6901 6901 690 95959595
Prepayments aircraftPrepayments aircraftPrepayments aircraftPrepayments aircraft 675675675675 920920920920
OtherOtherOtherOther 638638638638 1 2341 2341 2341 234
Total 3 003 2 249

1999-11-16
ANA/11AUG99
DU/UZ/STU
DU/GR/UP
SAS Group
Income before taxes
Bars = Quarterly income Line = Moving 12 months result
Bars = quarterly Line = moving 4 quarters
-3 000
-2 000
-1 000
0
1 000
2 000
3 000
4 000
Q1-92
Q2-92
Q3-92
Q4-92
Q1-93
Q2-93
Q3-93
Q4-93
Q1-94
Q2-94
Q3-94
Q4-94
Q1-95
Q2-95
Q3-95
Q4-95
Q1-96
Q2-96
Q3-96
Q4-96
Q1-97
Q2-97
Q3-97
Q4-97
Q1-98
Q2-98
Q3-98
Q4-98
Q1-99
Q2-99
MSEK

1999-11-16
ANA/11AUG99
DU/UZ/STU
DU/GR/UP
SAS (incl. SAS Trading)
Revenues (as is)
MSEK JAN-JUN99 JAN-JUN98 curr adj 98
Passenger revenues 14 386 13 818 14 159
Cargo revenues 1 087 1 087 1 125
Other traffic revenues 457 604 635
Other revenues 3 400 3 015 3 061
TOTAL REVENUES 19 330 18 524 18 980
1999-11-16
ANA/11AUG99
DU/UZ/STU
DU/GR/UP
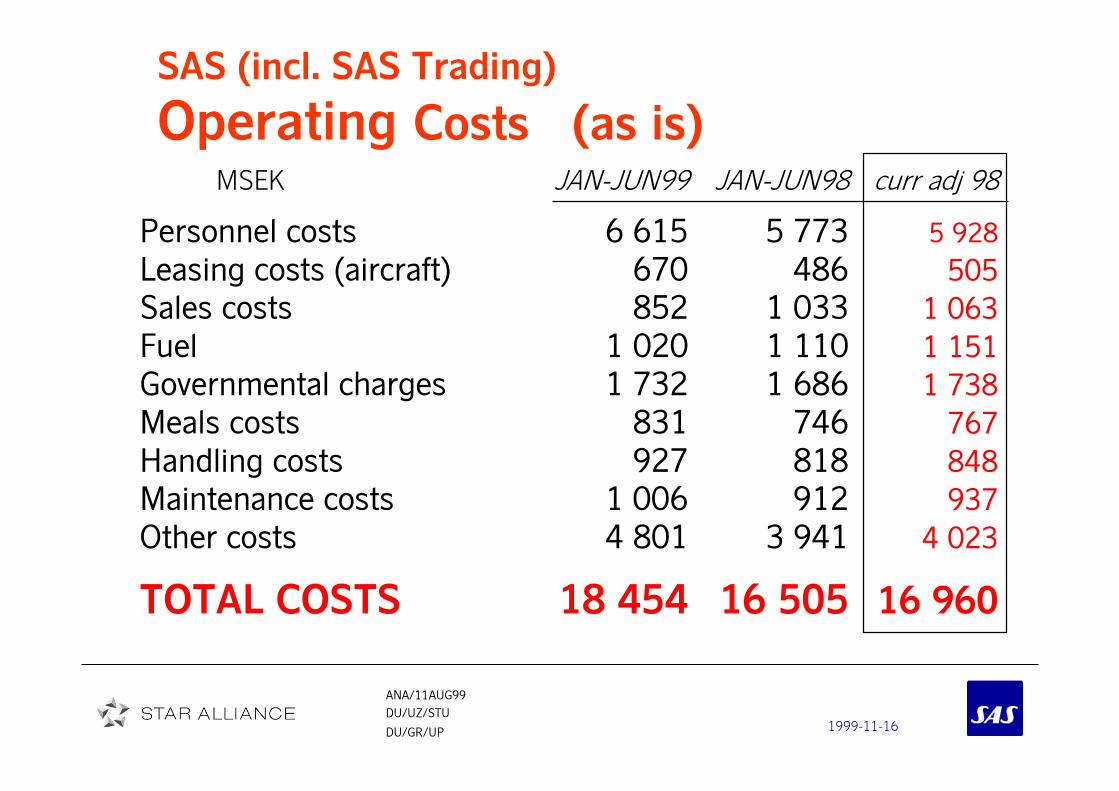
SAS (incl. SAS Trading)
Operating Costs (as is) MSEK JAN-JUN99 JAN-JUN98 curr adj 98
Personnel costs 6 615 5 773 5 928
Leasing costs (aircraft) 670 486 505
Sales costs 852 1 033 1 063
Fuel 1 020 1 110 1 151
Governmental charges 1 732 1 686 1 738
Meals costs 831 746 767
Handling costs 927 818 848
Maintenance costs 1 006 912 937
Other costs 4 801 3 941 4 023
TOTAL COSTS 18 454 16 505 16 960

1999-11-16
ANA/11AUG99
DU/UZ/STU
DU/GR/UP
SAS
Statement of income(MSEK)
January - June
1999 1998
Operating revenue *) 18 023 17 254
Operating income bef. depr. *) 1 433 2 339
Operating income 74 1 321
Income before taxes 254 1 330
*) Excluding SAS Trading and aircraft lease net

1999-11-16
ANA/11AUG99
DU/UZ/STU
DU/GR/UP
SASIncome before e.o. items
Bars = Quarterly income Line = Moving 12 months result
Bars = quarterly Line = moving 4 quarters
-4 000
-3 000
-2 000
-1 000
0
1 000
2 000
3 000
4 000
Q1-92
Q2-92
Q3-92
Q4-92
Q1-93
Q2-93
Q3-93
Q4-93
Q1-94
Q2-94
Q3-94
Q4-94
Q1-95
Q2-95
Q3-95
Q4-95
Q1-96
Q2-96
Q3-96
Q4-96
Q1-97
Q2-97
Q3-97
Q4-97
Q1-98
Q2-98
Q3-98
Q4-98
Q1-99
Q2-99
MSEK
1999-11-16
ANA/11AUG99
DU/UZ/STU
DU/GR/UP
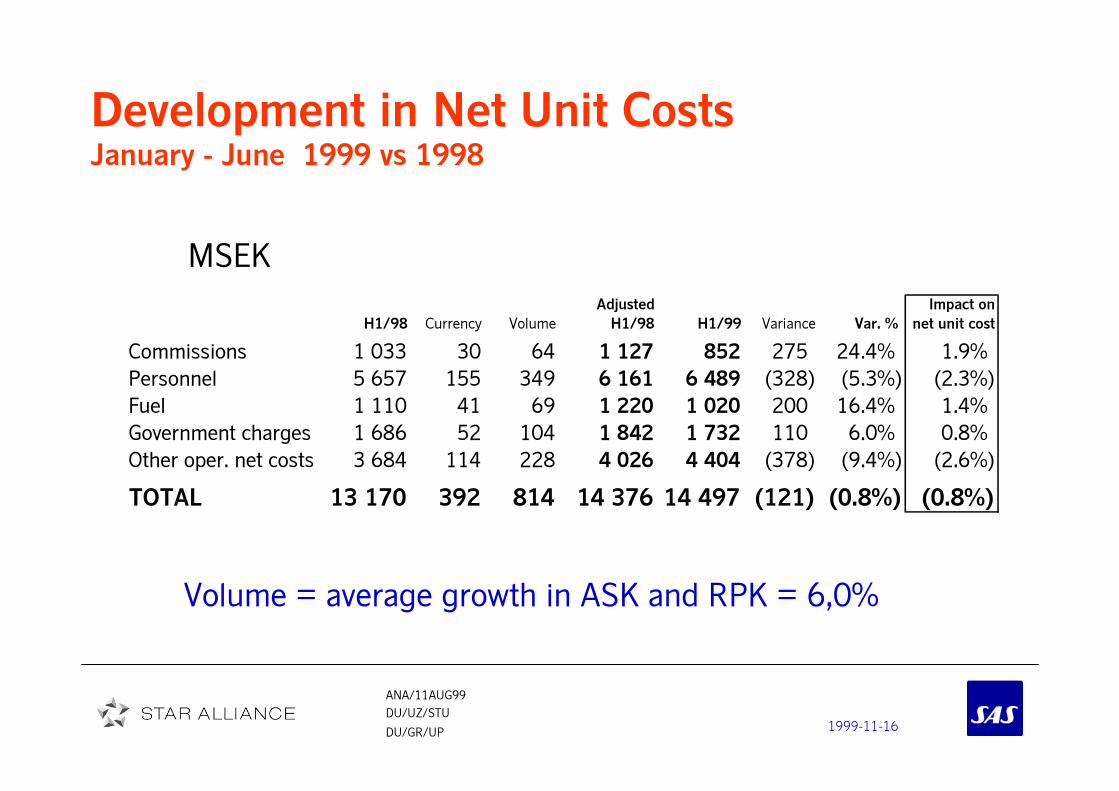
Development in Net Unit CostsJanuary - June 1999 vs 1998
MSEK
Volume = average growth in ASK and RPK = 6,0%
Adjusted Impact on
H1/98 Currency Volume H1/98 H1/99 Variance Var. % net unit cost
Commissions 1 033 30 64 1 127 852 275 24.4% 1.9%
Personnel 5 657 155 349 6 161 6 489 (328) (5.3%) (2.3%)
Fuel 1 110 41 69 1 220 1 020 200 16.4% 1.4%
Government charges 1 686 52 104 1 842 1 732 110 6.0% 0.8%
Other oper. net costs 3 684 114 228 4 026 4 404 (378) (9.4%) (2.6%)
TOTAL 13 170 392 814 14 376 14 497 (121) (0.8%) (0.8%)

1999-11-16
ANA/11AUG99
DU/UZ/STU
DU/GR/UP
SAS Group
Income after depreciation
Bars = Quarterly income Line = Moving 12 months result
Bars = quarterly Line = moving 4 quarters
-1 000
-500
0
500
1 000
1 500
2 000
2 500
3 000
3 500
Q1-92
Q2-92
Q3-92
Q4-92
Q1-93
Q2-93
Q3-93
Q4-93
Q1-94
Q2-94
Q3-94
Q4-94
Q1-95
Q2-95
Q3-95
Q4-95
Q1-96
Q2-96
Q3-96
Q4-96
Q1-97
Q2-97
Q3-97
Q4-97
Q1-98
Q2-98
Q3-98
Q4-98
Q1-99
Q2-99
MSEK

1999-11-16
ANA/11AUG99
DU/UZ/STU
DU/GR/UP
SAS GroupDevelopment of Net Debt/Equity Ratio
0.00
0.25
0.50
0.75
1.00
1.25
1.50
1.75
2.00
2.25
2.50
dec-92
jun-93
dec-93
jun-94
dec-94
jun-95
dec-95
jun-96
dec-96
jun-97
dec-97
jun-98
dec-98
jun-99
1999-11-16
ANA/11AUG99
DU/UZ/STU
DU/GR/UP
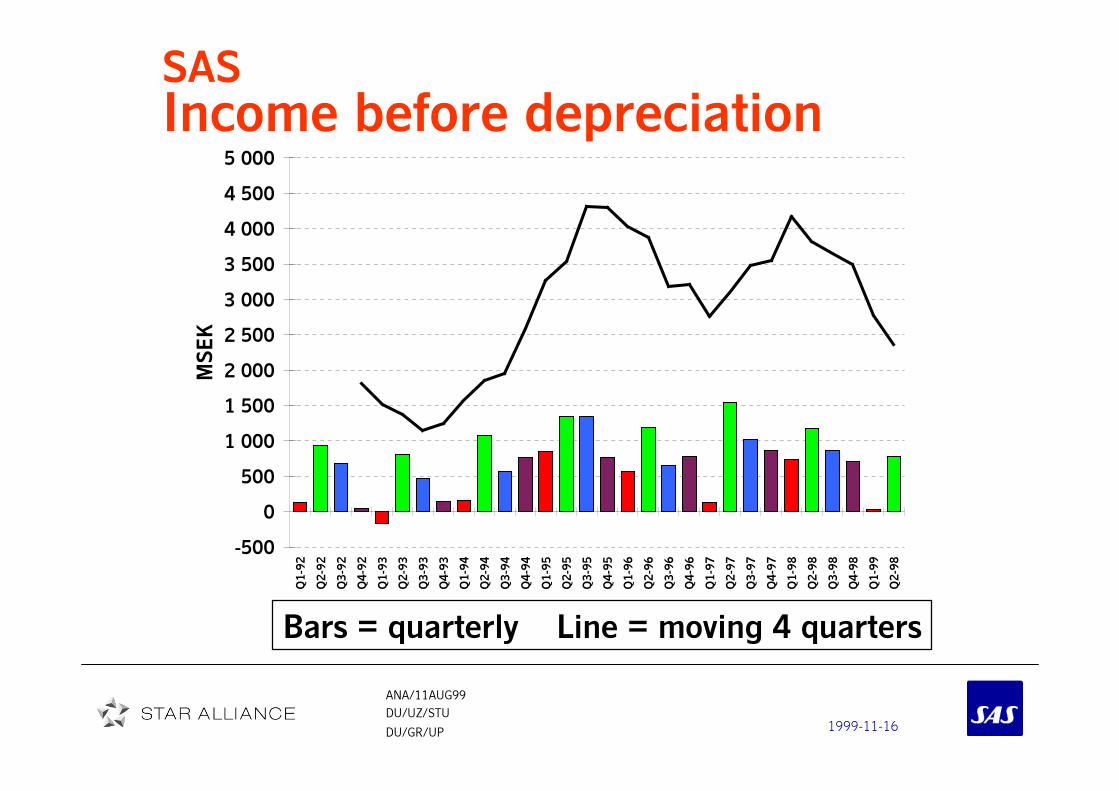
SASIncome before depreciation
Bars = Quarterly income Line = Moving 12 months result
Bars = quarterly Line = moving 4 quarters
-500
0
500
1 000
1 500
2 000
2 500
3 000
3 500
4 000
4 500
5 000
Q1-92
Q2-92
Q3-92
Q4-92
Q1-93
Q2-93
Q3-93
Q4-93
Q1-94
Q2-94
Q3-94
Q4-94
Q1-95
Q2-95
Q3-95
Q4-95
Q1-96
Q2-96
Q3-96
Q4-96
Q1-97
Q2-97
Q3-97
Q4-97
Q1-98
Q2-98
Q3-98
Q4-98
Q1-99
Q2-98
MSEK
1999-11-16
ANA/11AUG99
DU/UZ/STU
DU/GR/UP
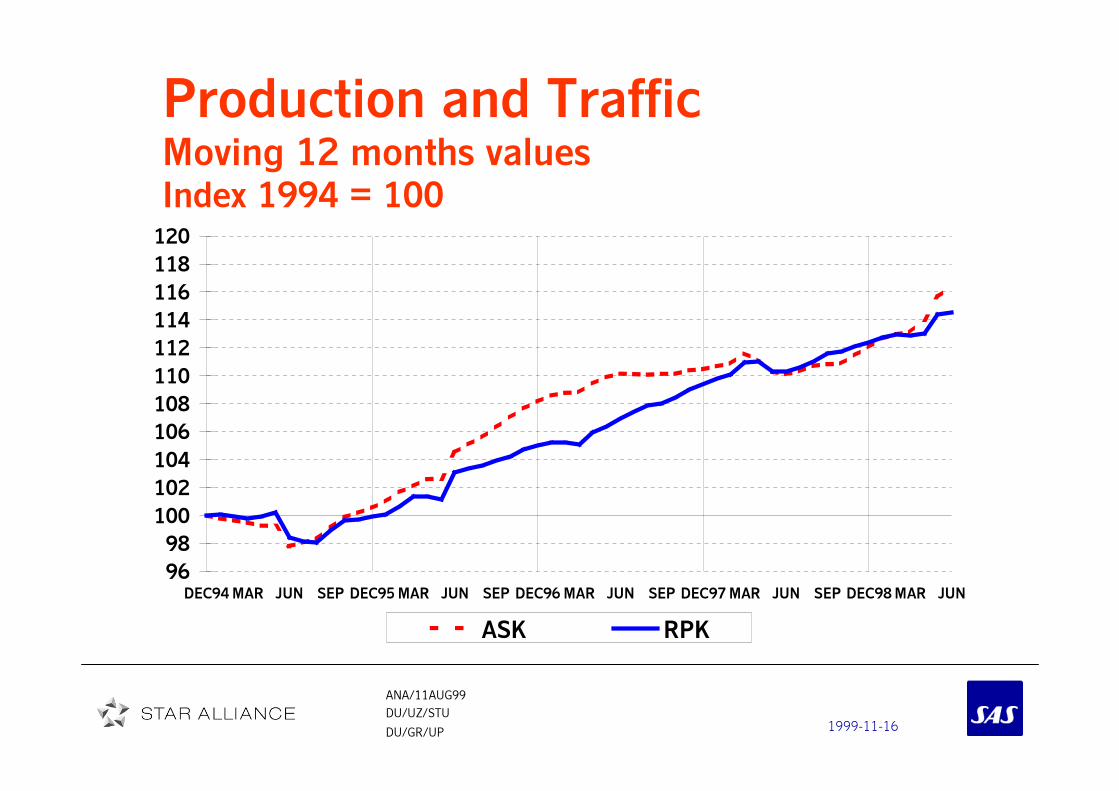
Production and TrafficMoving 12 months valuesIndex 1994 = 100
96
98
100
102
104
106
108
110
112
114
116
118
120
DEC94MAR JUN SEP DEC95MAR JUN SEP DEC96MAR JUN SEP DEC97MAR JUN SEP DEC98MAR JUN
ASK RPK

1999-11-16
ANA/11AUG99
DU/UZ/STU
DU/GR/UP
Development of SEK vs ECUIndex 1991-05-17 = 100
110
112
114
116
118
120
122
124
126
128
130
132
134
136
jan-96 jan-97 jan-98 jan-99
SEK INDEX
1999-11-16
ANA/11AUG99
DU/UZ/STU
DU/GR/UP
Traffic & Yield data

1999-11-16
ANA/11AUG99
DU/UZ/STU
DU/GR/UP
Traffic and Yield2nd Quarter 1999 vs 1998
2nd quarter Index,
SAS Total Scheduled 1999 1998 variance
Production (mill ASK) 8 466 7 545 112
Traffic (mill RPK) 5 571 5 260 106
Cabin factor (%) 65,8 69,7 - 3,9
C-class share (%) 30,6 32,3 - 1,7
Yield (öre/RPK) 140 138 101
Currency adj. yield 140 143 98

1999-11-16
ANA/11AUG99
DU/UZ/STU
DU/GR/UP
Production and Traffic 2nd Quarter 1999 vs 1998
Route Sector Production Traffic CabinScheduled ASK RPK factor %
SAS Total 112 106 - 3,9
Intercontinental 112 108 - 2,8
Europe 106 102 - 2,4
Intrascandinavian 124 116 - 4,2
Denmark/Greenland 94 96 + 1,6
Norway 131 105 - 13,6
Sweden 113 108 - 3,3

1999-11-16
ANA/11AUG99
DU/UZ/STU
DU/GR/UP
Traffic Analysis 2nd Quarter 1999 vs 1998
Route Sector Fullfare Discounted Total trafficScheduled RPK-C RPK-M RPK
SAS Total 100 109 106
Intercontinental 101 110 108
Europe 95 105 102
Intrascandinavian 113 118 116
Denmark/Greenland 102 92 96
Norway 95 111 105
Sweden 106 110 108

1999-11-16
ANA/11AUG99
DU/UZ/STU
DU/GR/UP
Passenger Yield2nd Quarter 1999 vs 1998
Route Sector Nominal Currency AdjustedScheduled yield effect yield
SAS Total 101 97 98
Intercontinental 99 94 93
Europe 101 96 97
Intrascandinavian 105 97 102
Denmark/Greenland 107 95 101
Norway 101 96 97
Sweden 100 100 100

1999-11-16
ANA/11AUG99
DU/UZ/STU
DU/GR/UP
Traffic and YieldJAN-JUN 1999 vs 1998
JAN-JUN Index,
SAS Total Scheduled 1999 1998 variance
Production (mill ASK) 16 528 15 306 108
Traffic (mill RPK) 10 283 9 888 104
Cabin factor (%) 62,2 64,6 - 2,4
C-class share (%) 31,1 33,5 - 2,4
Yield (öre/RPK) 140 140 100
Currency adj. yield 140 143 98
1999-11-16
ANA/11AUG99
DU/UZ/STU
DU/GR/UP
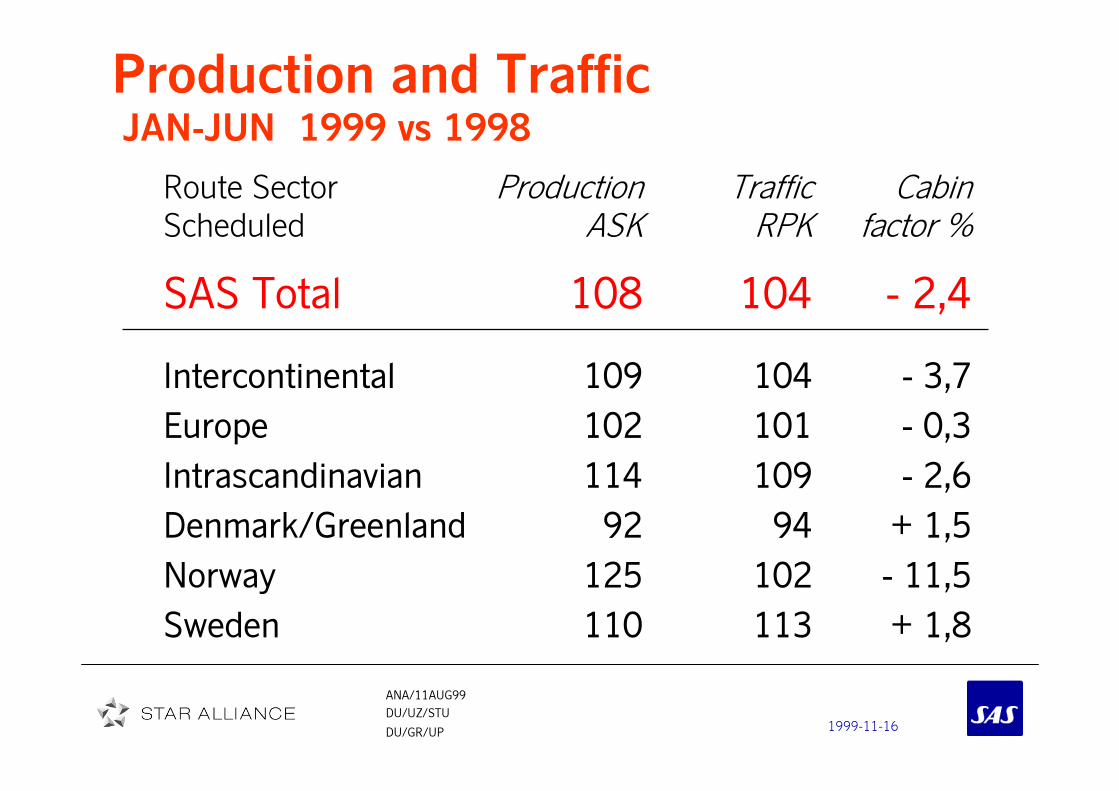
Production and Traffic JAN-JUN 1999 vs 1998
Route Sector Production Traffic Cabin
Scheduled ASK RPK factor %
SAS Total 108 104 - 2,4
Intercontinental 109 104 - 3,7
Europe 102 101 - 0,3
Intrascandinavian 114 109 - 2,6
Denmark/Greenland 92 94 + 1,5
Norway 125 102 - 11,5
Sweden 110 113 + 1,8

1999-11-16
ANA/11AUG99
DU/UZ/STU
DU/GR/UP
Traffic Analysis JAN-JUN 1999 vs 1998
Route Sector Fullfare Discounted Total trafficScheduled RPK-C RPK-M RPK
SAS Total 97 108 104
Intercontinental 95 107 104
Europe 93 106 101
Intrascandinavian 103 114 109
Denmark/Greenland 96 93 94
Norway 92 110 102
Sweden 107 118 113

1999-11-16
ANA/11AUG99
DU/UZ/STU
DU/GR/UP
Passenger YieldJAN-JUN 1999 vs 1998
Route Sector Nominal Currency Adjusted
Scheduled yield effect yield
SAS Total 100 98 98
Intercontinental 96 96 91
Europe 99 97 97
Intrascandinavian 102 98 100
Denmark/Greenland 104 95 99
Norway 97 99 95
Sweden 97 100 96
1999-11-16
ANA/11AUG99
DU/UZ/STU
DU/GR/UP
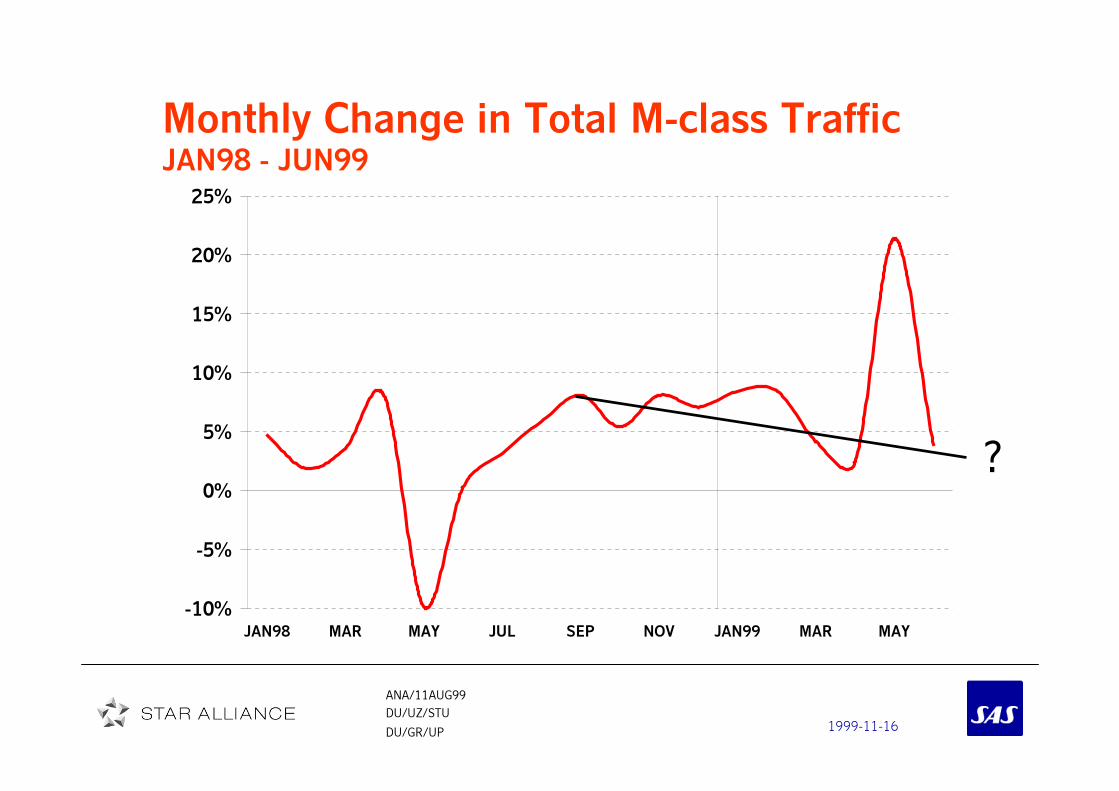
Monthly Change in Total M-class TrafficJAN98 - JUN99
?
-10%
-5%
0%
5%
10%
15%
20%
25%
JAN98 MAR MAY JUL SEP NOV JAN99 MAR MAY

1999-11-16
ANA/11AUG99
DU/UZ/STU
DU/GR/UP
Intercontinental Routes2nd Quarter 1999
• Weak development in
business travel
• Overcapacity to/from
North America
• Passenger load factor
75,9% (down 2,8 p.u.)
• Number of passengers
up 12,1%-15%
-10%
-5%
0%
5%
10%
15%
Q1/99 Q2/99 JAN-JUN99
ASK RPK RPK-C RPK-M
Change vs last year

1999-11-16
ANA/11AUG99
DU/UZ/STU
DU/GR/UP
European Routes2nd Quarter 1999
• Market shares kept on
UK
• Low feed from Europe to
intercontinental routes
• Passenger load factor
62,8% (down 2,4 p.u.)
• Number of passengers
up 1,9%-15%
-10%
-5%
0%
5%
10%
Q1/99 Q2/99 JAN-JUN99
ASK RPK RPK-C RPK-M
Change vs last year

1999-11-16
ANA/11AUG99
DU/UZ/STU
DU/GR/UP
Intrascandinavian Routes2nd Quarter 1999
• Q2/98 disturbed by
conflicts
• Stong development on
traffic between Denmark
and Sweden
• Passenger load factor
58,9% (down 4,2 p.u.)
• Number of passengers
up 12,8%-10%
-5%
0%
5%
10%
15%
20%
25%
30%
Q1/99 Q2/99 JAN-JUN99
ASK RPK RPK-C RPK-M
Change vs last year

1999-11-16
ANA/11AUG99
DU/UZ/STU
DU/GR/UP
Danish Domestic Routes
2nd Quarter 1999
• Adjustments in traffic
system due to infra-
structural changes in
Danish domestic market
still successful
• Passenger load factor
69,3% (up 1,6 p.u.)
• Number of passengers
down 4,2%-15%
-10%
-5%
0%
5%
Q1/99 Q2/99 JAN-JUN99
ASK RPK RPK-C RPK-M
Change vs last year

1999-11-16
ANA/11AUG99
DU/UZ/STU
DU/GR/UP
Norwegian Domestic Routes2nd Quarter 1999
• Overcapacity in the
market place
• Low business activity in
Norway
• Passenger load factor
54,6% (down 13,6 p.u.)
• Number of passengers
up 7,1%-15%
-10%
-5%
0%
5%
10%
15%
20%
25%
30%
35%
Q1/99 Q2/99 JAN-JUN99
ASK RPK RPK-C RPK-M
Change vs last year

1999-11-16
ANA/11AUG99
DU/UZ/STU
DU/GR/UP
Swedish Domestic Routes2nd Quarter 1999
• Balanced growth in Q2
• Passenger load factor
65,2% (down 3,3 p.u.)
• Number of passengers
up 8,8%
0%
5%
10%
15%
20%
25%
30%
35%
Q1/99 Q2/99 JAN-JUN99
ASK RPK RPK-C RPK-M
Change vs last year

1999-11-16
ANA/11AUG99
DU/UZ/STU
DU/GR/UP
SAS Cargo2nd Quarter 1999
• Low exports from Scandinavia to Asia and
Europe
• Hard competition on North Atlantic due to
overcapacity
• Prices low in Japan
• Increasing demands from Asia to Scandinavia

1999-11-16
ANA/11AUG99
DU/UZ/STU
DU/GR/UP
Change of Depreciation Plan
�Review of present depreciation policy on aircraft (6% per
year) in relation to the economic value diminution
�Adjusted plan adopted from 01JAN:
4,5% annual book depreciation to a residual value of 10%
after 20 years
�By eliminating over-depreciation, the new policy will pre-
empt surplus values from accumulating in the aircraft fleet
and reduce fluctuations in earnings
� Effect in JAN-JUN99: 210 MSEK
� Effect full year 1999: approx. 450 MSEK

1999-11-16
ANA/11AUG99
DU/UZ/STU
DU/GR/UP
SAS Aircraft Fleet
Aircraft in SAS Traffic
30JUN99 31MAR99 30DEC98
Boeing 747-243 0 1 1
Boeing 767-300 14 14 14
MD-81/82/83 49 49 49
MD-87 18 18 18
MD-90 8 8 8
Boeing 737-600 20 14 8
DC-9-81 9 9 9
DC-9-41 21 21 22
DC-9-21 4 4 4
Boeing 737-300 2 2 0
Fokker F28 11 14 16
Fokker F50 22 22 22
SAAB 2000 6 6 6
TOTAL 184 182 177

1999-11-16
ANA/11AUG99
DU/UZ/STU
DU/GR/UP
RegularityPerformed flights of scheduled(axis shows internal standard)
88%
90%
92%
94%
96%
98%
100%
JAN FEB MAR APR MAY JUN JUL AUG SEP OCT NOV DEC
1996 1997 1998 1999
1999-11-16
ANA/11AUG99
DU/UZ/STU
DU/GR/UP
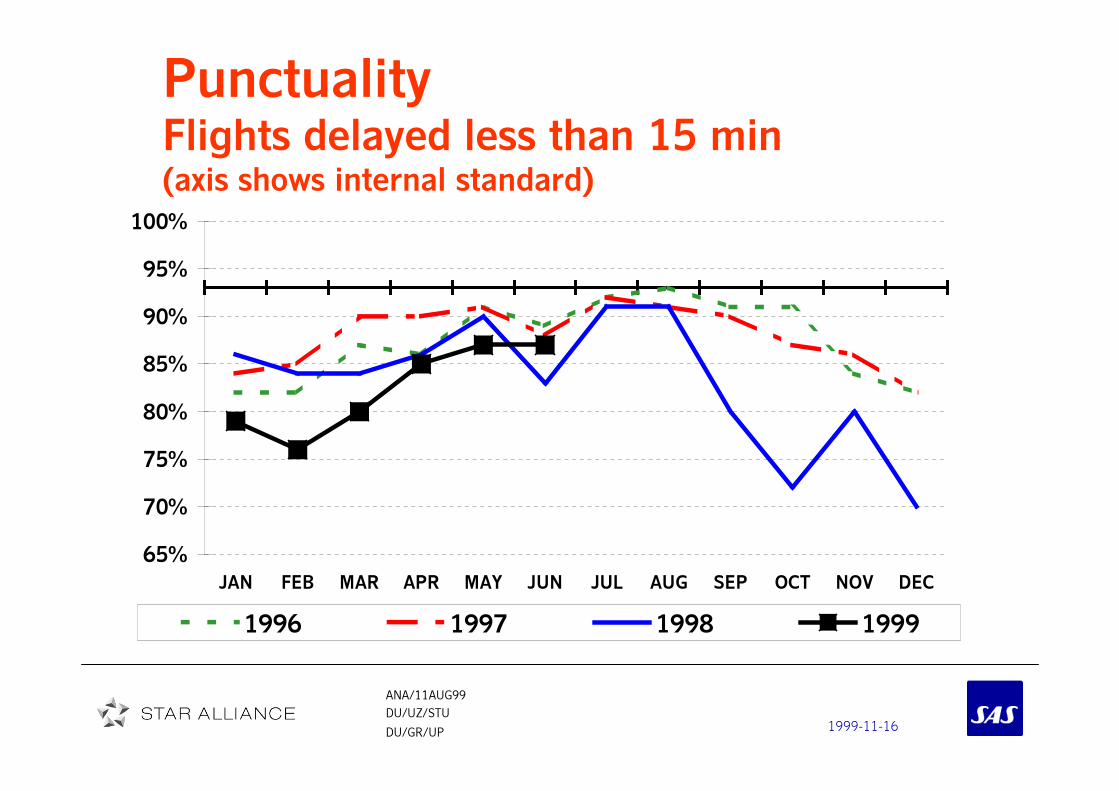
PunctualityFlights delayed less than 15 min(axis shows internal standard)
65%
70%
75%
80%
85%
90%
95%
100%
JAN FEB MAR APR MAY JUN JUL AUG SEP OCT NOV DEC
1996 1997 1998 1999

1999-11-16
ANA/11AUG99
DU/UZ/STU
DU/GR/UP
Share of Fullfare TrafficTotal SystemMoving 12 months values
28%
29%
30%
31%
32%
33%
34%
DEC94MAR JUN SEP DEC95MAR JUN SEP DEC96MAR JUN SEP DEC97MAR JUN SEP DEC98MAR JUN

1999-11-16
ANA/11AUG99
DU/UZ/STU
DU/GR/UP
Revenues and costs data

1999-11-16
ANA/11AUG99
DU/UZ/STU
DU/GR/UP
Number of PersonnelSAS excl SAS Trading
During JAN-JUN, average number of
employees increased by 2 100 (9,9%)
Main increases:
- cabin attendants (JarOps and new
service concept)
- pilots (new aircraft type Boeing 737
and new Stockholm commuter hub)
- sales personnel (increased own sales)
- increased data development activities
During JAN-JUN, average number of
employees increased by 2 100 (9,9%)
Main increases:
- cabin attendants (JarOps and new
service concept)
- pilots (new aircraft type Boeing 737
and new Stockholm commuter hub)
- sales personnel (increased own sales)
- increased data development activities
1999-11-16
ANA/11AUG99
DU/UZ/STU
DU/GR/UP
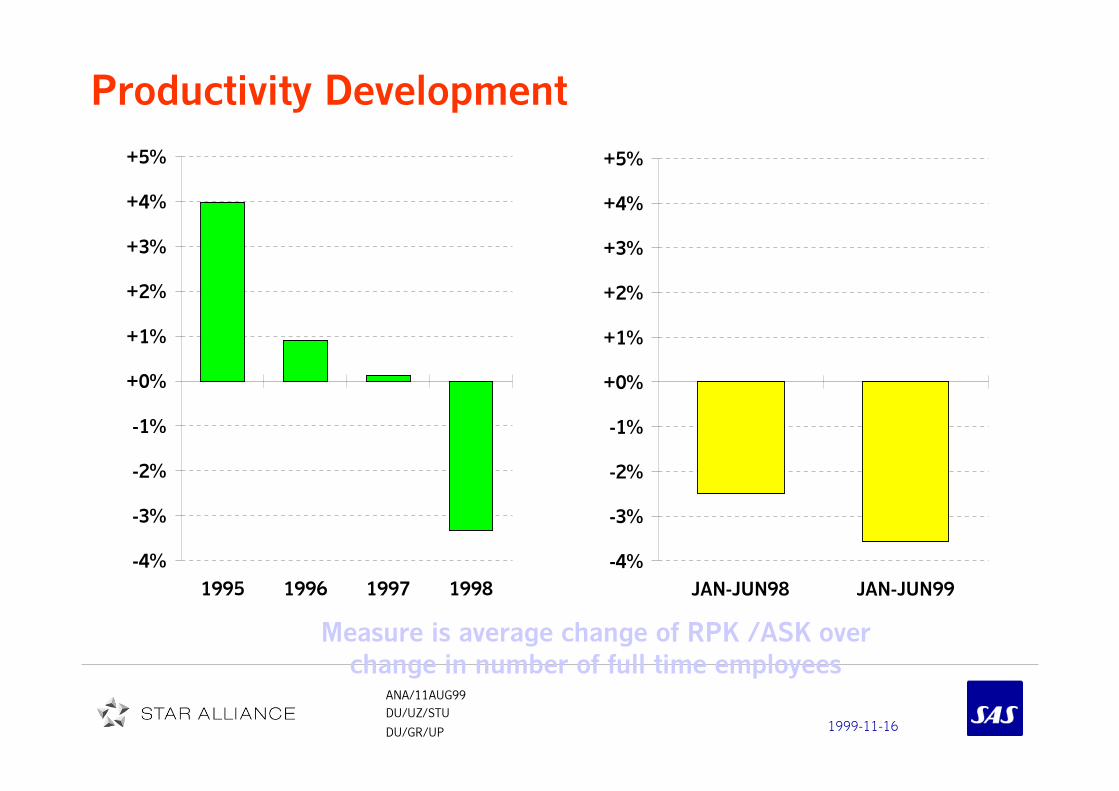
Productivity Development
Measure is average change of RPK /ASK over
change in number of full time employees
-4%
-3%
-2%
-1%
+0%
+1%
+2%
+3%
+4%
+5%
1995 1996 1997 1998
-4%
-3%
-2%
-1%
+0%
+1%
+2%
+3%
+4%
+5%
JAN-JUN98 JAN-JUN99
1999-11-16
ANA/11AUG99
DU/UZ/STU
DU/GR/UP
Balance sheet & Financial strengthBalance sheet & Financial strengthBalance sheet & Financial strengthBalance sheet & Financial strength
1999-11-16
ANA/11AUG99
DU/UZ/STU
DU/GR/UP
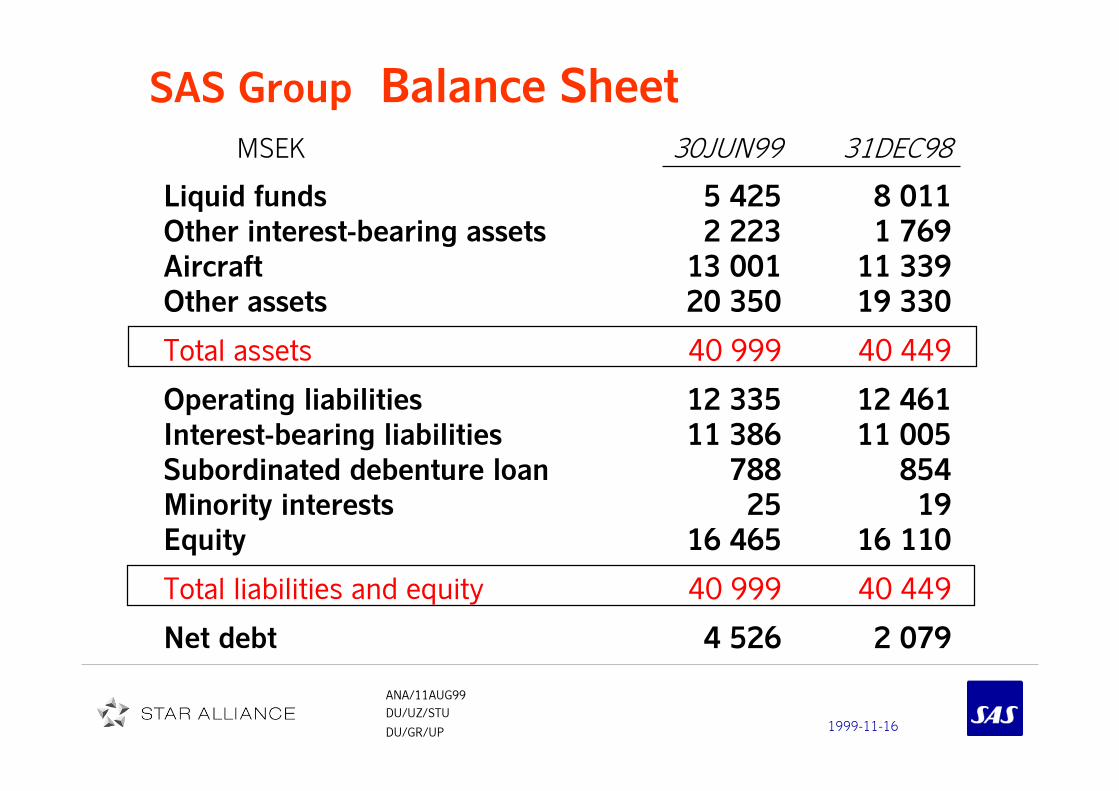
SAS Group Balance Sheet
MSEK 30JUN99 31DEC98
Liquid funds 5 425 8 011
Other interest-bearing assets 2 223 1 769
Aircraft 13 001 11 339
Other assets 20 350 19 330
Total assets 40 999 40 449
Operating liabilities 12 335 12 461
Interest-bearing liabilities 11 386 11 005
Subordinated debenture loan 788 854
Minority interests 25 19
Equity 16 465 16 110
Total liabilities and equity 40 999 40 449
Net debt 4 526 2 079
1999-11-16
ANA/11AUG99
DU/UZ/STU
DU/GR/UP
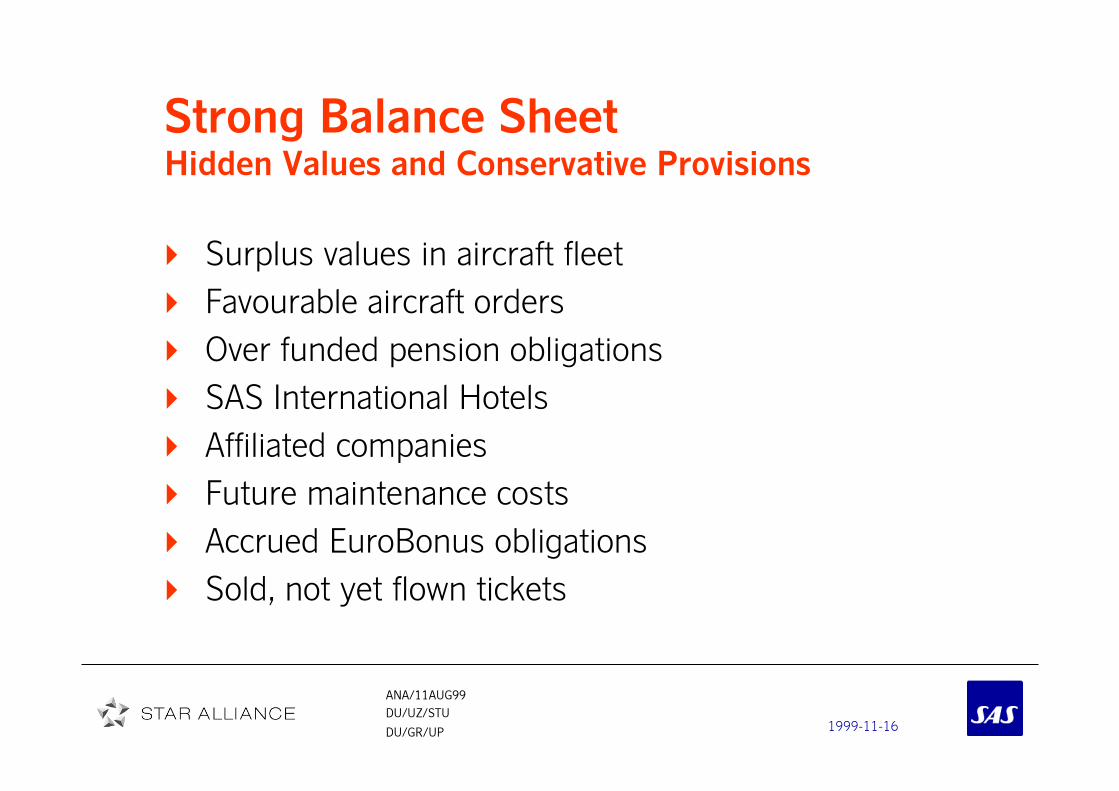
Strong Balance SheetHidden Values and Conservative Provisions
Surplus values in aircraft fleet
Favourable aircraft orders
Over funded pension obligations
SAS International Hotels
Affiliated companies
Future maintenance costs
Accrued EuroBonus obligations
Sold, not yet flown tickets

1999-11-16
ANA/11AUG99
DU/UZ/STU
DU/GR/UP
Fleet changes during first half 1999
B 747-200 Cargo Freighter on operating
redelivered
One DC9-41 on operating lease redelivered
One F28-4000 sold
Three F28-4000 agreed for sale in Q3
4 Saab 340 sold on forward sales
Air Botnia to lease 4 F28-4000 from SAS
– 2 more during Q4 1999
B 747-200 Cargo Freighter on operating
redelivered
One DC9-41 on operating lease redelivered
One F28-4000 sold
Three F28-4000 agreed for sale in Q3
4 Saab 340 sold on forward sales
Air Botnia to lease 4 F28-4000 from SAS
– 2 more during Q4 1999

1999-11-16
ANA/11AUG99
DU/UZ/STU
DU/GR/UP
Still significant overvalues in fleet
SEK 5200 Million (June99)
Change of depreciation principle
effective Jan 1 1999
Incremental increase in overvalues in
spite of changed depreciation principle
due to strong USD

1999-11-16
ANA/11AUG99
DU/UZ/STU
DU/GR/UP
Gross investments
Aircraft MUSD 1999 2000 2001 2002-
Firm orders: 640 710 75 75
Other investments in SAS normally
800-900 MSEK annually
Aircraft MUSD 1999 2000 2001 2002-
Firm orders: 640 710 75 75
Other investments in SAS normally
800-900 MSEK annually

1999-11-16
ANA/11AUG99
DU/UZ/STU
DU/GR/UP
DefinitionsDefinitionsDefinitionsDefinitions

1999-11-16
ANA/11AUG99
DU/UZ/STU
DU/GR/UP
Unit Cost Definition
The unit cost change is calculated as follows:
� Costs:
Operating expenses excluding depreciation and lease
costs for aircraft and reduced with other external revenue
Last year figure is for comparison adjusted with currency
effect
� Volume growth rate:
Average growth rate of ASK and RPK
� Net unit cost change:
Growth rate of comparable costs in relation to volume
growth rate
1999-11-16
ANA/11AUG99
DU/UZ/STU
DU/GR/UP
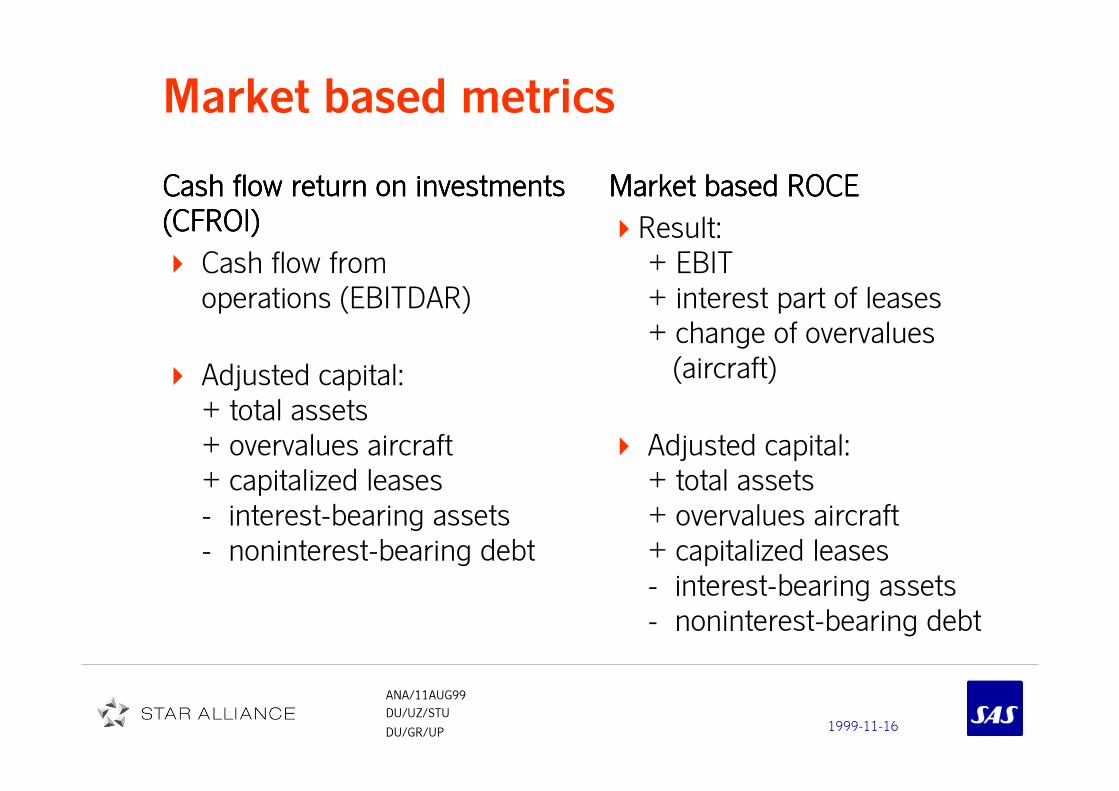
Market based metrics
Cash flow return on investmentsCash flow return on investmentsCash flow return on investmentsCash flow return on investments
(CFROI)(CFROI)(CFROI)(CFROI)
� Cash flow from
operations (EBITDAR)
� Adjusted capital:
+ total assets
+ overvalues aircraft
+ capitalized leases
- interest-bearing assets
- noninterest-bearing debt
Market based ROCEMarket based ROCEMarket based ROCEMarket based ROCE
�Result:
+ EBIT
+ interest part of leases
+ change of overvalues
(aircraft)
� Adjusted capital:
+ total assets
+ overvalues aircraft
+ capitalized leases
- interest-bearing assets
- noninterest-bearing debt
Market based ROCEMarket based ROCEMarket based ROCEMarket based ROCE
�Result:
+ EBIT
+ interest part of leases
+ change of overvalues
(aircraft)
� Adjusted capital:
+ total assets
+ overvalues aircraft
+ capitalized leases
- interest-bearing assets
- noninterest-bearing debt
1999-11-16
ANA/11AUG99
DU/UZ/STU
DU/GR/UP
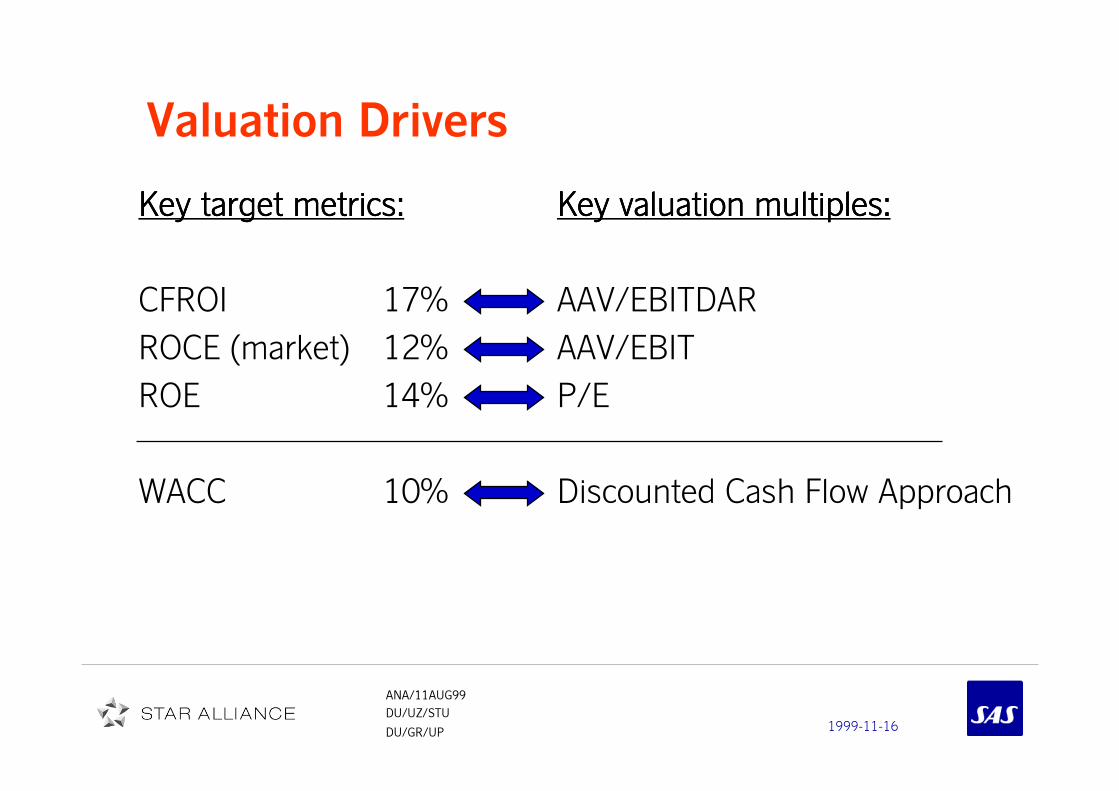
Valuation Drivers
Key target metrics:Key target metrics:Key target metrics:Key target metrics: Key valuation multiples:Key valuation multiples:Key valuation multiples:Key valuation multiples:
CFROI 17% AAV/EBITDAR
ROCE (market) 12% AAV/EBIT
ROE 14% P/E
WACC 10% Discounted Cash Flow Approach

1999-11-16
ANA/11AUG99
DU/UZ/STU
DU/GR/UP
SAS IRSAS IRSAS IRSAS IR

1999-11-16
ANA/11AUG99
DU/UZ/STU
DU/GR/UP
Strengthened relationship with the
equity capital markets
Developed program for Investor Relations
A large number of analyst and investor meetings
arranged in 1998
8-9 international analyst follow the SAS shares, totaling
20
SAS perceived as more share holder friendly
New and developed value creation model incl.
Introduction of marked based key metrics
– CFROI (cash flow return on invested capital)
– Market based ROCE

1999-11-16
ANA/11AUG99
DU/UZ/STU
DU/GR/UP
SAS Investor
Relations
on the Internet
http://www.sas.se/investor

1999-11-16
ANA/11AUG99
DU/UZ/STU
DU/GR/UP
SAS IR
Contacts
Johan Törngren + 46 8 797 1707
Sture Stølen + 46 8 797 1451
Bengt Björklund +46 8 797 2935
fax no: + 46 8 85 58 76
e-mail: [email protected]
Internet: http://www.sas.se/investor