continental shelf research - whoi.edu · flood-directed stress asymmetry due to estuarine...
TRANSCRIPT

Continental Shelf Research ] (]]]]) ]]]–]]]
Contents lists available at SciVerse ScienceDirect
Continental Shelf Research
0278-43
doi:10.1
n Corr
E-m
PleasCont
journal homepage: www.elsevier.com/locate/csr
Research papers
Effects of estuarine and fluvial processes on sediment transportover deltaic tidal flats
David K. Ralston n, W. Rockwell Geyer, Peter A. Traykovski, Nicholas J. Nidzieko
Woods Hole Oceanographic Institution, Applied Ocean Physics and Engineering, MS #11, Woods Hole, MA 02543, United States
a r t i c l e i n f o
Article history:
Received 27 May 2011
Received in revised form
3 February 2012
Accepted 8 February 2012
Keywords:
Tidal flats
Sediment transport
Distributary channels
Stratification
Salinity fronts
Tidal asymmetry
43/$ - see front matter & 2012 Elsevier Ltd. A
016/j.csr.2012.02.004
esponding author. Tel.: þ1 508 289 2587; fax
ail address: [email protected] (D.K. Ralston)
e cite this article as: Ralston, D.K., einental Shelf Research (2012), doi:1
a b s t r a c t
Tidal flats at a river mouth feature estuarine and fluvial processes that distinguish them from tidal flats
without river discharge. We combine field observations and a numerical model to investigate hydrodynamics
and sediment transport on deltaic tidal flats at the mouth of the Skagit River, in Puget Sound, WA, during the
spring freshet. River discharge over tidal flats supplies a mean volume flux, freshwater buoyancy, and
suspended sediment. Despite the shallow water depths, strong horizontal density fronts and stratification
develop, resulting in a baroclinic pressure gradient and tidal variability in stratification that favor flood-
directed bottom stresses. In addition to these estuarine processes, the river discharge during periods of low
tide drains through a network of distributary channels on the exposed tidal flats, with strongly ebb-directed
stresses. The net sediment transport depends on the balance between estuarine and fluvial processes, and is
modulated on a spring-neap time scale by the tides of Puget Sound. We find that the baroclinic pressure
gradient and periodic stratification enhance trapping of sediment delivered by the river on the tidal flats,
particularly during neap tides, and that sediment trapping also depends on settling and scour lags,
particularly for finer particles. The primary means of moving sediment off of the tidal flats are the high
velocities and stresses in the distributary channels during late stages of ebbs and around low tides, with
sediment export predominantly occurring during spring low tides that expose a greater portion of the flats.
The 3-d finite volume numerical model was evaluated against observations and had good skill overall,
particularly for velocity and salinity. The model performed poorly at simulating the shallow flows around low
tides as the flats drained and river discharge was confined to distributary channels, due in part to limitations
in grid resolution, seabed sediment and bathymetric data, and the wetting-and-drying scheme. Consequently,
the model predicted greater sediment retention on the flats than was observed.
& 2012 Elsevier Ltd. All rights reserved.
1. Introduction
Sediment transport over intertidal flats depends on a rangeof forcing processes, including a tidally varying water surfaceelevation, wind stress, and waves. On tidal flats near a rivermouth, additional factors include the volume flux of river dis-charge and buoyancy effects associated with the fresh water.While observations and theory have evaluated the hydrodynamicand sediment-transport processes over intertidal flats dominatedby tidal, wind, and wave forcing, less is known about how riverinput alters these unsteady, shallow flows (Le Hir et al., 2000).
Tidal forcing drives the periodic inundation and exposure that ischaracteristic of tidal flats. Tidal bottom stresses over flats with auniform slope and width can be estimated to first order by assumingcontinuity and a rigid lid, with the result that stresses on the lowertidal flats are spatially uniform and decrease with distance above themid-tide elevation (Friedrichs and Aubrey, 1996). The spatial gradient
ll rights reserved.
: þ1 508 457 2194.
.
t al., Effects of estuarine an0.1016/j.csr.2012.02.004
in velocity, in combination with settling and scour lags that tend tomove sediment toward regions of lower stress (Postma, 1961),results in generally onshore sediment transport due to tidal forcingalone. To reach equilibrium, the upper flats accrete to a convexprofile, decreasing the bottom slope and increasing tidal veloci-ties (Friedrichs and Aubrey, 1996; Pritchard and Hogg, 2003). Thisidealization of tidal forcing does not account for flood-ebb asymme-tries in velocity due to the incident tide, barotropic nonlinearities inshallow water, or bathymetric complexity (Speer and Aubrey, 1985;Friedrichs and Aubrey, 1988).
The addition of river discharge to the intertidal zone creates ashallow estuary where both baroclinic and barotropic pressuregradients alter the bottom stress and sediment flux. Strong horizontaldensity fronts form at the offshore edge of the tidal flats around lowtide, and tidal straining leads to strong stratification during ebbs(Ralston and Stacey, 2005). This stratification reduces bed stressescompared with unstratified flow, leading to flood dominance. Simi-larly, the baroclinic pressure gradient enhances flood-directed nearbed velocities and stresses. The baroclinic and stratification effects ontrapping sediment are well documented in deeper estuaries (Meade,1969; Geyer, 1993), and field and numerical studies suggest that the
d fluvial processes on sediment transport over deltaic tidal flats.

D.K. Ralston et al. / Continental Shelf Research ] (]]]]) ]]]–]]]2
flood-directed stress asymmetry due to estuarine processes canenhance trapping on tidal flats (Ralston and Stacey, 2007; Chenet al., 2010).
An important distinction from deeper estuaries is that whendeltaic tidal flats are subaerial around low tide, the river continuesto flow across the intertidal zone in shallow channels. Observationsand modeling have suggested that offshore sediment flux can occur inthese distributary channels, particularly during periods of high riverdischarge (Ralston and Stacey, 2007; Chen et al., 2010). Whilesediment export has been noted in tidal drainage channels withoutriver input (Dyer et al., 2000; Mariotti and Fagherazzi, 2011), drainagechannels are ephemeral while fluvial channels convey river dischargefor the duration of the period that the flats are exposed. The river alsoprovides a source of sediment to the intertidal zone, with sedimentload in a river increasing nonlinearly with discharge (Nash, 1994).
The goal of this study is to assess how estuarine and fluvialprocesses affect flow and sediment transport on deltaic tidal flats. Thestudy examines tidal flats at the mouth of the Skagit River in PugetSound, Washington, USA, during the spring freshet, when fluvial andtidal processes are dominant and wind forcing is light. The studyexamines how the stratification, baroclinic pressure gradient, andbarotropic flux in distributary channels alter sediment fluxes in theintertidal zone. The analysis combines field observations and numer-ical modeling, beginning with an assessment of the ability of themodel to reproduce the observed conditions.
2. Methods
The study area is at the mouth of the Skagit River, the largestriver flowing into Puget Sound, with a mean annual discharge of470 m3 s�1 (USGS #1220050 at Mount Vernon, WA). Seasonally, themaximum discharge occurs in the late spring and early summer dueto snowmelt (May–June) and in the fall and winter due to storms
Fig. 1. Map of Skagit Bay and the mouth of the Skagit River showing instrument locat
transects are shown, one following a distributary channel (solid red line) and one on ad
mean sea level. Limitations in bathymetry data resolution resulted in smoothing of distr
references to color in this figure legend, the reader is referred to the web version of th
Please cite this article as: Ralston, D.K., et al., Effects of estuarine anContinental Shelf Research (2012), doi:10.1016/j.csr.2012.02.004
(November–January). The Skagit splits into two major distributariesnear its mouth, the North Fork and the South Fork. The river entersSkagit Bay, where a broad shallow delta forms tidal flats with across-shore width ranging from about 3 km off the North Fork to about6 km off the South Fork. The tidal flats are composed predominantlyof sand, with increased concentrations of mud near distributarychannels and at the seaward edge (Webster et al., in this issue). Thetidal range varies between 2.5 and 5 m, with mixed semi-diurnal anddiurnal forcing and significant diurnal inequalities.
2.1. Observations
During June 2009, we conducted a field campaign with fixedand shipboard observations to measure flow and sediment trans-port on the Skagit tidal flats (Fig. 1). Instrument frames for highresolution sampling within about 1 m of the bed were deployedat five locations in the intertidal zone. Near-bed instrumentsincluded pulse-coherent acoustic Doppler profilers (pcADPs),acoustic backscatter sensors (ABSs), acoustic Doppler veloci-meters (ADVs), conductivity-temperature (CT) sensors, and opti-cal backscatter sensors (OBSs), as well as upward-looking acousticDoppler current profilers (ADCPs) and pressure sensors. Surfacebuoys at each station had CTs and OBSs for near-surface waterproperties, and two of the buoys had meteorological instrumentpackages for wind, air temperature, and barometric pressure.
The instruments were deployed offshore of the South Fork inan area of sandy tidal flats with a braided network of distributarychannels. Typically, the distributary channels were 0.2–1.0 mdeeper than the surrounding tidal flats and were 50–200 m inwidth (Fig. 2). The frames were deployed in an array designed tomeasure gradients both across-shore (i.e., from the river mouth toWhidbey Channel, the passage east of Whidbey Island) andbetween the distributary channels and adjacent flats. Instrumentswere deployed at 3 locations along a distributary channel of the
ions (squares, labeled in inset) during field deployment. Positions of across-shore
jacent flats not in a channel (dashed red line). Bathymetric contours are relative to
ibutary channel features on the tidal flat (shown in Fig. 2). (For interpretation of the
is article).
d fluvial processes on sediment transport over deltaic tidal flats.

Fig. 2. Model grid and detail of distributary channels. (left) Extent of model grid (location of right panel details on southern tidal flats shown in box). (upper right) Detail
on southern tidal flats region showing grid resolution. (lower right) Near infrared aerial image showing distributary channel network at a low tidal stage (image courtesy
K. Hooper, Arete Associates). Inset in lower left shows model grid location (outlined in red) relative to the surrounding Puget Sound and Strait of Juan de Fuca.
D.K. Ralston et al. / Continental Shelf Research ] (]]]]) ]]]–]]] 3
South Fork, approximately 1 km, 2 km, and 3 km from theseaward edge of the flats (stations 1c, 2c, and 3c). Additionalframes were located parallel to 2c and 3c, but out of the channelon the adjacent tidal flats (stations 2f and 3f).
Shipboard surveys were conducted at instrument deployment(June 1–5) and recovery (June 22–26). Tidal cycle surveys wereoriented both across the tidal flats, from Whidbey Channel tothe South Fork, and along-isobaths near the instrument frames.Measurements included CTD profiles of salinity, temperature, andoptical backscatter, velocity profiles from an ADCP, and bathy-metric measurements from an echo-sounder. Near-bottom andnear-surface water bottle samples were obtained to calibrate theoptical and acoustic backscatter sensors, including samples col-lected at the instrument frames. Water samples were filtered,dried, and weighed to determine suspended-sediment concentra-tions (SSC), which were correlated with shipboard and mooredacoustic and optical backscatter.
2.2. Numerical model
For the hydrodynamic model, we applied the Finite VolumeCoastal Ocean Model (FVCOM), (Chen et al., 2003). The grid was
Please cite this article as: Ralston, D.K., et al., Effects of estuarine anContinental Shelf Research (2012), doi:10.1016/j.csr.2012.02.004
unstructured, with high resolution in Skagit Bay (�15–20 mminimum spacing) and increasing in cell size toward the openboundaries (�500 m) (Fig. 2). Significant effort went into acquir-ing and incorporating high-quality bathymetry data. The initialgrid was based on data from a Puget Sound digital elevationmodel (Finlayson, 2005) and LiDAR collected by the Skagit RiverSystem Cooperative (Yang and Khangaonkar, 2009). To refine thebathymetry in the study region, we conducted small boat surveysand acquired bathymetry data from collaborators, includingsmall-vessel surveys near the North Fork (from B. Raubenheimerand S. Elgar) and LiDAR surveys of Skagit Bay during a low tide(from J. Brozena). However, none of the survey methods ade-quately resolved the distributary channels from the river mouthto the seaward edge of the flats. To put these features in the grid,we used near-infrared aerial images of Skagit Bay at low tide(from K. Hooper, Fig. 2) to determine channel locations, andassigned local channel depths (0.4–1.0 m) consistent with obser-vations during the small-boat surveys.
For the Skagit simulations, we used the k–e turbulence closurescheme and low background mixing (10�6 m2s�1). The modelwas run with 30 vertical sigma levels. Bottom roughness was setto a uniform z0 of 1.5 mm on the tidal flats based on calibration to
d fluvial processes on sediment transport over deltaic tidal flats.

D.K. Ralston et al. / Continental Shelf Research ] (]]]]) ]]]–]]]4
observed salinities and near-bed stresses, but this value is notwell constrained as a z0 of 0.5 mm produced higher skills at somestations. For comparison, z0¼1.5 mm corresponds with a dragcoefficient (Cd) of 0.0038, for a reference velocity 1 m abovethe bed.
Open boundaries were located west of Deception Pass, south ofSaratoga Passage, and at the northern end of Swinomish Channel(Fig. 2). Water surface elevations at the open boundaries com-bined tidal harmonics with the observed subtidal water level atthe tidal reference stations of Seattle (#9447130) and Port Town-send, WA (#9444900). In addition, a pressure gradient betweenthe southern and western boundary was incorporated based on alarger scale model of Puget Sound and the Salish Sea (Sutherlandet al., 2011). Simulations from the regional model were notavailable for the period of study, so the pressure gradient wasbased on results from simulations of 2005 and 2006, yielding anaverage difference in water surface elevation of 4.3 cm betweenthe southern and western boundaries. Skagit River discharge wasfrom the station at Mount Vernon (#12200500) (Fig. 3). Salinitiesat the offshore boundaries were based on climatology constructedfrom surveys from the Washington Department of Ecology MarineWater Monitoring program (http://www.ecy.wa.gov/apps/eap/marinewq/mwdataset.asp).
Comparisons between the model and observations suggestedthat local winds affected the mean currents and stratification.When the model was forced with spatially uniform winds fromthe meteorological buoys, model skills improved for salinity andvelocity. However, differences in recorded winds at stationsseparated by just a few kilometers indicated that the wind fieldwas highly heterogeneous due to interaction with the surround-ing topography (Raubenheimer et al., in this issue). To incorporatespatial and temporal variability in the wind field, we developed a
Fig. 3. Forcing during observations. (top) Skagit River discharge in 2009 (black line) an
data from the USGS station #1220050 at Mount Vernon); vertical lines denote the pe
(NOAA station #9447130, relative to MSL); (bottom) wind speed and direction observ
Please cite this article as: Ralston, D.K., et al., Effects of estuarine anContinental Shelf Research (2012), doi:10.1016/j.csr.2012.02.004
regional atmospheric model using the Weather Research andForecasting model (WRF), and used results from the WRF simula-tions to force FVCOM.
A sediment transport module in FVCOM based on the Com-munity Sediment Transport Model System (Warner et al., 2008)was run with 3 sediment classes, with settling velocities (ws)of 10 mm s�1, 1 mm s�1, and 0.1 mm s�1, representative of finesand, silt, and fine silt (Table 1). Sediment erosion parameterswere based on similar size classes used in other recent estuarineand tidal-flat modeling studies (Warner et al., 2008; Chen et al.,2010). The sediment was treated as non-cohesive, with no bedconsolidation. The sediment bed was initialized uniformly with asediment class distribution based on a limited number of bedsamples from the tidal flats: 40% 10 mm s�1, 45% 1 mm s�1, and15% 0.1 mm s�1. A more extensive survey of the bed sediments inSkagit Bay found that the middle and upper flats were dominatedby sand (�97%) and that mud was a substantial portion of thebed (�20–60%) only near distributary channels and on the lowerflats (Webster et al., in this issue).
For suspended sediment input from the river, a rating curvewas based on data from the USGS station at the Mount Vernon(E. Grossman, pers. comm.). Suspended-sediment concentrationin the river scaled with discharge according to
C ¼ C0 Qr=Qr0
� �1:4ð1Þ
where C is the suspended-sediment concentration (mg L�1), C0 isa reference concentration (165 mg L�1), Qr is the discharge(m3 s�1), and Qr0 is the mean annual discharge (470 m3 s�1). Thisformulation was largely consistent with more recently releasedobservations, where the best fit to measurements over a full yearfound that C�Qr
1.43(Curran et al., in this issue). Eq. (1) was based on
d the 5th and 95th percentile of discharge over the period 1941–2010 (gray lines,
riod of observations; (middle) tides at Seattle during the June 2009 observations
ed from meteorological buoy on tidal flats (at station 1c).
d fluvial processes on sediment transport over deltaic tidal flats.

Table 1Sediment parameters. Input parameters for the sediment model.
Fine silt Silt Fine sand
Settling velocity (ws, mm s�1) 0.1 1.0 10.
Mean diameter (mm) 0.014 0.040 0.140
Erosion rate (kg m�2 s�1) 1.2�10�5 1.2�10�4 1.2�10�3
Critical stress for erosion (Pa) 0.05 0.08 0.15
Porosity 0.65 0.60 0.55
Fractional composition (river input and initial bed) 0.15 0.45 0.40
Table 2Correlations and skill scores. Comparisons between observations and model results for the full time series; station locations are shown in Fig. 1. For bottom stress, skills in
parentheses reflect modified model results using a local Cd at each station based on comparison with observations.
Station 1c 2c 2f 3c 3f
R2 SS R2 SS R2 SS R2 SS R2 SS
Water level 0.998 0.997 0.994 0.994 0.997 0.997 0.997 0.997 0.996 0.995
Velocity, east 0.95 0.95 0.95 0.95 0.95 0.94 0.88 0.87 0.90 0.90
Velocity, north 0.39 0.33 0.47 0.45 0.62 0.56 0.46 0.39 0.54 0.52
Salinity, bottom 0.80 0.61 0.81 0.66 0.77 0.72 0.71 0.56 0.61 0.42
Salinity, surface 0.40 0.12 0.40 �0.01 0.46 0.16 0.49 0.24 0.50 0.36
Stress, bottom 0.63 �4.4 (0.55) 0.39 �0.24 (0.35) 0.41 0.14 (0.29) 0.58 0.45 (0.55) 0.31 �0.13 (0.25)
SSC, bottom 0.29 �2.3 0.12 0.04 0.14 �5.8 0.40 0.39 0.19 �3.2
D.K. Ralston et al. / Continental Shelf Research ] (]]]]) ]]]–]]] 5
data from a winter storm event, but the subsequent fit to the fullyear of data produced a lower effective C0 of about 110 mg L�1.
2.3. Model skill
To assess model performance, we compared time series fromthe simulations with observations of water level, salinity, velocity,stress, and suspended-sediment concentration (conditions aredescribed in detail in Section 3). We focused on two performancemetrics: correlation coefficient (R) and skill score (SS). Thecorrelation coefficient reflects the covariance between the modeland the observations
R¼ s�1m s�1
o
1
N
XN
i ¼ 1
ðXm,i�Xm ÞðXo,i�Xo Þ ð2Þ
where Xm and Xo are the values from the model and observations,an overbar represents a time average, N is the number ofobservations, and sm and so are the standard deviations of themodel and observations. The skill score is based on the meansquare error between the model and the observations, normalizedby the standard deviation of the observations:
SS¼ 1�s�2o
1
N
XN
i ¼ 1
ðXm�XoÞ2
ð3Þ
(Murphy, 1988). The maximum skill score is 1 when the modeland observations agree exactly and a skill score of 0 indicates thatthe mean square error is the same magnitude as the variance ofthe observations. The skill score can be related to the correlationcoefficient and two additional terms:
SS¼ R2� R�
sm
so
� �2
�Xm�Xo
so
!2
ð4Þ
(Murphy, 1988). The second term on the right represents thedifference in variance between the model and the observations,and it vanishes when the slope of the regression line is equal to 1.The last term is the mismatch between the means of the model
Please cite this article as: Ralston, D.K., et al., Effects of estuarine anContinental Shelf Research (2012), doi:10.1016/j.csr.2012.02.004
and observations, and it corresponds with the intercept of thelinear regression. The skill score has a maximum equal to R2, butdecreases due to mismatches in the amplitude of the variability orthe temporal means.
Correlation coefficients and skill scores over the deployment aregiven in Table 2. For water surface elevations, R2 and SS wereextremely high (40.99). Velocities on the flats were also wellcaptured by the model, with high correlations (0.88–0.95) and skillscores (0.86–0.95) for the depth-averaged eastward velocity (uE),which corresponds with the across-shore direction. The northwardvelocity component (vN) was reproduced with moderate skill (R2 of0.39 to 0.62 and SS of 0.33 to 0.56). The northward or along-shorevelocities were weaker than the across-shore velocities, and weremore sensitive to poorly constrained forcing factors like the windfield and the large-scale pressure gradient.
Salinity variations at tidal and spring-neap time scales corre-sponded well with the observations. In particular, correlations andskill scores for near-bottom salinity were high (R2 of 0.61 to 0.81 andSS of 0.42 to 0.72). Bottom salinity skills decreased with distanceonshore, as small variations in the position of the tidal salinity frontled to large differences in salinity on the upper flats. Correlationsand skill scores were lower for surface salinity than for bottomsalinity. While the across-shore position of the bottom salinity frontdepended largely on uE (which was well represented by the model),the surface salinity fronts had complex lateral structure and weremore sensitive to winds and along-shore currents (Mullarney andHenderson, 2011). While surface salinity fronts in the model weresimilar in magnitude to the observations, differences in the phasingat the observation points produced large skill errors.
Accurately reproducing bottom stress is an important componentof modeling suspended sediment because of the dependence ofresuspension on excess stress. In the Skagit model, the bottomstresses had reasonable correlations with the observations (R2 of0.31 to 0.63), but skill scores were lower. Observed stresses werecalculated from the ADV measurements in 10-minute bursts usingthe inertial dissipation method. The model used a spatially uniform z0
of 1.5 mm on the flats, which produced bottom stresses that agreedwell with some of the observations (SS¼0.45 at station 3c) but
d fluvial processes on sediment transport over deltaic tidal flats.
D.K. Ralston et al. / Continental Shelf Research ] (]]]]) ]]]–]]]6
produced higher stresses than observed at other stations (SS¼�4.4 at1c). The discrepancy suggests spatial, and potentially temporal,variability in z0 due to bedforms and bed composition (Whitehouseet al., 2000). If model stresses were adjusted to a local Cd moreconsistent with the observations (thereby changing the slope of theregression line), skill scores improved significantly (SS¼0.55 at 1c).Such a local optimization of Cd to match observed stresses wouldimply changes in Cd by factors between 0.5 and 1.3. Adding spatialand temporal variability to z0 might produce higher skills for bottomstress (and suspended sediment). However, with observations at only5 locations and no identifiable trends in the model-data mismatch,we could not define a map of optimal z0. In addition to Cd, the modelunder-predicted the velocities of channelized flow around low tide(discussed in detail later), which contributed significantly to the bed-stress error.
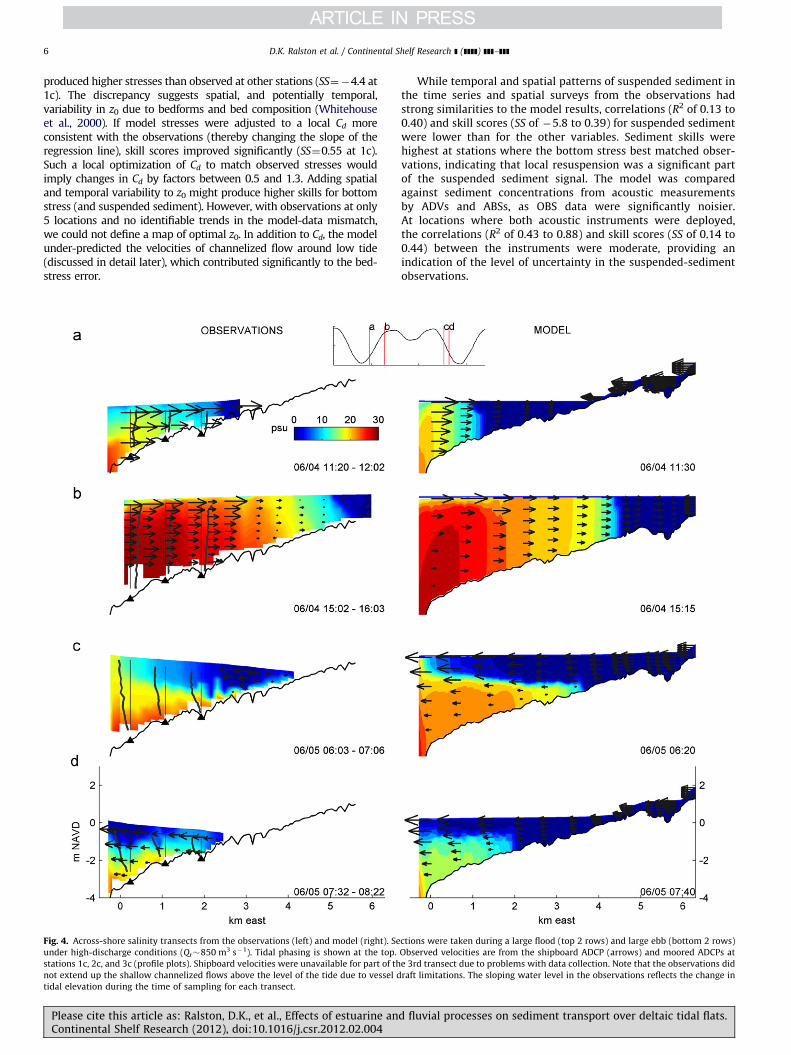
Fig. 4. Across-shore salinity transects from the observations (left) and model (right). Se
under high-discharge conditions (Qr�850 m3 s�1). Tidal phasing is shown at the top.
stations 1c, 2c, and 3c (profile plots). Shipboard velocities were unavailable for part of th
not extend up the shallow channelized flows above the level of the tide due to vessel d
tidal elevation during the time of sampling for each transect.
Please cite this article as: Ralston, D.K., et al., Effects of estuarine anContinental Shelf Research (2012), doi:10.1016/j.csr.2012.02.004
While temporal and spatial patterns of suspended sediment inthe time series and spatial surveys from the observations hadstrong similarities to the model results, correlations (R2 of 0.13 to0.40) and skill scores (SS of �5.8 to 0.39) for suspended sedimentwere lower than for the other variables. Sediment skills werehighest at stations where the bottom stress best matched obser-vations, indicating that local resuspension was a significant partof the suspended sediment signal. The model was comparedagainst sediment concentrations from acoustic measurementsby ADVs and ABSs, as OBS data were significantly noisier.At locations where both acoustic instruments were deployed,the correlations (R2 of 0.43 to 0.88) and skill scores (SS of 0.14 to0.44) between the instruments were moderate, providing anindication of the level of uncertainty in the suspended-sedimentobservations.
ctions were taken during a large flood (top 2 rows) and large ebb (bottom 2 rows)
Observed velocities are from the shipboard ADCP (arrows) and moored ADCPs at
e 3rd transect due to problems with data collection. Note that the observations did
raft limitations. The sloping water level in the observations reflects the change in
d fluvial processes on sediment transport over deltaic tidal flats.

D.K. Ralston et al. / Continental Shelf Research ] (]]]]) ]]]–]]] 7
In model development, several modifications were made toincrease model skill. Modifications to the grid based on bathy-metry data collected on the flats and in the river led to significantimprovements in skill, particularly in the across-shore position ofthe salinity front and in the distribution of discharge between theNorth and South Forks. The salinity skill also improved with anincrease in the number of vertical layers from 20 to 30, asurprising result given the shallow depths of the tidal flats.Increased vertical resolution helped reduce numerical mixing inWhidbey Channel and Saratoga Passage, where the haloclineintersects steeply sloping bathymetry. With 20 layers, wateradvecting onto the flats during flood tides was too fresh due tothe numerical mixing offshore; increasing to 40 layers did notproduce additional increases in salinity skill.
3. Observations and model results
In this section, we describe conditions on the Skagit tidal flatsduring June 2009, including the tidal and river forcing, salinityand stratification, velocities and bed stress, and suspended-sediment
Fig. 5. Water-level and salinity time series from the observations. (top) Water levels from
and one on the adjacent flats (2f, at an elevation similar to 3c). (lower panels) Bottom and su
Please cite this article as: Ralston, D.K., et al., Effects of estuarine anContinental Shelf Research (2012), doi:10.1016/j.csr.2012.02.004
concentrations. The findings presented incorporate both observationsand model results.
3.1. Tides, river discharge, and winds
The observation period corresponded with the spring freshet, witha maximum discharge of 930 m3 s�1 in early June (Fig. 3). Dischargedecreased through the observations to about 450 m3 s�1 by the endof the month. The observations spanned two spring tides and anintervening neap, with larger spring tides occurring toward the end ofthe month. Winds during the observations were mostly light anddominated by a diurnal sea breeze, with sustained winds exceeding7 m s�1 for only brief periods.
3.2. Salinity
Salinity and stratification were highly variable at tidal andspring-neap time scales. The river delivered fresh water to theupper flats, and the bottom salinity at the seaward edge wascharacteristic of Puget Sound water, �30 psu. Around low tide,the river flowed across exposed tidal flats in distributary channels
three stations (locations shown in Fig. 1), two in a distributary channel (1c and 3c)
rface salinities at those 3 stations. A detail of the salinity time series is shown in Fig. 9.
d fluvial processes on sediment transport over deltaic tidal flats.

D.K. Ralston et al. / Continental Shelf Research ] (]]]]) ]]]–]]]8
to a bottom salinity front at the seaward edge (Fig. 4). During therising tide, the salinity front advected across the tidal flats as anarrow, unstratified region of strong horizontal salinity gradient(�30 psu overo4 km). In both the observations and the model,the near-surface region behind the flooding front was weaklystratified, as low salinity water from the previous ebb returnedonshore. During ebbs, a surface layer of nearly fresh wateraccelerated offshore, straining the front into strong stratification.Stratification persisted through much of the ebb with the tidefalling and high salinity bottom water moving offshore, butmixing in shallow water eliminated the stratification by the endof many ebbs.
The tidal progression of the salinity field (Fig. 4) is typical ofshallow, strongly forced salt-wedge estuaries. Horizontal salinitygradients are generated and advected during flood tides, andstratification is created and then mixed away during ebbs(Ralston et al., 2010). The example shown had moderate tidesand relatively high discharge (June 4–5), and the strength andtiming of the stratification varied with tidal and fluvial forcing(Fig. 5). During neap tides with weaker velocities and greaterwater depths, strong stratification persisted on the flats overmultiple tidal cycles rather than mixing each ebb. In the perigeanspring tides (June 22–26), stratification occurred during the floodand early ebb but was mixed vertically early in the strong ebb.Conditions were saltier and less stratified during the perigeanspring than during spring tides earlier in the month, due both tothe increased tidal amplitude and decreased river discharge.
While the across-shore tidal sections are useful for describingthe dominant tidal variability in salinity fronts and stratification,
Fig. 6. Model results showing maps of surface (top panels) and bottom (bottom panels)
Tidal phasing is shown in the top panel. a: 04 June 2009 14:25, b: 04 June 2009 20:00
Please cite this article as: Ralston, D.K., et al., Effects of estuarine anContinental Shelf Research (2012), doi:10.1016/j.csr.2012.02.004
the bathymetry of Skagit Bay complicates this basic 2-d frame-work (Fig. 6). The across-shore transects (Fig. 4) were between theSouth Fork and the seaward edge of the flats. The North Forkprovides another major source of fresh water. The distancebetween the river mouth and the seaward edge of the flats isless in the north due to the constraint of Whidbey Island, and thechannel network is more focused, about 2–3 km wide comparedwith 5–6 km width in the south. Consequently, model resultssuggest that river velocities are higher in the north, strong riverflow extends to the seaward edge of the flats during ebbs, andhigh-salinity water does not propagate as far landward duringflood tides (Fig. 6).
The tidal flats between the North and South Forks do not havedirect fluvial inflow at the landward edge, and thus have differentsalinity and stratification characteristics. The horizontal salinitygradients in this region were much weaker, and generallyoriented along isobaths rather than across-shore (e.g., Fig. 6b).The across- and along-shore tidal currents were similar inmagnitude in this region, and the stratification was generallyweaker because of less tidal straining. Outflow from the Northand South Forks advected by the tides and wind provided thedominant buoyancy inputs in this central region.
3.3. Velocity and bed stress
Velocities on the tidal flats varied at diurnal and fortnightlytime scales (Fig. 7). During spring tides, depth averaged velocitiesat times exceeded 0.6 m s�1, with higher velocities observed inthe channels and on the lower flats. During neaps, maximum tidal
salinity in Skagit Bay at times similar to the across-shore transects shown in Fig. 4.
, c: 05 June 2009 08:30.
d fluvial processes on sediment transport over deltaic tidal flats.
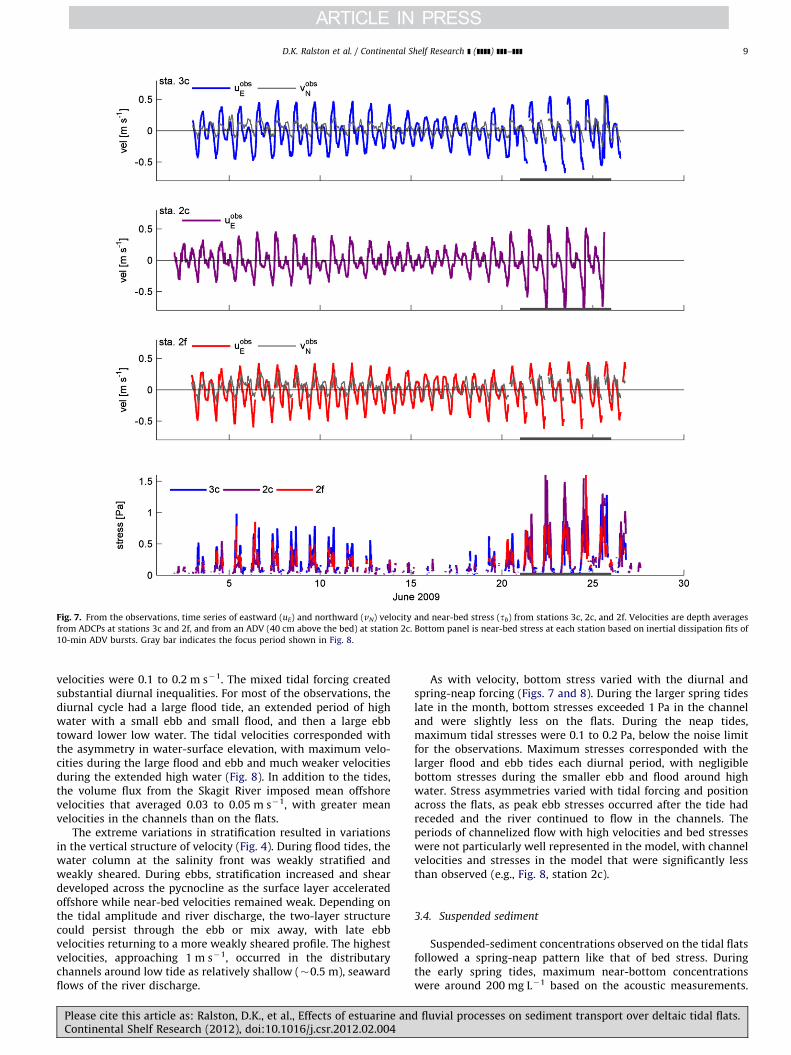
Fig. 7. From the observations, time series of eastward (uE) and northward (vN) velocity and near-bed stress (tb) from stations 3c, 2c, and 2f. Velocities are depth averages
from ADCPs at stations 3c and 2f, and from an ADV (40 cm above the bed) at station 2c. Bottom panel is near-bed stress at each station based on inertial dissipation fits of
10-min ADV bursts. Gray bar indicates the focus period shown in Fig. 8.
D.K. Ralston et al. / Continental Shelf Research ] (]]]]) ]]]–]]] 9
velocities were 0.1 to 0.2 m s�1. The mixed tidal forcing createdsubstantial diurnal inequalities. For most of the observations, thediurnal cycle had a large flood tide, an extended period of highwater with a small ebb and small flood, and then a large ebbtoward lower low water. The tidal velocities corresponded withthe asymmetry in water-surface elevation, with maximum velo-cities during the large flood and ebb and much weaker velocitiesduring the extended high water (Fig. 8). In addition to the tides,the volume flux from the Skagit River imposed mean offshorevelocities that averaged 0.03 to 0.05 m s�1, with greater meanvelocities in the channels than on the flats.
The extreme variations in stratification resulted in variationsin the vertical structure of velocity (Fig. 4). During flood tides, thewater column at the salinity front was weakly stratified andweakly sheared. During ebbs, stratification increased and sheardeveloped across the pycnocline as the surface layer acceleratedoffshore while near-bed velocities remained weak. Depending onthe tidal amplitude and river discharge, the two-layer structurecould persist through the ebb or mix away, with late ebbvelocities returning to a more weakly sheared profile. The highestvelocities, approaching 1 m s�1, occurred in the distributarychannels around low tide as relatively shallow (�0.5 m), seawardflows of the river discharge.
Please cite this article as: Ralston, D.K., et al., Effects of estuarine anContinental Shelf Research (2012), doi:10.1016/j.csr.2012.02.004
As with velocity, bottom stress varied with the diurnal andspring-neap forcing (Figs. 7 and 8). During the larger spring tideslate in the month, bottom stresses exceeded 1 Pa in the channeland were slightly less on the flats. During the neap tides,maximum tidal stresses were 0.1 to 0.2 Pa, below the noise limitfor the observations. Maximum stresses corresponded with thelarger flood and ebb tides each diurnal period, with negligiblebottom stresses during the smaller ebb and flood around highwater. Stress asymmetries varied with tidal forcing and positionacross the flats, as peak ebb stresses occurred after the tide hadreceded and the river continued to flow in the channels. Theperiods of channelized flow with high velocities and bed stresseswere not particularly well represented in the model, with channelvelocities and stresses in the model that were significantly lessthan observed (e.g., Fig. 8, station 2c).
3.4. Suspended sediment
Suspended-sediment concentrations observed on the tidal flatsfollowed a spring-neap pattern like that of bed stress. Duringthe early spring tides, maximum near-bottom concentrationswere around 200 mg L�1 based on the acoustic measurements.
d fluvial processes on sediment transport over deltaic tidal flats.

Fig. 8. Near-bottom velocity (top panels) and stress (bottom panels) time series from the model and observations at stations 3c, 2c, and 2f, focusing on the perigean spring
tides toward the end of the month. Observations are in color and model results are in black/gray.
D.K. Ralston et al. / Continental Shelf Research ] (]]]]) ]]]–]]]10
Sediment concentrations had tidal maximums o50 mg L�1 duringthe neap, when stratification persisted over multiple tidal cyclesand bed stresses were weak. The maximum sediment concentra-tions occurred during the perigean spring tides (Fig. 9). During thelarge flood and ebb with inundation and drying of the tidal flats,maximum near-bottom concentrations were 200 to 500 mg L�1,generally with higher concentrations during the ebb approach-ing lower low water. The intervening weaker ebb and floodaround high water had sediment concentrations that decreasedto o50 mg L�1.
Across-shore sections from the model along a channel duringspring tides detail the suspended sediment, stress, and stratifica-tion distributions through a diurnal tidal cycle (Fig. 10). Duringthe large flood tide, a salinity front propagated up the flats andthe water column was unstratified (Fig. 10a). Bed stresses andsuspended-sediment concentrations were elevated behind thefront at the seaward edge of the flats. In the channel abovethe tide level, the river discharged as a shallow flow with highbed stresses (41 Pa) and suspended-sediment concentrations(4400 mg L�1). Later in the large flood, the tide inundated theflats and drowned the distributary channel network (Fig. 10b).The maximum suspended-sediment concentrations advectedwith the salinity gradient and were located on the mid-flat.
Please cite this article as: Ralston, D.K., et al., Effects of estuarine anContinental Shelf Research (2012), doi:10.1016/j.csr.2012.02.004
During the smaller ebb and flood around high water, sedimentconcentrations remained low. Stratification was strong and velo-cities were weak at the end of the smaller ebb, and stresses andsuspended-sediment concentrations were negligible (Fig. 10c).During the stronger ebb, greater velocities with shallower waterdepths mixed the stratification, increasing bed stresses, and resus-pending sediment. Around mid-tide, different segments of the across-shore profile reflected the balance between stress and stratification(Fig. 10d). Stresses were high and sediment resuspension had begunby mid-tide on the lower flat (0–2 km from the seaward edge)because this region contained unstratified, high-salinity Puget Soundwater at the start of the large ebb. Mid-flat (2–4 km), stratificationremained strong, bottom stresses were weak, and sediment concen-trations were low. The stratification on the mid-flat was beginning tomix due to increasing bottom stress and shear, seen in the thickeningof the pycnocline (relative to Fig. 10c). On the upper flat (4–6 km),water depths had fallen and vertical mixing was nearly complete, andbed stresses and sediment concentrations had increased. Finally,toward the end of the large ebb, stratification had broken down overthe entire flat (Fig. 10e). Bed stresses and sediment concentrationsincreased below the tide level, but even higher stresses and concen-trations were in the exposed channel that continued to carryriver discharge. For sediment transport, the period of high stress
d fluvial processes on sediment transport over deltaic tidal flats.
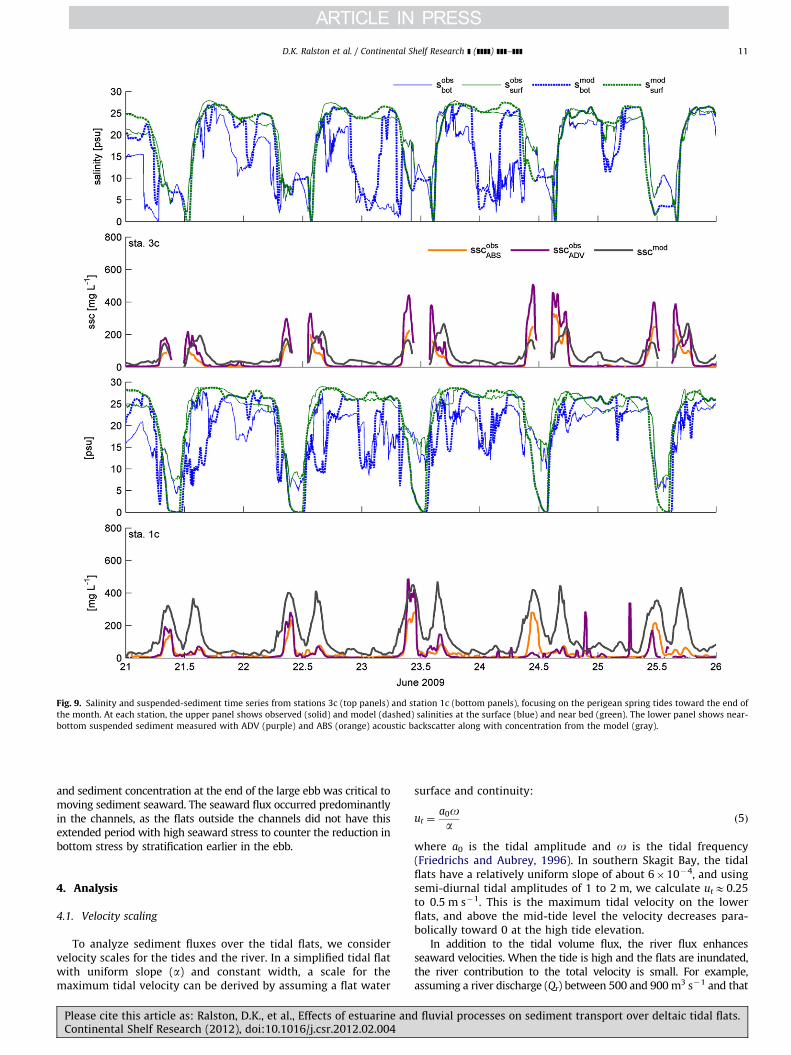
Fig. 9. Salinity and suspended-sediment time series from stations 3c (top panels) and station 1c (bottom panels), focusing on the perigean spring tides toward the end of
the month. At each station, the upper panel shows observed (solid) and model (dashed) salinities at the surface (blue) and near bed (green). The lower panel shows near-
bottom suspended sediment measured with ADV (purple) and ABS (orange) acoustic backscatter along with concentration from the model (gray).
D.K. Ralston et al. / Continental Shelf Research ] (]]]]) ]]]–]]] 11
and sediment concentration at the end of the large ebb was critical tomoving sediment seaward. The seaward flux occurred predominantlyin the channels, as the flats outside the channels did not have thisextended period with high seaward stress to counter the reduction inbottom stress by stratification earlier in the ebb.
4. Analysis
4.1. Velocity scaling
To analyze sediment fluxes over the tidal flats, we considervelocity scales for the tides and the river. In a simplified tidal flatwith uniform slope (a) and constant width, a scale for themaximum tidal velocity can be derived by assuming a flat water
Please cite this article as: Ralston, D.K., et al., Effects of estuarine anContinental Shelf Research (2012), doi:10.1016/j.csr.2012.02.004
surface and continuity:
ut ¼a0oa
ð5Þ
where a0 is the tidal amplitude and o is the tidal frequency(Friedrichs and Aubrey, 1996). In southern Skagit Bay, the tidalflats have a relatively uniform slope of about 6�10�4, and usingsemi-diurnal tidal amplitudes of 1 to 2 m, we calculate utE0.25to 0.5 m s�1. This is the maximum tidal velocity on the lowerflats, and above the mid-tide level the velocity decreases para-bolically toward 0 at the high tide elevation.
In addition to the tidal volume flux, the river flux enhancesseaward velocities. When the tide is high and the flats are inundated,the river contribution to the total velocity is small. For example,assuming a river discharge (Qr) between 500 and 900 m3 s�1 and that
d fluvial processes on sediment transport over deltaic tidal flats.

Fig. 10. Across-shore transects in a distributary channel of stress (left panels) and suspended-sediment concentration (right panels) from the model results. Location of
transect is same is in Fig. 4. Transects are from a diurnal period during spring tides, with snapshots during the large flood (top 2 rows), small ebb (middle row), and large
ebb (bottom 2 rows). Salinity contours are shown, with intervals of 1 psu (thin gray) and 5 psu (thick black). (a) 23 June 2009 14:43, (b) 23 June 2009 16:46, (c) 24 June
2009 00:45, (d) 24 June 2009 08:43, (e) 24 June 2009 10:46.
D.K. Ralston et al. / Continental Shelf Research ] (]]]]) ]]]–]]]12
45% goes to the South Fork, a water depth (h) of 2 m, and an along-shore spread of the region of river influence at high water (bHW) of5 km (e.g., Fig. 6), the fluvial contribution to the depth-averagevelocity is urE0.05 to 0.09 m s�1. However, when the tide levelhas fallen, the river continues to flow in the distributary channelnetwork and velocities are substantially higher. The channelizedvelocities can be scaled according to open channel flow, whichassumes that the water surface slope is equal to the bed slope andis balanced by friction:
Cdu2r ¼ agh ð6Þ
where Cd is a drag coefficient and g is gravitational acceleration. Thefluvial velocity scale can be related to discharge by assuming an
Please cite this article as: Ralston, D.K., et al., Effects of estuarine anContinental Shelf Research (2012), doi:10.1016/j.csr.2012.02.004
effective width of the outflow, which in this case is the cumulativewidth of the distributary channels, so that
ur ¼agQr
CdbLW
� �1=3
: ð7Þ
Estimating the effective channel width when the flats areexposed as bLWE0.6 km and assuming CdE0.004, an elevatedroughness due to channel bedforms and the shallow flow, weestimate urE0.8 to 1.0 m s�1 for the observed range of Qr. Weassumed a equaled the overall slope of the tidal flats (6�10�4),but channels on the lower flats were generally more incised thanon the upper flats so the the channel bed slope may be greater;using a steeper channel slope would increase the fluvial velocity
d fluvial processes on sediment transport over deltaic tidal flats.
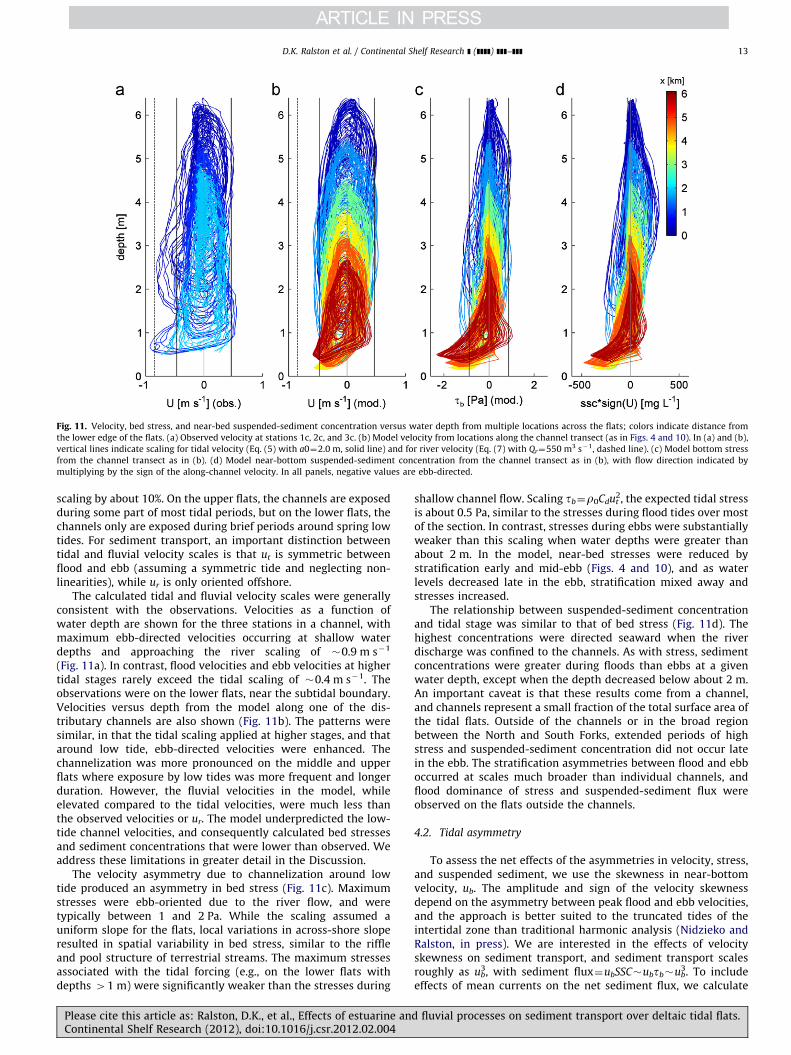
Fig. 11. Velocity, bed stress, and near-bed suspended-sediment concentration versus water depth from multiple locations across the flats; colors indicate distance from
the lower edge of the flats. (a) Observed velocity at stations 1c, 2c, and 3c. (b) Model velocity from locations along the channel transect (as in Figs. 4 and 10). In (a) and (b),
vertical lines indicate scaling for tidal velocity (Eq. (5) with a0¼2.0 m, solid line) and for river velocity (Eq. (7) with Qr¼550 m3 s�1, dashed line). (c) Model bottom stress
from the channel transect as in (b). (d) Model near-bottom suspended-sediment concentration from the channel transect as in (b), with flow direction indicated by
multiplying by the sign of the along-channel velocity. In all panels, negative values are ebb-directed.
D.K. Ralston et al. / Continental Shelf Research ] (]]]]) ]]]–]]] 13
scaling by about 10%. On the upper flats, the channels are exposedduring some part of most tidal periods, but on the lower flats, thechannels only are exposed during brief periods around spring lowtides. For sediment transport, an important distinction betweentidal and fluvial velocity scales is that ut is symmetric betweenflood and ebb (assuming a symmetric tide and neglecting non-linearities), while ur is only oriented offshore.
The calculated tidal and fluvial velocity scales were generallyconsistent with the observations. Velocities as a function ofwater depth are shown for the three stations in a channel, withmaximum ebb-directed velocities occurring at shallow waterdepths and approaching the river scaling of �0.9 m s�1
(Fig. 11a). In contrast, flood velocities and ebb velocities at highertidal stages rarely exceed the tidal scaling of �0.4 m s�1. Theobservations were on the lower flats, near the subtidal boundary.Velocities versus depth from the model along one of the dis-tributary channels are also shown (Fig. 11b). The patterns weresimilar, in that the tidal scaling applied at higher stages, and thataround low tide, ebb-directed velocities were enhanced. Thechannelization was more pronounced on the middle and upperflats where exposure by low tides was more frequent and longerduration. However, the fluvial velocities in the model, whileelevated compared to the tidal velocities, were much less thanthe observed velocities or ur. The model underpredicted the low-tide channel velocities, and consequently calculated bed stressesand sediment concentrations that were lower than observed. Weaddress these limitations in greater detail in the Discussion.
The velocity asymmetry due to channelization around lowtide produced an asymmetry in bed stress (Fig. 11c). Maximumstresses were ebb-oriented due to the river flow, and weretypically between 1 and 2 Pa. While the scaling assumed auniform slope for the flats, local variations in across-shore sloperesulted in spatial variability in bed stress, similar to the riffleand pool structure of terrestrial streams. The maximum stressesassociated with the tidal forcing (e.g., on the lower flats withdepths 41 m) were significantly weaker than the stresses during
Please cite this article as: Ralston, D.K., et al., Effects of estuarine anContinental Shelf Research (2012), doi:10.1016/j.csr.2012.02.004
shallow channel flow. Scaling tb¼r0Cdut2, the expected tidal stress
is about 0.5 Pa, similar to the stresses during flood tides over mostof the section. In contrast, stresses during ebbs were substantiallyweaker than this scaling when water depths were greater thanabout 2 m. In the model, near-bed stresses were reduced bystratification early and mid-ebb (Figs. 4 and 10), and as waterlevels decreased late in the ebb, stratification mixed away andstresses increased.
The relationship between suspended-sediment concentrationand tidal stage was similar to that of bed stress (Fig. 11d). Thehighest concentrations were directed seaward when the riverdischarge was confined to the channels. As with stress, sedimentconcentrations were greater during floods than ebbs at a givenwater depth, except when the depth decreased below about 2 m.An important caveat is that these results come from a channel,and channels represent a small fraction of the total surface area ofthe tidal flats. Outside of the channels or in the broad regionbetween the North and South Forks, extended periods of highstress and suspended-sediment concentration did not occur latein the ebb. The stratification asymmetries between flood and ebboccurred at scales much broader than individual channels, andflood dominance of stress and suspended-sediment flux wereobserved on the flats outside the channels.
4.2. Tidal asymmetry
To assess the net effects of the asymmetries in velocity, stress,and suspended sediment, we use the skewness in near-bottomvelocity, ub. The amplitude and sign of the velocity skewnessdepend on the asymmetry between peak flood and ebb velocities,and the approach is better suited to the truncated tides of theintertidal zone than traditional harmonic analysis (Nidzieko andRalston, in press). We are interested in the effects of velocityskewness on sediment transport, and sediment transport scalesroughly as ub
3, with sediment flux¼ubSSC�ubtb�ub3. To include
effects of mean currents on the net sediment flux, we calculate
d fluvial processes on sediment transport over deltaic tidal flats.
D.K. Ralston et al. / Continental Shelf Research ] (]]]]) ]]]–]]]14
the skewness by taking moments about 0 rather than thetemporal mean. Specifically, skewness is defined as the thirdmoment normalized by the second moment to the 3/2 power:
g0 ¼m3
m3=22
mm ¼1
N�1
XN
i ¼ 1
umi ð8Þ
where the mm is the m-th moment about zero and N is the numberof samples. With this definition, positive skewness is consistentwith flood-dominant transport and negative skewness corre-sponds with ebb-directed ub
3. We also calculate the skewness ofthe rate of change in tidal elevation, @Z/@t. If the velocity andwater surface are in quadrature (90 degrees out of phase) andthere is no mean flow, the skewness of ub and @Z/@t will be equal.Evaluating differences in skewness between ub and @Z/@t, we candistinguish the tidal asymmetry due to the external forcing fromasymmetries generated by local processes. To quantify variabilitydue to shifts in tidal amplitude and river discharge, we calculatethe third moment (m3) over a moving window of 40 h, but
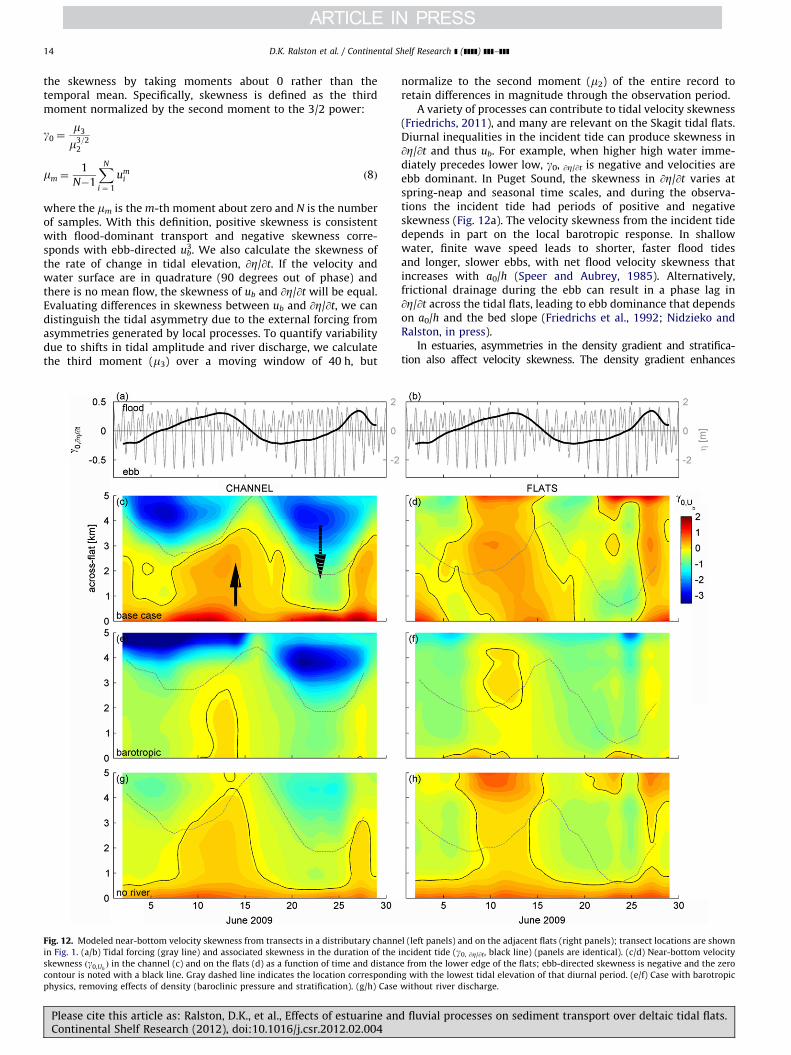
Fig. 12. Modeled near-bottom velocity skewness from transects in a distributary channe
in Fig. 1. (a/b) Tidal forcing (gray line) and associated skewness in the duration of the
skewness ðg0,UbÞ in the channel (c) and on the flats (d) as a function of time and distanc
contour is noted with a black line. Gray dashed line indicates the location correspondin
physics, removing effects of density (baroclinic pressure and stratification). (g/h) Case
Please cite this article as: Ralston, D.K., et al., Effects of estuarine anContinental Shelf Research (2012), doi:10.1016/j.csr.2012.02.004
normalize to the second moment (m2) of the entire record toretain differences in magnitude through the observation period.
A variety of processes can contribute to tidal velocity skewness(Friedrichs, 2011), and many are relevant on the Skagit tidal flats.Diurnal inequalities in the incident tide can produce skewness in@Z/@t and thus ub. For example, when higher high water imme-diately precedes lower low, g0, @Z/@t is negative and velocities areebb dominant. In Puget Sound, the skewness in @Z/@t varies atspring-neap and seasonal time scales, and during the observa-tions the incident tide had periods of positive and negativeskewness (Fig. 12a). The velocity skewness from the incident tidedepends in part on the local barotropic response. In shallowwater, finite wave speed leads to shorter, faster flood tidesand longer, slower ebbs, with net flood velocity skewness thatincreases with a0/h (Speer and Aubrey, 1985). Alternatively,frictional drainage during the ebb can result in a phase lag in@Z/@t across the tidal flats, leading to ebb dominance that dependson a0/h and the bed slope (Friedrichs et al., 1992; Nidzieko andRalston, in press).
In estuaries, asymmetries in the density gradient and stratifica-tion also affect velocity skewness. The density gradient enhances
l (left panels) and on the adjacent flats (right panels); transect locations are shown
incident tide (g0, @Z/@t, black line) (panels are identical). (c/d) Near-bottom velocity
e from the lower edge of the flats; ebb-directed skewness is negative and the zero
g with the lowest tidal elevation of that diurnal period. (e/f) Case with barotropic
without river discharge.
d fluvial processes on sediment transport over deltaic tidal flats.
D.K. Ralston et al. / Continental Shelf Research ] (]]]]) ]]]–]]] 15
near-bottom velocities during flood tides and reduces near-bottomvelocities during ebbs, for a net flood-dominant effect. Asymmetry instratification also creates flood-dominance in near-bottom velocityand stress, as stratification and shear increase during ebbs andbottom velocities are small relative to surface currents. In contrast,channelized river discharge over exposed tidal flats provides amechanism for ebb-dominance. These high channel high stressesare particularly important for moving larger particles, as tidal andestuarine stresses rarely exceed the critical stress for erosion of sand.
To assess the spatial and temporal variability in velocityskewness, we took time series of near-bottom velocities fromthe model for two transects across the intertidal zone: in adistributary channel and on the adjacent flats (Fig. 12c/d). Thevelocity asymmetry depends on the skewness in the incident tide(top panels) and the local barotropic and baroclinic processes. Inthe channel, a dominant source of variability was the enhance-ment of ebb-directed (negative) skewness during the spring tidesdue to fluvial discharge. The effect was most pronounced in theupper channel that was exposed during moderate spring-tide lowwaters, and the ebb-directed fluxes extended more seawardduring the stronger tides late in the month. In the lower channel,the baroclinic pressure gradient and stratification enhancedflood-directed near bottom velocity and stress such that skewnesswas more positive than the incident tide. The model tended to
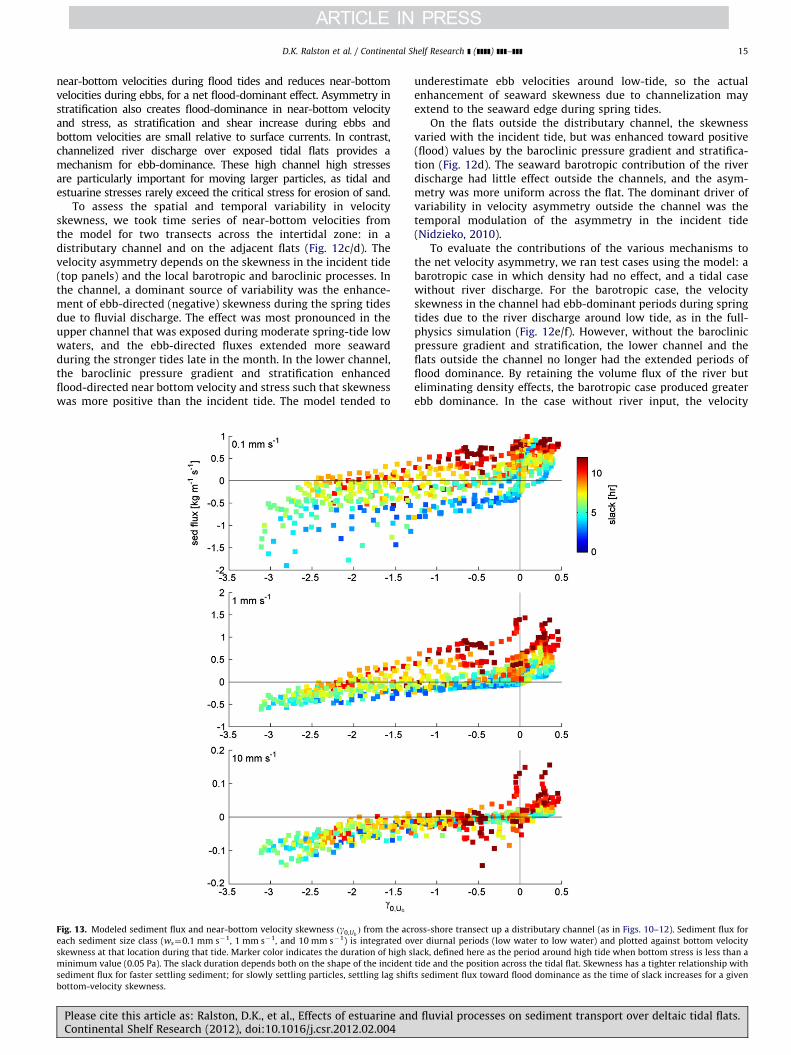
Fig. 13. Modeled sediment flux and near-bottom velocity skewness ðg0,UbÞ from the acr
each sediment size class (ws¼0.1 mm s�1, 1 mm s�1, and 10 mm s�1) is integrated ov
skewness at that location during that tide. Marker color indicates the duration of high s
minimum value (0.05 Pa). The slack duration depends both on the shape of the incident
sediment flux for faster settling sediment; for slowly settling particles, settling lag shift
bottom-velocity skewness.
Please cite this article as: Ralston, D.K., et al., Effects of estuarine anContinental Shelf Research (2012), doi:10.1016/j.csr.2012.02.004
underestimate ebb velocities around low-tide, so the actualenhancement of seaward skewness due to channelization mayextend to the seaward edge during spring tides.
On the flats outside the distributary channel, the skewnessvaried with the incident tide, but was enhanced toward positive(flood) values by the baroclinic pressure gradient and stratifica-tion (Fig. 12d). The seaward barotropic contribution of the riverdischarge had little effect outside the channels, and the asym-metry was more uniform across the flat. The dominant driver ofvariability in velocity asymmetry outside the channel was thetemporal modulation of the asymmetry in the incident tide(Nidzieko, 2010).
To evaluate the contributions of the various mechanisms tothe net velocity asymmetry, we ran test cases using the model: abarotropic case in which density had no effect, and a tidal casewithout river discharge. For the barotropic case, the velocityskewness in the channel had ebb-dominant periods during springtides due to the river discharge around low tide, as in the full-physics simulation (Fig. 12e/f). However, without the baroclinicpressure gradient and stratification, the lower channel and theflats outside the channel no longer had the extended periods offlood dominance. By retaining the volume flux of the river buteliminating density effects, the barotropic case produced greaterebb dominance. In the case without river input, the velocity
oss-shore transect up a distributary channel (as in Figs. 10–12). Sediment flux for
er diurnal periods (low water to low water) and plotted against bottom velocity
lack, defined here as the period around high tide when bottom stress is less than a
tide and the position across the tidal flat. Skewness has a tighter relationship with
s sediment flux toward flood dominance as the time of slack increases for a given
d fluvial processes on sediment transport over deltaic tidal flats.

Fig. 14. Sediment flux maps. Sediment flux was integrated over three tidal cycles during spring tides early in month (greater Qr) and late in the month (larger tides)
through sections approximately corresponding with isobaths. Top panel shows forcing (tides and river discharge), with the two averaging periods indicated by boxes.
D.K. Ralston et al. / Continental Shelf Research ] (]]]]) ]]]–]]]16
skewness both in and out of the channel largely reflected theasymmetry of the incident tide (Fig. 12g/h). All of the cases hadthe same bathymetry, including the distributary channel network.Drainage of the barotropic tide into these channels enhanced ebb-dominance on the upper flats relative to outside the channel, butthe drainage effect was modest compared with the river flux.
The velocity skewness is a convenient measure of the potentialfor sediment transport, but asymmetries in near bottom velocityare not the only mechanisms for generating tidal asymmetricsediment flux. Settling and scour lags enhance landward sedi-ment flux due to spatial gradients in tidal energy (van Straatenand Kuenen, 1958; Postma, 1961; Dronkers, 1986). The doublehigh tides in Skagit Bay enhance settling lag by extending theperiod of low stress between the large flood and large ebb.Bottom stresses during the small ebb and flood were insufficientto resuspend sediment, and the high-water slack effectivelyextended for 6 h or more.
In the model, both velocity asymmetry and settling and scourlags appear to be important to the net sediment flux (Fig. 13). Wecalculated net sediment flux over diurnal tidal cycles and com-pared against the calculated near-bottom velocity skewness,distinguishing among the sediment size classes (ws¼0.1, 1, and10 mm s�1). In all of the size classes, net sediment flux variedapproximately linearly with the local velocity skewness, andoffshore fluxes had negative skewness, consistent with theassumption that sediment flux scales with ub
3. The variabilityabout the linear relationships depended on settling velocity. Forslowly settling particles, the net flux depended not only onvelocity skewness but also the duration of high slack water, withmore landward flux during diurnal periods with extended highslacks. Faster settling particles (10 mm s�1) did not have a strongdependence on slack duration. Considering a 1-m-deep watercolumn, the settling time scale for the 10 mm s�1 sediment is�2 min, while sediment with a settling velocity of 0.1 mm s�1
requires �3 h. For the tides during this period, slack-waterduration correlated with greater diurnal tidal amplitude, enhan-cing the settling lag effect. This correlation would not necessarilybe the case in other tidal regimes or in the Skagit at other times ofthe year.
4.3. Sediment flux
The near-bottom velocity asymmetry suggests that outside ofchannels, the sediment flux should be largely landward due to
Please cite this article as: Ralston, D.K., et al., Effects of estuarine anContinental Shelf Research (2012), doi:10.1016/j.csr.2012.02.004
estuarine enhancement of the incident asymmetry. In channels,the river discharge creates an ebb-directed flux when the tiderecedes to expose the channels, but on the lower flats this onlyoccurred during spring tides. Both in and out of channels, the netasymmetry depended on the incident tide, but the asymmetryalso depended on river discharge, as during high dischargeperiods the baroclinic pressure gradient and stratification asym-metries increased.
In the model, the sediment flux over the flats varied substan-tially between regions with and without distributary channelsand between the southern flats and the northern flats. Netsediment fluxes were calculated through along-shore sectionsthat roughly followed isobaths (0, 1, 2, 3, and 4 m below MSL),integrating over three day periods from low-water to low-water(Fig. 14). Early in the month when discharge was greater, fluxeswere strongly offshore at the river mouths, particularly on thenorthern flats. On the southern flats, the region of offshore fluxspread laterally and weakened in the mid-flats. At the seawardedge, sediment flux was onshore, suggesting a convergence ofsediment on the flats. In contrast in the north, where the flatswere about half as wide, offshore fluxes extended to WhidbeyChannel. An important caveat is that reduced channel stresses inthe model would bias sediment fluxes landward, making thelower southern flats seem more retentive. Between the North andSouth Forks, flux was largely on-shore, consistent with thepresence of stratification and the lack of distributary channels.
During the perigean spring tides later in the month (Fig. 14),the sediment fluxes over the flats had similar spatial structure,but were modified by the shifts in river discharge and tidalamplitude. Sediment fluxes out the river mouths weakened withthe decrease in discharge, but the region off the North Forkcontinued to efficiently move sediment seaward. Between theriver mouths, net flux remained on-shore. However, the flux atthe seaward edge of the southern flats switched toward offshore,due to the emergence of the channels during the extremelylow tides.
5. Discussion and summary
The critical elements that distinguish deltaic tidal flats fromthose without river input are freshwater buoyancy, a fluvialsediment supply, and distributary channels that carry dischargeafter the tide has receded. For sediment transport, the results here
d fluvial processes on sediment transport over deltaic tidal flats.
D.K. Ralston et al. / Continental Shelf Research ] (]]]]) ]]]–]]] 17
suggest that the distributary channels are essential conduits formoving sediment across the flats and offshore. Buoyancy from theriver affects velocity and stress asymmetries on the tidal flats, andthus the sediment transport. The density gradient and periodicstratification shift velocities toward flood dominance and sedi-ment flux landward. Asymmetries in the barotropic tide alsoimpact the net sediment flux, particularly diurnal asymmetries inthe incident tide that modulate through the spring-neap cycle.The velocity skewness due to tidal and fluvial processes providesa good indication of sediment transport potential, but settlinglag enhances landward transport, particularly for slowly settlingparticles and extended high-water slacks.
Comparisons between the model and observations foundmodest skill scores for stress and suspended sediment, and areindicative of challenges that remain in modeling shallow estuar-ine sediment transport. Major dynamical differences between thechannels and adjacent flats were evident in both the model andobservations. While the channels (�50 to 200 m width, �0.2 to1.0 m depth) are subtle features on the scale of the tidal flats andare challenging to resolve in bathymetric surveys or in modelgrids, they were the dominant flow features at shallow waterdepths. The model grid spacing was about 20 m in channelizedregions, but this resolution was inadequate for all but the largestchannels. Even if a finer model grid were computationallyfeasible, the channels would be under-resolved in the bathy-metric data. LiDAR measurements at extreme low tides can definechannel locations on the exposed flats, but do not penetrateturbid water to locate the channel bottom. Acoustic measure-ments have limited spatial coverage and multi-beam swaths areextremely narrow in shallow water. Channel resolution is impor-tant not only for fluvial tidal flats, but also for drainage channelswithout river input, where tidal asymmetries in sediment fluxhave also been observed (Mariotti and Fagherazzi, 2011; Nowackiand Ogston, in this issue).
Modeling intertidal regions requires numerical wetting anddrying, which in FVCOM means setting a minimum water depth(hmin) below which no flux is permitted in or out of a cell. Forthese simulations hmin was 10 cm, equal to or less than theminimum depth in most coastal models. For large values of hmin,the region of elevated stress and SSC at the leading and trailingedges of the tidal water surface are poorly resolved; for smallvalues of hmin, the model becomes numerically unstable. Numer-ical experiments have found that decreasing hmin can affectcalculated sediment transport, with about a 50% increase inlandward flux due to enhanced settling lag when hmin decreasedfrom 10 cm to 2 cm (Hsu et al., in this issue). That study modeledan idealized tidal flat, but decreasing hmin may have the oppositeeffect on net flux for realistic bathymetries that includes channels.The flux limitation as water depths approach hmin reducesdrainage into the channels, reducing the seaward velocities andtransport in late in the ebb compared with the observations(Fig. 11), and reducing seaward sediment flux in both distributaryand drainage channels.
The model results suggest that a significant fraction of thesediment supplied by the river during the freshet was trapped onthe southern tidal flats, and that net export occurred only duringextremely low spring tides. However, analysis of bed sedimentsamples from this period found only limited evidence on the flatsof the geochemical tracer 7Be, which is typically indicative of fine-grained sediment that has recently been delivered by the river(Webster et al., in this issue). Temporary deposits of fine-grainedmaterial were found near distributary channels after flow events,but at seasonal time scales most of the new mud was exported todeeper basins offshore. The discrepancy in apparent trapping onthe flats has several possible explanations. Poorly resolved chan-nels could reduce the ebb transport in the model, particularly
Please cite this article as: Ralston, D.K., et al., Effects of estuarine anContinental Shelf Research (2012), doi:10.1016/j.csr.2012.02.004
mid-flats where the channels are smaller and intricately braided(Fig. 2). Over much of the lower flats, eel grass beds outside of thechannels may provide an additional mechanism for enhancingseaward fluxes that is not in the model. Vegetation increases drag,inhibiting flow that might otherwise go directly to WhidbeyChannel and instead focusing drainage into channels. In themodel, fine sediment was exported more readily than coarse,consistent with indications from the geological observationsthat trapping of fine sediment is more limited than for coarsermaterial.
Uncertainties in the sediment parameters and boundary con-ditions also likely affected the sediment transport results. Theinitial bed sediment distribution was assumed to be uniformcomposition, with 40% sand and the rest finer sediment. In thevicinity of channels, bed surface samples had mud fractionsbetween 20 and 60%, but on the tidal flats the fine fraction wasmuch less, about 3% (Webster et al., in this issue). The model runswere not long enough for the bed composition to approachequilibrium, and the errors in bed composition may have con-tributed to net landward flux, by allowing resuspension offine material and subsequent transport onshore by the residualcurrents.
An additional mechanism for offshore transport of fluvialsediment is wave forcing. On tidal flats without river input,sediment transport due to tidal processes is generally landward,while transport under waves is typically offshore (Le Hir et al.,2000; Yang et al., 2003). During these freshet observations, thewinds were generally weak, and waves likely did not significantlyalter the bottom stress or sediment transport. However, wavesare more likely to be important during the late fall and winterstorms that deliver more than half of the sediment load from theriver (Collins, 1998). While winter storm discharge events sig-nificantly increase the supply of fine sediment to the flats, strongwinds from the south that accompany the storms generate wavesthat would tend to keep sediment in suspension and promoteexport from the flats. Strong south winds would also createsurface stresses that would reduce stratification on the tidal flats,and may drive more of the sediment export from the flatsnorthward toward Deception Pass. Additional observations andmodeling of fall and winter conditions would be needed to geta more complete assessment of the fate of sediment from theSkagit River.
Despite the limitations of the model, consistent conclusionscan be drawn from both the observations and the model results.On fluvial tidal flats, strong horizontal density gradients at theinterface between the river and the subtidal region result inshallow, highly stratified flow. Estuarine stratification and thebaroclinic pressure gradient reinforce the onshore flux that hasbeen observed on tidal flats without fluvial input. In contrast, theriver discharge in distributary channels that emerge whenthe tide recedes provide conduits for offshore sediment flux.The offshore flux in channels appears to be the primary mechan-ism for removing sediment delivered by the river during thefreshet, and because channelization only occurs when the tide hasfallen near or below the level of the flats, the export is enhancedby the lower lows of spring tides.
Acknowledgments
This work was supported by the Office of Naval Research. Wethank the many colleagues who generously shared data, includingBritt Raubenheimer, Steve Elgar, Ken Hooper, Jon Brozena, EricGrossman, Kristen Webster, and Jim Thomson. We also thankGeoff Cowles for assistance with the model.
d fluvial processes on sediment transport over deltaic tidal flats.

D.K. Ralston et al. / Continental Shelf Research ] (]]]]) ]]]–]]]18
References
Chen, C., Liu, H., Beardsley, R.C., 2003. An unstructured grid, finite-volume, three-dimensional, primitive equations ocean model: application to coastal oceanand estuaries. Journal of Atmospheric and Oceanic Technology 20, 159–186.
Chen, S.-N., Geyer, W.R., Sherwood, C.R., Ralston, D.K., 2010. Sediment transportand deposition on a river-dominated tidal flat: an idealized model study.Journal of Geophysical Research 115, 16. doi:10.1029/2010JC006248.
Collins, B., 1998. Preliminary assessment of historic conditions of the Skagit Riverin the Fir Island area: implications for salmonid habitat restoration. SkagitRiver System Cooperative, 72.
Curran, C.A., Grossman, E.E., Mastin, M.C., Huffman, R.L., Sediment load anddistribution in the lower Skagit River, Washington, USA. Continental ShelfResearch, in this issue.
Dronkers, J., 1986. Tidal asymmetry and estuarine morphology. NetherlandsJournal of Sea Research 20, 117–131. doi:10.1016/0077-7579(86)90036-0.
Dyer, K.R., Christie, M.C., Feates, N., Fennessy, M.J., Pejrup, M., van der Lee, W.,2000. An investigation into processes influencing the morphodynamics of anintertidal mudflat, the Dollard Estuary, The Netherlands: I. hydrodynamics andsuspended sediment. Estuarine, Coastal and Shelf Science 50, 607–625.doi:10.1006/ecss.1999.0596.
Finlayson, D.P., 2005. Combined Bathymetry and Topography of the Puget Low-land, Washington State. University of Washington.
Friedrichs, C.T., 2011. Tidal flat morphodynamics: a synthesis. In: Hansom, J.D.,Fleming, B.W. (Eds.), Treatise on Estuarine and Coastal Science, Volume 3:Estuarine and Coastal Geology and Geomorphology. Elsevier, pp. 34.
Friedrichs, C.T., Aubrey, D.G., 1988. Non-linear tidal distortion in shallow well-mixed estuaries: a synthesis. Estuarine, Coastal and Shelf Science 27, 521–545.doi:10.1016/0272-7714(88)90082-0.
Friedrichs, C.T., Aubrey, D.G., 1996. Uniform bottom shear stress and equilibriumhypsometry of intertidal flats. In: Pattiaratchi, C. (Ed.), Mixing in Estuaries andCoastal Seas, Coastal and Estuarine Studies. American Geophysical Union,pp. 405–429.
Friedrichs, C.T., Lynch, D.R., Aubrey, D.G., 1992. Velocity asymmetries in friction-ally-dominated tidal embayments: Longitudinal and lateral variability. In:Prandle, D. (Ed.), Dynamics and Exchanges in Estuaries and the Coastal Zone.American Geophysical Union, Washington, DC, pp. 277–312.
Geyer, W., 1993. The importance of suppression of turbulence by stratification onthe estuarine turbidity maximum. Estuaries and Coasts 16, 113–125.doi:10.2307/1352769.
Hsu, T.-J., Chen, S.-N., Ogston, A.S., The landward and seaward mechanisms of finesediment transport across intertidal flats in the shallow water region—anumerical investigation. Continental Shelf Research, in this issue.
Le Hir, P., Roberts, W., Cazaillet, O., Christie, M., Bassoullet, P., Bacher, C., 2000.Characterization of intertidal flat hydrodynamics. Continental Shelf Research20, 1433–1459. doi:10.1016/S0278-4343(00)00031-5.
Mariotti, G., Fagherazzi, S., 2011. Asymmetric fluxes of water and sediments in amesotidal mudflat channel. Continental Shelf Research 31, 23–36. doi:10.1016/j.csr.2010.10.014.
Meade, R.H., 1969. Landward transport of bottom sediments in estuaries of theAtlantic Coastal Plain. Journal of Sedimentary Petrology 39, 222–234.
Mullarney, J.C., Henderson, S.M., 2011. Hydraulically controlled front trapping on atidal flat. Journal of Geophysical Research 116, 12. doi:10.1029/2010JC006520.
Murphy, A.H., 1988. Skill scores based on the mean square error and their relationshipsto the correlation coefficient. Monthly Weather Review 116, 2417–2424.
Please cite this article as: Ralston, D.K., et al., Effects of estuarine anContinental Shelf Research (2012), doi:10.1016/j.csr.2012.02.004
Nash, D.B., 1994. Effective sediment-transporting discharge from magnitude-frequency analysis. Journal of Geology 102, 79–96.
Nidzieko, N.J., 2010. Tidal asymmetry in estuaries with mixed semidiurnal/diurnal
tides. Journal of Geophysical Research 115, 13. doi:10.1029/2009JC005864.Nidzieko, N.J., Ralston, D.K., Tidal asymmetry and velocity skew on intertidal flats.
Journal of Geophysical Research, in press, doi:10.1029/2011JC007384.Nowacki, D.J., Ogston, A.S., Water and sediment transport of channel-flat systems
in a mesotidal mudflat: Willapa Bay, Washington. Continental Shelf Research,in this issue.
Postma, H., 1961. Transport and accumulation of suspended matter in the DutchWadden Sea. Netherlands Journal of Sea Research 1, 148–180.
Pritchard, D., Hogg, A.J., 2003. Cross-shore sediment transport and the equilibriummorphology of mudflats under tidal currents. Journal of Geophysical Research108, 15. doi:10.1029/2002JC001570.
Ralston, D.K., Geyer, W.R., Lerczak, J.A., Scully, M., 2010. Turbulent mixing in astrongly forced salt wedge estuary. Journal of Geophysical Research 115, 19.
doi:10.1029/2009JC006061.Ralston, D.K., Stacey, M.T., 2005. Longitudinal dispersion and lateral circulation in
the intertidal zone. Journal of Geophysical Research 110, C07015. doi:10.1029/2005JC002888.
Ralston, D.K., Stacey, M.T., 2007. Tidal and meteorological forcing of sedimenttransport in tributary mudflat channels. Continental Shelf Research 27,1510–1527. doi:10.1016/j.csr.2007.01.010.
Raubenheimer, B., Ralston, D.K., Elgar, S., Giffen, D., Signell, R.P., Observations andpredictions of summertime winds on the Skagit tidal flats, Washington.
Continental Shelf Research, in this issue.Speer, P.E., Aubrey, D.G., 1985. A study of non-linear tidal propagation in shallow
inlet/estuarine systems part II: theory. Estuarine, Coastal and Shelf Science 21,207–224. doi:10.1016/0272-7714(85)90097-6.
Sutherland, D.A., MacCready, P., Banas, N.S., Smedstad, L.F., 2011. A model studyof the Salish Sea estuarine circulation. Journal of Physical Oceanography.doi:10.1175/2011JPO4540.1.
van Straaten, L.M.J.U., Kuenen, P.H., 1958. Tidal action as a cause of clayaccumulation. Journal of Sedimentary Research 28, 406–413. doi:10.1306/
74D70826-2B21-11D7-8648000102C1865D.Warner, J.C., Sherwood, C.R., Signell, R.P., Harris, C.K., Arango, H.G., 2008. Devel-
opment of a three-dimensional, regional, coupled wave, current, and sedi-ment-transport model. Computers & Geosciences 34, 1284–1306. doi:10.1016/j.cageo.2008.02.012.
Webster, K.L., Ogston, A.S., Nittrouer, C.A., Delivery, reworking and export of fine-grained sediment across the sandy Skagit River tidal flats. Continental Shelf
Research, in this issue.Whitehouse, R.J.S., Bassoullet, P., Dyer, K.R., Mitchener, H.J., Roberts, W., 2000. The
influence of bedforms on flow and sediment transport over intertidalmudflats. Continental Shelf Research 20, 1099–1124. doi:10.1016/S0278-4343(00)00014-5.
Yang, S.-L., Friedrichs, C., Shi, Z., Ding, P.-X., Zhu, J., Zhao, Q.-Y., 2003. Morpholo-gical response of tidal marshes, flats and channels of the Outer Yangtze River
mouth to a major storm. Estuaries and Coasts 26, 1416–1425. doi:10.1007/BF02803650.
Yang, Z., Khangaonkar, T., 2009. Modeling tidal circulation and stratification inSkagit River estuary using an unstructured grid ocean model. Ocean Modelling28, 34–49. doi:10.1016/j.ocemod.2008.07.004.
d fluvial processes on sediment transport over deltaic tidal flats.