continued delivery of strong growth and value creation · continued delivery of strong growth and...
TRANSCRIPT

Brussels, 28 February 2008 – 1/20
Continued Delivery of Strong Growth and Value Creation
InBev (Euronext: INB), the world’s leading brewer, announced today its results for the full year 2007 (FY07) and fourth quarter 2007 (4Q07): Beer volume growth: beer volumes rose 4.7% for the full year, year-on-year (yoy),
with volume growth in most Zones. In the fourth quarter, beer volumes grew 4.3% organically.
Revenue up: revenue increased by 7.2% for the year, as a result of higher volumes and an increase in revenue per Hl of 1.9%, or +3.6% eliminating the impact of the change in geographic mix. 4Q07 revenue was up 7.8%, as the result of 2.1% higher revenue per Hl and increased volumes. Excluding the impact of the change in geographic mix, revenue per Hl would have increased +3.8%.
Control of cost and expenses: despite some input cost increases, consolidated cost of sales (CoS) per Hl for the full year was only 2.0% above 2006, below the average inflation in our geographies. This result was supported by a limited increase of 0.4% in CoS per Hl for the 4Q07, yoy. A decrease of 2.1% in group operating expenses for the year, and 7.7% for the quarter, mainly due to lower overhead costs, is evidence that the group benefits from an ownership mindset which delivers ongoing efficiency improvements.
EBITDA growth and continued margin expansion: 2007 normalized EBITDA increased by 16.5%, resulting in a 34.6% EBITDA margin, an organic increase of 274 basis points. Fourth quarter normalized EBITDA growth was 23.9%, and the EBITDA margin was 37.8%, which represents an organic margin expansion of 482 basis points.
Net profits grew double digits: normalized profit attributable to equity holders of InBev for 2007 of 1 863 million euro was 22.4% higher than 2006.
Significant improvement of cash flow: cash flow from operating activities rose 23.6% to 4.1 billion euro, due to higher profit and improved working capital management, reflecting our efforts to further enhance cash flow and working capital management.
Returning cash to shareholders: InBev paid out a total of 2.5 billion euro during 2007. This consists of acquiring 600 million euro of InBev shares and 1 129 million euro of AmBev shares through share buyback programs, as well as paying 435 million euro in dividends to InBev shareholders, and 333 million euro to minority shareholders, mainly AmBev minority shareholders. The InBev board proposes to pay a dividend of 2.44 euro per share (last year: 0.72 euro per share), subject to shareholder approval.
The enclosed information constitutes regulated information as defined in the Royal Decree of 14 November 2007 regarding the duties of issuers of financial instruments which have been admitted for trading on a regulated market.

Brussels, 28 February 2008 – 2/20
Total volumes (thousand Hls) 270 611 246 529 5.2%
Beer volumes 229 978 211 595 4.7%
Non-beer volumes 40 634 34 934 8.6%
Revenue 14 430 13 308 7.2%
Gross profit 8 494 7 831 7.1%
Normalized EBITDA 4 992 4 239 16.5%
Normalized EBIT 3 920 3 223 20.4%
Profit attributable to equity holders of
InBev (normalized)1 863 1 522
Profit attributable to equity holders of Inbev2 198 1 411
Normalized earnings per share (euro) 3.05 2.50
Earnings per share (euro) 3.60 2.32
Margins
Gross margin 58.9% 58.8% -4 bp
Normalized EBITDA margin 34.6% 31.9% 274 bp
Normalized EBIT margin 27.2% 24.2% 295 bp
Figure 1: Consolidated performance (million euro)
FY07 FY06 Organic
growth
InBev’s FY07 and FY06 numbers are based on audited consolidated financial statements prepared in accordance with IFRS. Unless otherwise indicated, amounts are presented in million euro. To facilitate the understanding of InBev’s underlying performance, the analyses of growth, including all comments in this press release, unless otherwise indicated, are based on organic numbers. In other words, financials are analyzed eliminating the impact of changes in currencies on translation of foreign operations, and scopes. Scopes represent the impact of acquisitions and divestitures, the start up or termination of activities, or the transfer of activities between segments. Whenever used in this document, the term “normalized” refers to performance measures (EBITDA, EBIT, Profit, EPS) before non-recurring items. Non-recurring items are either income or expenses which do not occur regularly as part of the normal activities of the company. They are presented separately because they are important for the understanding of the underlying sustainable performance of the company due to their size or nature. Normalized measures are additional measures used by management, and should not replace the measures determined in accordance with IFRS as an indicator of the company’s performance. Values in the figures and annexes may not add up, due to rounding. EPS based upon weighted average of 610 (4Q07 and FY07) and 608 (4Q06 and FY06) million ordinary shares outstanding.
MANAGEMENT COMMENTS 2007 has been the third full year of InBev. In 2007 we grew EBITDA by 16.5%, and delivered an EBITDA margin of 34.6%, an increase of 274 basis points on an organic basis compared to 31.9% in the previous year. During the first three years of InBev, our EBITDA margin has demonstrated consistent evolution from 26.1% in 2004 (pro forma), 28.6% in 2005, 31.9% in 2006, to 34.6% in 2007. Our EBITDA grew at a compounded annual growth rate of 16.2% for these first years.

Brussels, 28 February 2008 – 3/20
In 2007, our EBITDA margin grew in five out of six Zones:
• North America: up to 38.2% or 173 bps organically • Latin America North: up to 47.3% or 344 bps organically • Latin America South: up to 40.3% or 244 bps organically • Central & Eastern Europe: up to 23.6% or 173 bps organically • Asia Pacific: up to 26.5% or 88 bps organically • Western Europe: down to 22.3% or -9 bps organically.
Consolidated volumes grew by 5.2% in 2007, with growth of 4.7% for beer, and 8.6% for soft drinks. However our own beer volumes increased by 5.0% as a result of our strategy to focus on building branded volumes, while reducing private labels and other, lower margin beer volumes. Our volumes in Latin America North, Latin America South, and Central & Eastern Europe were strong, and above our overall average. Three main issues diluted our overall volume performance in 2007: our market share performances in China and the UK (the only Western European market where we lost share) and industry contraction in Western Europe. With respect to costs, cost of sales per hectoliter grew by 2.0% versus average inflation of 4%, as effective productivity programs enabled us to partially offset commodity and general inflationary pressures. Operating expenses decreased by 2.1%, which once again confirms the power of our Zero-Based Budgeting cost management approach, a way of life prevalent throughout the company. In terms of cash from operations, 2007 saw growth from 3 287 million euro to 4 064 million euro, or an increase of 777 million euro, of which 270 million euro was an improvement in working capital. Priorities for 2008 For 2008, we will continue to work on the hallmarks of our business model: our Dream/People/Culture platform, market execution capabilities, brand building skills, and strict cost control. Dream/People/Culture Our dream is to become ‘the best beer company in a better world’. We use the term ‘better world’ to articulate our belief that if we are to become the best beer company measured by profitability, we must work hard internally as well as externally. Internally, our aim is to continue to build and grow our brands whilst becoming more efficient in everything we do-year in, and year out. Externally, we are committed to working with all relevant stakeholders to ensure our company and industry supports and promotes responsible drinking and environmental initiatives. Talented people continue to represent our most important, and indeed only, sustainable competitive advantage. Our ownership culture unites our people providing the necessary energy, commitment and alignment to support the pursuit of our dream.

Brussels, 28 February 2008 – 4/20
Market execution In our industry, execution is what differentiates great companies from good companies, and we will continue to build these skills in order to differentiate ourselves in the market place. We still have opportunities in some of our Zones to enhance our in-market discipline. Brand building capabilities Brand building provides the content for market execution. The commercial section of our annual report features examples of brand development success stories from 2007. Beck’s Vier in the UK, Bohemia in Brazil, Cass in South Korea, Sedrin in China, Chernigivske in the Ukraine, Quilmes Stout in Argentina, and Stella Artois in the U.S. are just some examples of positive brand development. We are committed to learn from these successes and replicate best practices throughout our company. Strict cost control Cost control remains an essential pillar of our business, and could make an even bigger difference going forward in an environment in which commodity prices are on the rise and inflation is predicted to increase. “In summary, 2007 was a good year for our company. We know we still have much to do to deliver on our dream of being the best beer company in a better world. Going forward into 2008, we at InBev are excited by and committed to the prospect of realizing another step in pursuit of our dream”, said Carlos Brito, InBev’s CEO. FULL YEAR VOLUMES
FY06 Scope Organic
growth
FY07 Organic
growth
North America 14 342 -1 710 -60 12 572 -0.5%
Latin America - North 94 586 931 5 361 100 877 5.7%
Latin America - South 22 566 5 833 2 125 30 524 9.7%
Western Europe 39 147 -1 218 -1 861 36 068 -4.9%
Central & Eastern Europe 43 201 0 5 936 49 137 13.7%
Asia Pacific 30 924 4 375 1 081 36 380 3.6%
Global Export & Holding Companies 1 763 3 095 195 5 054 4.0%
Worldwide 246 529 11 306 12 777 270 611 5.2%
Figure 2. Volumes (thousand Hls)
Consolidated volumes grew 5.2% for the full year 2007, as beer volumes rose 4.7% and non-beer volumes were 8.6% higher. However our own beer volumes increased by 5.0% as a result of our strategy to focus on building branded volumes, while reducing private labels and other, lower margin beer volumes. Beer growth was driven by our operations in Latin America North and South, Central & Eastern Europe, as well as Asia Pacific. North America recorded a limited volume decrease of 0.5% for FY07, with a positive performance in the second half of the year. Volumes in Canada declined 1.4% on an organic basis. Next to this organic result, starting in April our Canadian performance benefited from the addition of the Lakeport brands to our portfolio, and these brands grew throughout the year. In the US, the volume performance of our Canadian brands improved since the second quarter. This result confirms our decision to retain an organization focused on selling these brands, following the agreement with Anheuser-Busch (“A-B”) in which A-B is responsible for the distribution of our European import brands in the US.

Brussels, 28 February 2008 – 5/20
2007 marked the first year of A-B importing our European brands for the US market. We saw improvements in shipments after the resolution of early transition challenges, and Stella Artois continued its very strong growth. In Latin America North, volumes rose by 5.7% (beer up 5.1%; non-beer up 7.2%). Beer volumes in Brazil increased 5.6%, and our market share for the full year was 67.8%, including nine months of sequential market share gain. The beer volumes of the other countries of the Zone were down 4.9%, a result which is entirely attributable to much lower industry volumes in Venezuela, where the company grew market share. Volumes grew by 9.7% in Latin America South (beer up 6.8%; non-beer up 14.3%), as Argentina, Bolivia and Uruguay presented solid volume increases. These increases were supported by the ongoing growth of our premium brands in this Zone. Against the background of lower industry volumes in Western Europe, our total volumes declined 4.9%; however, branded beer volumes were down somewhat less, by 4.4%. Beer volumes in the UK declined 10.3% for the full year, resulting in share loss in a market which was lower than last year. German beer volumes were down 3.8%, resulting in a stable market share for the year. In Belgium, despite a beer volume decrease of 1.5%, our market share grew. Consistent with previous results, apart from the UK we grew or maintained market share in all main Western Europe markets for 2007. Solid volume growth of 13.7% was achieved in Central & Eastern Europe. Volumes increased by 16.5% in Russia, leading to increased market share and we achieved an improved product mix. Ukraine volumes rose 19.3% and we continued to hold clear market leadership. Central European operations achieved higher volumes with good share gains in nearly all markets. Asia Pacific volumes increased by 3.6% during 2007. In China, organic volume growth was 3.0%, which was lower than the market. The Sedrin business continued to perform well, while the business focused on implementing best practices designed to improve results across our operations. In January 2008 InBev reached an agreement with its partner in InBev Shiliang (Zhejiang) Brewery to increase InBev’s stake in this business to 100% and assume full control after the approval of the relevant authorities. This important step will enable InBev to strengthen its position in the Zhejiang province in China. Volumes were 5.7% ahead in South Korea, supported by good growth of our brand Cass, and resulting in higher market share. GLOBAL BRAND DEVELOPMENT InBev's global brands increased 3.2% in 2007. Brahma® volumes rose 4.9% due primarily to good volumes in Brazil. While Stella Artois volumes declined by 2.4%, this was entirely due to lower volumes in the UK, partly offset by strong volume growth in the US, Eastern Europe and Latin America. Beck’s® delivered 4.3% volume growth, with significant contributions from the UK and Central & Eastern Europe. Continued good growth in Western Europe and North America led to 10.2% higher volumes of Leffe®. INCOME STATEMENT – FY07

Brussels, 28 February 2008 – 6/20
FY06 Scope Currency
translation
Organic
growth
FY07 Organic
growth
Revenue 13 308 262 -90 950 14 430 7.2%
Cost of sales -5 477 -114 53 -397 -5 936 -7.3%
Gross profit 7 831 148 -38 553 8 494 7.1%
Distribution expenses -1 551 -44 17 -136 -1 713 -8.8%
Sales & marketing expenses -2 115 -48 16 12 -2 134 0.6%
Administrative expenses -1 075 -20 4 102 -990 9.5%
Other operating income/expenses 133 5 5 119 263 83.0%
Normalized profit from operations
(normalized EBIT)3 223 42 5 650 3 920 20.4%
Non recurring items above EBIT -94 374
Net financing costs -472 -598
Share of results of associates 1 1
Income tax expense -531 -649
Profit 2 126 3 048
attributable to equity holders of InBev 1 411 2 198
attributable to minority interests 715 849
Normalized EBITDA 4 239 68 -9 694 4 992 16.5%
Figure 3. Consolidated Income Statement (million euro)
Note: Normalized EBIT and EBITDA is EBIT and EBITDA before non-recurring items. The impact of non-recurring items in FY07 was +374 million euro on EBIT and +332 million euro on EBITDA, while it was -94 million euro on EBIT and -16 million on EBITDA in FY06. Revenue – Consolidated revenue grew by 7.2% (950 million euro) to 14 430 million euro. All operational Zones generated higher revenue per Hl, evidence that the company’s ongoing efforts to improve it’s product mix is paying off. Revenue per Hl increased by 1.9% yoy on a consolidated basis. On a constant geographic basis, i.e. eliminating the impact of faster growth in countries with lower revenue per Hl in euro, revenue per Hl would have grown 3.6% organically. Cost of Sales (CoS) – Consolidated CoS was 5 936 million euro in 2007, an increase of 7.3% (397 million euro), yoy. On a per Hl basis, cost of sales for the full year was 2.0% higher, yoy, as the company continued to benefit from the successful implementation of supply chain efficiency programs, as well as a strong risk management approach. On a constant geographic basis, the organic increase in cost of sales per Hl would have been an estimated 3.9%. Operating Expenses – Operating expenses, which are distribution expenses, sales and marketing expenses, administrative expenses and other operating income/expenses, totaled 4 574 million euro for 2007, or an organic decrease of 2.1% (97 million euro) compared to 2006. Distribution expenses grew 136 million euro (8.8%), due to the combination of higher volumes and the impact of increased transport costs in some operations. At a group level, sales and marketing expenses were 12 million euro lower (0.6%). This overall result reflects the achievement of important savings in non-working sales and marketing expenses, as well as the impact of a changed business model for the import of our European brands into the US. Since February 2007, A-B bears the sales and marketing costs for our European imports. Overhead costs were contained during the year, decreasing by 102 million euro (9.5%), partly impacted by a higher accrual for bonus payments in 2006, as well as confirming that strong cost management continues as part of our company culture. Other operating income/expenses improved by +119 million euro for the full year compared to the previous year. The main drivers were increased fiscal incentives in Latin America North, the release of provisions in Western Europe, gains on sales of assets in Europe and increased royalties related to the import agreement with Anheuser-Busch.

Brussels, 28 February 2008 – 7/20
EBITDA – 2007 normalized EBITDA of 4 992 million euro represented 16.5% organic growth (up 694 million euro), with all Zones except Western Europe growing EBITDA.
North America had an EBITDA of 597 million euro (+5.6% / up 32 million euro), due principally to tight management of costs
Latin America North EBITDA was 2 318 million euro (+20.9% / up 390 million euro), arising from healthy top line growth and focused cost control
Latin America South delivered EBITDA of 405 million euro (+29.1% / up 79 million euro), driven by a strong rise in revenue and limited expense growth
Western Europe EBITDA was 771 million euro (-3.9% / down 31 million euro), impacted by lower volumes and higher cost of sales, partly offset by good fixed cost management. Excluding the UK, EBITDA grew more than 7% despite a lower industry and increased input costs.
Central & Eastern Europe grew EBITDA to 520 million euro (+32.3% / up 128 million euro), due to strong top line growth, partly offset by higher distribution and commercial expenses
Asia Pacific increased EBITDA to 263 million euro (+11.9% / up 27 million euro), with higher revenue partly offset by increased sales and marketing expenses
Global Export & Holding Companies EBITDA was 118 million euro (up 69 million euro), mostly explained by the impact of changing to a different business model for our European imports into the USA
The consolidated EBITDA margin for the full year 2007 was 34.6% (2006: 31.9%). EBITDA margin expansion was 274 basis points; organic expansion was also 274 basis points. There was a negative currency translation impact of 9 million euro for 2007 (2006: positive impact of 238 million euro).
Non-recurring items – Non-recurring items for FY07 resulted in a net non-recurring gain to profit from operations of 374 million euro. This gain is mainly due to the sale of Belgian and Dutch real estate assets, which resulted in a gain before taxes of 357 million euro. Profit – Normalized profit attributable to equity holders of InBev for FY07 was 1 863 million euro (normalized EPS 3.05 euro), up 22.4% yoy. Reported profit attributable to equity holders of InBev for 2007 was 2 198 million euro, and was impacted by the following:
Net financing costs: 598 million euro, an increase of 125 million euro. This increase is driven mainly by higher interest expense following the higher mix of Brazilian real interest-bearing liabilities in InBev’s 2007 average net debt in comparison to the mix in 2006
Income tax expense: 649 million euro (effective tax rate of 17.6% for 2007 vs. 20.0% in 2006). The decrease in the 2007 effective tax rate is explained by the fact that the company continues to benefit at AmBev level from the impact of interest on equity payments, by tax deductible goodwill from the merger between InBev Holding Brazil and AmBev in July 2005 and the acquisition of Quinsa in August 2006. In addition the effective tax rate was positively impacted by the low taxed capital gains on the sale of real estate to Cofinimmo, and by the recognition of a deferred tax asset on a US tax loss carry forward. Excluding the impact of this non-recurring capital gain, other non-recurring items and the recognition of the deferred tax asset in the US, the effective tax rate of the company would have been 19.7%.
Brussels, 28 February 2008 – 8/20
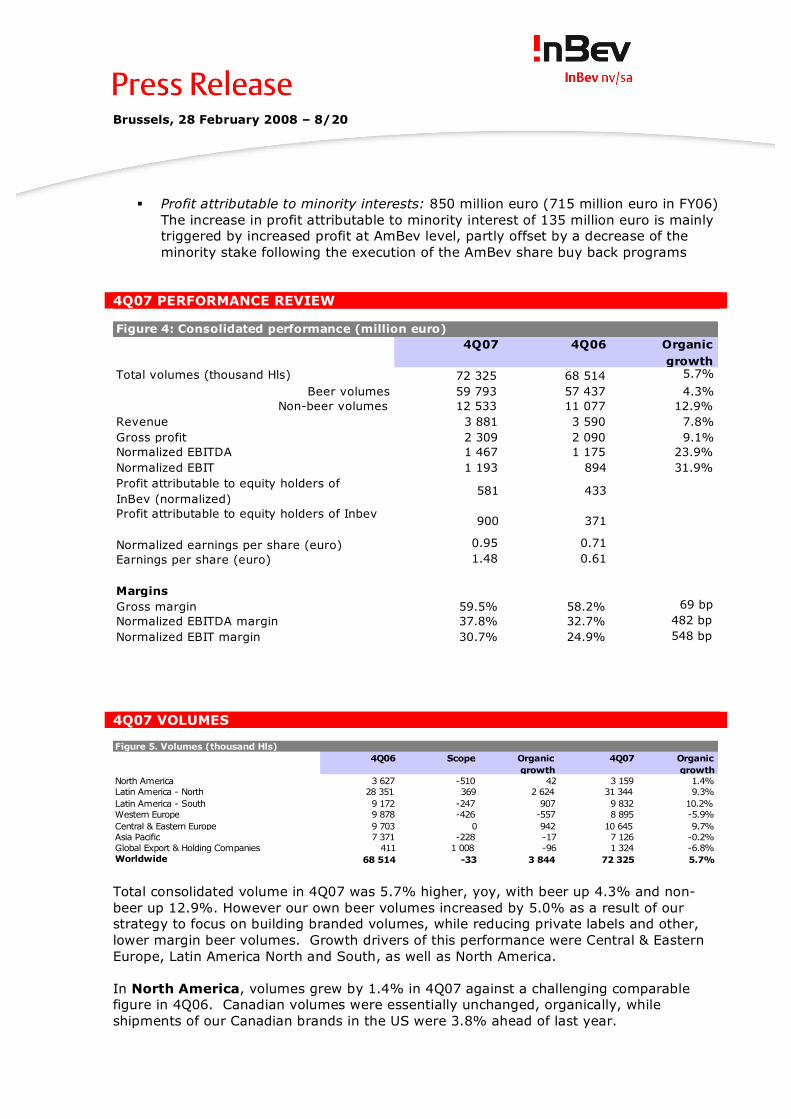
Profit attributable to minority interests: 850 million euro (715 million euro in FY06)
The increase in profit attributable to minority interest of 135 million euro is mainly triggered by increased profit at AmBev level, partly offset by a decrease of the minority stake following the execution of the AmBev share buy back programs
4Q07 PERFORMANCE REVIEW
Total volumes (thousand Hls) 72 325 68 514 5.7%
Beer volumes 59 793 57 437 4.3%
Non-beer volumes 12 533 11 077 12.9%
Revenue 3 881 3 590 7.8%
Gross profit 2 309 2 090 9.1%
Normalized EBITDA 1 467 1 175 23.9%
Normalized EBIT 1 193 894 31.9%
Profit attributable to equity holders of
InBev (normalized)581 433
Profit attributable to equity holders of Inbev900 371
Normalized earnings per share (euro) 0.95 0.71
Earnings per share (euro) 1.48 0.61
Margins
Gross margin 59.5% 58.2% 69 bp
Normalized EBITDA margin 37.8% 32.7% 482 bp
Normalized EBIT margin 30.7% 24.9% 548 bp
Figure 4: Consolidated performance (million euro)
4Q07 4Q06 Organic
growth
4Q07 VOLUMES
4Q06 Scope Organic
growth
4Q07 Organic
growth
North America 3 627 -510 42 3 159 1.4%
Latin America - North 28 351 369 2 624 31 344 9.3%
Latin America - South 9 172 -247 907 9 832 10.2%
Western Europe 9 878 -426 -557 8 895 -5.9%
Central & Eastern Europe 9 703 0 942 10 645 9.7%
Asia Pacific 7 371 -228 -17 7 126 -0.2%
Global Export & Holding Companies 411 1 008 -96 1 324 -6.8%
Worldwide 68 514 -33 3 844 72 325 5.7%
Figure 5. Volumes (thousand Hls)
Total consolidated volume in 4Q07 was 5.7% higher, yoy, with beer up 4.3% and non-beer up 12.9%. However our own beer volumes increased by 5.0% as a result of our strategy to focus on building branded volumes, while reducing private labels and other, lower margin beer volumes. Growth drivers of this performance were Central & Eastern Europe, Latin America North and South, as well as North America. In North America, volumes grew by 1.4% in 4Q07 against a challenging comparable figure in 4Q06. Canadian volumes were essentially unchanged, organically, while shipments of our Canadian brands in the US were 3.8% ahead of last year.

Brussels, 28 February 2008 – 9/20
Latin America North had a very solid quarter, with volume growth of 9.3% (beer up 8.0%; non-beer up 12.7%). Brazil beer volumes increased 7.9%, and our other markets in this Zone were up by 8.9% with nearly all markets above last year. Volumes in Latin America South rose 10.2% (beer up 7.6%; non-beer up 14.6%), as a result of growth in most countries of the Zone. Western Europe volumes were down 5.9%. UK beer volumes dropped 10.8%, leading to some share loss in a market which was down versus previous year. Beer volumes in Germany were 4.7% lower, resulting in a stable share for the quarter and the year. Volumes in Belgium decreased 0.3% yoy, less than the industry decline, leading to share gains in the quarter and the year. Apart from the UK, the company maintained or grew share in our main WE markets. The Central & Eastern Europe Zone grew further, and was up 9.7% for 4Q07, yoy. Russian volumes were +16.9% higher, in Ukraine they were 11.9% up while in Central Europe, volumes were in line with last year. Asia Pacific recorded a 0.2% decrease in volumes in the fourth quarter, yoy. Chinese volumes were 1.0% lower against double digit growth in the previous year. South Korea had volume growth of 2.5%, confirming that our efforts to achieve healthy top line growth are having an impact. GLOBAL BRAND DEVELOPMENT Volumes of the global brands rose 6.3% in the 4Q07. Brahma volumes were 10.1% higher, driven by good growth across Latin America. Volumes of Stella Artois were lower in Western Europe, and increased in North America and Latin America South; combined, this led to a 2.4% decrease yoy. Growth of Beck’s volumes was 2.8%, while Leffe grew 14.4% compared to last year. INCOME STATEMENT – 4Q07
4Q06 Scope Currency
translation
Organic
growth
4Q07 Organic
growth
Revenue 3 590 -12 24 279 3 881 7.8%
Cost of sales -1 500 9 9 -90 -1 573 -6.1%
Gross profit 2 090 -3 32 189 2 309 9.1%
Distribution expenses -384 -12 -2 -44 -442 -11.3%
Sales & marketing expenses -541 2 2 24 -513 4.4%
Administrative expenses -304 -2 -2 57 -251 18.7%
Other operating income/expenses 33 -3 5 56 90 166.4%
Normalized profit from operations
(normalized EBIT)894 -18 35 281 1 193 31.9%
Non recurring items above EBIT -10 339
Net financing costs -134 -145
Share of results of associates 0 1
Income tax expense -149 -186
Profit 601 1 202
attributable to equity holders of InBev 371 900
attributable to minority interests 230 302
Normalized EBITDA 1 175 -17 32 278 1 467 23.9%
Figure 6. Consolidated Income Statement (million euro)
Note: Normalized EBIT and EBITDA is EBIT and EBITDA before non-recurring items. The impact of non-recurring items in 4Q07 was +339 million euro on EBIT and +341 million euro on EBITDA, while it was -10 million euro on EBIT and +51 million euro on EBITDA in 4Q06.

Brussels, 28 February 2008 – 10/20
Revenue – Consolidated revenue for the 4Q07 of 3 881 million euro was 7.8% (279 million euro) higher, yoy. This was the result of volume growth, as well as a rise in consolidated net revenue per Hl of 2.1%. Cost of Sales (CoS) – Consolidated CoS in 4Q07 was 1 573 million euro, 6.1% (90 million euro) above last year. The resulting change in consolidated CoS per Hl, an increase of 0.4%, was in line with expectations, and helped the company to achieve a consolidated cost of sales per Hl well under average inflation, in spite of some input cost pressures. Operating Expenses – Operating expenses of 1 116 million euro were 7.7% (92 million euro) lower than last year. Distribution expenses grew 44 million euro (11.3%) yoy, on the back of volume gains and some higher transport costs. Group sales and marketing expenses were 24 million euro (4.4%) lower, mainly explained by savings in non-working commercial expenses, especially in Western Europe, and the shift of commercial costs to A-B for our European imports in the US. Administrative expenses decreased by 57 million euro (18.7%) organically, as good overhead control was sustained, bonus accruals were lower than last year, and some project related costs made in 4Q06 did not recur. Other operating income/expenses improved by +56 million euro in the fourth quarter. This change is largely attributable to increased fiscal incentives in Latin American North, gains on sales of assets in Europe, and royalty payments related to our import agreement with Anheuser-Busch.
EBITDA – Normalized EBITDA of 1 467 million euro for the 4Q07 is an organic increase of 23.9% (up 278 million euro), yoy.
North America had an EBITDA of 163 million euro (+4.6% / up 7 million euro) as the benefit of top line growth fell to the bottom line
Latin America North EBITDA of 799 million euro (+30.6% / up 175 million euro) was generated by a strong volume performance and sound control of expenses, as well as increased fiscal incentives mentioned above
Latin America South generated EBITDA of 142 million euro (+32.7% / up 39 million euro) through higher volumes and revenue and careful management of fixed expenses
Western Europe delivered 206 million euro (-0.2% / unchanged) of EBITDA by tightly managing costs while facing lower revenue.
Central & Eastern Europe EBITDA was 100 million euro (+210.6% / up 69 million euro), due to a combination of good volume and revenue growth, lower administrative expenses, and a less challenging comparable figure in 4Q06. The 4Q06 figure was impacted by some one-time or first time expenses, as well as a change in intercompany charges, which are neutral for consolidated EBIT. Excluding these impacts and an asset sale gain in 4Q07, EBITDA margins would have been up by 477 basis points, year-on-year
Asia Pacific EBITDA was 51 million euro (-7.1% / down 4 million euro), as revenue growth was more than offset by the combination of higher cost of sales, and increased commercial expenses

Brussels, 28 February 2008 – 11/20
Global Export & Holding Companies EBITDA was 6 million euro (down 7 million euro), as the 4Q06 figure was materially improved by a change in intercompany charges from CEE, which is neutral for consolidated EBIT
Consolidated EBITDA margin for 4Q07 was 37.8% (4Q06: 32.7%). Margin expansion reached 510 basis points, of which 482 basis points were organic. The positive currency translation impact was 32 million euro for the fourth quarter 2007 (4Q06: negative impact of 15 million euro).
Non-recurring items – Non-recurring items for 4Q07 resulted in a net non-recurring gain to profit from operations of 339 million euro. This gain is mainly due to the sale of Belgian and Dutch real estate assets, which resulted in a gain before taxes of 357 million euro. Profit – Normalized profit attributable to equity holders of InBev amounted to 581 million euro (normalized EPS 0.95 euro) for 4Q07, an absolute increase of 34.6% yoy. Reported profit attributable to equity holders of InBev for the same period was 900 million euro, and included the following:
Net financing costs: 145 million euro; 11 million higher than 4Q06; largely explained by higher interest expense following the higher mix of Brazilian real interest-bearing liabilities in InBev’s 4Q07 average net debt in comparison to the mix in 4Q06.
Income tax expense: 186 million euro with an effective tax rate of 13.4% (versus 19.9% in 2006). The decrease in the 2007 effective tax rate is explained by the fact that the company continues to benefit at AmBev level from the impact of interest on equity payments, by tax deductible goodwill from the merger between InBev Holding Brazil and AmBev in July 2005 and the acquisition of Quinsa in August 2006. In addition the effective tax rate was positively impacted by the low taxed capital gains on the sale of real estate to Cofinimmo, and by the recognition of a deferred tax asset on a US tax loss carry forward. Excluding the impact of this non-recurring capital gain, other non-recurring items and the recognition of the deferred tax asset in the US, the effective tax rate of the company would have been 18.3%.
Profit attributable to minority interests: 302 million euro (230 million euro in 4Q06). The increase in profit attributable to minority interest of 72 million euro is mainly triggered by increased profit at AmBev level, partly offset by a decrease of the minority stake following the execution of the AmBev share buy back programs
FULL YEAR BALANCE SHEET InBev’s net financial debt decreased to 5 093 million euro as of December 2007, from 5 563 million euro as of December 2006. Apart from operating results net of capital expenditures, the net financial debt was impacted by the acquisition of Lakeport, Cintra and the Brazilian distributors (190 million euro); the InBev (600 million euro) and AmBev (1 129 million euro) share buy-back programs; and dividend payments (769 million euro), partly offset by the sale of real estate to Cofinimmo in Belgium and the Netherlands (379 million euro), by the sale of Dinkelacker (22 million euro) and by the impact of changes in foreign exchange rates (107 million euro).

Brussels, 28 February 2008 – 12/20
As a result of share buy-back programs in 2007, InBev acquired 10.3 million InBev shares for an amount of 600 million euro, and AmBev acquired 25.6 million AmBev shares for an amount of 1 129 million euro. FULL YEAR CASHFLOW Cash flow from operating activities increased from 3 287 million euro in 2006 to 4 064 million euro in 2007, or 23.6%. This improvement was the result of higher profit and better working capital management. Consistent with its commitment to long term value creation, InBev is stepping up efforts to further improve cash flow management. The evolution of the cash used in investment activities from (3 481) million euro in 2006 to (2 358) million euro in 2007 is mainly explained by higher acquisitions in prior year (Fujian Brewery and Beverage Associates Corp.’s remaining shares in Quinsa), partly offset by higher purchases of minority interest through the AmBev share buy-back programs in 2007. InBev continues to free up capital invested in non-core assets, and the company made several disposals that positively impacted the cash flow from investing activities, including the sale of the participation in Immobrew to Cofinimmo. InBev spent 1 440 million euro in 2007 (2006: 1 218 million euro) on acquiring capital assets. In 2007, out of the total capital expenditures, approximately 67% was used to improve our production facilities, while 22% was used for logistics and commercial investments. Approximately 11% was used for improving administrative capabilities and purchase of hardware and software. Further details on InBev’s cash flows can be found in Annex 3. OUTLOOK InBev remains committed to deliver EBITDA margin expansion through a combination of top line growth and continued disciplined cost management. Top line growth will remain our priority, as evidenced by the fact that we are linking an even more significant part of our variable compensation program to improved market share performance. To support this, we will continue to provide the right brands with sufficient resources and further roll-out our proven sales execution programs. It should be noted, however, that we benefited from strong growth in the first half of 2007, which will lead to challenging comparables for the first half of 2008, especially in the first quarter with respect to both volume and EBITDA performance. Operating efficiency also remains high on the agenda, and we will maintain our cost of sales per Hl growth in line with the 4% weighted average country inflation to which we are exposed. We will also continue to leverage our Zero Based Budgeting (ZBB) disciplines to ensure that fixed overhead cost increases stay below inflation.

Brussels, 28 February 2008 – 13/20
As a result of our growing cash flow generation and a more pro-active attitude in managing capital structure, the company is continuing with its share buy back programs while adopting a more progressive dividend payment, in which the current 33% maximum payout is removed. These capital structure decisions will not restrict us from pursuing any value creating transaction should the opportunity arise. In summary we recognize that in 2008 there will be greater challenges to overcome than there have been over the past three years. However, we are confident that great people, united by one ownership culture, working towards a shared dream, will continue to deliver top line growth, EBITDA margin expansion and value creation. Recent events On 12 February 2008, InBev announced the results of AmBev’s tender offer for Quinsa shares. AmBev has accepted for purchase the 3 136 001 Class A and 8 239 536 Class B shares (including 7 236 336 Class B shares held as ADSs) of Quinsa, representing 57% of the outstanding Class A shares and 94% of the outstanding Class B shares of Quinsa not owned by AmBev or its subsidiaries, that were validly tendered and not validly withdrawn. As a result, AmBev’s voting interest in Quinsa is 99.56% and its economic interest is 99.26%. On 28 February 2008, InBev’s board of directors announces that it has proposed a series of measures designed to significantly enhance the company’s capital structure. These proposed actions are consistent with and reinforce InBev’s commitment to value creation, as a result of the company's margin expansion and strong cash flow generation. InBev’s board proposes to pay a dividend of 2.44 euro per share, subject to shareholder approval. The current dividend policy allows for the payment of, on average, between 25% and 33% of the previous fiscal year’s net profit. Going forward, the board will implement a more progressive dividend approach in which the 33% maximum payout is removed. In addition, the share buy-back program for up to 300 million euro of InBev shares, announced on 21 January 2008, has been concluded, with a total amount of 207 million euro purchased. InBev has initiated a new buy-back program of InBev shares for an amount up to 500 million euro, for a period of 12 months. In January 2008 InBev reached an agreement with its partner in InBev Shiliang (Zhejiang) Brewery to increase InBev’s stake in this business to 100% and assume full control after the approval of the relevant authorities. This important step will enable InBev to strengthen its position in the Zhejiang province in China
The statutory auditor, KPMG Bedrijfsrevisoren – Réviseurs d’Entreprises, represented by Jos Briers, has issued an unqualified audit opinion on the consolidated financial statements and has confirmed that the accounting data included in this annual announcement do not include any apparent inconsistencies with the consolidated financial statements.. Annexes InBev website: http://www.InBev.com/media/3__2__0__pressreleases.cfm
• Full Year 2007 (FY07) segment information • Fourth Quarter 2007 (4Q07) segment information • Cash Flow – Key Figures • Reconciliation between Brazilian GAAP and IFRS figures for Latin America (FY07)

Brussels, 28 February 2008 – 14/20
Full Year 2007 Agenda February 28th, 2008 Press conference 10.30 a.m. CET Will be held at InBev’s global headquarters: Brouwerijplein 1, Leuven Conference call FY07 results for investors 2.00 p.m. CET / 1.00 p.m. BST / 8.00 a.m. EST - full registration details are available at www.InBev.com. The 2007 Financial Report, as well as the English version of the 2007 Annual Report, are available as of today at www.InBev.com. The French and Dutch versions of the Annual Report 2007 will be posted online on 28 March at www.InBev.com
About InBev
InBev is a publicly traded company (Euronext: INB) based in Leuven, Belgium. The company's origins date back to 1366, and today, it is the leading global brewer. As a true consumer-centric, sales driven company, InBev manages a carefully segmented portfolio of more than 200 brands. This includes true beer icons with global reach like Stella Artois® and Beck’s®, fast growing multicountry brands like Leffe® and Hoegaarden®, and many consumer loved "local champions" like Skol®, Quilmes®, Sibirskaya Korona®, Chernigivske®, Sedrin®, Cass® and Jupiler®. InBev employs close to 89 000 people, running operations in over 30 countries across the Americas, Europe and Asia Pacific. In 2007, InBev realized 14.4 billion euro of revenue. For further information visit www.InBev.com
Contact information Marianne Amssoms Philip Ludwig Vice President Global External Communications Vice President Investor Relations Tel: +32-16-27-67-11 Tel: +32-16-27-62-43 Fax: +32-16-50-67-11 Fax: +32-16-50-62-43 E-mail: [email protected] E-mail: [email protected] This report contains certain forward-looking statements reflecting the current views of the management of InBev with respect to, among other things, InBev’s strategic objectives, business prospects, future financial condition, budgets, projected levels of production, projected costs and projected levels of revenues and profits. These statements involve risks and uncertainties. The ability of InBev to achieve these objectives and targets is dependent on many factors which are outside of management’s control. In some cases, words such as “believe”, “intend”, “expect”, “anticipate”, “plan”, “target”, “will” and similar expressions to identify forward-looking statements are used. All statements other than statements of historical facts are forward-looking statements. You should not place undue reliance on these forward-looking statements. By their nature, forward-looking statements involve risk and uncertainty because they reflect InBev’s current expectations and assumptions as to future events and circumstances that may not prove accurate. The actual results could differ materially from those anticipated in the forward-looking statements for many reasons. InBev cannot assure you that the future results, level of activity, performance or achievements of InBev will meet the expectations reflected in the forward-looking statements.

Brussels, 28 February 2008 – 15/20
Annex 1 FY07 segment information InBev Worldwide FY06 Scope Currency
translation
Organic
growth
FY07 Organic
growth
Total volumes 246 529 11 306 0 12 777 270 611 5.2%
Revenue 13 308 262 -90 950 14 430 7.2%
Cost of sales -5 477 -114 53 -397 -5 936 -7.3%
Gross profit 7 831 148 -38 553 8 494 7.1%
Distribution expenses -1 551 -44 17 -136 -1 713 -8.8%
Sales & marketing expenses -2 115 -48 16 12 -2 134 0.6%
Administrative expenses -1 075 -20 4 102 -990 9.5%
Other operating income/expenses 133 5 5 119 263 83.0%
Normalized EBIT 3 223 42 5 650 3 920 20.4%
Normalized EBITDA 4 239 68 -9 694 4 992 16.5%
Normalized EBITDA margin 31.9% 34.6% 274 bp
North America FY06 Scope Currency
translation
Organic
growth
FY07 Organic
growth
Total volumes 14 342 -1 710 0 -60 12 572 -0.5%
Revenue 1 831 -205 -63 1 1 564 0.1%
Cost of sales -680 161 23 5 -491 1.1%
Gross profit 1 150 -43 -40 7 1 074 0.6%
Distribution expenses -270 -25 9 10 -275 3.8%
Sales & marketing expenses -311 86 9 9 -206 4.2%
Administrative expenses -104 14 3 3 -83 3.8%
Other operating income/expenses -6 3 0 6 3 167.2%
Normalized EBIT 459 35 -18 36 512 7.3%
Normalized EBITDA 551 35 -22 32 597 5.6%
Normalized EBITDA margin 30.1% 38.2% 173 bp
Latin America - North FY06 Scope Currency
translation
Organic
growth
FY07 Organic
growthTotal volumes 94 586 931 0 5 361 100 877 5.7%
Revenue 4 268 24 98 514 4 904 12.0%
Cost of sales -1 491 -14 -26 -134 -1 664 -9.0%
Gross profit 2 778 9 71 380 3 239 13.7%
Distribution expenses -500 -8 -7 -36 -551 -7.1%
Sales & marketing expenses -440 -5 -7 -38 -491 -8.7%
Administrative expenses -273 -8 -4 28 -256 10.2%
Other operating income/expenses 61 0 3 57 121 94.5%
Normalized EBIT 1 625 -11 57 391 2 062 24.1%
Normalized EBITDA 1 872 -4 60 390 2 318 20.9%
Normalized EBITDA margin 43.9% 47.3% 344 bp
Latin America - South FY06 Scope Currency
translation
Organic
growth
FY07 Organic
growth
Total volumes 22 566 5 833 0 2 125 30 524 9.7%
Revenue 733 188 -68 150 1 003 21.0%
Cost of sales -313 -84 31 -58 -425 -19.2%
Gross profit 420 104 -37 92 578 22.4%
Distribution expenses -56 -15 6 -18 -82 -33.1%
Sales & marketing expenses -89 -26 8 -11 -118 -12.2%
Administrative expenses -51 -10 3 14 -44 27.2%
Other operating income/expenses -9 -2 1 -1 -11 -14.2%
Normalized EBIT 215 51 -19 75 323 36.6%
Normalized EBITDA 280 70 -25 79 405 29.1%
Normalized EBITDA margin 38.2% 40.3% 244 bp

Brussels, 28 February 2008 – 16/20
Annex 1 FY07 segment information (continued) Western Europe FY06 Scope Currency
translation
Organic
growth
FY07 Organic
growth
Total volumes 39 147 -1 218 0 -1 861 36 068 -4.9%
Revenue 3 646 -65 -3 -123 3 455 -3.4%
Cost of sales -1 619 31 2 -30 -1 616 -1.9%
Gross profit 2 026 -34 -1 -153 1 839 -7.7%
Distribution expenses -416 6 0 6 -403 1.6%
Sales & marketing expenses -720 -3 0 55 -668 7.6%
Administrative expenses -263 2 -1 27 -235 10.2%
Other operating income/expenses -108 6 0 31 -70 31.7%
Normalized EBIT 520 -23 0 -34 462 -6.8%
Normalized EBITDA 834 -31 -1 -31 771 -3.9%
Normalized EBITDA margin 22.9% 22.3% -9 bp
Central & Eastern Europe FY06 Scope Currency
translation
Organic
growth
FY07 Organic
growth
Total volumes 43 201 0 0 5 936 49 137 13.7%
Revenue 1 820 0 -32 411 2 198 22.6%
Cost of sales -840 0 18 -190 -1 013 -22.6%
Gross profit 979 0 -15 221 1 186 22.6%
Distribution expenses -242 0 5 -56 -292 -23.0%
Sales & marketing expenses -312 0 4 -84 -392 -26.9%
Administrative expenses -140 0 1 7 -131 5.3%
Other operating income/expenses -80 0 2 10 -69 12.2%
Normalized EBIT 206 0 -3 99 302 48.2%
Normalized EBITDA 398 0 -6 128 520 32.3%
Normalized EBITDA margin 21.8% 23.6% 173 bp
Asia Pacific FY06 Scope Currency
translation
Organic
growth
FY07 Organic
growthTotal volumes 30 924 4 375 0 1 081 36 380 3.6%
Revenue 912 53 -41 70 994 8.1%
Cost of sales -467 -17 19 -29 -495 -6.8%
Gross profit 445 36 -22 41 499 9.3%
Distribution expenses -66 0 3 -5 -68 -8.1%
Sales & marketing expenses -174 -25 9 -16 -207 -9.2%
Administrative expenses -54 -7 2 -2 -61 -4.5%
Other operating income/expenses -1 -2 0 3 0 88.7%
Normalized EBIT 150 2 -8 20 163 14.2%
Normalized EBITDA 241 8 -12 27 263 11.9%
Normalized EBITDA margin 26.4% 26.5% 88 bp
Global Export & Holding Companies FY06 Scope Currency
translation
Organic
growth
FY07 Organic
growth
Total volumes 1 763 3 095 0 195 5 054 4.0%
Revenue 99 266 20 -73 312 -20.0%
Cost of sales -67 -191 -14 38 -233 14.8%
Gross profit 32 76 7 -35 80 -32.4%
Distribution expenses -1 -2 0 -38 -41 -
Sales & marketing expenses -68 -75 -7 97 -52 68.2%
Administrative expenses -191 -12 -1 25 -179 12.2%
Other operating income/expenses 276 1 -2 14 289 5.1%
Normalized EBIT 49 -12 -3 63 96 173.6%
Normalized EBITDA 63 -11 -3 69 118 129.6%

Brussels, 28 February 2008 – 17/20
Annex 2 4Q07 segment information InBev Worldwide 4Q06 Scope Currency
translation
Organic
growth
4Q07 Organic
growth
Total volumes 68 514 -33 0 3 844 72 325 5.7%
Revenue 3 590 -12 24 279 3 881 7.8%
Cost of sales -1 500 9 9 -90 -1 573 -6.1%
Gross profit 2 090 -3 32 189 2 309 9.1%
Distribution expenses -384 -12 -2 -44 -442 -11.3%
Sales & marketing expenses -541 2 2 24 -513 4.4%
Administrative expenses -304 -2 -2 57 -251 18.7%
Other operating income/expenses 33 -3 5 56 90 166.4%
Normalized EBIT 894 -18 35 281 1 193 31.9%
Normalized EBITDA 1 175 -17 32 278 1 467 23.9%
Normalized EBITDA margin 32.7% 37.8% 482 bp
North America 4Q06 Scope Currency
translation
Organic
growth
4Q07 Organic
growth
Total volumes 3 627 -510 0 42 3 159 1.4%
Revenue 452 -65 2 6 395 1.6%
Cost of sales -173 42 1 8 -122 6.9%
Gross profit 279 -23 3 14 273 5.8%
Distribution expenses -59 -8 -1 0 -68 -0.7%
Sales & marketing expenses -59 15 0 1 -43 2.4%
Administrative expenses -27 9 0 -5 -23 -28.7%
Other operating income/expenses 0 1 0 -1 0 -302.2%
Normalized EBIT 134 -6 2 9 139 7.3%
Normalized EBITDA 160 -5 2 7 163 4.6%
Normalized EBITDA margin 35.4% 41.4% 108 bp
Latin America - North 4Q06 Scope Currency
translation
Organic
growth
4Q07 Organic
growthTotal volumes 28 351 369 0 2 624 31 344 9.3%
Revenue 1 260 9 96 185 1 549 14.7%
Cost of sales -443 -5 -29 -24 -501 -5.5%
Gross profit 817 4 66 161 1 049 19.7%
Distribution expenses -132 -5 -9 -14 -159 -10.0%
Sales & marketing expenses -127 -2 -9 -5 -142 -3.6%
Administrative expenses -65 -3 -4 10 -63 15.4%
Other operating income/expenses 16 0 3 27 45 169.1%
Normalized EBIT 508 -5 48 180 730 35.6%
Normalized EBITDA 575 -3 52 175 799 30.6%
Normalized EBITDA margin 45.6% 51.6% 627 bp
Latin America - South 4Q06 Scope Currency
translation
Organic
growth
4Q07 Organic
growth
Total volumes 9 172 -247 0 907 9 832 10.2%
Revenue 297 -12 -36 73 322 25.1%
Cost of sales -121 5 16 -28 -128 -23.9%
Gross profit 176 -7 -20 45 194 25.9%
Distribution expenses -24 1 3 -7 -26 -30.2%
Sales & marketing expenses -29 1 4 -5 -30 -17.2%
Administrative expenses -21 0 1 9 -11 40.6%
Other operating income/expenses -5 0 1 -1 -5 -20.0%
Normalized EBIT 97 -5 -11 40 121 43.2%
Normalized EBITDA 122 -5 -14 39 142 32.7%
Normalized EBITDA margin 41.1% 44.1% 244 bp

Brussels, 28 February 2008 – 18/20
Annex 2 4Q07 segment information (continued) Western Europe 4Q06 Scope Currency
translation
Organic
growth
4Q07 Organic
growth
Total volumes 9 878 -426 0 -557 8 895 -5.9%
Revenue 933 -18 -15 -50 850 -5.4%
Cost of sales -435 12 10 14 -399 3.2%
Gross profit 499 -6 -5 -36 451 -7.4%
Distribution expenses -95 -2 1 4 -91 4.1%
Sales & marketing expenses -175 2 2 26 -144 15.2%
Administrative expenses -70 0 0 13 -57 18.5%
Other operating income/expenses -19 -4 1 -1 -22 -3.1%
Normalized EBIT 139 -9 0 7 137 4.9%
Normalized EBITDA 219 -12 -1 0 206 -0.2%
Normalized EBITDA margin 23.5% 24.3% 128 bp
Central & Eastern Europe 4Q06 Scope Currency
translation
Organic
growth
4Q07 Organic
growth
Total volumes 9 703 0 0 942 10 645 9.7%
Revenue 402 0 -15 90 478 22.5%
Cost of sales -195 0 8 -68 -255 -35.0%
Gross profit 207 0 -7 22 222 10.6%
Distribution expenses -59 0 2 -11 -67 -18.4%
Sales & marketing expenses -81 0 2 -12 -90 -14.4%
Administrative expenses -43 0 1 9 -32 22.2%
Other operating income/expenses -45 0 1 50 6 110.9%
Normalized EBIT -21 0 0 59 38 286.8%
Normalized EBITDA 33 0 -1 69 100 210.6%
Normalized EBITDA margin 8.1% 20.9% 1245 bp
Asia Pacific 4Q06 Scope Currency
translation
Organic
growth
4Q07 Organic
growthTotal volumes 7 371 -228 0 -17 7 126 -0.2%
Revenue 223 -13 -16 14 208 6.5%
Cost of sales -117 11 8 -8 -107 -7.6%
Gross profit 105 -2 -8 5 100 5.3%
Distribution expenses -15 0 1 -1 -15 -10.3%
Sales & marketing expenses -41 -1 3 -8 -47 -20.2%
Administrative expenses -15 0 1 -1 -14 -3.6%
Other operating income/expenses 2 -1 0 2 2 190.4%
Normalized EBIT 37 -4 -3 -3 27 -10.1%
Normalized EBITDA 63 -4 -5 -4 51 -7.1%
Normalized EBITDA margin 28.5% 24.4% -343 bp
Global Export & Holding Companies 4Q06 Scope Currency
translation
Organic
growth
4Q07 Organic
growth
Total volumes 411 1 008 0 -96 1 324 -6.8%
Revenue 23 87 8 -39 80 -35.3%
Cost of sales -16 -56 -5 17 -60 23.7%
Gross profit 7 31 3 -22 19 -57.2%
Distribution expenses 0 0 0 -15 -15 -
Sales & marketing expenses -28 -12 -2 26 -17 63.8%
Administrative expenses -62 -8 -1 21 -51 29.3%
Other operating income/expenses 84 0 -1 -20 63 -24.1%
Normalized EBIT 0 11 -1 -10 0 -90.5%
Normalized EBITDA 2 12 -1 -7 6 -51.5%

Brussels, 28 February 2008 – 19/20
Annex 3 Cash Flows – Key Figures
Million euro 2007 2006
Operating activities
Profit .................................................................................................................................... 3 048 2 126
Non cash items included in profit ............................................................................................... 2 135 2 279
Cash flow from operating activities be fore changes in working capital and provisions ........ 5 183 4 405
Change in working capital ........................................................................................................ 270 131
Use of provisions ..................................................................................................................... (363) (440)
Interest and taxes (paid)/received ............................................................................................. (1 026) (809)
Cash flow from operating activities ...................................................................................... 4 064 3 287
Investing activities
Net capex ............................................................................................................................... (1 440) (1 218)
Acquisition of subsidiaries, net of cash acquired, and purchase of minority interests ........................ (1 342) (2 271)
Other ..................................................................................................................................... 424 8
Cash flow from investing activities ....................................................................................... (2 358) (3 481)
Financing activities
Dividends paid ........................................................................................................................ (769) (617)
Purchase of treasury shares ...................................................................................................... (600) (59)
Other ..................................................................................................................................... 399 884
Cash flow from financing activities ....................................................................................... (970) 208
Net increase/(decrease) in cash and cash equivalents ........................................................ 736 14

Brussels, 28 February 2008 – 20/20
Annex 4
Reconciliation between Brazilian GAAP and IFRS figures for
Latin America FY07
EBIT Latin America under Brazilian GAAP
(Brazil + HILA, as published in the YTD Segment financial information of AmBev’s Q4 press release)
In million BRL ......................................................................................................................... 5 913
In million euro...................................................................................................................... 2 218
Reclassifications
- Profit sharing (bonus plan) presented below EBIT in Brazilian GAAP, above EBIT in IFRS................ (20)
- Other operating income/expense, presented below EBIT in Brazilian GAAP, above EBIT in IFRS ...... (74)
2 124
Adjustments
- Goodwill amortization in Brazilian GAAP, not in IFRS.................................................................. 263 - Other depreciation adjustments (fair value base, InBev rates, commercial intangibles, …) .............. 9
- Deferred charges (start up costs capitalized under Brazilian GAAP, expensed in IFRS) ................... (9)
- Indirect tax incentives (through equity in Brazilian GAAP, in income statement in IFRS)................. 7
- Pension cost recognition and share based payment expense (IFRS 2 and IAS 19 treatment)........... (7)
- Other................................................................................................................................... (2)
EBIT Latin America under IFRS
(as published in the FY07 Segment information of Latin America North and Latin America South in
annex 1 of this press release) ............................................................................................................... 2 385