continuing vocational training in eu enterprisescontinuing vocational training in eu enterprises 2...
TRANSCRIPT

Continuing vocational training in EU enterprises
Continuing vocational training in EU enterprises
Research paper
Developments and challenges ahead
This publication provides a comparative statistical analysis of skills development through continuing vocational training (CVT) in EU enterprises. It is based on data from the latest rounds of the CVTS survey (CVTS 5, 2015 and CVTS 4, 2010) covering EU-Member States, Norway and North Macedonia and reporting on progress towards key policy objectives. The analysis considers indicators on enterprise CVT provision, staff participation, time devoted to training and enterprise expenditure. These are analysed and then summarised by means of a composite index. Results are further complemented with an analysis of data concerning the reasons given by enterprises for not providing (further) training and main skill needs in companies. The report pays particular attention to training efforts of SMEs.
Developments and challenges ahead
Europe 123, ‘SERVICE POST’, 57001 Thermi, GREECETel. +30 2310490111, Fax +30 2310490020Email: [email protected]
5573 ΕΝ - TI-B
C-19-003-E
N-N
- doi:10.2801/704583
EN 1831-5860


Continuing vocational training in EU enterprises Developments and challenges ahead Luxembourg: Publications Office of the European Union, 2019

Please cite this publication as:
Cedefop (2019). Continuing vocational training in EU enterprises: developments and
challenges ahead. Luxembourg: Publications Office. Cedefop research paper; No 73.
http://data.europa.eu/doi/10.2801/704583
A great deal of additional information on the European Union is available on the internet. It can be accessed through the Europa server (http://europa.eu).
Luxembourg: Publications Office of the European Union, 2019
PDF ISBN 978-92-896-2880-8 EPUB ISBN 978-92-896-2881-5
ISSN 1831-5860 ISSN 1831-5860
doi:10.2801/704583 doi:10.2801/751575
TI-BC-19-003-EN-N TI-BC-19-003-EN-E
© European Centre for the Development of Vocational Training (Cedefop), 2019 All rights reserved.
The European Centre for the Development of Vocational Training (Cedefop) is the European Union's
reference centre for vocational education and training, skills and qualifications. We provide information, research, analyses and
evidence on vocational education and training, skills and qualifications for policy-making in the EU Member States.
Cedefop was originally established in 1975 by Council Regulation (EEC) No 337/75. This decision was repealed in
2019 by Regulation (EU) 2019/128 establishing Cedefop as a Union Agency with a renewed mandate.
Europe 123, ‘SERVICE POST’, 57001 Thermi, GREECE PO Box 22427, 551 02 Thessaloniki, GREECE
Tel. +30 2310490111, Fax +30 2310490020 Email: [email protected]
www.cedefop.europa.eu
Mara Brugia, Acting Executive Director Tatjana Babrauskiene, Chair of the Management Board


1
Foreword
Lifelong skills development benefits workers, employers and society. It is
indispensable for generating and adopting innovation successfully and meeting
new and fast-evolving skills requirements, particularly in a time of accelerating
technological change. It can help fill skills gaps, help individuals stay and
progress in employment, boost motivation and improve performance and
productivity. Stepping up skills development for adults is, therefore, central to the
European Commission’s 2016 Skills agenda and the European Union’s (EU)
strategy for smart, sustainable and inclusive growth. This is underpinned by the
Council recommendation to ensure upskilling opportunities for the low-qualified
and the European social rights pillar, which stipulates that everyone has the right
to education, training and lifelong learning (LLL) to manage labour market
transitions. The European social partners underline a need for high-quality and
effective employee training that is equally relevant for workers and employers.
As a main pillar of LLL, continuing vocational education and training (CVET)
is in the limelight. Within European cooperation on VET, in 2010 ministers set
themselves the objective to increase CVET’s contribution towards higher adult
participation in learning, reduce access inequalities and make LLL a reality
(Bruges communiqué). They committed to devising a combination of incentives,
rights and obligations to encourage companies to continue to invest in CVET.
These objectives were to be reached by 2020. The need for more, effective and
high-quality CVET is reiterated in the vision for post-2020 VET agreed by the
Commission’s Advisory Committee on Vocational Training. It considers CVET,
which contributes to successful enterprises and appropriately skilled workforce,
as a shared interest and responsibility of public authorities, employers and
employees.
Nevertheless, firms remain decisive gatekeepers of adult learning, since
participation across the EU is often non-formal, typically job-related and mostly
employer sponsored, with costs directly covered or indirectly supported by
enterprises. Monitoring developments of company CVET activities is essential to
understanding developments in LLL and adult skills, particularly those that are
labour-market-relevant. Internationally comparable statistics and indicators are a
necessary resource, as they make it possible to quantify and analyse key
patterns and progress within and across countries. The continuing vocational
training survey (CVTS), serves exactly this purpose: due to its regularity, content,
scale and quality standards, it is acknowledged as the reference data source in
this domain at European level. The most recent survey was carried out in 2016,
Continuing vocational training in EU enterprises
2
providing information for 2015 (CVTS 5) and for all EU Member States, Norway
and North Macedonia.
As in previous years, Cedefop analysed its results to offer a comparative
statistical overview of skills development through CVET in enterprises.
Comparing the results with those of the previous survey wave (CVTS 4, 2010),
the report provides key data on progress. It devotes particular attention to the
training efforts of small and medium-sized enterprises (SMEs) as progress is also
related to the ability to increase their level of training activity.
This report originates from Cedefop’s commitment and continued effort to
help increase availability, analyses and dissemination of data on VET and skills
to aid evidence-based policy-making. CVET’s crucial role in addressing multiple
challenges – an ageing workforce, globalisation, innovation, technological
change and a fast-evolving and ever more challenging labour market – requires a
clear view on progress and obstacles. Policy-makers and stakeholders call for
reliable, comparable, comprehensive, and yet clear and easily understandable
data. With this publication, which presents statistical information in a reader-
friendly way, we hope to support reflections and consequent decisions to
promote employee skills development in enterprises.
Mara Brugia Alena Zukersteinova
Acting Executive Director Acting Head of department for skills
and labour market

3
Acknowledgements
This publication was produced by Cedefop, Department for skills and labour
market, under the supervision of Alena Zukersteinova, Acting Head of
department. Marco Serafini, Cedefop expert, prepared the report for publication
and was responsible for coordinating and steering the relevant research project,
conducted under the framework contract reference
AO/DSL/MSERA/StatisticalServices/008/15 statistical services for data
monitoring, analysis and reporting in the field of VET, lifelong learning and skills.
Cedefop would like to acknowledge the Katholieke Universiteit Leuven
Research Institute for Work and Society, who conducted the analysis under
project team leader Steven Groenez. Special thanks go to Ilias Livanos, Cedefop
expert, and Sabine Gagel, Eurostat, who reviewed the publication.

4
Contents Foreword ............................................................................................................. 1
Executive summary ........................................................................................... 11
1. Introduction ................................................................................................ 20
1.1. The role of CVET in the EU context.............................................. 20
1.2. Aim, scope and structure of this study .......................................... 21
2. Data, definitions and methods .................................................................... 23
2.1. Introduction .................................................................................. 23
2.2. Defining key concepts and indicators ........................................... 24
2.2.1. Key concepts and variables .................................................... 24
2.2.2. Key indicators ......................................................................... 27
2.2.3. Other important statistics and indicators ................................. 28
2.2.4. Size and sectoral breakdowns ................................................ 29
2.2.5. Comparing countries’ performance over time ......................... 30
2.2.6. ... Comparing performance by enterprise size and sector of activity
................................................................................................................... 30
2.3. Data issues .................................................................................. 32
2.3.1. Effective sample size and response rates ............................... 32
2.3.2. Comparability across countries and over time......................... 34
3. CVET in enterprises: key indicators, breakdowns and trends ..................... 38
3.1. Incidence (enterprise provision of training) ................................... 38
3.2. Staff participation in training ......................................................... 47
3.3. Intensity (hours of training) ........................................................... 53
3.4. Enterprise training expenditure ..................................................... 61
3.4.1. Direct monetary expenditure ................................................... 63
3.4.2. Total monetary expenditure .................................................... 68
3.5. Summarising EU and national performances: radar charts and a
composite index (SMOP) ............................................................................... 71
4. Main skills needs in enterprises .................................................................. 95
4.1. Main skill needs at the EU-28 level .............................................. 96
4.2. Main skill needs in countries ...................................................... 101

Contents
5
5. Reasons for not providing (further) training ............................................... 108
5.1. Reasons for not providing training .............................................. 109
5.2. Reasons limiting enterprise provision of more training ............... 114
6. Conclusions and outlook .......................................................................... 124
Abbreviations and acronyms ........................................................................... 131
References ...................................................................................................... 132
Further reading ................................................................................................ 135
Web links ........................................................................................................ 137
ANNEX 1. CVTS 5 data quality ....................................................................... 138
A.1.1 Geographic coverage ............................................................. 138
A.1.2 Sampling design ..................................................................... 139
A.1.3 Characteristics of the data collection ...................................... 142
A.1.4 Deviation in concepts or definitions......................................... 143
ANNEX 2. Complementary tables and figures ................................................. 147
A.2.1 Relative participation rates ..................................................... 147
A.2.2 Types of training in EU enterprises ......................................... 150
A.2.3 Inequalities by enterprise size class ........................................ 153
A.2.4 Inequalities by economic sector of activities ........................... 159
Continuing vocational training in EU enterprises
6
Tables and figures
Tables
1. CVTS, grouping of enterprise sizes for statistical reporting ....................... 30
2. CVTS, grouping of economic sectors of activity in five clusters for
statistical reporting .................................................................................... 30
3. Changes in performance gap between small and large enterprises in
CVTS 5 compared to CVTS 4 (example) ................................................... 31
4. Net sample size and target population of the CVTS 5 survey .................... 33
5. Main changes in 2015 compared to 2010 .................................................. 35
6. Training incidence, % of enterprises providing any type of CVT
training (courses or other forms), CVTS 3, CVTS 4 and CVTS 5 ............... 40
7. Components of enterprise expenditure on CVT courses: elements
reported within the CVTS framework ......................................................... 63
8. Key CVT indicators, CVTS 5 (2015) versus CVTS 4 (2010) ...................... 73
9. Key CVT indicators, standardised results relative to the 2015 best
performing countries, 2015 and 2010 ........................................................ 74
10. Incidence, participation, intensity, expenditure and overall
performance (SMOP index) in 2015 and 2010........................................... 78
11. Main skills considered important in the near future: 2015, % of
enterprises quoting each option .............................................................. 102
12. Main skills targeted in CVT courses, 2015, % of training enterprises
quoting each option ................................................................................. 106
13. Enterprises with and without training activity by size class, 2015, (%) ..... 108
14. Most frequently mentioned reasons for not providing CVT (non-
training enterprises) 2015 and 2010 ........................................................ 113
15. Reasons for not providing CVT, CVTS 5 and CVTS 4 (% non-training
enterprises quoting each option) ............................................................. 115
16. Most frequently mentioned reasons for not providing more training
(training enterprises) 2015 and 2010 ....................................................... 119
17. Reasons for not providing more CVT, 2015 and 2010, % of training
enterprises quoting each option .............................................................. 121
18. EU-28 results for incidence, participation, intensity and expenditure in
2015 and 2010 ........................................................................................ 126
19. Enterprise size class and key CVT indicators .......................................... 126
20. EU-28 results for incidence, participation, intensity and expenditure
by enterprise size class in 2015, 2010 ..................................................... 127
Contents
7
Figures
1. Unit non-response rates in CVTS 5 (%) .................................................... 34
2. Training incidence, % of enterprises providing any type of CVT
training (courses or other forms), 2015 vs 2010 ........................................ 39
3. Training incidence, % of enterprises providing any type of CVT
training (courses or other forms) by size class, 2015 ................................. 41
4. Training incidence: enterprises providing any type of CVT training
(courses or other forms) by size class – 2015 and 2010 – 10 to 49
persons employed ..................................................................................... 44
5. Training incidence: enterprises providing any type of CVT training
(courses or other forms) by size class – 2015 and 2010 – 50 to 249
persons employed ..................................................................................... 45
6. Training incidence: enterprises providing any type of CVT training
(courses or other forms) by size class – 2015 and 2010 – 250+
persons employed ..................................................................................... 46
7. Training incidence, % of enterprises providing any type CVT training
by economic sector of activity, 2015 .......................................................... 46
8. Training participation rate, participants in CVT courses as % of
persons employed (all enterprises), 2015 and 2010 .................................. 47
9. Training participation rate, participants in CVT courses as % of
persons employed by enterprise size class (all enterprises), 2015 and
2010 – 10 to 49 persons employed ........................................................... 49
10. Training participation rate, participants in CVT courses as % of
persons employed by enterprise size class (all enterprises), 2015 and
2010 – 50 to 249 persons employed ......................................................... 50
11. Training participation rate, participants in CVT courses as % of
persons employed by enterprise size class (all enterprises), 2015 and
2010 – 250 or more persons employed ..................................................... 51
12. Training participation rate, participants in CVT courses as % of
persons employed by enterprise size class (all enterprises), 2015 ............ 51
13. Training participation rate, participants in CVT courses as % of
persons employed by economic sector of activity (all enterprises),
2015 .......................................................................................................... 53
14. Hours spent on CVT courses per 1 000 hours worked (all
enterprises), 2015 and 2010...................................................................... 55
15. Hours spent in CVT courses per 1 000 hours worked by enterprise
size class (all enterprises), 2015 ............................................................... 56
16. Hours spent in CVT courses per 1 000 hours worked by enterprise
size class (all enterprises), 2015 and 2010: small enterprises ................... 58
17. Hours spent in CVT courses per 1 000 hours worked by enterprise
size class (all enterprises), 2015 and 2010: medium-sized enterprises ..... 59
18. Hours spent in CVT courses per 1 000 hours worked by enterprise
size class (all enterprises), 2015 and 2010: large enterprises ................... 60
Continuing vocational training in EU enterprises
8
19. Hours spent in CVT courses per 1 000 hours worked by economic
sector of activity (all enterprises), 2015 ..................................................... 61
20. Enterprise direct monetary expenditure on CVT courses as % of total
labour cost (all enterprises), 2015 and 2010 .............................................. 64
21. Enterprise direct monetary expenditure on CVT courses as % of total
labour cost by size class (all enterprises), 2015 ........................................ 65
22. Enterprise direct monetary expenditure on CVT courses as % of total
labour cost by economic sector of activity (all enterprises), 2015 .............. 67
23. Enterprise total monetary expenditure on CVT courses as % of total
labour cost (all enterprises), 2015 and 2010 .............................................. 69
24. Enterprise total monetary expenditure on CVT courses as % of total
labour cost by size class (all enterprises), 2015 ........................................ 70
25. Overall performance on CVT, SMOP index, 2015 and 2010...................... 76
26. Performance of key CVT indicators, EU-28 ............................................... 79
27. Performance of key CVT indicators, Austria .............................................. 80
28. Performance of key CVT indicators, Belgium ............................................ 80
29. Performance of key CVT indicators, Bulgaria ............................................ 81
30. Performance of key CVT indicators, Croatia .............................................. 81
31. Performance of key CVT indicators, Cyprus .............................................. 82
32. Performance of key CVT indicators, Czechia ............................................ 82
33. Performance of key CVT indicators, Denmark ........................................... 83
34. Performance of key CVT indicators, Estonia ............................................. 83
35. Performance of key CVT indicators, Finland ............................................. 84
36. Performance of key CVT indicators, France .............................................. 84
37. Performance of key CVT indicators, Germany .......................................... 85
38. Performance of key CVT indicators, Greece ............................................. 85
39. Performance of key CVT indicators, Hungary ............................................ 86
40. Performance of key CVT indicators, Ireland .............................................. 86
41. Performance of key CVT indicators, Italy................................................... 87
42. Performance of key CVT indicators, Latvia ................................................ 87
43. Performance of key CVT indicators, Lithuania ........................................... 88
44. Performance of key CVT indicators, Luxembourg ..................................... 88
45. Performance of key CVT indicators, Malta ................................................ 89
46. Performance of key CVT indicators, Netherlands ...................................... 89
47. Performance of key CVT indicators, North Macedonia .............................. 90
48. Performance of key CVT indicators, Norway ............................................. 90
49. Performance of key CVT indicators, Poland .............................................. 91
50. Performance of key CVT indicators, Portugal ............................................ 91
51. Performance of key CVT indicators, Romania ........................................... 92
52. Performance of key CVT indicators, Slovakia ............................................ 92
53. Performance of key CVT indicators, Slovenia ........................................... 93
54. Performance of key CVT indicators, Spain ................................................ 93
55. Performance of key CVT indicators, Sweden ............................................ 94
56. Performance of key CVT indicators, United Kingdom ................................ 94
Contents
9
57. Main skills considered important in the near future, EU-28 average,
2015, % of enterprises quoting each option ............................................... 97
58. Main skills targeted in CVT courses, EU-28 average, 2015, % of
training enterprises quoting each option .................................................... 98
59. Main skills considered important in the near future by enterprise size
class, EU-28 average, 2015, % of enterprises quoting each option ........... 99
60. Main skills targeted in CVT courses by enterprise size class, EU-28
average, 2015, % of training enterprises quoting any option ................... 100
61. Reasons for not providing CVT by enterprise size class, EU-28, 2015,
% of non-training enterprises quoting each option ................................... 110
62. Reasons for not providing CVT, EU-28, 2015 and 2010, % of non-
training enterprises quoting each option .................................................. 111
63. Reasons for not providing CVT by enterprise size class, EU-28, 2015
and 2010, % of non-training enterprises quoting each option .................. 112
64. Reasons for not providing more CVT by enterprise size class, EU-28,
2015, % training enterprises quoting each option .................................... 117
65. Reasons for not providing more CVT, EU-28, 2015 and 2010, % of
training enterprises quoting each option .................................................. 118
66. Reasons for not providing more CVT by enterprise size class, EU-28,
2015 and 2010, % of training enterprises quoting each option ................ 119
Tables in Annex 1 and 2
A 1. Country coverage in the CVTS rounds 1-5 .............................................. 138
A 2. Grouping of economic activities for CVTS sample stratification
(NACE) ................................................................................................... 139
A 3. Grouping of enterprise sizes for CVTS samples stratification .................. 140
A 4. Sampling frame shortcomings ................................................................. 141
A 5. Administrative data used in CVTS 5 on key CVT indicators..................... 143
A 6. Deviations in variable implementation .................................................... 144
A 7. Deviations from questionnaire ................................................................. 145
A 8. Participation in CVT courses, participation rate and relative
participation rate of persons employed by enterprise size class (all
enterprises), CVTS 5 ............................................................................... 147
A 9. Participation in CVT courses, participation rate and relative
participation rate of persons employed by enterprise size class (all
enterprises), CVTS 4 ............................................................................... 150
A 10. Percentage of enterprises providing any other form of CVT, by form
of training, CVTS 5 and CVTS 4 .............................................................. 151
A 11. Training incidence, percentage of enterprises providing any type of
CVT training (courses or other forms) by size class, 2015 and 2010 ....... 153
A 12. Training participation rate, % of persons employed participating in
CVT courses by enterprise size class (all enterprises), 2015 and 2010 ... 154

Continuing vocational training in EU enterprises
10
A 13. Hours spent in CVT courses per 1 000 hours worked by enterprise
size class (all enterprises), 2015 and 2010 .............................................. 155
A 14. Direct enterprise monetary expenditure on CVT courses as % of total
labour cost by size class (all enterprises), 2015 and 2010 ....................... 156
A 15 Total enterprise monetary expenditure on CVT courses as % of total
labour cost by size class (all enterprises), 2015 and 2010 ....................... 157
A 16. Training incidence, % of enterprises providing any type of CVT
training (courses or other forms) by economic sector of activity, 2015 ..... 159
A 17. Training participation rate, % of persons employed participating in
CVT courses by enterprise economic sector of activity (all
enterprises), 2015 ................................................................................... 160
A 18. Hours spent in CVT courses per 1 000 hours worked by enterprise
economic sector of activity (all enterprises), 2015 and 2010.................... 161
A 19. Direct enterprise monetary expenditure on CVT courses as % of total
labour cost by economic sector of activity (all enterprises), 2015 ............ 162
11
Executive summary
Aim, content and methods of the report
This report provides a comparative statistical analysis of skills development
through continuing vocational training in EU enterprises (CVT). Data originate
from the continuing vocational training survey (CVTS) and are subject to its
methodology. The report focuses on information from the latest round of the
survey (CVTS 5, 2015) across EU-Member States, Norway and the Republic of
North Macedonia and compares its results with those from the previous survey
wave (CVTS 4, 2010). The report provides information on the developments of
employer-sponsored CVT in Europe and on its progresses and contributions to
key policy objectives: promoting CVET, enhancing its contribution to expanding
adult learning, raising participation, reducing access inequalities and barriers,
stimulating financial contributions by all stakeholders, encouraging companies to
continue investing in training, and providing the right skills for the labour market.
The study uses key CVTS data to investigate several factors: whether
employer-sponsored CVT provision in the EU has increased, and if so, to what
extent and along which dimensions; the reasons why provision did not expand
further; whether inequalities based on firm size have been reduced; which skills
have been trained and which skills employers deem important for the future
(main skills needs).
The report uses CVTS as a unique privileged source of statistical information
on the subject. Due to its regularity, content, methods, scale and quality
standards, CVTS is acknowledged as the reference statistical source in this
domain at European level. The survey is coordinated by Eurostat. It covers
enterprises with 10 or more persons employed operating across the majority of
the private business economy. Activities of public administration are excluded as
well as enterprises operating in the sectors of agriculture forestry, fishing,
education, health and social work. The analysis uses aggregated data published
in Eurostat’s online database, retrieved in the period between February and April
2018.
Methods and limitations
To investigate developments in employer-sponsored CVT provision, the report
considers four main dimensions of analysis: enterprise CVT provision
(incidence), staff participation, time for training (intensity) and enterprise training

Continuing vocational training in EU enterprises
12
expenditure. Data on main indicators are analysed and then summarised by
means of a composite summary index. Results are further complemented with
findings concerning the reasons indicated by enterprises for not providing
(further) training, main skills needs (main skills considered important for the
development of enterprises in the next few years) and main skills targeted by
employer-sponsored CVT courses. The report devotes particular attention to the
training efforts of small and medium-sized enterprises (SMEs) as progress
towards the stated policy goals is also related to the ability to increase the level of
training activity.
To report on the four key dimensions of analysis, the following performance
indicators have been privileged for comparative purposes:
(a) incidence: enterprises providing any type of CVT as % of all enterprises
surveyed;
(b) participation: participants in CVT courses as % of employed persons in all
enterprises surveyed;
(c) intensity: number of hours spent in CVT courses per 1 000 hours worked by
persons employed in all enterprises surveyed;
(d) expenditure: enterprises’ total monetary expenditure on CVT courses (direct
costs plus contributions minus receipts) as % of total labour costs of all
enterprises surveyed.
For each indicator, the report considers both developments over time and
inequalities based on enterprise size class; the latter been analysed by means of
absolute and relative differences of the indicator values (gaps) between large and
small enterprises. Large enterprises are defined as those with 250 or more
persons employed; small enterprises are defined as those with 10 to 49 persons
employed.
The four indicators mentioned above have also been brought together to
derive a composite index SMOP, which stands for surface measure of overall
performance. The composite index is a quantitative summary measure of
employer-sponsored CVT provision at system level. It condenses in one metric
the different dimensions of incidence, participation, intensity and expenditure. It
has been calculated at EU and country levels for 2010 and 2015. It can be
considered as a synthetic measure of the overall performance of a system in the
provision of employer-sponsored CVT, according to the underlying dimensions
considered. It has been mainly used to assess changes in performance over
time.
Background data quality assessment has shown CVTS data to be of good
quality. In most instances, key performance CVT indicators on incidence,
participation, intensity and expenditure could be reliably compared over time and

Executive summary
13
across countries. Methodological changes affected the variables on main skills
needs and their comparability over time. Comparisons over time have been
carried to the best possible extent, based on patterns emerging from the data
rather than on actual comparisons of values. An appropriate sectoral analysis
has not been possible. To comply with statistical reliability and confidentiality
thresholds, results by economic sector of activity had to be produced with a high
level of aggregation, largely insufficient for analytical purposes. Sectoral analysis
is given less prominence in the report though available sectoral breakdowns are
displayed.
Has employer-sponsored CVT provision increased in
the EU and to what extent?
Based on the dynamics of the composite index (SMOP), it has been possible to
assess synthetically whether employer-sponsored CVT provision has increased
in the EU, and to what extent, considering multiple dimension of analysis
(incidence, participation, intensity and expenditure). The dynamics of the
composite index indicate moderate but favourable increases. An increase in
overall performance in employer-sponsored CVT provision by more than 10% is
observed for 15 countries and as the EU average: Bulgaria, Croatia, Denmark,
Estonia, Greece, Italy, Latvia, Lithuania, Luxembourg, Netherlands, Norway,
Poland, Slovenia, Spain and the UK. Positive progresses concerned most of the
countries which had particularly low scores in 2010 (Bulgaria, Greece, Croatia,
Latvia, Lithuania and Poland), even though their rankings on the composite index
are still comparatively low. For six countries the composite index did not change
more than 10% between 2010 and 2015, so that their CVT provision can be
considered remaining fairly stable either at high levels (Belgium and France) or at
medium levels (Germany, Malta, Austria and Slovakia). Only in four countries did
overall performance fall by more than 10% between 2010 and 2015: Hungary,
Portugal and Finland (with falls of 11% to 13%) and Cyprus (21%).
In which areas has employer-sponsored CVT provision
increased in the EU and how much?
All four key performance indicators considered show signs of moderate but
favourable progress. For the EU-28, training incidence (the share of enterprises
providing training) reached 73% in 2015, showing a positive increase of seven
percentage points or 10.5% over the 2010 baseline. Training participation and

Continuing vocational training in EU enterprises
14
training intensity (hours spent in training) grew less quickly, respectively by 3.2
percentage points (or 8.5% of the 2010 baseline value) and 0.4 hours per 1 000
hours worked (or 7% compared to 2010). In 2015, 40.8% of those employed
participated in CVT courses and an average of 6.2 hours was dedicated to
course training out of 1 000 hours worked. Total monetary expenditure for CVT
courses was fairly stable (at 0.9% of total labour cost in 2015) and the relative
increase by 12.5% is largely due to a small base effect. The progress for the EU
a whole reflects different patterns at country level. However, for most countries
and dimensions of analysis, changes were favourable (with indicators rising more
than 10% compared to the 2010 baselines) or relatively stable (with positive or
negative changes no larger than 10%).
Have inequalities based on firm size been reduced?
The report shows that the training gap between large and small enterprises
narrowed over 2010-15. For the EU-28 average this occurred on all four
indicators, both in terms of absolute and relative performance gaps. As measured
by the relative performance gap between large and small enterprises, inequities
in training incidence fell from 50% in 2010 to 38% in 2015; inequities in training
participation fell from 84% to 59%; inequities in training intensity fell from 100% to
68%; and inequities in training expenditure fell from 43% to 25%. Training gaps
by enterprise size class also reduced in most countries. In relative terms,
inequalities in training incidence between large and small and enterprises fell in
21 countries; inequalities in participation rates fell in 16 countries; and
inequalities in training intensity and total monetary expenditure fell in 14
countries. Considerable differences across enterprise size persist, with large
enterprises typically outperforming those of medium size and even more those of
small size: in 2015 in the EU, almost all large enterprises (95.3%) provided
training to their staff but only 69.3% of small enterprises did so. In large
enterprises, staff participation in CVT courses (47.7%) continued to be
considerably higher than in small enterprises (30%) as well as the corresponding
time devoted to training (7.4 hours per 1 000 hours worked as opposed to 4.4).
There are smaller differences in total monetary expenditure on CVT courses, at
1.0% of total labour cost in large enterprise as opposed to 0.8% in small ones.

Executive summary
15
What factors have hampered further expansion of
employer-sponsored CVT?
The report also analyses the reasons indicated by EU enterprises for not
providing (further) training in 2015. CVTS 5 asked enterprises which did not
provide training to their staff in the reference year (2015) to indicate one or more
of the underlying reasons. A large majority of enterprises who did not provide
training to their staff (82%) indicated no need for it (in the sense that they
perceived available skills as matching their current needs). Even among large
enterprises a clear majority (69%) stated that available qualifications, skills and
competences match current needs: this emerged as the main reason for not
providing training. Another frequent motivation indicated by employers for not
providing training was the adoption of a different skills development strategy:
55% of non-training enterprises in the EU privileged the recruitment of new staff
with the required skills to fulfil company needs rather than training their current
workforce. Larger non-training enterprises more often adopted this strategy
(71%) compared to medium (62%) and small enterprises (54%). One out of four
non-training enterprises stressed the importance of IVT as an alternative to CVT,
with no or small variation by size class (and corresponding values being much
higher in Denmark, Germany and Poland). Reasons which can be more properly
considered as obstacles to training were less frequently indicated, but they still
played an important role. One third of non-training enterprises pointed to a high
workload and a lack of time for staff to participate; a slightly smaller share (28%)
pointed to high costs of CVT courses. Obstacles such as the lack of suitable offer
or difficulties in assessing skills needs appear less important, being indicated by
only 13% and 16% of non-training enterprises. Other reasons, including major
training efforts in previous years, accounted for relatively smaller percentages. A
similar pattern emerges from the analysis of the reasons not to provide further
training. In CVTS 5 enterprises which provided training to their staff in the
reference year (2015) were asked to indicate one or more than one of the
reasons which hampered further provision to their workforce. In the EU, 52% of
them indicated no need for further training, in the sense that they considered the
level of trained provided as appropriate. This was more often the case for small
enterprises (53%) than for medium (47%) and large enterprises (43%)
Preference for a skills development strategy different from training was also
frequently indicated: 50% of training enterprises in the EU indicated that they
preferred to recruit new staff with the required skills rather than providing more
training to their workforce. Specific obstacles such as time and cost also limited
further expansion of training, respectively in 44% and 34% of training enterprises
in the EU, with small variations by size. Other obstacles and other factors were

Continuing vocational training in EU enterprises
16
indicated in smaller proportions. EU average patterns as described here largely
hold at country level. Overall, 2015 data indicate that EU enterprises, when
asked about the reasons for not providing (further) training, most frequently
report that they do not see a need for it (in the sense that they perceive available
skills matching their current needs) or that they use different skills development
strategies (different from training) to cope with skills needs. To a smaller, still
considerable, extent, they include the presence of obstacles to training, Time
and/or costs remain the major ones, being indicated by at least a third of EU
enterprises as factors preventing or limiting training provision. 2015 findings
confirm aspects which have been repeatedly established in previous CVTS-
surveys for 2005 and 2010.
Which skills have been taught and which do employers
deem most important for the future?
In 2015, enterprises were asked to indicate the main three skills which they
considered important for their development in the near future. In the EU as a
whole, technical, practical or job-specific skills ranked first, being indicated as
important by 46% of all surveyed enterprises. Customer handling and team
working skills also emerged, both being considered important by 41% of
enterprises in the EU. These three skill bundles (technical, practical or job-
specific skills, customer handling skills, and team working skills) clearly emerged
as the most frequently indicated ones also in almost all countries. Other skills
bundles were indicated in considerable, yet smaller, proportions by enterprises:
problem-solving skills (26% in the EU as a whole), management skills (25%) and
general IT skills (21%). Management skills in Finland, North Macedonia and
Spain, and problem-solving skills in Hungary emerged as particularly important
for enterprise development (as they counted among the three most frequently
indicated skills bundles in these countries). Skills bundles such as foreign
languages, office administration and professional IT scored values between 11%
and 14% in the EU. Numeracy/literacy skills and oral/written communication skills
were least frequently indicated as being of primary importance for enterprise
development (respectively by 6% and 8% of surveyed enterprises in the EU). The
importance of technical, practical or job-specific skills for enterprise development
is quite often combined with priority provision of related training courses. When
training enterprises were asked to indicate the three main skills bundles which
they targeted in their CVT course provision (based on hours of training), they
most frequently indicated technical practical and job-specific skills (65% of
training enterprises on average). This skills bundle was the most frequently

Executive summary
17
indicated in every single country (although with varying shares). After technical,
practical or job-specific skills, customer handling skills were generally prioritised
as a subject of employer-sponsored CVT courses (26% of training enterprises in
the EU); in almost all countries, they appear as one of the three most frequently
indicated skills bundles. Management skills emerge in the top three skill bundles
targeted by employer-sponsored CVT courses in 11 countries, with team working
skills in five countries. Very small shares of enterprises in the EU prioritised the
provision of CVT courses targeting skills in oral/written communication (3%) and
numeracy/literacy skills (1%). Although to different degrees, this also holds at
country level. Main skill needs did not differ considerably across enterprise size
classes for the EU-28. Only for management skills large do differences between
size classes exist, and the importance of management skills for future enterprise
development rises with enterprise size. This also holds for skills primarily
targeted by CVT courses. All these data cannot be properly compared to those of
the previous 2010 survey wave, due to methodological changes: employers were
asked to indicate all the skills bundles they deemed important for enterprise
development and all the skills bundles targeted in their CVT course provision, not
just the three main ones. However, comparisons could be possible based on
main data patterns as identified by the rank order of skills bundles. In the EU as a
whole, the rank order of skills deemed important and the rank order of skills
targeted by enterprises’ CVT courses was quite similar in 2015 and 2010. Based
on the CVTS methodological framework, technical practical and job related skills
are confirmed as the top priority for employers both for provision of CVT to their
staff and for enterprise development. Oral/written communication skills and
literacy and/or numeracy skills are part of their lowest priorities.
Policy implications
Despite progress achieved, data show that training gaps persist among EU
enterprises in the provision of employer-sponsored CVT; these gaps are across
countries and enterprise size classes, with training levels comparatively lower in
small and medium firms. Results also indicate that EU enterprises, when asked
about the reasons for not providing (further) training, most frequently indicate that
they do not see a current need for it in the sense that they consider available
skills matching their needs or the level of training provided appropriate. To a
smaller, but still considerable, extent, they include the presence of obstacles to
training. Based on the data, the most important obstacles continue to be time
and/or costs, which play, as in the past, an important role in limiting further
expansion of training.

Continuing vocational training in EU enterprises
18
This suggests the need for EU countries to continue and further develop the
course of actions provided for and already undertaken within the EU policy
context. This should include:
(a) actively encouraging individuals to participate, and VET-providers to
increase their involvement in CVET;
(b) establishing an appropriate framework with the right mixes of incentives,
rights and obligations aimed at encouraging companies to continue to invest
in human resources development and in CVET;
(c) encouraging flexible training arrangements (such as e-learning, evening
courses, training during working hours) and all types of learning; this should
also include in-company training and work-based learning, in order to
promote access to training in different life situations and to adapt to different
needs;
(d) encouraging training institutions and employers to collaborate, particularly to
encourage the creation of ‘knowledge partnerships’, between enterprises,
VET providers, design centres, the cultural sector and higher education
institutions; there should be an aim to promote the virtuous circle of
innovation and training, helping enterprises, particularly small and medium
ones, to gain valuable insight into new developments and competence
needs and to develop professional excellence and innovation;
(e) encouraging further cooperation between VET policy and other relevant
policy areas, such as employment, economic affairs, research and
innovation.
There is still scope for policies to act in the following directions:
(a) raising enterprises’ awareness of the importance of updating or enlarging
their skills and competences (particularly explaining and demonstrating the
ways in which training is beneficial for employers and employees);
(b) removing obstacles and barriers to training (particularly those related to time
and cost for training) and raising awareness of existing available policy
instruments dedicated to this end.
It is crucial to change the perceptions of decision-makers within enterprises
and turn enterprises into more active or more training-supportive organisations,
which is in turn crucial to expanding provision and the take-up of adult education
and training towards higher levels. In reinforcing such efforts, particular attention
should be paid to further developing training in small and medium enterprises.
Training should be promoted not only as one of the possible adequate reactions
to short-term skills needs but also as a proactive choice for continuous skills
development, as an investment in a broader and longer-term perspective for the
employability of individuals and the competitiveness of companies and countries.
Executive summary
19
Competitiveness and innovation go hand-in-hand and innovation does not
necessarily occur at the frontier of technological development: it is possible and
desirable in many different senses and in many different contexts, particularly in
small and medium-sized enterprises operating in more traditional sectors. This
can take the form of marketing and sales innovation, customer care, quality
improvements and/or an enhanced specialisation/customisation/diversification of
goods and services. The virtuous circle of training and innovation to be ideally
promoted is one where training does not only support and follow changes and
innovation; it also precedes and stimulates them, including, and particularly, in
small and medium-sized enterprises. Raising awareness of these aspects will
help in seeing training increasingly as an active choice and a long-term
investment to be pursued more continuously. Increased availability of flexible
training arrangements, establishment and fine-tuning of frameworks with the right
mixture of incentives, rights and obligations, as well as an increased knowledge
and promotion of them, will help remove obstacles related to cost and time.
Data confirm the great importance attributed by employers to technical,
practical and job-specific skills for the development of their enterprises in the
near future and for choosing the subject of the training they provide. They confirm
the importance of continuing vocational training as an important component of
adult learning, essential for upgrading and updating the professional skills of the
EU work force, in a way which complements and goes beyond skills development
through initial education and training. However, in line with previous survey
waves, data confirm that employers do not consider oral and written
communication skills and numeracy and literacy skills as a top priority: neither for
enterprise development in the short term nor for choosing the subject of training
they provide to their staff. This does not necessarily mean that they are not
interested in those skills: it simply confirms that priority development of adult
skills in these domains should be supported by means of public policies and that
the Upskilling Pathways Commission initiative is well-grounded. It also suggests
that, when it comes to the basic literacy, numeracy or communication skills of
staff, the implementation of such policies should carefully consider the
importance of engaging, supporting stimulating and complementing employers’
efforts in this direction. Employers are decisive gatekeepers of training who may
not necessarily assume these skills as one of their top priorities.
20
CHAPTER 1. Introduction
1.1. The role of CVET in the EU context
Continuing vocational education and training (CVET) can be considered as
education and training after initial education and training (or after entry into
working life). It is undertaken for job-related purposes, to obtain knowledge
and/or learn new skills for a current or future job, increase earnings, improve job
and/or career opportunities in a current or another field and generally improve
opportunities for advancement and promotion. CVET is therefore distinguished
from continuing education and training which is undertaken for personal, social,
recreational, community or domestic purposes. In this sense CVET can be
considered the part of adult education and training which is more directly relevant
for the labour market. It can be financed, in various combinations, by enterprises,
public authorities and learners.
In the context of the Europe 2020 strategy (Council of the EU, 2009;
European Commission, 2012b and 2014a), CVET is a central component of
lifelong learning (LLL) and employment policies in the EU. The Agenda for new
skills and jobs flagship initiative (European Commission, 2010a) aims to provide
people with the right skills for employment throughout their working lives: LLL and
CVET are key elements of this. The 2010 Bruges communiqué (European
Commission, 2011) and a range of major EU policy documents – including the
2011 Council resolution on a renewed European agenda for adult learning
(Council of the EU, 2011) and the 2012 communication Rethinking education
from the Commission (European Commission, 2012a) – have acknowledged
CVET’s potential to raise participation in adult education and training and to meet
the challenges posed by intensifying globalised competition, technological
change, an ageing and shrinking workforce. The Bruges communiqué invites
Member States to maximise the contribution of CVET to raising participation in
adult education and training towards the 15% target, as defined in the Europe
2020 Education and training strategy (Council of the EU, 2009).
CVET is also key in the EU employment policy context, as it is highlighted in
the Employment guidelines (Council of the European Union, 2018) and
particularly in guideline 6 on enhancing labour supply and improving access to
employment, skills and competences. Member States are called on to increase
adult participation in continuing education and training, to ensure that labour
market relevant skills are provided throughout people’s careers and to upgrade

CHAPTER 1. Introduction
21
and increase the supply and take-up of flexible CVET, working together with the
social partners, education and training providers, enterprises and other
stakeholders. CVET is identified as a way to improve participation of adults in
LLL, reinforce their employability and increase employment in Europe.
Improving CVET and adult learning is crucial for an economy based on
knowledge and innovation. More specifically, enterprises’ investment in
continuing vocational training (CVT) of their staff, designed to promote human
capital resources, is a key driver of economic performance, competitiveness and
productivity in Europe; it reflects the role of enterprises in resolving labour market
imperfections and employment imbalances. As such, CVT facilitates the
adaptation of workforces to changing patterns of production and work
organisation and it also stimulates further innovation in workplaces.
Enterprises are decisive gatekeepers to LLL and previous research
(Cedefop, 2015) has confirmed that, across Europe, adult education and training
is mostly non-formal, mostly job-related and mostly employer sponsored (directly
or indirectly financially supported by the employer), showing that CVT can be
considered as the main component of adult education and training.
Monitoring developments of CVT in enterprises has become essential for
many reasons and this is why EU Member States are invited to participate in, and
implement key messages from, the CVTS (Council of the EU, 2011).
1.2. Aim, scope and structure of this study
In a context of persistent strong policy demand for comparable data on the topic,
this report provides a statistical overview of skills development through continuing
vocational training in enterprises across the EU Member States as well as North
Macedonia and Norway, based on the fifth round of the CVTS (CVTS 5, 2015). It
also considers previous waves of the CVTS survey, particularly CVTS 4, to
analyse developments over time and to report on progress towards key policy
objectives.
The study selects and analyses CVTS data to report on progress made
towards EU policy goals in CVET, which include promoting CVET, increasing the
contribution of CVET to expanding adult learning participation, reducing access
inequalities and barriers, stimulating financial contributions by stakeholders,
encouraging companies to continue investing in training and providing the right
skills for the labour market.
Key data from CVTS are examined: whether employer-sponsored CVT
provision of enterprises in the EU have increased, and, if so, to what extent and
along which dimensions; reasons why they did not expand further; whether

Continuing vocational training in EU enterprises
22
inequalities based on firm size have been reduced; which skills have been
trained and which skills employers deem important for the future. Readers will
find relevant and comparable statistical evidence at EU and country level, which
could stimulate further research, policy learning and policy action.
CVTS offers a wealth of integrated and internationally comparable data on
continuing vocational training in enterprises from the employers’ perspective. The
data complement the benchmark indicator on participation in adult education and
training derived from the EU labour force survey (LFS) (Cedefop, 2015),
specifically focusing on the job-related and employer-sponsored component and
enriching the availability of relevant statistical information with many other
elements beyond simple participation rates. These elements include enterprises’
provision of training, their expenditure on training, the time devoted to it, barriers
to training, and information on skills, offering a more comprehensive picture of
CVT and its developments over time.
Chapter 2 discusses the data source, the definitions and the methods used
in this report. The chapter describes the CVTS methodological framework and
defines its key concepts, variables and indicators. The chapter also presents key
results of a background data quality assessment to help reading and interpreting
the data presented in the report, with a particular view to their comparability
across countries and over time. Annex 1 provides more detailed information on
CVTS data quality.
Chapter 3 analyses selected indicators on important dimensions of CVT:
enterprises’ training provision (incidence), staff participation, paid working time
devoted to it (intensity) and enterprises’ training expenditure. The analysis of
them is complemented with the derivation of a composite index, calculated to
derive summary and synthetic indications on enterprises training performance
across these dimensions. Results are presented at country level and over time.
Annex 2 provides additional complementary tables, figures and analysis.
Chapter 4 analyses skills needs from the employer perspective, focusing on
the main skills enterprises consider important for their development in the near
future and the main skills targeted in enterprise training activities.
Chapter 5 focuses on the reasons that enterprises report for not providing
(further) training to their staff.
Chapter 6 summarises key findings of the analysis.
23
CHAPTER 2. Data, definitions and methods
2.1. Introduction
The data used in this report originate from the fifth (and previous) round(s) of the
CVTS and are subject to its methodology.
CVTS is the reference source for statistical information on continuing
vocational training in enterprises in EU countries. It provides internationally
comparable data and it is the only integrated source for collecting data on CVT
costs and hours of training, as well as on staff participation and related enterprise
strategies.
CVTS is a large enterprise survey. It is implemented in all EU countries by
national statistical authorities under the coordination of Eurostat. European
Commission implementing regulations specify data collection standards of single
survey waves (European Commission, 2005, 2010b and 2014b). CVTS uses
large samples stratified by enterprise size class and economic sector of activity;
these are typically drawn at national level from official business
registers/databases, which are considered the gold standard for business
surveys. The CVTS covers enterprises 10 or more persons employed, operating
in most, but not all, economic sectors of activity as classified in the statistical
classification of economic activities in the European Community (NACE). The
following NACE sectors are excluded: agriculture, forestry and fishing (A), public
administration (O), education (P), health and social work (Q), activities of
households (T) and extra-territorial organisations and bodies (U).
The reference period of CVTS is the calendar year. This means that data
refer to training activities occurred in a given calendar year (2015 for CVTS 5,
2010 for CVTS 4). Participating countries use the same reference period but the
fieldwork period may differ across countries. Data for the analysis carried out in
this report were extracted between February and April 2018 from the Eurostat
database. These are estimates based on CVTS national samples and should be
interpreted as such.

Continuing vocational training in EU enterprises
24
The next sections provide key background methodological information on
the survey and its results. Additional information is made available by
Eurostat (1).
2.2. Defining key concepts and indicators
2.2.1. Key concepts and variables
This section presents definitions of key CVTS concepts and variables used to
derive the indicators in this report.
The concept of CVT is defined in the implementation manual of CVTS 5
(Eurostat, 2016), as the set of training measures or activities which have, as their
primary objectives, the acquisition of new competences or the development and
improvement of existing ones, and which must be sponsored at least partly by
the enterprises for their persons employed. Finance can be direct or indirect.
Indirect financing could include the use of paid work-time for the training activity
as well as the financing of training equipment. The training measures or activities
must be planned in advance and must be organised or supported with the special
goal of learning. Random learning and initial vocational training (IVT) are
explicitly excluded.
In CVTS, persons employed are those who work for the enterprise surveyed;
this includes those who either have a working contract with it or who benefit
directly from their work for the enterprise, such as unpaid family workers and
casual workers. Persons employed do not include those working at the enterprise
but with a salary paid by another company. Those holding an apprenticeship or a
training contract are not considered as persons employed and are not considered
as receiving CVT: the definition of persons employed in CVTS deviates from the
one used for structural business statistics in its treatment of persons employed
holding an apprenticeship or training contract (Eurostat, 2016).
According to CVTS methodology, the following forms of CVT are covered:
(a) CVT courses;
(b) other forms of training.
(1) This includes:
(a) reference online metadata:
https://ec.europa.eu/eurostat/cache/metadata/en/trng_cvt_esms.htm
(b) implementation manuals and their annexes (Eurostat 2012 and 2016), national
quality reports documenting the implementation of the survey and the data quality at
national level), as well as Eurostat’s own quality assessment of CVTS 4 (Eurostat,
2015): https://ec.europa.eu/eurostat/web/education-and-training/quality

CHAPTER 2. Data, definitions and methods
25
‘CVT courses are typically clearly separated from the active workplace
(learning takes place in locations specially assigned for learning, like a classroom
or a training centre). They show a high degree of organisation (in time, space and
content) by a trainer or a training institution. The content is designed for a group
of learners (e.g. a curriculum exists)’. They can be managed by the enterprise
itself, if internal, or by third-party organisations, if external (Eurostat, 2016, p. 25).
‘Other forms of CVT are typically connected to the active work and the active
workplace, but they can also include participation (instruction) in conferences,
trade fairs etc. for the purpose of learning. These other forms of CVT are often
characterised by a degree of self-organisation (time, space and content) by the
individual learner or by a group of learners. The content is often tailored
according to the learners’ individual needs in the workplace’ (Eurostat, 2016,
p. 25). The following types of other forms of CVT are identified:
(a) planned training through guided on-the-job training: ‘it is characterised by
planned periods of training, instruction or practical experience in the
workplace using the normal tools of work, either at the immediate place of
work or in the work situation’ (Eurostat, 2016, p. 27);
(b) planned training through job rotation, exchanges, secondments or study
visits: ‘job rotation within the enterprise and exchanges with other
enterprises are other forms of CVT only if these measures are planned in
advance with the primary intention of developing the skills of the workers
involved. Transfers of workers from one job to another which are not part of
a planned developmental programme should be excluded’ (Eurostat, 2016,
p. 27);
(c) planned training through participation (instruction received) in conferences,
workshops, trade fairs and lectures: ‘participation (instruction received) in
conferences, workshops, trade fairs and lectures are considered as training
actions, only when they are planned in advance and if the primary intention
of a person employed for participating is training/learning’ (Eurostat, 2016,
p. 27);
(d) planned training through participation in learning or quality circles: ‘learning
circles are groups of persons employed who come together on a regular
basis with the primary aim of learning more about the requirements of the
work organisation, work procedures and workplaces. Quality circles are
working groups, having the objective of solving production and workplace-
based problems, through discussion. They are counted as other forms of
CVT only if the primary aim of the persons employed who participate is
learning’ (Eurostat, 2016, p. 27);

Continuing vocational training in EU enterprises
26
(e) planned training by self-directed learning (e.g. self-directed e-learning): self-
directed learning occurs ‘when an individual engages in a planned learning
initiative where he or she manages the settings of the learning
initiative/activity in terms of time schedule and location. Self-directed
learning means planned individual learning activities using one or more
learning media. Learning can take place in private, public or job-related
settings. Self-directed learning might be arranged using open and distance
learning methods, video/audio tapes, correspondence, computer based
methods (including internet, e-learning) or by means of a learning resources
centre. It has to be part of a planned initiative. Simply surfing the internet in
an unstructured way should be excluded. Self-directed learning in
connection with CVT courses should not be included here’ (Eurostat, 2016,
p. 27).
According to CVTS methodology, training enterprises are defined as
enterprises that provided CVT courses or other forms of CVT for their persons
employed during the reference year.
A participant in CVT courses ‘is a person who has taken part in one or more
CVT courses during the reference year. Each person should be counted only
once, irrespective of the number of CVT courses he or she has participated in.
For example, if a person employed has participated in two externally managed
courses and one internally managed course, he or she should be counted as one
participant’ (Eurostat, 2016, p. 28).
The costs of CVT courses for enterprises cover direct costs, participants’
labour costs and the balance of contributions to and receipts from training funds
(net contribution). Direct courses costs include:
(a) fees and payments for CVT courses;
(b) travel and subsistence payments related to CVT courses;
(c) the labour costs of internal trainers for CVT courses (direct and indirect
costs);
(d) the costs for training centres, training rooms and teaching materials.
Participants’ labour costs (personal absence costs) refer to the labour costs
of participants for CVT courses that take place during paid working time
(Eurostat, 2016).
The net contribution to training funds is made up of the cost of contributions
made by the enterprise to collective funding arrangements through government
and intermediary organisations minus receipts from collective funding
arrangements, subsidies and financial assistance from government and other
sources. These net contributions are not always shown in the online tables
(Eurostat, 2016, p. 29).

CHAPTER 2. Data, definitions and methods
27
The total monetary expenditure comprises direct costs and the net balance
of contributions to, and receipts from, training funds, representing a more refined
measure of investment in CVT courses by enterprises.
Time spent on CVT courses refers to paid working time (in hours) spent on
the courses, i.e. the time that all participants have spent in total during the
reference year. This ‘should only cover the actual training time, and only the time
spent during the paid working time’ (Eurostat, 2016, p. 28).
CVTS contains some variables on IVT, which are not dealt with in this report
and which are not included in the concept of CVT as defined for the survey. The
concept of IVT within enterprises is defined as formal education programmes (or
a component of them) where working time alternates between periods of practical
training (workplace) and general/theoretical education (educational
institution/training centre). The definition of IVT differs between CVTS waves. ‘In
CVTS 5, initial vocational training (IVT) is restricted to apprenticeships at
International standard classification of education (ISCED) 2011 level 2 to 5. The
following criteria need to apply:
(a) the apprenticeship must be a formal education programme (or a component
of it). Within the programme learning time alternates between periods of
practical training (workplace) and general/theoretical education (educational
institution/training centre);
(b) the completion of the apprenticeship is mandatory to obtain a qualification or
certification for this programme;
(c) the duration of the apprenticeship is from six months to six years. The
duration refers to the programme and not only to the work-based
component;
(d) the apprentices receive remuneration (wage or allowance, in cash or in
kind)’. (Eurostat, 2016, p. 24).
Therefore, the concepts of CVT and IVT, as well as the workers who can
potentially benefit from them, are differentiated in CVTS.
2.2.2. Key indicators
This report analyses countries performance on four key dimensions: CVT
provision by enterprises (incidence), staff participation, time for training (intensity)
and enterprise expenditure on training. As these dimensions are not necessarily
dependent, they need to be considered both separately and jointly to derive a
clear and comprehensive picture of CVT in firms. For instance, a situation of a
comparatively high participation in training may not necessarily combine with high
levels of training time (if participation occurs mainly in very short, daily, courses).
The following indicators are considered in the report:
Continuing vocational training in EU enterprises
28
(a) training incidence: enterprises providing any type of CVT as % of all
enterprises surveyed;
(b) training participation: participants in CVT courses as % of persons employed
in all enterprises surveyed;
(c) training Intensity: number of hours of CVT courses per 1 000 hours worked
by employed persons in all enterprises surveyed;
(d) training expenditure: direct monetary expenditure on CVT courses as % of
total labour costs of all enterprises surveyed, and total monetary expenditure
on CVT courses as % of total labour costs of all enterprises surveyed.
The indicators on incidence, participation, intensity and expenditure are
analysed using a separated granular approach. They are also brought together to
derive a composite summary index. In the derivation of the index, the dimension
of training expenditure is addressed by considering only the total monetary
expenditure on CVT courses.
The selection of the indicators, including those used for the calculation of the
composite index (SMOP), is driven by previous methodological work (Behringer
et al., 2008), still considered relevant and valuable.
The indicator on incidence refers to CVTS courses and other forms of
training. The indicators targeting participation, intensity and expenditure only
refer to training in the form of CVT courses, since CVTS does not collect more
complete data along these dimensions. Although far from ideal, this is not
considered a major limitation and it can even increase the accuracy of the data
as reported by employers; CVT courses remain the most frequent form of training
in enterprises with greatest participation. For employers, quantification of training
participants, training time and training expenditure is often seen as easier and
more accurate if limited to CVT courses only.
The indicators on incidence, participation, intensity, and expenditure are
calculated considering all enterprises surveyed in the denominator (training and
non-training enterprises).
2.2.3. Other important statistics and indicators
CVTS information on enterprise training behaviour is complemented with the
reasons enterprises report for not providing any training (as declared by non-
training enterprises) and reasons for not providing more training (as declared by
training enterprises). Lists of non-mutually exclusive reasons were provided to
the respondents. CVTS also offers important data on skills needs from the
employers’ perspective. Variables cover the main skills considered important by
enterprises for their development in the near future (as indicated by all surveyed
enterprises) and main skills targeted in CVT courses (as indicated by training

CHAPTER 2. Data, definitions and methods
29
enterprises with CVT courses). A common list of skills bundles was provided to
the respondents. In the report, the following statistics are considered:
(a) reasons for non-provision of (further) training:
(i) reasons for not providing training, (% of non-training enterprises
indicating a specific option within a list of items);
(ii) reasons for not providing more training, (% of training enterprises
indicating a specific option within a list of item);
(b) main skill needs:
(i) main skill considered important by enterprises for their development in
the near future (% of all enterprises indicating a specific option within a
list of items);
(ii) main skills targeted in employer-sponsored CVT courses (% of training
enterprises indicating a specific option within a list of a items).
Enterprises were asked to indicate the three most important skills bundles
for their development in the near future from a closed list of items. Therefore, %
values are percentages of enterprises quoting each option as one of the three
most important skills bundles. Similarly, training enterprises were asked to
indicate the three most important skills bundles targeted in their CVT courses
(based on hours of training sponsored) from a closed list of items. Therefore, %
values are percentages of enterprises quoting each option as one of the three
most important skills bundles.
2.2.4. Size and sectoral breakdowns
This report uses two key breakdowns for analysis of the results: the enterprises’
economic sector of activity, based on the Nomenclature statistique des activités
économiques dans la Communauté européenne (NACE) and their size class (in
number of persons employed). Analytical breakdowns reflect the survey
coverage and comply with the Eurostat recommended approach to safeguard the
principles of reliability, comparability and confidentiality of the estimates
presented. Table 1 and Table 2 present the key breakdowns used in the report.
It is acknowledged that the breakdown by economic sector of activity
provides aggregated results for categories which are too few in number and
present a high level of internal heterogeneity. With such a small level of detail,
the breakdown remains largely insufficient for analytical purposes, so it is given
less prominence in the report. Sectoral categories (i.e. clusters) used in this
report are detailed in Table 2 (their very short description is used in the text of the
report for ease of writing). More detailed information on the NACE divisions
considered in the survey coverage and in the breakdowns of its results is
provided in Annex 1 (Table A 2).

Continuing vocational training in EU enterprises
30
Table 1. CVTS, grouping of enterprise sizes for statistical reporting
Enterprises size class (label) Enterprise size class (description)
Small From 10 to 49 persons employed
Medium From 50 to 249 persons employed
Large 250 persons employed and more
Source: Eurostat database.
Table 2. CVTS, grouping of economic sectors of activity in five clusters for statistical reporting
NACE cluster
(label)
NACE cluster (short description) NACE cluster (very short
description)
B-E industry (except construction) industry
F construction construction
G-I wholesale and retail trade, accommodation and food activities, transport and storage
trade, accommodation/food and transport/storage
J-K information and communication, financial and insurance activities
information, communication and finance/insurance
L-N_R-S real estate activities, professional, scientific and technical activities, administrative and support service activities, arts, entertainment and recreation, other service activities
other technical and recreational services
Source: Eurostat database; Cedefop.
2.2.5. Comparing countries’ performance over time
To compare country performance over time, the report analyses data from
CVTS 4 and CVTS 5, considering key indicators. 2010 data from CVTS 4 are
used as baseline values under the current EU policy cycle. Absolute differences
between CVTS 5 and CVTS 4 indicators values are considered as a measure of
change. They are expressed in the specific unit of measure of the indicator
considered. They are often combined with the analysis of relative changes, which
instead consider the absolute difference as a starting point and further express it
as a percentage of the 2010 baseline value. For instance, for the EU-28 average,
training incidence was at 65.7% in 2010 and has reached 72.6% in 2015,
showing an increase of 6.9 percentage points (absolute difference) or of 10.5%
(relative difference) over the 2010 baseline. Relative differences are often used in
the charts to cluster countries’ progresses on the four key dimensions of interest:
countries with a relative difference of plus or minus 10% are labelled as having
relatively stable results over time. Increases or decreases by more than 10% are
also highlighted.
2.2.6. Comparing performance by enterprise size and sector of activity
A key issue for this report is how performance differences by company size can
be compared across countries and over time. To answer this question, the report
focuses on the performance gap between small and large enterprises and uses
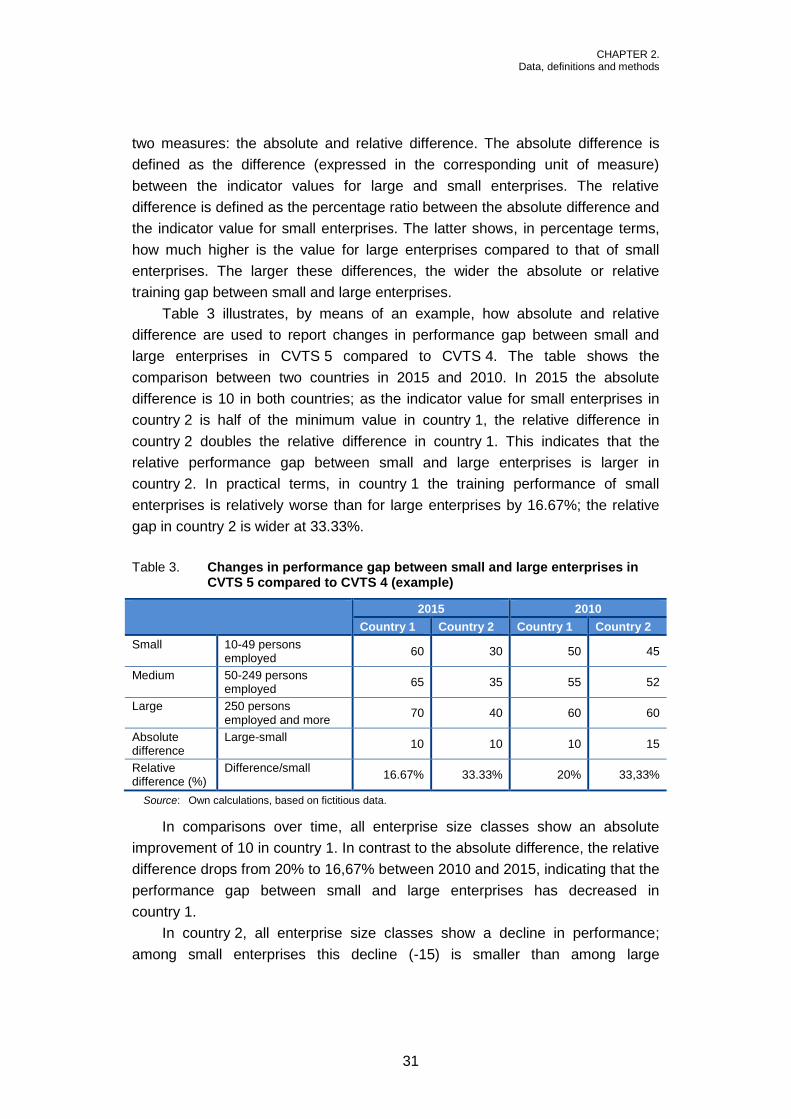
CHAPTER 2. Data, definitions and methods
31
two measures: the absolute and relative difference. The absolute difference is
defined as the difference (expressed in the corresponding unit of measure)
between the indicator values for large and small enterprises. The relative
difference is defined as the percentage ratio between the absolute difference and
the indicator value for small enterprises. The latter shows, in percentage terms,
how much higher is the value for large enterprises compared to that of small
enterprises. The larger these differences, the wider the absolute or relative
training gap between small and large enterprises.
Table 3 illustrates, by means of an example, how absolute and relative
difference are used to report changes in performance gap between small and
large enterprises in CVTS 5 compared to CVTS 4. The table shows the
comparison between two countries in 2015 and 2010. In 2015 the absolute
difference is 10 in both countries; as the indicator value for small enterprises in
country 2 is half of the minimum value in country 1, the relative difference in
country 2 doubles the relative difference in country 1. This indicates that the
relative performance gap between small and large enterprises is larger in
country 2. In practical terms, in country 1 the training performance of small
enterprises is relatively worse than for large enterprises by 16.67%; the relative
gap in country 2 is wider at 33.33%.
Table 3. Changes in performance gap between small and large enterprises in CVTS 5 compared to CVTS 4 (example)
2015 2010
Country 1 Country 2 Country 1 Country 2
Small 10-49 persons employed
60 30 50 45
Medium 50-249 persons employed
65 35 55 52
Large 250 persons employed and more
70 40 60 60
Absolute difference
Large-small 10 10 10 15
Relative difference (%)
Difference/small 16.67% 33.33% 20% 33,33%
Source: Own calculations, based on fictitious data.
In comparisons over time, all enterprise size classes show an absolute
improvement of 10 in country 1. In contrast to the absolute difference, the relative
difference drops from 20% to 16,67% between 2010 and 2015, indicating that the
performance gap between small and large enterprises has decreased in
country 1.
In country 2, all enterprise size classes show a decline in performance;
among small enterprises this decline (-15) is smaller than among large
Continuing vocational training in EU enterprises
32
enterprises (-20). While the absolute difference falls from 15 to 10, the relative
difference remains the same at 33%, indicating that the performance gap
between small and large enterprises has decreased in absolute value, while the
relative distance between the performance of small and large enterprises has
remained the same. The results of this type of analysis are reported in the text of
Chapter 3. Supporting tables are presented in Annex 2.3.
To assess the inequities across economic sectors, a slightly different
approach is followed to analyse patterns of sectoral inequalities across countries.
These are more fragmented than those by enterprise size class. In each country
the difference between the indicator value for the best performing sector (the
maximum value across sectors) minus the indicator value for the worst
performing sector (the minimum value across sectors) is calculated (range). Then
the range is expressed relative to the minimum value. The results of this type of
analysis are reported in the text of Chapter 3. Supporting tables are presented in
Annex 2.4. The approach is reflected in the formula: Range = max – min:
Relative range (%) = range / min.
2.3. Data issues
This section provides important information to help reading and interpreting the
data presented in this report, with a particular view to their comparability across
countries and over time. It presents key results of a quality assessment of
CVTS 5. Other minor deviations with minor or negligible impact on comparability
are reported in Annex 1. The assessment is based on an analysis of its
methodological developments over time, implementation at national level of
commonly agreed survey standards, and the impact of possible changes and
deviations on the comparability of the statistical results across countries and over
time. It is largely based the survey implementation manuals and the national
quality reports.
2.3.1. Effective sample size and response rates
In CVTS, the net sample size (the actual number of responding enterprises)
varies across countries but it is quite large in all of them, representing a good
precondition to have survey results of good quality. In CVTS 5, Italy and Poland
have the largest net sample size with respectively 18 130 and 14 380
enterprises. Luxembourg and Malta have the smallest net sample size with 876
and 972 enterprises (Table 4).
In CVTS 5, unit non-response rates ranges from 1.1% in Lithuania to 75.8%
in Germany. Figure 1 shows these non-response rates are influenced by the
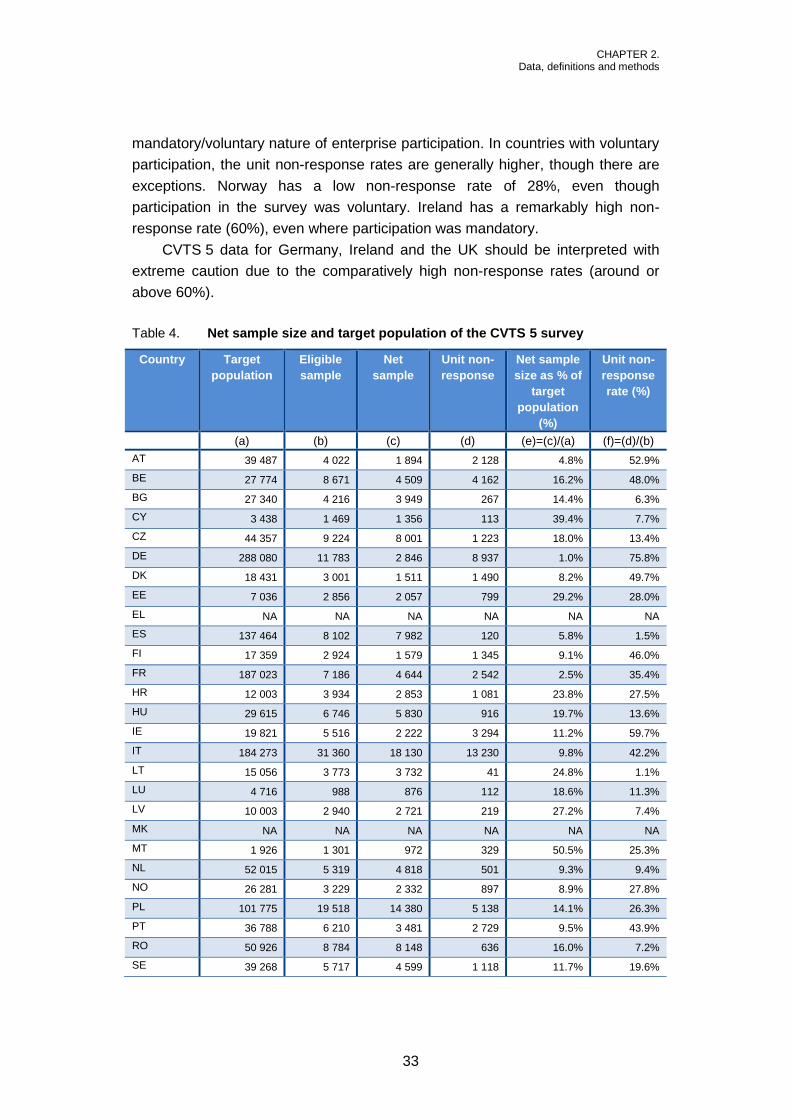
CHAPTER 2. Data, definitions and methods
33
mandatory/voluntary nature of enterprise participation. In countries with voluntary
participation, the unit non-response rates are generally higher, though there are
exceptions. Norway has a low non-response rate of 28%, even though
participation in the survey was voluntary. Ireland has a remarkably high non-
response rate (60%), even where participation was mandatory.
CVTS 5 data for Germany, Ireland and the UK should be interpreted with
extreme caution due to the comparatively high non-response rates (around or
above 60%).
Table 4. Net sample size and target population of the CVTS 5 survey
Country Target
population
Eligible
sample
Net
sample
Unit non-
response
Net sample
size as % of
target
population
(%)
Unit non-
response
rate (%)
(a) (b) (c) (d) (e)=(c)/(a) (f)=(d)/(b)
AT 39 487 4 022 1 894 2 128 4.8% 52.9%
BE 27 774 8 671 4 509 4 162 16.2% 48.0%
BG 27 340 4 216 3 949 267 14.4% 6.3%
CY 3 438 1 469 1 356 113 39.4% 7.7%
CZ 44 357 9 224 8 001 1 223 18.0% 13.4%
DE 288 080 11 783 2 846 8 937 1.0% 75.8%
DK 18 431 3 001 1 511 1 490 8.2% 49.7%
EE 7 036 2 856 2 057 799 29.2% 28.0%
EL NA NA NA NA NA NA
ES 137 464 8 102 7 982 120 5.8% 1.5%
FI 17 359 2 924 1 579 1 345 9.1% 46.0%
FR 187 023 7 186 4 644 2 542 2.5% 35.4%
HR 12 003 3 934 2 853 1 081 23.8% 27.5%
HU 29 615 6 746 5 830 916 19.7% 13.6%
IE 19 821 5 516 2 222 3 294 11.2% 59.7%
IT 184 273 31 360 18 130 13 230 9.8% 42.2%
LT 15 056 3 773 3 732 41 24.8% 1.1%
LU 4 716 988 876 112 18.6% 11.3%
LV 10 003 2 940 2 721 219 27.2% 7.4%
MK NA NA NA NA NA NA
MT 1 926 1 301 972 329 50.5% 25.3%
NL 52 015 5 319 4 818 501 9.3% 9.4%
NO 26 281 3 229 2 332 897 8.9% 27.8%
PL 101 775 19 518 14 380 5 138 14.1% 26.3%
PT 36 788 6 210 3 481 2 729 9.5% 43.9%
RO 50 926 8 784 8 148 636 16.0% 7.2%
SE 39 268 5 717 4 599 1 118 11.7% 19.6%

Continuing vocational training in EU enterprises
34
Country Target
population
Eligible
sample
Net
sample
Unit non-
response
Net sample
size as % of
target
population
(%)
Unit non-
response
rate (%)
(a) (b) (c) (d) (e)=(c)/(a) (f)=(d)/(b)
SI 7 433 2 069 1 692 377 22.8% 18.2%
SK 14 068 2 274 2 179 95 15.5% 4.2%
UK 219 150 13 085 3 315 9 770 1.5% 74.7%
Source: Own calculations based on CVTS 5 national quality reports.
Figure 1. Unit non-response rates in CVTS 5 (%)
NB: Enterprise participation in the survey was mandatory in Czechia and Malta, with exceptions
possible. In Sweden, participation was mandatory for 49 variables and voluntary for others.
Source: Own calculations based on CVTS 5 national quality reports.
2.3.2. Comparability across countries and over time
This section gives special attention to changes between the two latest survey
waves (CVTS 5 and CVTS 4) and across countries. As the EU framework of
CVTS had matured already in course of the earlier waves, changes in methods
(including the questionnaire) between CVTS 4 and CVTS 5 have been few.
Modifications have been made with a view to improving the overall quality of
CVTS and are not considered to have a serious impact on the comparability of
CVTS 5 and CVTS 4.
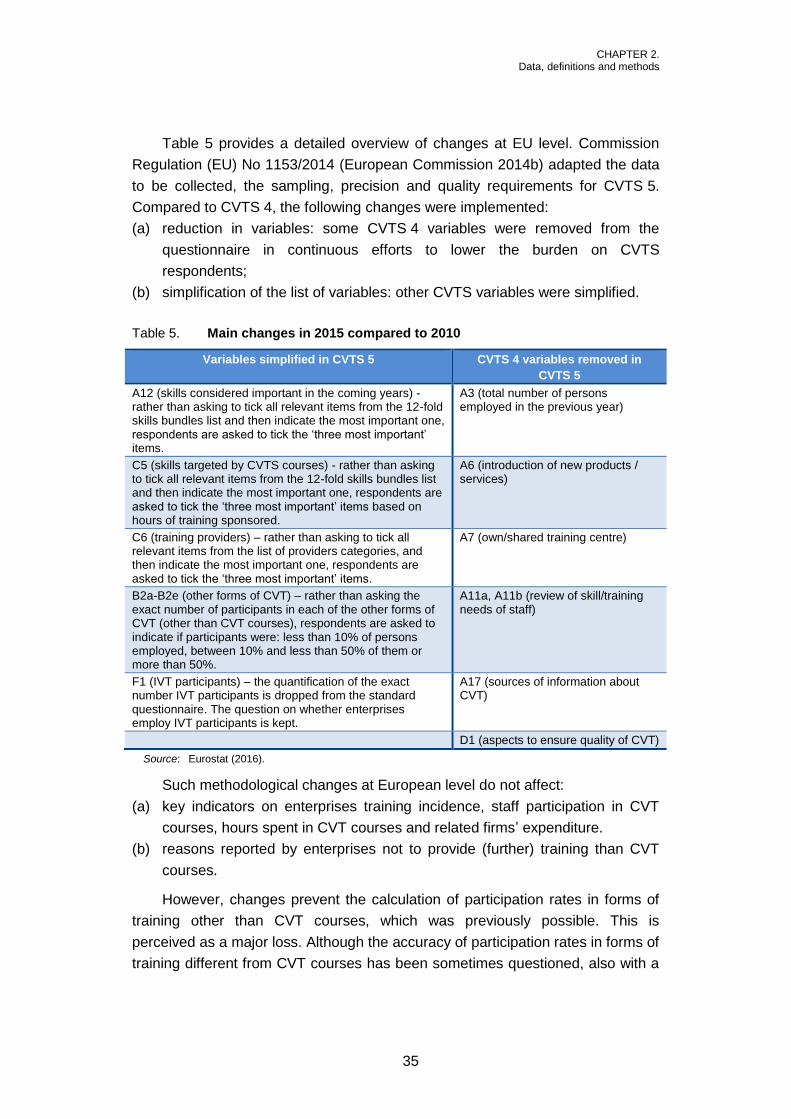
CHAPTER 2. Data, definitions and methods
35
Table 5 provides a detailed overview of changes at EU level. Commission
Regulation (EU) No 1153/2014 (European Commission 2014b) adapted the data
to be collected, the sampling, precision and quality requirements for CVTS 5.
Compared to CVTS 4, the following changes were implemented:
(a) reduction in variables: some CVTS 4 variables were removed from the
questionnaire in continuous efforts to lower the burden on CVTS
respondents;
(b) simplification of the list of variables: other CVTS variables were simplified.
Table 5. Main changes in 2015 compared to 2010
Variables simplified in CVTS 5 CVTS 4 variables removed in
CVTS 5
A12 (skills considered important in the coming years) - rather than asking to tick all relevant items from the 12-fold skills bundles list and then indicate the most important one, respondents are asked to tick the ‘three most important’ items.
A3 (total number of persons employed in the previous year)
C5 (skills targeted by CVTS courses) - rather than asking to tick all relevant items from the 12-fold skills bundles list and then indicate the most important one, respondents are asked to tick the ‘three most important’ items based on hours of training sponsored.
A6 (introduction of new products / services)
C6 (training providers) – rather than asking to tick all relevant items from the list of providers categories, and then indicate the most important one, respondents are asked to tick the ‘three most important’ items.
A7 (own/shared training centre)
B2a-B2e (other forms of CVT) – rather than asking the exact number of participants in each of the other forms of CVT (other than CVT courses), respondents are asked to indicate if participants were: less than 10% of persons employed, between 10% and less than 50% of them or more than 50%.
A11a, A11b (review of skill/training needs of staff)
F1 (IVT participants) – the quantification of the exact number IVT participants is dropped from the standard questionnaire. The question on whether enterprises employ IVT participants is kept.
A17 (sources of information about CVT)
D1 (aspects to ensure quality of CVT)
Source: Eurostat (2016).
Such methodological changes at European level do not affect:
(a) key indicators on enterprises training incidence, staff participation in CVT
courses, hours spent in CVT courses and related firms’ expenditure.
(b) reasons reported by enterprises not to provide (further) training than CVT
courses.
However, changes prevent the calculation of participation rates in forms of
training other than CVT courses, which was previously possible. This is
perceived as a major loss. Although the accuracy of participation rates in forms of
training different from CVT courses has been sometimes questioned, also with a

Continuing vocational training in EU enterprises
36
view to the respondent burden they imply, there is no doubt that they represent
important indicators, particularly at a time where the policy context stresses the
importance of increasing the flexibility of training arrangements to raise
participation in CVET and LLL. Changes also affected the variables on skills
needs: their informative power has been diminished and their comparability over
time has been hampered.
As far as implementation at national level is concerned, data points for two
countries have been identified and assessed as affected by comparability issues
and are consequently flagged in this report. These are Czechia and Sweden.
In Sweden, employer provision of information covering many variables,
including key quantitative ones, was made mandatory in CVTS 5. This implied a
strong push for employers to provide relevant information, particularly
considering that in previous survey waves all questions were answered on a
voluntary basis. As a result, the overall response rate increased from 34% in
CVTS 4 to 80% in CVTS 5. Large enterprises have responded to the survey to a
much greater extent than for CVTS 4 (85% in CVTS 5 compared to 24% in
CVTS 4). The non-response bias in the survey has, therefore, decreased to a
considerable extent. While this is a major improvement, comparability over time
between CVTS 5 and CVTS 4 is judged to be low for Sweden.
Some changes were made in Czechia in implementing CVTS 5 to improve
the quality of the national questionnaire, including the understanding of its
concepts and definitions. The order of questions was changed in the 2015
questionnaire and some concepts/questions were split into multiple questions.
Full comparability over time of key data on incidence, participation, intensity and
expenditure is hampered by the new way companies were asked about providing
CVT courses. Geographic comparability is also limited as regards to CVT costs:
in CVTS 5, Czech companies were asked to report on the total amount of money
spent on any training (of any kind, not only courses). As a consequence, 2015
CVTS data for Czechia on enterprise expenditure in CVT are not comparable
with those for other countries and are not comparable with those from previous
CVTS rounds.
Data for Portugal on the dimensions of training participation and training time
are of a peculiar kind. Starting from CVTS 4, Portugal has been obtaining the
information on participants in CVT courses and on paid working hours devoted to
training from a newly established national register, where enterprises are obliged
to record information on their training activities. This approach is allowed by
CVTS methodological framework and it is likely to be even more accurate than
that of asking relevant information directly from employers at the moment of the
survey, in that it minimises non-response biases. However, without necessarily

CHAPTER 2. Data, definitions and methods
37
undermining comparability, this is a considerable difference from other countries
and should be considered when interpreting geographic comparisons which
involve data for Portugal on training participation and training time. This reflects
authors’ own assessment, considering the relationships between modes of data
collection, level and pattern of non-responses and final estimates.

38
CHAPTER 3. CVET in enterprises: key indicators, breakdowns and trends
3.1. Incidence (enterprise provision of training)
This section discusses the level of training incidence in EU enterprises. The
indicator considered is the number of enterprises providing any type of CVT as a
percentage of all enterprises surveyed.
For the EU-28, training incidence reached 73% in 2015, showing a moderate
increase of seven percentage points or 10.5% over the 2010 baseline. Training
incidence in 2015 varies between 22% in Greece and 99% in Latvia. Figure 2
illustrates the cross country differences, plotting the incidence rates of both
CVTS 5 (2015) and CVTS 4 (2010). Countries are ordered according to the
evolution of training incidence between 2010 and 2015. We characterise the
evolution as stable if the change in training incidence is less than 10% of the
2010 baseline value. Moderate increases or falls are indicated by changes
between 10% and 20%. Strong increases or falls are indicated when training
incidence shares change by more than 20%.
For 13 countries the incidence of training did not change more than 10%
between 2010 and 2015. For six countries (Spain, Lithuania, Malta, Portugal,
Romania and Finland), as well as the EU average, an increase in training
incidence between 10% and 20% is reported. For five other countries (Bulgaria,
Estonia, Latvia, Poland and Slovenia), training incidence rose more than 20%. In
Greece and Hungary training incidence between 2010 and 2015 fell by
respectively 22% and 10%. North Macedonia and Ireland could not report any
development over time as they did not participate in CVTS 4.
Given the magnitude of the increase, the evolution of training incidence in
Latvia (40.4% in 2010 to 99.9% in 2015) is remarkable. According to the Latvian
country report the increase is genuine and due to the fact that practically all
enterprises report having sponsored guided-on-the-job training in 2015. Table 6
provides a comparison between 2005 (CVTS 3), 2010 (CVTS 4) and 2015
(CVTS 5).
The strong increase in training activity in Portugal between 2005 and 2010
reflects the introduction of a 35-hour training obligation for employers in 2009
(Naumann et al., 2009).

CHAPTER 3. CVET in enterprises: key indicators, breakdowns and trends
39
Figure 2. Training incidence, % of enterprises providing any type of CVT training (courses or other forms), 2015 and 2010
(1) No participation in CVTS 4.
(2) Break in time series between CVTS 4 and CVTS 5.
Source: Eurostat, CVTS, dissemination database (accessed 6.2.2018); own calculations.
The evolution of training incidence between CVTS 3 and CVTS 4 in Italy
(+73%), Spain (+59%), Romania (-40%) and Poland (-35%) was large as the
magnitude of change largely exceeded the general trend. In Italy and Spain
strong favourable increases in training incidence as compared to CVTS 3 are
further confirmed by CVTS 5 findings. They combine with changes to the
respective institutional framework:
(a) for Spain, the introduction of a new generous cofunding schemes for
employer provided training in 2009 (Arasanz Diaz, 2009);
(b) for Italy, the continuing expansion of State-funded and collectively funded
sectoral training funds after 2005 (Giaccone, 2009).
In Romania, training incidence as reported for CVTS 5 is much lower than it
was in CVTS 3 but better than in CVTS 4. The context is a step-by-step
implementation of (legally enforced) sectoral agreements on company-provided
training (Chivu, 2009).
In the case of Poland, the evolution of training incidence between CVTS 3
and CVTS 5 is quite volatile: in 2005 was it was 34.8%, then dropped to 22.5% in
2010, to rise again to 44.7% in 2015.

Continuing vocational training in EU enterprises
40
Table 6. Training incidence, % of enterprises providing any type of CVT training (courses or other forms), CVTS 3, CVTS 4 and CVTS 5
Training incidence % Difference (%
points)
Relative difference
(%)
2005 2010 2015 2015-10 2015-05 2015-10 2015-05
EU-28 59.7 65.7 72.6 6.9 12.9 10.5% 21.6%
AT 81.1 86.9 88.1 1.2 7.0 1.4% 8.6%
BE 62.5 77.6 83.9 6.3 21.4 8.1% 34.2%
BG 28.7 31.2 42.2 11.0 13.5 35.3% 47.0%
CY 50.7 71.6 69.5 -2.1 18.8 -2.9% 37.1%
CZ (2) 72.0 72.2 90.6 18.4 18.6 25.5% 25.8%
DE 69.5 72.8 77.3 4.5 7.8 6.2% 11.2%
DK 85.3 90.9 86.6 -4.3 1.3 -4.7% 1.5%
EE 66.6 67.7 86.1 18.4 19.5 27.2% 29.3%
EL 21.0 27.8 21.7 -6.1 0.7 -21.9% 3.3%
ES 47.1 74.9 86.0 11.1 38.9 14.8% 82.6%
FI 76.7 74.4 83.1 8.7 6.4 11.7% 8.3%
FR 73.8 76.1 78.9 2.8 5.1 3.7% 6.9%
HR NA 57.1 55.4 -1.7 NA -3.0% NA
HU 49.1 48.7 43.8 -4.9 -5.3 -10.1% -10.8%
IE 66.9 NA 77.4 NA 10.5 NA 15.7%
IT 32.2 55.6 60.2 4.6 28.0 8.3% 86.9%
LT 46.4 51.9 61.6 9.7 15.2 18.7% 32.8%
LU 71.8 70.8 77.1 6.3 5.3 8.9% 7.4%
LV 36.4 40.4 99.9 59.5 63.5 147.3% 174.5%
MK NA NA 61.9 NA NA NA NA
MT 45.6 53.9 61.6 7.7 16 14.3% 35.1%
NL 74.7 78.6 85.0 6.4 10.3 8.1% 13.8%
NO 86.0 96.8 99.1 2.3 13.1 2.4% 15.2%
PL 34.8 22.5 44.7 22.2 9.9 98.7% 28.5%
PT 44.1 64.6 75.0 10.4 30.9 16.1% 70.1%
RO 40.3 24.1 26.7 2.6 -13.6 10.8% -33.8%
SE (2) 78.4 87.0 93.1 6.1 14.7 7.0% 18.8%
SI 72.9 68.0 84.1 16.1 11.2 23.7% 15.4%
SK 60.4 69.0 70.0 1.0 9.6 1.5% 15.9%
UK (1) 90.4 80.4 85.7 5.3 -4.7 6.6% -5.2%
(1) Break in time series between CVTS 4 and CVTS 5.
(2) Data for CVTS 3 not comparable.
Source: Eurostat, CVTS, dissemination database (accessed 6.2.2018); own calculations.
Enterprise size is strongly related to training provision, with smaller firms
typically reporting lower levels of training incidence and having substantial
influence on overall averages (as large enterprises represent only a fraction of
the total).
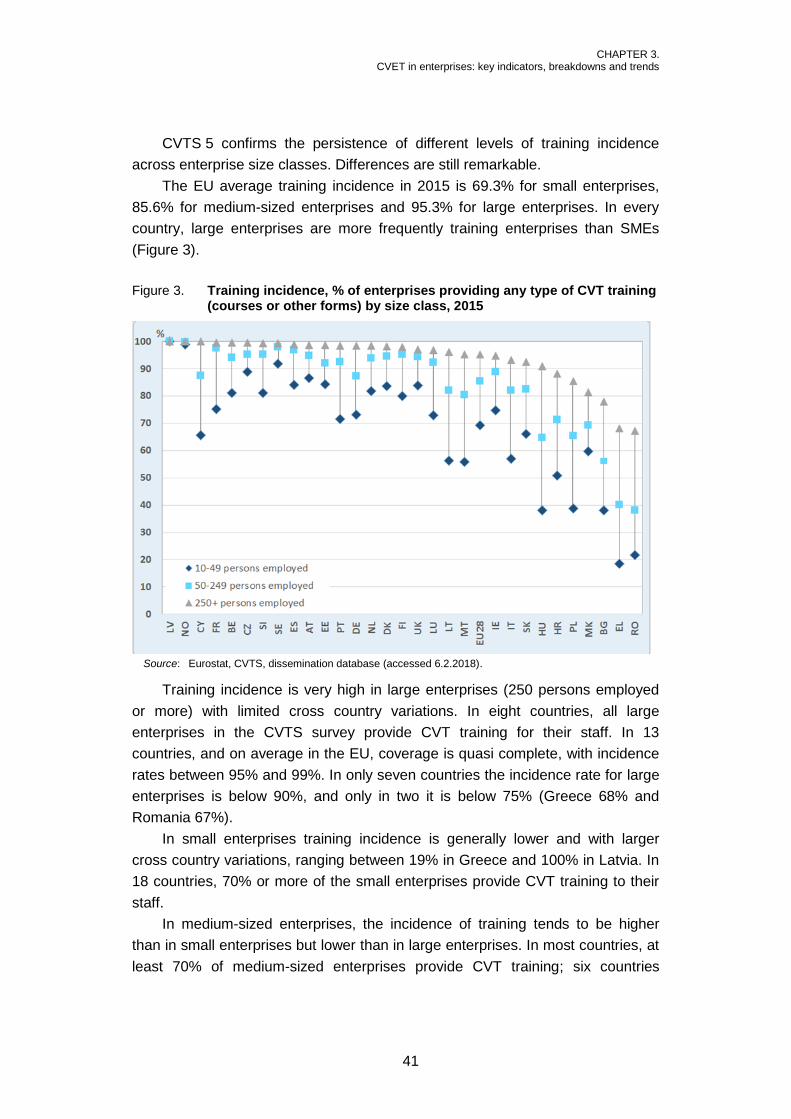
CHAPTER 3. CVET in enterprises: key indicators, breakdowns and trends
41
CVTS 5 confirms the persistence of different levels of training incidence
across enterprise size classes. Differences are still remarkable.
The EU average training incidence in 2015 is 69.3% for small enterprises,
85.6% for medium-sized enterprises and 95.3% for large enterprises. In every
country, large enterprises are more frequently training enterprises than SMEs
(Figure 3).
Figure 3. Training incidence, % of enterprises providing any type of CVT training (courses or other forms) by size class, 2015
Source: Eurostat, CVTS, dissemination database (accessed 6.2.2018).
Training incidence is very high in large enterprises (250 persons employed
or more) with limited cross country variations. In eight countries, all large
enterprises in the CVTS survey provide CVT training for their staff. In 13
countries, and on average in the EU, coverage is quasi complete, with incidence
rates between 95% and 99%. In only seven countries the incidence rate for large
enterprises is below 90%, and only in two it is below 75% (Greece 68% and
Romania 67%).
In small enterprises training incidence is generally lower and with larger
cross country variations, ranging between 19% in Greece and 100% in Latvia. In
18 countries, 70% or more of the small enterprises provide CVT training to their
staff.
In medium-sized enterprises, the incidence of training tends to be higher
than in small enterprises but lower than in large enterprises. In most countries, at
least 70% of medium-sized enterprises provide CVT training; six countries

Continuing vocational training in EU enterprises
42
(Bulgaria, North Macedonia, Greece, Hungary, Poland and Romania) are
exceptions. Variation across countries is lower than among small enterprises,
with incidence rates stretching from 38% (Romania) to 100% (Latvia and
Norway).
The size of the enterprise matters in all countries but to a varying extent.
There are countries where gaps across enterprise size classes are considerably
smaller than others; it is possible to analyse this important aspect by focusing on
the performance gap between small and large enterprises. We define two
measures to this end: the absolute and the relative gap. The absolute gap is
defined as the absolute difference between the indicator values for large and
small enterprises. The relative gap is the percentage ratio between the absolute
difference and the indicator value for small enterprises, which shows as a
percentage how much higher the value for large enterprises is compared to that
of small ones.
Cross country variations of the incidence performance gaps in 2015 and in
2010, both in absolute and relative terms, have been calculated for analysis
(Annex 2, Table A 11).
In 2015, in Latvia, Norway and Sweden the relative difference in incidence
rates between large and small enterprises is less than 10% and can be
considered comparatively small. The incidence of training for large enterprises
exceeds the incidence in small enterprises by 10 to 40% in 16 countries (Austria,
Belgium, Czechia, Denmark, Estonia, Finland, France, Germany, Ireland,
Luxembourg, the Netherlands, North Macedonia, Portugal, Slovakia, Spain and
the UK). In Bulgaria, Greece, Hungary, Poland and Romania the incidence for
large enterprises is more than double that for small enterprises and can be
considered comparatively large.
A key question for EU policies is whether or not differences in incidence
rates between small and large enterprises have decreased over time.
For most countries (n=20), as well the EU-28 average, both absolute and
relative performance gaps between small and large enterprises have decreased
over time. For the EU-28 average, the absolute gap decreased from 31 to 26
percentage points between 2010 and 2015, while the relative gap decreased
from 50% in 2010 to 38% in 2015. The opposite pattern is observed in Denmark,
Croatia, Cyprus, Hungary and Slovakia, where both absolute and relative gaps
grew over time. In two countries, Greece and Romania, mixed patterns were
observed.
In Greece, a declining absolute performance gap between large and small
enterprises is observed (from 59 percentage points in 2010 to 50 percentage
points in 2015). Nonetheless, the relative performance gap increased, indicating

CHAPTER 3. CVET in enterprises: key indicators, breakdowns and trends
43
that large firm incidence rates are now further away from the incidence rates of
small enterprises (3.67 times larger in 2015 compared to 3.42 times larger in
2010).
In Romania, a rising absolute performance gap between large and small
enterprises was observed (up from 44 percentage points in 2010 to 46
percentage points in 2015). Nonetheless, the relative performance gap
decreased, indicating that large firm incidence rates are now relatively closer to
the incidence rates of small enterprises (3.05 times larger in 2015 compared to
3.23 larger in 2010).
Figures 4 to 6 show the evolution in training incidence between 2010 and
2015 by enterprise size class. The evolution is mainly positive, especially for
small enterprises (Figure 4). In eight countries (Belgium, Spain, Lithuania,
Luxembourg Malta, Portugal, Romania and Finland) the training incidence in
small enterprises increased by 10 to 20%. In five countries (Bulgaria, Estonia,
Latvia, Poland and Slovenia) the training incidence in small enterprises increased
by more than 20%. Only two countries (Greece and Hungary), which already had
low rates in 2010, saw incidence rates in small enterprises further declining,
respectively by 23% and 12%.
For medium-sized and large enterprises, changes are less pronounced, as
many countries already had high incidence rates in 2010 (base effect). In most
countries, the development indicates stability. For medium-sized enterprises
(Figure 5), four countries (Bulgaria, Estonia, Malta, and Slovenia) indicate an
increase of 10% to 20%, while three countries (Latvia, Lithuania and Poland)
indicate an increase of more than 20%. Again, Greece and Hungary saw a
substantial fall in training incidence by 12% and 13% respectively.
Only Latvia and Poland saw a considerable increase in training incidence
among large enterprises (Figure 6), as in most countries training coverage was
already quasi-universal in 2010. Only Greece experienced a decline (-18%).

Continuing vocational training in EU enterprises
44
Figure 4. Training incidence: enterprises providing any type of CVT training (courses or other forms) by size class – 2015 and 2010 – 10 to 49 persons employed
(1) No participation in CVTS 4.
(2) Break in time series between CVTS 4 and CVTS 5.
Source: Eurostat, CVTS, dissemination database (accessed 6.2.2018); own calculations.
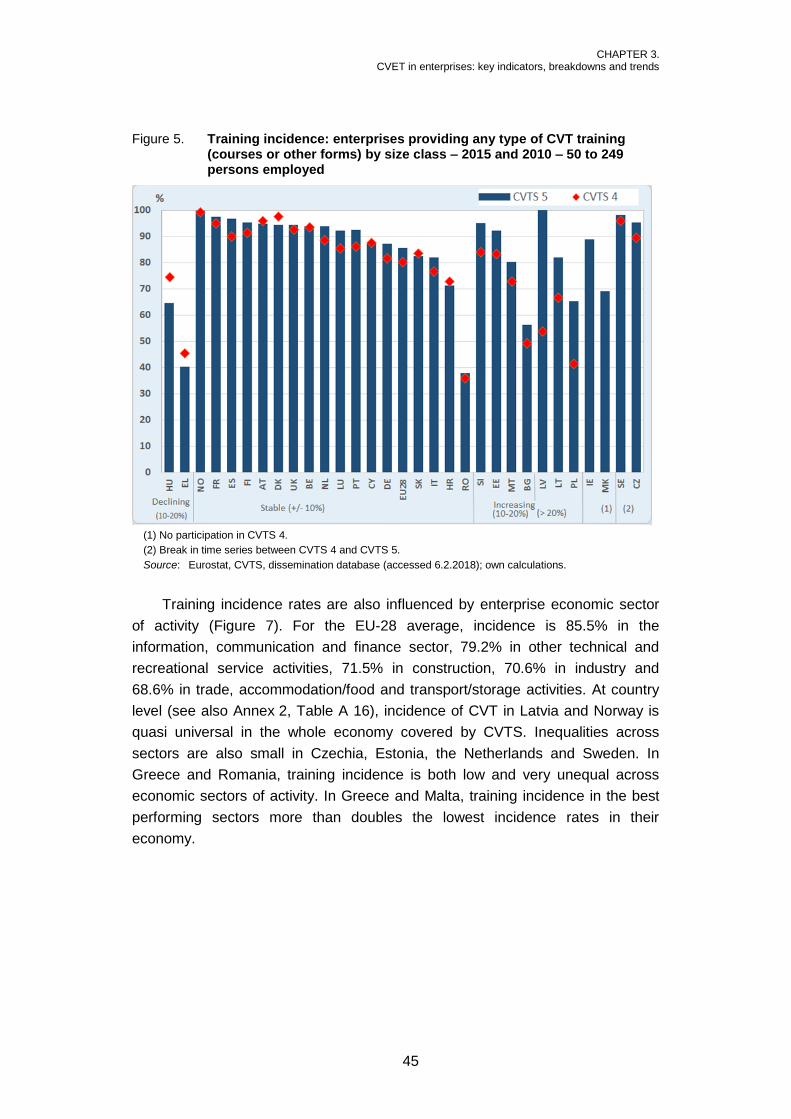
CHAPTER 3. CVET in enterprises: key indicators, breakdowns and trends
45
Figure 5. Training incidence: enterprises providing any type of CVT training (courses or other forms) by size class – 2015 and 2010 – 50 to 249 persons employed
(1) No participation in CVTS 4.
(2) Break in time series between CVTS 4 and CVTS 5.
Source: Eurostat, CVTS, dissemination database (accessed 6.2.2018); own calculations.
Training incidence rates are also influenced by enterprise economic sector
of activity (Figure 7). For the EU-28 average, incidence is 85.5% in the
information, communication and finance sector, 79.2% in other technical and
recreational service activities, 71.5% in construction, 70.6% in industry and
68.6% in trade, accommodation/food and transport/storage activities. At country
level (see also Annex 2, Table A 16), incidence of CVT in Latvia and Norway is
quasi universal in the whole economy covered by CVTS. Inequalities across
sectors are also small in Czechia, Estonia, the Netherlands and Sweden. In
Greece and Romania, training incidence is both low and very unequal across
economic sectors of activity. In Greece and Malta, training incidence in the best
performing sectors more than doubles the lowest incidence rates in their
economy.
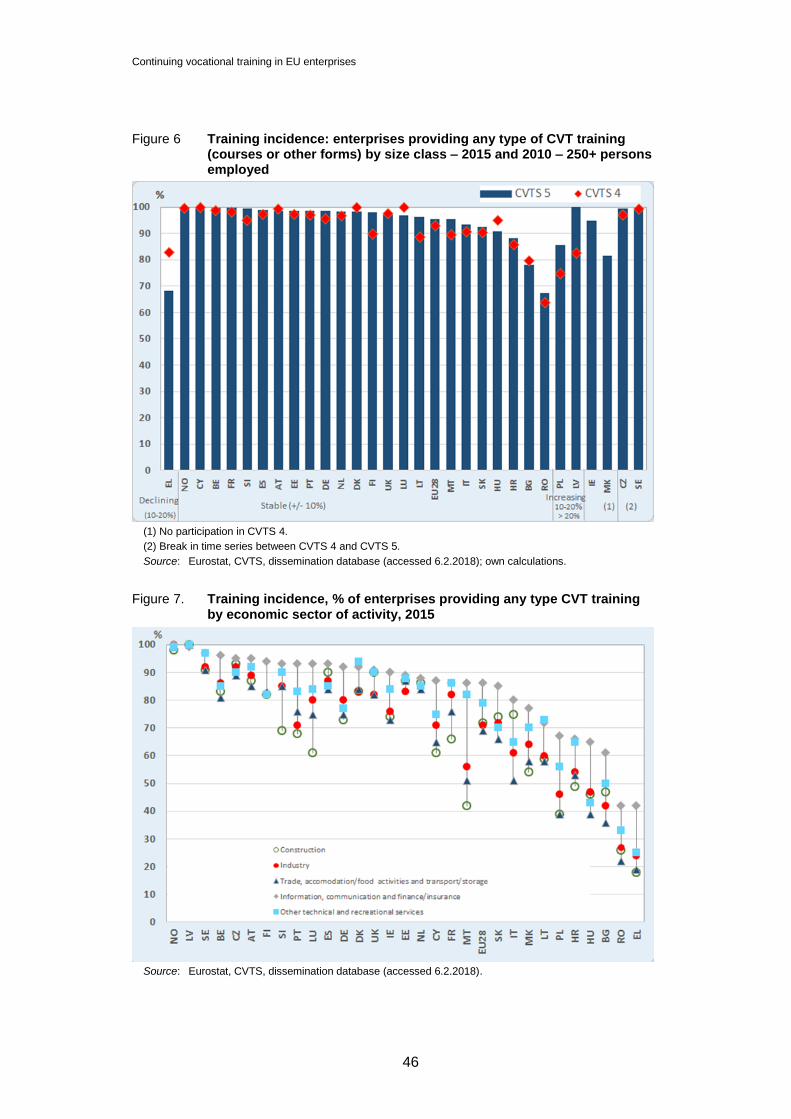
Continuing vocational training in EU enterprises
46
Figure 6 Training incidence: enterprises providing any type of CVT training (courses or other forms) by size class – 2015 and 2010 – 250+ persons employed
(1) No participation in CVTS 4.
(2) Break in time series between CVTS 4 and CVTS 5.
Source: Eurostat, CVTS, dissemination database (accessed 6.2.2018); own calculations.
Figure 7. Training incidence, % of enterprises providing any type CVT training by economic sector of activity, 2015
Source: Eurostat, CVTS, dissemination database (accessed 6.2.2018).

CHAPTER 3. CVET in enterprises: key indicators, breakdowns and trends
47
Figure 8. Training participation rate, participants in CVT courses as % of persons employed (all enterprises), 2015 and 2010
(1) No participation in CVTS 4.
(2) Break in time series between CVTS 4 and CVTS 5.
Source: Eurostat, CVTS, dissemination database (accessed 6.2.2018); own calculations.
3.2. Staff participation in training
This section analyses the level of staff participation in CVT courses. The indicator
considered is the number of participants in CVT courses during the reference
period as a percentage of the total number of persons employed in all enterprises
surveyed (training and non-training enterprises).
On average, across the EU-28 Member States, 41% of persons employed
participated in CVT courses in 2015 (Figure 8). The EU average level increased
only slightly by three percentage points or 8% as compared to 2010. However, in
a longer-term perspective the participation rate shows a more robust increase,
from 33% in 2005 to 38% in 2010 and 41% in 2015.
Across countries, the 2015 participation rate still shows high variability. It
varies considerably between 19% and 84%. Countries with low participation rates
(below 30% of all persons employed in 2015) are mostly east European
(Bulgaria, Croatia, Greece, Hungary, Latvia, Lithuania, North Macedonia and
Romania). In eight countries (Belgium, Czechia, Luxembourg, Norway, Slovenia,
Slovakia, Spain and Sweden) over half of all persons employed participate in
CVT courses.

Continuing vocational training in EU enterprises
48
Compared to 2010, the participation rate increased by more than 10% in 15
countries. In six countries (Greece, Latvia, Norway, Portugal, Romania and
Spain) the increase was 10% to 20%. In nine other countries the increase was
more than 20% compared to the 2010 participation rate (Bulgaria, Croatia, Italy,
Lithuania, Luxembourg, Slovenia, Slovakia, Austria and Poland).
In 11 countries (Belgium, Denmark, Germany, Estonia, France, Cyprus,
Hungary, Malta, the Netherlands, Finland and the UK), the participation rate in
2015 was relatively stable compared to 2010. In most of these countries – except
Hungary – the participation rate was relatively close to the EU average in 2010.
No country reported a decline of more than 10%.
In four countries it was not possible to assess development over time
properly; this was because they did not participate in the 2010 CVTS (North
Macedonia and Ireland) or because methodological issues limit the possibility of
comparisons across waves (Czechia and Sweden).
Based on CVTS 5 results, enterprise size continues to have an influence not
only on training incidence but also on training participation. According to Eurostat
estimates, the average participation rate for Member States is 30% for persons
employed in small enterprises, 37% for those employed in medium-sized
enterprises, and 48% for those working in large enterprises. In all countries
except Norway and the UK, participation rates in large enterprises are higher
than in other enterprise size classes, and in all but one country (North
Macedonia) the rates in small enterprises are lower than in other enterprise size
classes.
While the overall evolution in participation rates in CVT courses between
2010 and 2015 can be characterised as stable or positive (Figure 8), some
conclusions differ when breaking up these participation rates by enterprise size
class (Figures 9 to 11). The overall positive development in Greece and Croatia
hides the fact that participation rates of persons employed in small enterprises
declined between 2010 and 2015. In Denmark, an overall stable development
between 2010 and 2015 conceals the fact that the participation of persons
employed in both small and medium-sized enterprises declined, but was
compensated to some extent by a rise in participation rates in large enterprises.
In Malta, the overall stable development between 2010 and 2015 conceals the
fact that the participation rate in large enterprises declined, but was compensated
by a rise in the participation rate in small enterprises.
In Estonia, the overall stable development between 2010 and 2015 conceals
the fact that participation among those employed in medium-sized enterprises
declined, but was compensated by a rise in the participation rate in large
enterprises.
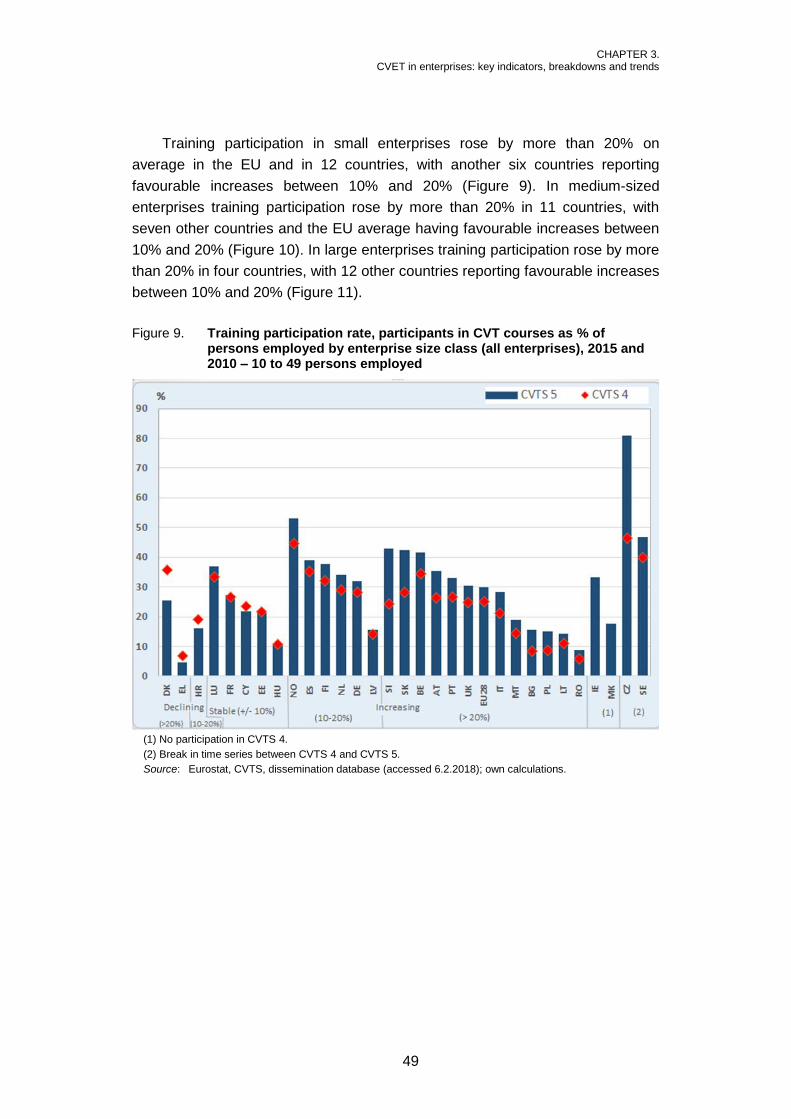
CHAPTER 3. CVET in enterprises: key indicators, breakdowns and trends
49
Training participation in small enterprises rose by more than 20% on
average in the EU and in 12 countries, with another six countries reporting
favourable increases between 10% and 20% (Figure 9). In medium-sized
enterprises training participation rose by more than 20% in 11 countries, with
seven other countries and the EU average having favourable increases between
10% and 20% (Figure 10). In large enterprises training participation rose by more
than 20% in four countries, with 12 other countries reporting favourable increases
between 10% and 20% (Figure 11).
Figure 9. Training participation rate, participants in CVT courses as % of persons employed by enterprise size class (all enterprises), 2015 and 2010 – 10 to 49 persons employed
(1) No participation in CVTS 4.
(2) Break in time series between CVTS 4 and CVTS 5.
Source: Eurostat, CVTS, dissemination database (accessed 6.2.2018); own calculations.
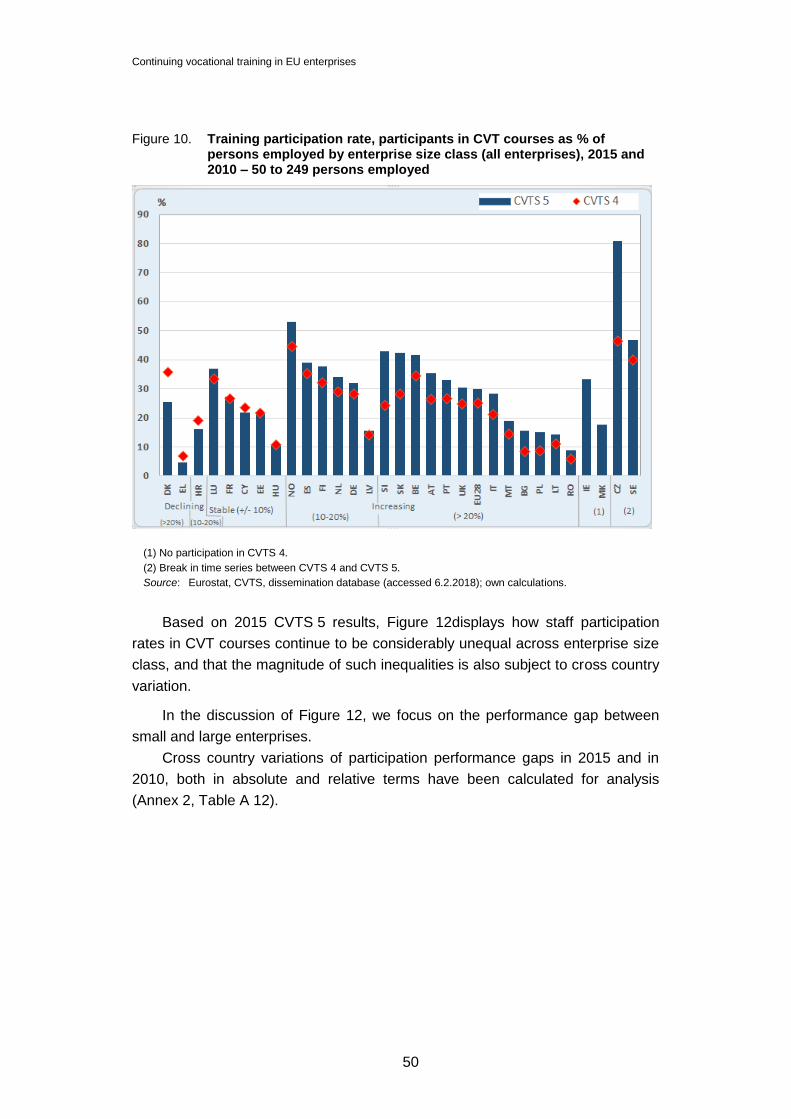
Continuing vocational training in EU enterprises
50
Figure 10. Training participation rate, participants in CVT courses as % of persons employed by enterprise size class (all enterprises), 2015 and 2010 – 50 to 249 persons employed
(1) No participation in CVTS 4.
(2) Break in time series between CVTS 4 and CVTS 5.
Source: Eurostat, CVTS, dissemination database (accessed 6.2.2018); own calculations.
Based on 2015 CVTS 5 results, Figure 12displays how staff participation
rates in CVT courses continue to be considerably unequal across enterprise size
class, and that the magnitude of such inequalities is also subject to cross country
variation.
In the discussion of Figure 12, we focus on the performance gap between
small and large enterprises.
Cross country variations of participation performance gaps in 2015 and in
2010, both in absolute and relative terms have been calculated for analysis
(Annex 2, Table A 12).
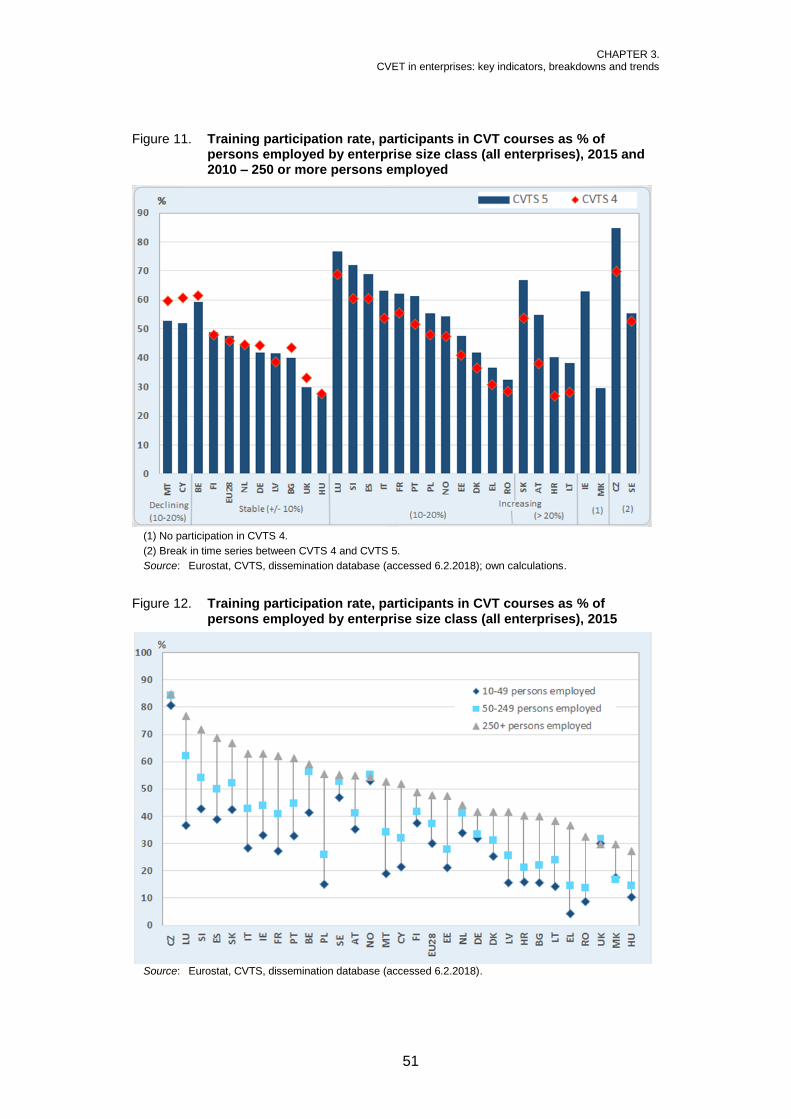
CHAPTER 3. CVET in enterprises: key indicators, breakdowns and trends
51
Figure 11. Training participation rate, participants in CVT courses as % of persons employed by enterprise size class (all enterprises), 2015 and 2010 – 250 or more persons employed
(1) No participation in CVTS 4.
(2) Break in time series between CVTS 4 and CVTS 5.
Source: Eurostat, CVTS, dissemination database (accessed 6.2.2018); own calculations.
Figure 12. Training participation rate, participants in CVT courses as % of persons employed by enterprise size class (all enterprises), 2015
Source: Eurostat, CVTS, dissemination database (accessed 6.2.2018).

Continuing vocational training in EU enterprises
52
In 2015, the differences in participation rates between large and small
enterprises are small in Czechia, Norway, Sweden and the UK, with absolute
differences less than 10 percentage points and relative differences less than
20%. Inequity in participation across enterprise size classes is also limited in
Belgium, Germany, the Netherlands and Finland as the participation rates of staff
of large enterprises exceeds the participation rates of staff of small enterprises by
20% to 50%. In Bulgaria, Croatia, Estonia, Greece, Italy, Cyprus, France,
Luxembourg, Latvia, Lithuania, Hungary, Malta, Poland and Romania the
participation rates of staff of large enterprises more than doubles the participation
rates of staff of small enterprises, meaning the highest levels of inequality.
A key question is whether or not differences in participation rates between
small and large enterprises have decreased over time.
While performance gaps between small and large enterprises in incidence
rates generally fell between 2010 and 2015, this is less the case for participation
rates.
For 11 countries, as well the EU-28 average, both absolute and relative
performance gaps between small and large enterprises have decreased over
time. For the EU-28 average, the absolute gap fell from 21 to 18 percentage
points between 2010 and 2015, while the relative gap fell from 84% in 2010 to
59% in 2015.
This pattern is not observed in nine other countries (Denmark, Estonia,
Greece, Spain, France, Croatia, Lithuania, Luxembourg and Austria), where both
absolute and relative gaps in participation rates between large enterprises and
small enterprises grew over time.
In Italy, Latvia, Poland, Portugal and Romania, the increasing absolute
performance gap between large and small enterprises goes hand-in-hand with
decreasing relative performance gaps, indicating that participation rates of staff of
small firms are now relatively closer to participation rates in large enterprises.
Overall this means that relative performance gaps have narrowed in 16 countries.
Figure 13 examines the inequities in 2015 CVT participation rates by
enterprise economic sector of activity. For the EU-28 average, the participation
rates were estimated at 56% in the information, communication and finance
sector, 44% in industry, and 38% in trade, accommodation/food and
transport/storage activities. Participation was lowest in the construction sector as
well as in other technical and recreational service activities (both 37%).
At country level (see also Annex 2, Table A 17), training participation in
Croatia, Cyprus, Greece, North Macedonia, Malta and Romania across economic
sectors is very unequal. In Greece and Malta, training participation disparities are
the largest: low rates of participation in the sector of Construction (7% in Malta)
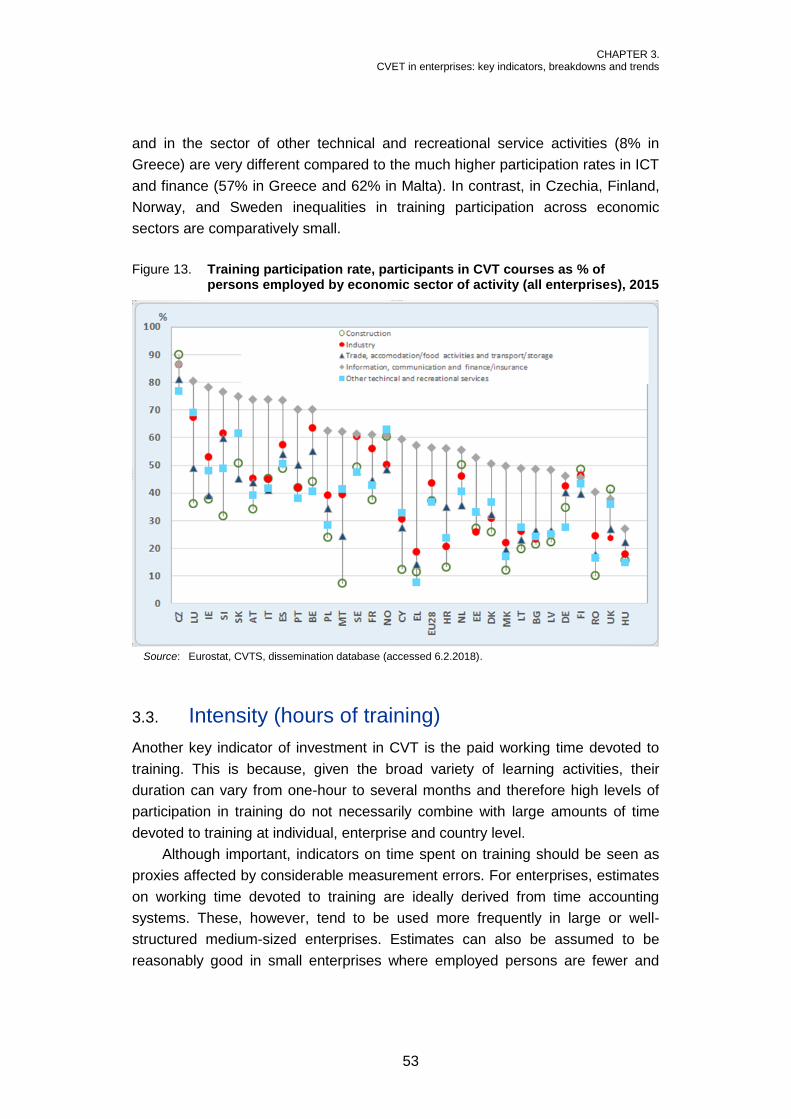
CHAPTER 3. CVET in enterprises: key indicators, breakdowns and trends
53
and in the sector of other technical and recreational service activities (8% in
Greece) are very different compared to the much higher participation rates in ICT
and finance (57% in Greece and 62% in Malta). In contrast, in Czechia, Finland,
Norway, and Sweden inequalities in training participation across economic
sectors are comparatively small.
Figure 13. Training participation rate, participants in CVT courses as % of persons employed by economic sector of activity (all enterprises), 2015
Source: Eurostat, CVTS, dissemination database (accessed 6.2.2018).
3.3. Intensity (hours of training)
Another key indicator of investment in CVT is the paid working time devoted to
training. This is because, given the broad variety of learning activities, their
duration can vary from one-hour to several months and therefore high levels of
participation in training do not necessarily combine with large amounts of time
devoted to training at individual, enterprise and country level.
Although important, indicators on time spent on training should be seen as
proxies affected by considerable measurement errors. For enterprises, estimates
on working time devoted to training are ideally derived from time accounting
systems. These, however, tend to be used more frequently in large or well-
structured medium-sized enterprises. Estimates can also be assumed to be
reasonably good in small enterprises where employed persons are fewer and

Continuing vocational training in EU enterprises
54
training events rarer. Estimates become more difficult in enterprises where
accounting systems are not in place and whose size (or training activity) is not
small enough to help respondent memory. Moreover, different approaches to
reporting time on courses exist within and across countries. Changes in
accounting practices (such as due to new regulations as in the case of Portugal
in 2009) are also likely to impact on the numbers of training hours reported.
In the CVTS-survey, only paid working time devoted to CVT courses is
reported, this includes both instruction time and time for preparation. It should
exclude any periods of normal working between several training sessions and
any time spent on travelling to the course. Time spent on other forms of CVT is
not reported.
This section considers training intensity as measured by hours of training
spent in CVT courses per 1 000 hours worked in all surveyed enterprises
(training and non-training enterprises). The indicator measures the share of
available time resources devoted to course activities during the calendar year by
staff (10 hours per 1 000 hours equals 1% of the working time).
This indicator is privileged for cross period or cross country comparisons, as
it avoids the drawback of relating hours of training accumulated in a given
calendar year to the number of persons employed. The number of persons
employed may vary considerably in the same reference period (for instance due
to seasonal variation) and/or may correspond to different amounts of worked time
(for instance due to different impacts of part-time work).
In 2015, the average time spent on CVT courses was 6.2 hours per 1 000
hours worked in the EU (Figure 14). Across countries, the indicator varies
considerably, ranging between three hours in Greece and Hungary to 13.1 hours
in Belgium. Countries with low training intensity (below 4.5 hours in 2015) are
mostly east European (Bulgaria, Croatia, Cyprus, North Macedonia, Greece,
Hungary, Latvia and Romania). In three countries (Belgium, Ireland and
Luxembourg) training intensity exceeds 10 hours per 1 000 hours worked.
In the EU, the average time spent on CVT courses per 1 000 hours worked
has only slightly increased between 2010 (5.8 hours) and 2015 (6.2 hours). This
is comparable to the dynamics between 2005 and 2010 (from 5.3 to 5.8 hours).
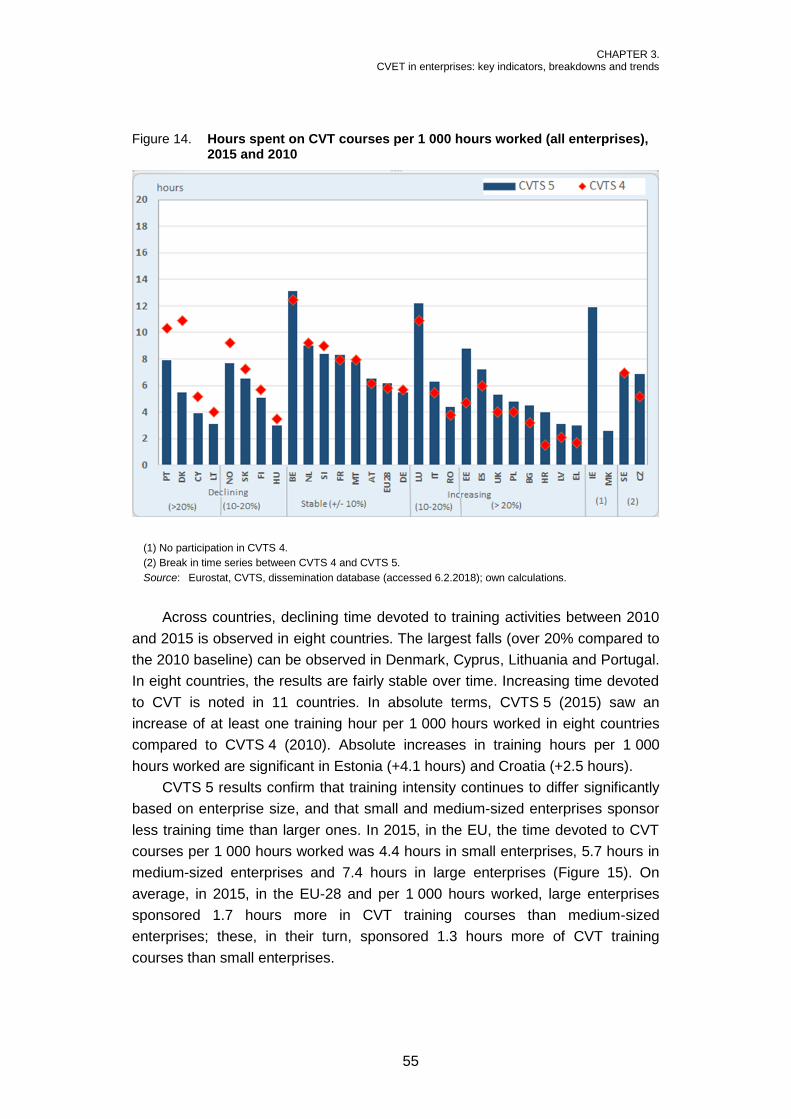
CHAPTER 3. CVET in enterprises: key indicators, breakdowns and trends
55
Figure 14. Hours spent on CVT courses per 1 000 hours worked (all enterprises), 2015 and 2010
(1) No participation in CVTS 4.
(2) Break in time series between CVTS 4 and CVTS 5.
Source: Eurostat, CVTS, dissemination database (accessed 6.2.2018); own calculations.
Across countries, declining time devoted to training activities between 2010
and 2015 is observed in eight countries. The largest falls (over 20% compared to
the 2010 baseline) can be observed in Denmark, Cyprus, Lithuania and Portugal.
In eight countries, the results are fairly stable over time. Increasing time devoted
to CVT is noted in 11 countries. In absolute terms, CVTS 5 (2015) saw an
increase of at least one training hour per 1 000 hours worked in eight countries
compared to CVTS 4 (2010). Absolute increases in training hours per 1 000
hours worked are significant in Estonia (+4.1 hours) and Croatia (+2.5 hours).
CVTS 5 results confirm that training intensity continues to differ significantly
based on enterprise size, and that small and medium-sized enterprises sponsor
less training time than larger ones. In 2015, in the EU, the time devoted to CVT
courses per 1 000 hours worked was 4.4 hours in small enterprises, 5.7 hours in
medium-sized enterprises and 7.4 hours in large enterprises (Figure 15). On
average, in 2015, in the EU-28 and per 1 000 hours worked, large enterprises
sponsored 1.7 hours more in CVT training courses than medium-sized
enterprises; these, in their turn, sponsored 1.3 hours more of CVT training
courses than small enterprises.

Continuing vocational training in EU enterprises
56
Figure 15. Hours spent in CVT courses per 1 000 hours worked by enterprise size class (all enterprises), 2015
Source: Eurostat, CVTS, dissemination database (accessed 6.2.2018).
In all countries except Belgium, Ireland and the UK, the time devoted to
training in large enterprises is higher than in small and medium enterprises, and
in all but two countries (Ireland and the UK) the time devoted to training in small
enterprises is lowest. So, contrary to the overall pattern, in Ireland and the UK
small enterprises invest more time in training per 1000 hours worked than larger-
sized enterprises.
Cross country variations of intensity performance gaps between large and
small enterprises in 2015 and in 2010 have been calculated for analysis, both in
absolute and relative terms (Annex 2, Table A 13).
In terms of training intensity, the gap between small and large enterprises in
2015 is comparatively small in Ireland, North Macedonia and Norway, as
absolute differences are less than one hour (per 1 000 hours worked) and
relative differences are less than 20%. Inequity in training intensity across
enterprise size classes is also limited in Finland where the time devoted to
training of staff in large enterprises exceeds that of staff in small enterprises by
only 34%. In contrast, in most countries (Bulgaria, Denmark, Estonia, Greece,
Spain, France, Italy, Cyprus, Latvia, Lithuania, Luxembourg, Hungary Malta,
Poland, Portugal, Romania, Slovenia and Slovakia), the time devoted to training

CHAPTER 3. CVET in enterprises: key indicators, breakdowns and trends
57
(per 1 000 hours worked) in large enterprises in 2015 is more than double the
time devoted to training in small enterprises.
Figures 16 to 18 show the evolution between 2010 and 2015 in time devoted
to CVT courses by enterprise size class. In small enterprises (Figure 16) time
devoted to training remained stable between 2010 and 2015 in 10 countries; in
11 countries it increased by more than 10%. Time devoted to training in small
enterprises rose most sharply in the UK (+108%), Bulgaria (+71%) and Romania
(+63%). In five countries (Denmark, Greece, Croatia, Lithuania and Portugal), it
fell by more than 10%. In Denmark the time devoted to training in small
enterprises fell sharply from 15.4 hours per 1 000 hours worked in 2010 to 1.7
hours in 2015.
In medium-sized enterprises (Figure 17Figure 17), time devoted to training
remained fairly stable between 2010 and 2015 in five countries; in 13 countries it
increased by more than 10%. Time devoted to training in medium-sized
enterprises rose most sharply in Estonia (+116%), Greece (+70%), Romania
(+58%), Latvia (+53%) and the UK (+50%). In eight countries (Denmark, Cyprus,
Hungary, Lithuania, Norway, Portugal, Slovenia and Slovakia), it fell by more
than 10%; among these the reduction in time devoted to training in medium-sized
enterprises is most pronounced in Denmark (-44%), Lithuania (-43%), Norway (-
43%), Portugal (-38%), Portugal and Slovenia (-37%).
In large enterprises (Figure 18Figure 18), time devoted to training remained
fairly stable between 2010 and 2015 in eight countries; in 10 countries it
increased by more than 10%. Time devoted to training in large enterprises rose
most sharply in Croatia (+370%), Greece (+97%) and Estonia (+82%). In eight
countries (Belgium, Cyprus, Finland, Hungary, Malta, Norway, Portugal and
Slovakia), it fell by more than 10%. The reduction in time devoted to training in
large enterprises is most pronounced in Cyprus (-35%).
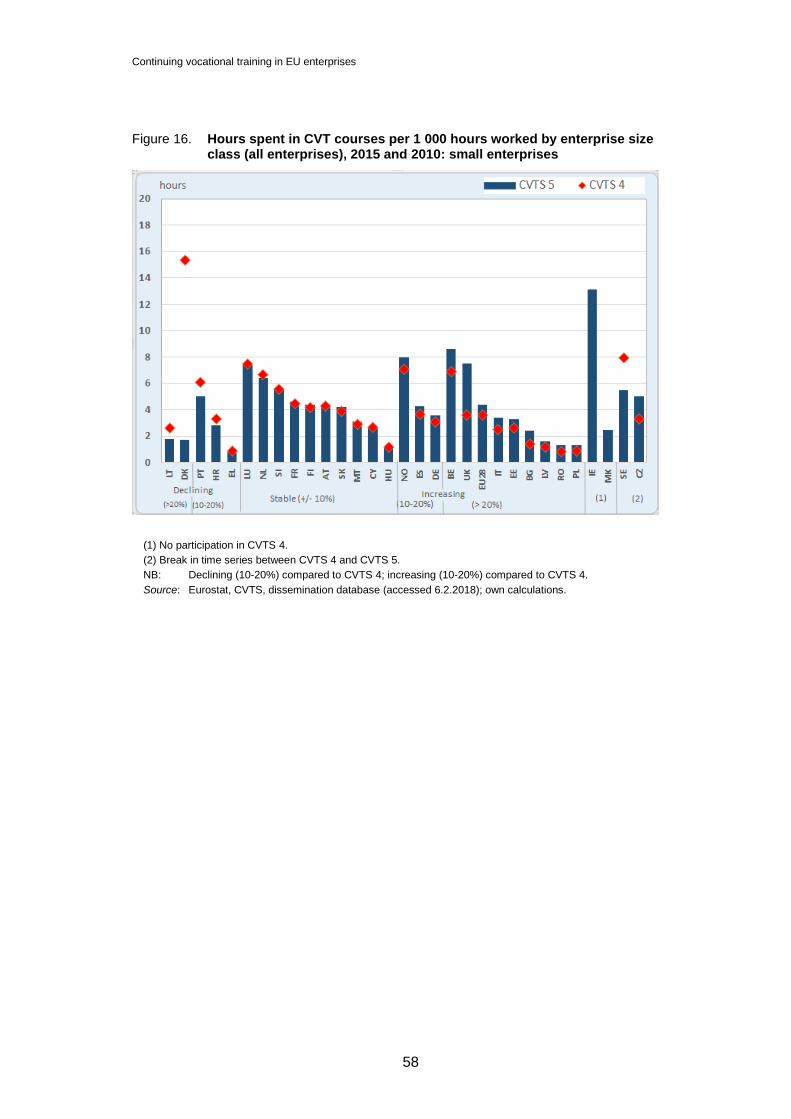
Continuing vocational training in EU enterprises
58
Figure 16. Hours spent in CVT courses per 1 000 hours worked by enterprise size class (all enterprises), 2015 and 2010: small enterprises
(1) No participation in CVTS 4.
(2) Break in time series between CVTS 4 and CVTS 5.
NB: Declining (10-20%) compared to CVTS 4; increasing (10-20%) compared to CVTS 4.
Source: Eurostat, CVTS, dissemination database (accessed 6.2.2018); own calculations.

CHAPTER 3. CVET in enterprises: key indicators, breakdowns and trends
59
Figure 17. Hours spent in CVT courses per 1 000 hours worked by enterprise size class (all enterprises), 2015 and 2010: medium-sized enterprises
(1) No participation in CVTS 4.
(2) Break in time series between CVTS 4 and CVTS 5.
NB: Declining (10-20%) compared to CVTS 4; increasing (10-20%) compared to CVTS 4.
Source: Eurostat, CVTS, dissemination database (accessed 6.2.2018); own calculations.
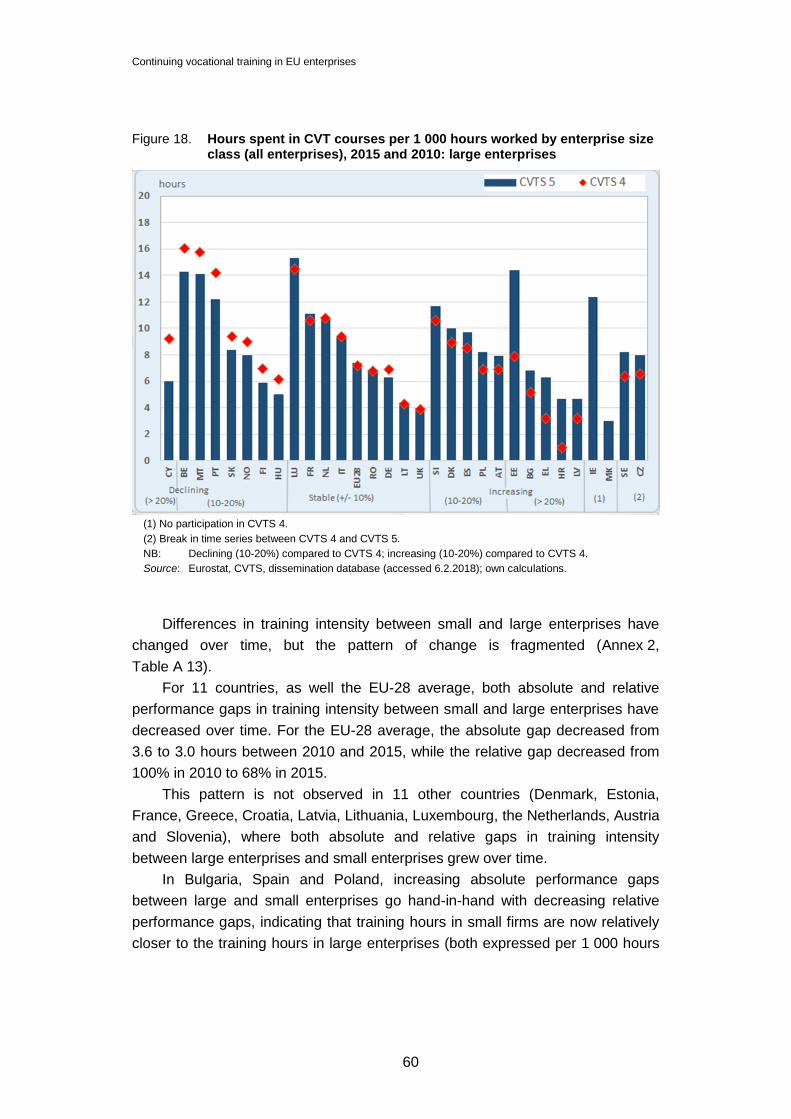
Continuing vocational training in EU enterprises
60
Figure 18. Hours spent in CVT courses per 1 000 hours worked by enterprise size class (all enterprises), 2015 and 2010: large enterprises
(1) No participation in CVTS 4.
(2) Break in time series between CVTS 4 and CVTS 5.
NB: Declining (10-20%) compared to CVTS 4; increasing (10-20%) compared to CVTS 4.
Source: Eurostat, CVTS, dissemination database (accessed 6.2.2018); own calculations.
Differences in training intensity between small and large enterprises have
changed over time, but the pattern of change is fragmented (Annex 2,
Table A 13).
For 11 countries, as well the EU-28 average, both absolute and relative
performance gaps in training intensity between small and large enterprises have
decreased over time. For the EU-28 average, the absolute gap decreased from
3.6 to 3.0 hours between 2010 and 2015, while the relative gap decreased from
100% in 2010 to 68% in 2015.
This pattern is not observed in 11 other countries (Denmark, Estonia,
France, Greece, Croatia, Latvia, Lithuania, Luxembourg, the Netherlands, Austria
and Slovenia), where both absolute and relative gaps in training intensity
between large enterprises and small enterprises grew over time.
In Bulgaria, Spain and Poland, increasing absolute performance gaps
between large and small enterprises go hand-in-hand with decreasing relative
performance gaps, indicating that training hours in small firms are now relatively
closer to the training hours in large enterprises (both expressed per 1 000 hours

CHAPTER 3. CVET in enterprises: key indicators, breakdowns and trends
61
worked). Overall this means that relative performance gaps have narrowed in 14
countries.
Figure 19 displays the sectoral breakdown of the time devoted to CVT
training in 2015. The results confirm previous observations that the information,
communication and finance/insurance sector is one of the most active in
sponsoring hours of CVT training courses. The EU average for this sector and all
its enterprises is 11.7 hours per 1 000 hours worked; in other sectors values
range between 4.6 hours (trade, accommodation/food activities and
transport/storage) and 6.5 hours (industry). Measured in relative terms, 2015
sectoral inequalities in training intensity at country level are highest in Bulgaria,
Greece, Malta and Slovenia (Annex 2, Table A 18).
Figure 19. Hours spent in CVT courses per 1 000 hours worked by economic sector of activity (all enterprises), 2015
Source: Eurostat, CVTS, dissemination database (accessed 6.2.2018).
3.4. Enterprise training expenditure
Together with information on staff participation and its time intensity, data on
enterprise expenditure on CVT indicate the level of investments in training
undertaken by companies. ‘Beyond existing obligations for training (e.g. due to
health and safety regulations) or relevant social partner agreements, training
investments are within the discretion of the firms’ (Cedefop, 2015, P. 171). CVTS

Continuing vocational training in EU enterprises
62
provides relevant information as it collects data on the level and the structure of
enterprises expenditures for financing CVT courses in the calendar year to which
the survey refers
Table 7 summarises the enterprises’ expenditure structure for CVT courses
as framed in the context of CVTS, as well as the two main aggregates which can
be derived for analytical purposes: direct monetary expenditure and total
monetary expenditure (TME) undertaken by enterprises to finance CVT courses
(Cedefop, 2015).
Direct monetary expenditure is composed of ‘the sum of fees and payments
to external organisations, travel and subsistence payments, labour costs of
internal trainers, training centres and teaching materials’ (Cedefop, 2015, p. 185).
‘Direct expenditure can be considered as variable costs: the more an enterprise
trains, the more direct expenditure increases. This makes direct expenditure an
indicator of enterprise training behaviour’ (Cedefop, 2015, p. 171).
Contributions to collective or other funds are added to direct monetary
expenditure and receipts from these funds to support training are deducted to
derive the TME. ‘Contributions to collective funding arrangements through
government and intermediary organisations are (in countries such as France and
Italy) not a decision of the enterprise as they are mandatory. They are not related
to the incidence and amount of training, but are fixed costs. They are a real
expenditure for the enterprise, and both training and non-training enterprises are
concerned’ (Cedefop, 2010, p. 90).
‘Personnel absence costs (PAC) are an ex post estimate based on total
labour costs of persons employed, the total number of hours worked by persons
employed and the total paid working time spent on CVT courses’ (Cedefop, 2010.
P. 88). ‘While the elements of costs are related to real monetary expenditure
which might be recorded in the accounting system of enterprises, PAC is
potentially biased. It might be that PAC is lower than calculated or even zero; this
is the case if participants still have to accomplish their workload, or if colleagues
of training participants have to work more during their absence, or if training
takes place in a slack period’ (Cedefop, 2010, p. 89). On the other hand, ‘PAC
may underestimate participants labour cost, if the costs of those undergoing CVT
is higher than average labour costs’ (Cedefop, 2010, p. 89). We therefore choose
not to report on PAC.

CHAPTER 3. CVET in enterprises: key indicators, breakdowns and trends
63
Table 7. Components of enterprise expenditure on CVT courses: elements reported within the CVTS framework
Fees and
payments
Travel and
subsistence
Labour
costs of
internal
trainers
Training
centre,
teaching
materials
Contributions Receipts Personnel
absence
cost,
(PAC)
Variable costs Fixed costs (in the short term)
Fixed and mandatory costs. Only contributions which finance CVT must be included. Concerns all enterprises (training and non-training).
Conditional on training
Rough estimate, potentially biased, no real expenditure of the enterprise
Direct monetary expenditure for CVT courses Mutualised costs of CVT
Total monetary expenditure for CVT courses (TME)
Total costs of CVT courses
Source: Cedefop (2015).
All expenditure indicators presented in this report are calculated with
reference to all enterprises surveyed (training and non-training enterprises).
Indicators on expenditure can be expressed as a percentage of total labour
costs. Indicators can also target expenditure per person employed. This section
considers only indicators expressing enterprise expenditure on training as a
percentage of the total labour cost, which are privileged for methodological
reasons. They are not sensitive to inflation, as the nominator and denominator
are measured in purchasing power standards (PPS) and they control for price
differences when comparing costs. They also take differences in wage levels into
account and are not affected by fluctuations in employment levels over the
reference period or by different impacts of part time work. They are considered
the best available for comparisons across countries and over time.
Comparisons over time were not possible for some countries: Ireland and
North Macedonia did not participate in CVTS 4; Czechia and Sweden reported a
break in their time series; and 2010 expenditure data for Romania were missing.
Also, expenditure data for Czechia have been assessed in a manner not
comparable to those of other countries, as the definition of costs differs from that
used in the model questionnaire.
3.4.1. Direct monetary expenditure
In Figure 20 enterprise direct monetary expenditure on CVT course is expressed
as a share of the total labour costs for all enterprises. In the EU, on average, in
2015, direct expenditure accounted for 0.7% of total labour costs, remaining
stable compared to 2010.
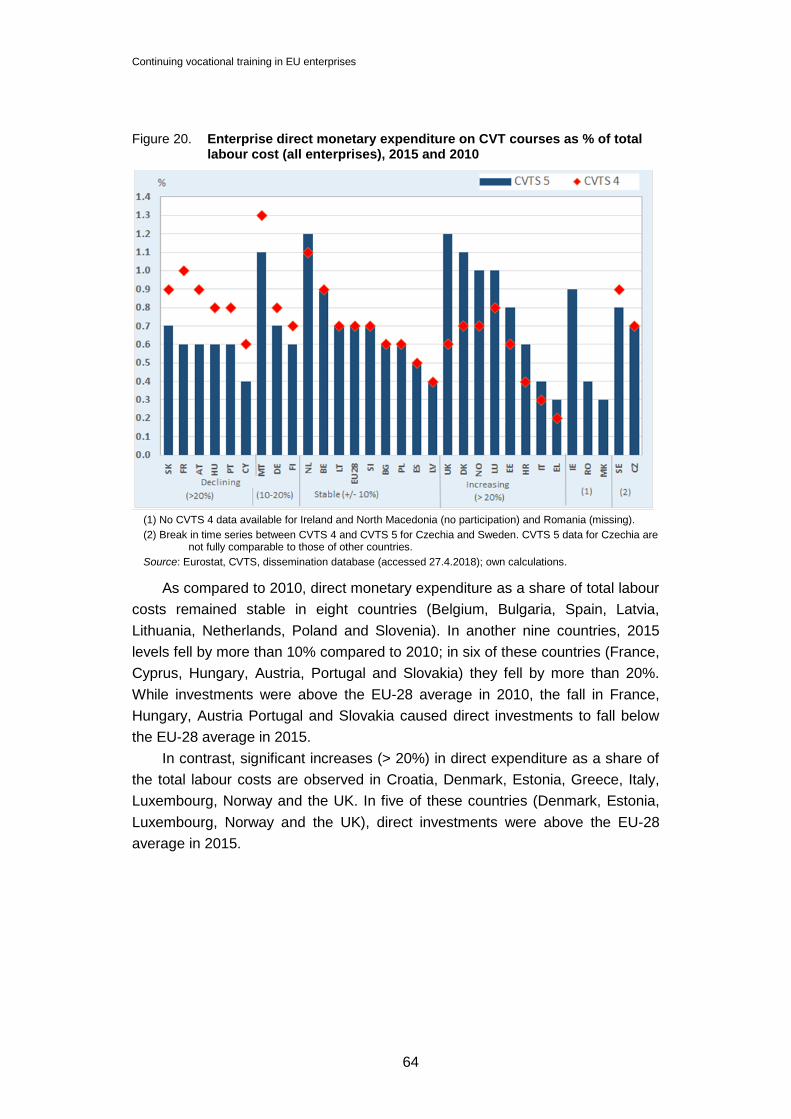
Continuing vocational training in EU enterprises
64
Figure 20. Enterprise direct monetary expenditure on CVT courses as % of total labour cost (all enterprises), 2015 and 2010
(1) No CVTS 4 data available for Ireland and North Macedonia (no participation) and Romania (missing).
(2) Break in time series between CVTS 4 and CVTS 5 for Czechia and Sweden. CVTS 5 data for Czechia are not fully comparable to those of other countries.
Source: Eurostat, CVTS, dissemination database (accessed 27.4.2018); own calculations.
As compared to 2010, direct monetary expenditure as a share of total labour
costs remained stable in eight countries (Belgium, Bulgaria, Spain, Latvia,
Lithuania, Netherlands, Poland and Slovenia). In another nine countries, 2015
levels fell by more than 10% compared to 2010; in six of these countries (France,
Cyprus, Hungary, Austria, Portugal and Slovakia) they fell by more than 20%.
While investments were above the EU-28 average in 2010, the fall in France,
Hungary, Austria Portugal and Slovakia caused direct investments to fall below
the EU-28 average in 2015.
In contrast, significant increases (> 20%) in direct expenditure as a share of
the total labour costs are observed in Croatia, Denmark, Estonia, Greece, Italy,
Luxembourg, Norway and the UK. In five of these countries (Denmark, Estonia,
Luxembourg, Norway and the UK), direct investments were above the EU-28
average in 2015.

CHAPTER 3. CVET in enterprises: key indicators, breakdowns and trends
65
Figure 21. Enterprise direct monetary expenditure on CVT courses as % of total labour cost by size class (all enterprises), 2015
(1) Not fully comparable to other countries.
Source: Eurostat, CVTS, dissemination database (accessed 27.4.2018).
In 2015, direct expenditure as a share of total labour costs varied across
enterprise size classes, with large enterprises generally spending considerably
more (Figure 21). Based on the EU-28 average data, small enterprises (10 to 49
persons employed) had direct expenditure for CVT courses at 0.5% of their total
labour cost, medium-sized enterprises (50 to 249 persons employed) at 0.7%
and large enterprises (250 or more persons employed) at 0.8%.
Looking at cross country differences in 2015, the pattern of increasing
expenditure with increasing enterprise size holds in most countries; only in a few
countries are exceptions are found. Medium-sized enterprises spend more than
large enterprises in Bulgaria, Luxembourg and Malta. In North Macedonia,
Sweden and the UK both medium- and small enterprises spend more than large
enterprises. In Cyprus and Norway small enterprises spend more than medium-
sized enterprises.
As a share of the total labour cost, the (direct monetary) expenditure gap
between small and large enterprises, is highest in Denmark, Greece, France,
Croatia, Hungary and Poland, where the indicator levels for large enterprises are
(more than) double those of small enterprises. By contrast, in Austria, Bulgaria,
Cyprus, Czechia, Finland, Norway, Slovakia and Slovenia, the absolute
difference in direct monetary expenditure between large and small enterprises is

Continuing vocational training in EU enterprises
66
less than 0.1% of the labour costs and relative differences are less than 20%
(Table A 14 in Annex 2).
The expenditure gap between small and large enterprises changed over
time, but the pattern of change is fragmented (Table A 14 in Annex 2). For 12
countries, as well the EU-28 average, both absolute and relative performance
gaps in direct monetary expenditure between small and large enterprises have
decreased over time. For the EU-28 average, the absolute gap decreased from
0.4 to 0.3 percentage points between 2010 and 2015, while the relative gap
decreased from 80% in 2010 to 60% in 2015. This pattern of declining absolute
and relative performance gaps between small and large enterprises is not
observed in nine other countries (Croatia, Denmark, Estonia, Italy, Lithuania,
Luxembourg, Malta, Norway and Slovakia), where both absolute and relative
gaps in direct monetary expenditure between large enterprises and small
enterprises grew over time. In France, falling absolute gaps in direct expenditure
between large and small enterprises go hand-in-hand with increasing relative
gaps, indicating that direct monetary expenditure as a share of total labour costs
in small firms is now relatively further apart from expenditure levels in large
enterprises. In Portugal a stable absolute gap combined with an increasing
relative gap.
In Figure 22, 2015 enterprises’ direct monetary expenditure on CVT courses
as a share of the total labour costs is broken down according to their economic
sector of activity.
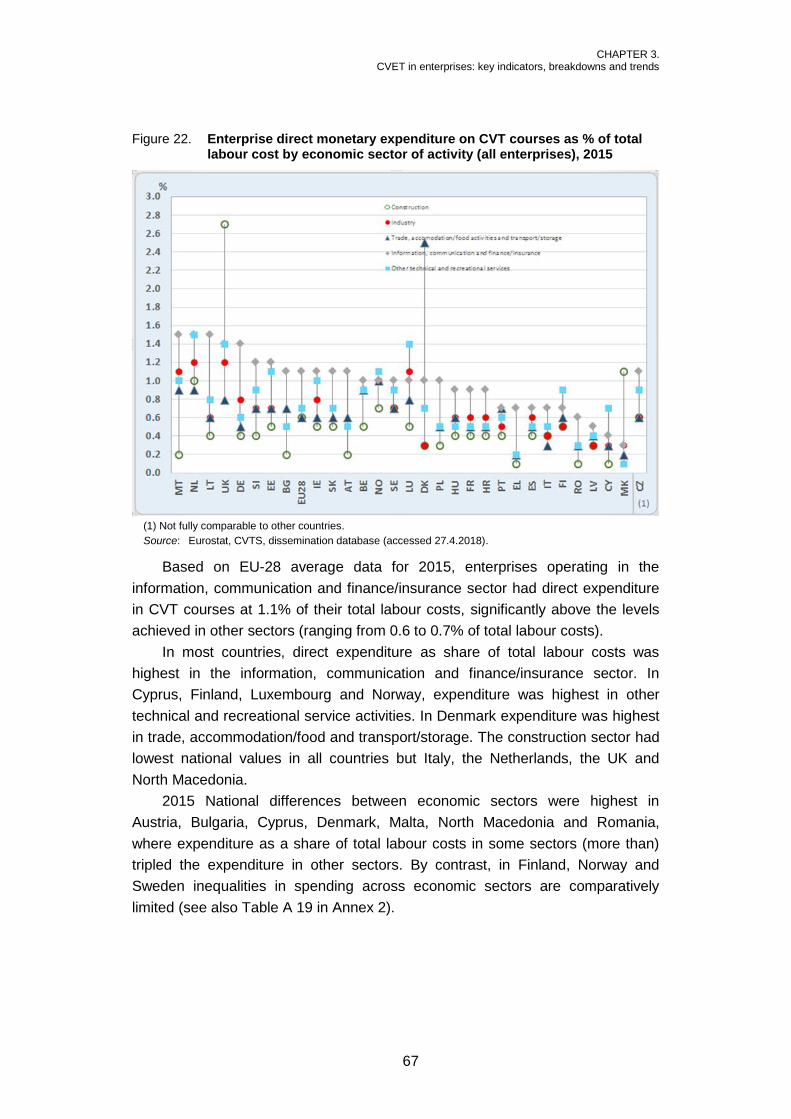
CHAPTER 3. CVET in enterprises: key indicators, breakdowns and trends
67
Figure 22. Enterprise direct monetary expenditure on CVT courses as % of total labour cost by economic sector of activity (all enterprises), 2015
(1) Not fully comparable to other countries.
Source: Eurostat, CVTS, dissemination database (accessed 27.4.2018).
Based on EU-28 average data for 2015, enterprises operating in the
information, communication and finance/insurance sector had direct expenditure
in CVT courses at 1.1% of their total labour costs, significantly above the levels
achieved in other sectors (ranging from 0.6 to 0.7% of total labour costs).
In most countries, direct expenditure as share of total labour costs was
highest in the information, communication and finance/insurance sector. In
Cyprus, Finland, Luxembourg and Norway, expenditure was highest in other
technical and recreational service activities. In Denmark expenditure was highest
in trade, accommodation/food and transport/storage. The construction sector had
lowest national values in all countries but Italy, the Netherlands, the UK and
North Macedonia.
2015 National differences between economic sectors were highest in
Austria, Bulgaria, Cyprus, Denmark, Malta, North Macedonia and Romania,
where expenditure as a share of total labour costs in some sectors (more than)
tripled the expenditure in other sectors. By contrast, in Finland, Norway and
Sweden inequalities in spending across economic sectors are comparatively
limited (see also Table A 19 in Annex 2).
Continuing vocational training in EU enterprises
68
3.4.2. Total monetary expenditure
Total monetary expenditure (TME) is composed of two types of training
expenditure: direct expenditure (as reported in the previous section) and net
contributions. The latter are made up of the cost of contributions made by the
enterprise to collective funding arrangements through government and
intermediary organisations minus receipts from collective funding arrangements,
subsidies and financial assistance from government and other sources.
In some countries CVT efforts are also funded by collective funding
schemes, also called mutualised funding arrangements. Mandatory training funds
at national or sectoral level aim to distribute the costs of training between
employers and/or between employers and staff. They follow different procedures:
for example, they may collect funds from all firms and redistribute them to training
firms or involve train-or-pay schemes, where firms providing training contribute
less and non-training firms contribute more (for overviews see Cedefop, 2008;
Johanson, 2009; Müller and Behringer, 2012). Contributions are fixed costs for
enterprises as these costs are disconnected from whether or not training is
provided.
‘Where collective funding schemes exists, training enterprises receive
financial support in some way from these sources. Beyond these receipts from
funds, training enterprises may receive co-funding for their training activities
typically from public sources, such as national or EU sources’ (Cedefop, 2015,
p. 170). This type of financial support is commonly referred to as ‘receipts’ for
training in the CVTS framework.
Contributions and receipts are not relevant in all countries, but are
substantial in others. ‘At country level, the balance of contributions/receipts is not
necessarily zero. It can be negative because returns on contributions may not
only be receipts or administrative costs but also services (consultancy services,
financing CVT structures used by enterprises, etc. which reduce direct
expenditure). The balance may also be positive if receipts are financed not only
by contributions but also by public subsidies (from the State, the European Social
Funds, etc.)’ (Cedefop, 2015, p. 171).
In discussing the results on total monetary expenditure on training, we
consider again TME expressed as a share of the total labour costs for all
enterprises (Figure 23).

CHAPTER 3. CVET in enterprises: key indicators, breakdowns and trends
69
Figure 23. Enterprise total monetary expenditure on CVT courses as % of total labour cost (all enterprises), 2015 and 2010
(1) No CVTS 4 data available for Ireland and North Macedonia (no participation) and Romania (missing).
(2) Break in time series between CVTS 4 and CVTS 5 for Czechia and Sweden. CVTS 5 data for Czechia are not fully comparable to those of other countries.
Source: Eurostat, CVTS, dissemination database (accessed 27.4.2018); own calculations.
In the EU on average in 2015, TME represented 0.9% of enterprises’ labour
costs, increasing by 0.1 percentage points (or 12.5%) compared to 2010. Looking
at cross country differences and comparing to 2010, TME as a share of the total
labour costs remained stable in six countries (Belgium, Bulgaria, Latvia, Hungary,
the Netherlands and Poland). In other eight countries, 2015 TME as a share of
total labour costs fell by more than 10% compared to 2010; in four of these
countries (Finland, Portugal, Slovakia and Austria) it fell by more than 20%
compared to 2010.
In contrast, significant increases (>20%) in TME as a share of total labour
costs in 2015 are observed in Croatia, Denmark, Estonia, Greece, Italy,
Lithuania, Luxembourg, Norway and the UK.
In 2015, TME varied across enterprise size classes, with large enterprises
generally spending more (Figure 24). Based on EU-28 average data, TME was
estimated at 0.8% of the total labour cost among small enterprises (10 to 49
persons employed), at 0.9% for medium-sized (50 to 249 persons employed) and
at 1% for large enterprises (250 or more persons employed).

Continuing vocational training in EU enterprises
70
Figure 24. Enterprise total monetary expenditure on CVT courses as % of total labour cost by size class (all enterprises), 2015
(1) Not fully comparable to other countries.
Source: Eurostat, CVTS, dissemination database (accessed 27.4.2018); own calculations.
Looking at 2015 cross country differences, only in a few countries does the
break-down of TME by enterprise size class not conform to the pattern of
increasing expenditure with increasing enterprise size. Exceptions, where
medium-sized enterprises spend more than large enterprises, are observed in
Austria, Luxembourg, Malta and North Macedonia. In Sweden and the UK both
medium and small enterprises spend more than large enterprises. In Cyprus,
Norway and Slovakia small enterprises spend more than medium-sized
enterprises. In Finland and Greece small enterprises spend more than both
medium-sized and large enterprises.
For TME as a share of total labour cost, cross country variations in
performance gaps between large and small enterprises in 2015 and in 2010 have
been calculated for analysis, both in absolute and relative terms Table A 15 in
Annex 2).
In 2015, national differences between larger and smaller enterprises
(Table A 15 in Annex 2) are highest in Denmark, where TME as a share of total
labour costs of large sized enterprises is more than five times larger than the
expenditure of small enterprises. Next to Denmark, inequities are also large in
Croatia and Poland where large enterprises’ TME is more than double that of
small enterprises. However, in most countries spending inequities (expressed as

CHAPTER 3. CVET in enterprises: key indicators, breakdowns and trends
71
share of total labour costs) are limited. In Italy, Lithuania, Luxembourg, the
Netherlands, Norway and Slovakia, the absolute difference in total monetary
expenditure between large and small enterprises is less than 0.2% of labour
costs and relative differences are less than 25%. In Bulgaria, Cyprus, Latvia,
Austria and Slovenia small enterprise TME-spending as a share of total labour
costs is at the level of large enterprises, while small enterprises outperform large
enterprises in Greece, Sweden, Finland and the UK.
A final question is whether or not differences in total monetary expenditure
between small and large enterprises have decreased over time (Table A 15 in
Annex 2).
For 12 countries, as well the EU-28 average, both absolute and relative
performance gaps between small and large enterprises have decreased between
2010 and 2015. For the EU-28 average, the absolute gap fell from 0.3 to 0.2
percentage points between 2010 and 2015, while the relative gap fell from 43%
in 2010 to 25% in 2015. This pattern of declining absolute and relative
performance gaps between small and large enterprises is not observed in eight
other countries (Croatia, Denmark, Estonia, Luxembourg, Malta, Norway,
Slovakia and Spain), where both absolute and relative gaps in total monetary
expenditure as a share of total labour costs between large enterprises and small
enterprises grew over time.
In Portugal, falling levels of TME combined with stable relative gaps.
In Italy and Lithuania, an overall increase in TME goes hand-in-hand with
stable absolute gaps and falling relative gaps, indicating that total monetary
expenditure as a share of total labour costs in small firms is now relatively closer
to expenditure levels in large enterprises. Overall this means that relative
expenditure gaps have narrowed in 14 countries.
In France, an overall reduction in TME accompanies increasing relative
gaps, indicating that total monetary expenditure as a share of total labour costs in
small firms is now relatively further apart from expenditure levels in large
enterprises. Overall this means that relative expenditure gaps have increased in
nine countries.
3.5. Summarising EU and national performances:
radar charts and a composite index (SMOP)
Based on CVTS data, this chapter has considered four key dimensions of
analysis to assess performances and progress in employer-sponsored CVT:
incidence, participation, intensity and expenditure. In previous sections, relevant
data were separately analysed. This section brings them together and introduces

Continuing vocational training in EU enterprises
72
a synthetic approach to analysis which is used to summarise the results along
those dimensions. It does so in a comprehensive but more concise and reader-
friendly way. Results are presented for the single countries and the EU as whole.
Four key indicators, one per dimension, are selected to describe
synthetically enterprise performance on CVT. These are:
(a) incidence: enterprises providing any type of CVT as % of all enterprises;
(b) participation: participants in CVT courses as % of persons employed in all
enterprises;
(c) intensity: number of hours of CVT courses per 1 000 hours worked by
persons employed in all enterprises;
(d) expenditure: total monetary expenditure on CVT courses (direct costs plus
contributions minus receipts) as % of total labour costs of all enterprises.
The choice of these indicators is driven by previous methodological work
(Behringer et al., 2008).
Table 8 presents the data for these indicators in 2010 and 2015. The table is
informative, but difficult to read and interpret. Its data have been standardised
(Table 9Table 9) and used to produce the radar charts presented at the end of
this chapter. The standardisation function transforms the 2010 and 2015 country
values into index numbers, ranging from zero to one. It is also applied to the EU
averages.
The standardisation function works as follows. For each indicator, the 2015
most favourable value across countries (the highest single country performance
in 2015) is used as a reference for benchmarking. The value 1 is given to the
best national result for the respective indicator in 2015 (marked in yellow in Table
8). For example, in 2015 Denmark has the highest TME (at 1.5% of its total
labour costs). This is represented by the value 1 for expenditure in Table 9. Other
countries’ results for the expenditure dimension are measured relative to this 1.5
benchmark value: Austria, which had a TME value of 0.8 in 2010, corresponding
to 53% of the 2015 Danish result, is, therefore, represented by the relative value
0.53 in Table 9. Similar calculations are made for every axis and country in the
analysis. Czechia has the highest participation rate in 2015; Latvia performs best
on incidence in 2015, while Belgium has the best intensity rate.
This benchmarking approach makes it possible to compare the CVTS results
of different countries and at different times, by expressing country results along
the same standardised metric.

CHAPTER 3. CVET in enterprises: key indicators, breakdowns and trends
73
Table 8. Key CVT indicators, CVTS 5 (2015) versus CVTS 4 (2010)
incidence participation intensity expenditure
2010 2015 2010 2015 2010 2015 2010 2015
EU-28 65.7 72.6 37.6 40.8 5.8 6.2 0.8 0.9
AT 86.9 88.1 33.2 45.4 6.2 6.5 0.8 0.5
BE 77.6 83.9 51.8 53.9 12.5 13.1 0.9 0.9
BG 31.2 42.2 22 26.5 3.2 4.5 0.6 0.6
CY 71.6 69.5 36.7 33.2 5.2 3.9 0.8 0.7
CZ (2) 72.2 90.6 60.8 83.7 5.2 6.9 0.6 0.7
DE 72.8 77.3 39.5 38.1 5.7 5.5 0.8 0.7
DK 90.9 86.6 37.1 34.6 10.9 5.5 0.7 1.5
EE 67.7 86.1 30.6 31.9 4.7 8.8 0.5 0.8
EL 27.8 21.7 16.3 18.5 1.7 3 0.5 0.6
ES 74.9 86 48.3 55.4 6 7.2 0.8 0.9
FI 74.4 83.1 40.2 43.8 5.7 5.1 0.8 0.5
FR 76.1 78.9 45.4 48.3 8 8.3 1.6 1.4
HR 57.1 55.4 22.5 28.7 1.5 4 0.4 0.6
HU 48.7 43.8 19 19.4 3.5 3 1.4 1.4
IE (1) 77.4 49.7 11.9 0.8
IT 55.6 60.2 36 45.9 5.5 6.3 0.4 0.5
LT 51.9 61.6 18.6 25.6 4 3.1 0.5 0.7
LU 70.8 77.1 51.1 61.8 10.9 12.2 0.6 0.8
LV 40.4 99.9 24.2 27.2 2.1 3.1 0.4 0.4
MK 61.9 22 2.6 0.3
MT 53.9 61.6 35.8 35.8 8 7.8 1.4 1.2
NL 78.6 85 38.6 41.4 9.2 9 1.2 1.3
NO 96.8 99.1 45.8 54.3 9.2 7.7 0.7 0.9
PL 22.5 44.7 30.5 37.1 4 4.8 0.5 0.5
PT 64.6 75 39.8 46.3 10.3 7.9 0.7 0.5
RO (1) 24.1 26.7 17.8 21.3 3.8 4.4 0.3
SE (2) 87 93.1 47.1 52.2 7 7 0.9 0.8
SI 68 84.1 43.1 58.3 9 8.4 0.6 0.7
SK 69 70 43.6 56.8 7.3 6.5 0.9 0.7
UK 80.4 85.7 30.6 30.4 4 5.3 0.7 1.3
(1) CVTS 4 data are not available for Ireland and North Macedonia (no participation in CVTS 4) and partly for Romania (missing expenditure data).
(2) CVTS 5 Data for Czechia and Sweden are not comparable over time (break in time series between CVTS 4 and CVTS 5). CVTS 5 data for Czechia on expenditure are not fully comparable to those for other countries.
Source: Eurostat, CVTS, dissemination database (accessed 27.4.2018); own calculations.

Continuing vocational training in EU enterprises
74
Table 9. Key CVT indicators, standardised results relative to the 2015 best performing countries, 2015 and 2010
incidence participation intensity expenditure
2010 2015 2010 2015 2010 2015 2010 2015
EU-28 0.66 0.73 0.45 0.49 0.44 0.47 0.53 0.60
AT 0.87 0.88 0.40 0.54 0.47 0.50 0.53 0.33
BE 0.78 0.84 0.62 0.64 0.95 1.00 0.60 0.60
BG 0.31 0.42 0.26 0.32 0.24 0.34 0.40 0.40
CY 0.72 0.70 0.44 0.40 0.40 0.30 0.53 0.47
CZ (3) 0.72 0.91 0.73 1.00 0.40 0.53 0.40 0.47
DE 0.73 0.77 0.47 0.46 0.44 0.42 0.53 0.47
DK 0.91 0.87 0.44 0.41 0.83 0.42 0.47 1.00
EE 0.68 0.86 0.37 0.38 0.36 0.67 0.33 0.53
EL 0.28 0.22 0.19 0.22 0.13 0.23 0.33 0.40
ES 0.75 0.86 0.58 0.66 0.46 0.55 0.53 0.60
FI 0.74 0.83 0.48 0.52 0.44 0.39 0.53 0.33
FR 0.76 0.79 0.54 0.58 0.61 0.63 1.07 0.93
HR 0.57 0.55 0.27 0.34 0.11 0.31 0.27 0.40
HU 0.49 0.44 0.23 0.23 0.27 0.23 0.93 0.93
IE (1) 0.77 0.59 0.91 0.53
IT 0.56 0.60 0.43 0.55 0.42 0.48 0.27 0.33
LT 0.52 0.62 0.22 0.31 0.31 0.24 0.33 0.47
LU 0.71 0.77 0.61 0.74 0.83 0.93 0.40 0.53
LV 0.40 1.00 0.29 0.32 0.16 0.24 0.27 0.27
MK (1) 0.62 0.26 0.20 0.20
MT 0.54 0.62 0.43 0.43 0.61 0.60 0.93 0.80
NL 0.79 0.85 0.46 0.49 0.70 0.69 0.80 0.87
NO 0.97 0.99 0.55 0.65 0.70 0.59 0.47 0.60
PL 0.23 0.45 0.36 0.44 0.31 0.37 0.33 0.33
PT (2) 0.65 0.75 0.48 0.55 0.79 0.60 0.47 0.33
RO 0.24 0.27 0.21 0.25 0.29 0.34 0.20
SE (3) 0.87 0.93 0.56 0.62 0.53 0.53 0.60 0.53
SI 0.68 0.84 0.51 0.70 0.69 0.64 0.40 0.47
SK 0.69 0.70 0.52 0.68 0.56 0.50 0.60 0.47
UK 0.80 0.86 0.37 0.36 0.31 0.40 0.47 0.87
(1) CVTS 4 data are not available for Ireland and North Macedonia (no participation in CVTS 4) and partly for Romania (missing expenditure data).
(2) CVTS 5 Data for Czechia and Sweden are not comparable over time (break in time series between CVTS 4 and CVTS 5). CVTS 5 data for Czechia on expenditure are not fully comparable to those for other countries.
Source: Eurostat, CVTS, dissemination database (accessed 27.4.2018); own calculations.
Standardised data in Table 9 have been used to produce the radar charts
presented at the end of the chapter.

CHAPTER 3. CVET in enterprises: key indicators, breakdowns and trends
75
Radar charts can be used to identify specific patterns of statistical data as
well as benchmarking tools for comparative analysis in two senses:
(a) radar charts provide an intuitive presentation of multiple performance
indicators and related development over time;
(b) their surface area, formed by the axes, can be used as a composite and
synthetic performance indicator, i.e. the SMOP.
The SMOP (Mosley and Mayer, 1999) is calculated from the mathematical
formula for the area of a polygon: in this case – with four indicators – the results
can be regarded as four triangles with angles of 90 degrees. SMOP values
typically range between a minimum of 0 and a maximum of 2. The SMOP for a
given country at a given point in time is calculated as
where P1, P2, P3 and P4 represent the standardised values of each selected
indicator. The SMOP is a quantitative indicator of the overall CVT performance of
companies in a given country. It is not an absolute measure as its values are
relative to those for other countries. It should be considered as an indication,
used mainly for descriptive and summary purposes, with the merits and
limitations of any other composite index. Additional graphs or analysis should be
used to complement the findings.
For the EU-28, the composite CVT performance indicator (surface measure
of overall performance or SMOP) increased from 0.48 in 2010 to 0.58 in 2015,
showing an increase of 10 percentage points or 21% over the 2010 baseline.
Overall performance in 2015 varies between 0.12 in Greece and Romania and
1.02 in Belgium.
Figure 25 illustrates developments over time and cross country differences.
Countries are ordered according to the evolution of the composite indicator
between 2010 and 2015. The evolution is characterised as stable if the relative
change in SMOP compared to 2010 is 10% or less. Positive or negative changes
by more than 10% are indicated as increases or decreases.
SMOP = ((P1*P2) + (P2*P3) +(P3*P4) + (P4*P1)) * sin 90°/2

Continuing vocational training in EU enterprises
76
Figure 25. Overall performance on CVT, SMOP index, 2015 and 2010
(1) CVTS 4 data are not available for Ireland and North Macedonia (no participation in CVTS 4) and partly for
Romania (missing data on expenditure) preventing the calculations of SMOP for 2010.
(2) CVTS 5 Data for Czechia and Sweden are not comparable over time (break in time series between CVTS 4 and CVTS 5). CVTS 5 data for Czechia on expenditure are not fully comparable to those for other countries.
Source: Eurostat, CVTS, dissemination database (accessed 27.4.2018); own calculations.
Belgium turns out to be the top performer in 2015, having the highest SMOP
value. While the top five countries remained the same, Luxembourg jumps from
fifth place in 2010 to second place in 2015. Luxembourg reports improvements in
all four key indicators, most strongly in expenditure (+33%) and participation
(+21%), while intensity rose by 12% and incidence by 9%.
For 15 countries (Bulgaria, Croatia, Denmark, Estonia, Greece, Italy, Latvia,
Lithuania, Luxembourg, the Netherlands, Norway, Poland, Slovenia, Spain and
the UK), as well as the EU average, an increase in overall performance of more
than 10% is observed. Estonia and the UK improved their country rankings the
most. Both countries combine strong increases in expenditure with strong
increases in training intensity and relatively stable participation rates.
Positive progresses involved most of the countries which had particularly low
scores in 2010 (Bulgaria, Greece, Croatia, Latvia, Lithuania and Poland). In
Greece, however, the relative increase of the SMOP of above 10% must be
interpreted with caution as it is due to a low base effect: measured in absolute
terms the progress is small and unable to raise substantially the overall low
performance of the country. The largest relative increase in SMOP (from 0.14 to
0.33, or +133%) is seen in Latvia, mainly due to a large increase in training

CHAPTER 3. CVET in enterprises: key indicators, breakdowns and trends
77
incidence through the provision of guided on-the-job training. In Croatia strong
increases in enterprise CVT expenditure (+50%) are combined with strong
increases in training intensity (+167%), increases in participation rates (+28%)
and relatively stable incidence rates. In Poland the incidence rate doubled and
participation and intensity rose by respectively 22% and 20%. Despite the
progress, overall performance remains quite low in these countries compared to
others.
For six countries the overall performance did not change more than 10%
between 2010 and 2015, so their SMOP can be considered as fairly stable at
high levels (Belgium and France) or medium levels (Germany, Malta, Slovakia
and Austria). In Malta, Austria and Slovakia the overall stability of the SMOP
hides strong declining expenditure levels compensated by increases in other
dimensions. This is an indication that rising or declining spending levels are not
per se an indication of rising or declining CVT performance but that effectiveness
and efficiency have to be considered.
Overall performance fell by more than 10% between 2010 and 2015 in four
countries: Hungary, Portugal, Finland (with falls between 11 and 13%), and
Cyprus (at -21%). Nevertheless their 2015 SMOP levels still stand above 0.3. In
2010, Cyprus overall performance was in line with the EU-28 average. Since then
expenditure levels have dropped by 21%, with remarkable reductions in
incidence, participation and, more important, in training intensity (-25%). In
Hungary expenditure levels and participation rates remained stable, but training
provision dropped by 10% and training intensity fell 14%. In Portugal and Finland,
the drop in SMOP values between 2010 and 2015 is due to reductions in training
intensity and training expenditure.
Developments over time could not be assessed in a few countries: Ireland
and North Macedonia (as they did not participate in CVTS 4), in Romania (no
expenditure data were available in CVTS 4, preventing the calculation of the
2010 SMOP); Czechia and Sweden (a break in time series is reported in CVTS 5,
so results cannot be fully compared across CVTS waves).
Table 10 ranks countries according to the value of the composite index in
2015. It provides an even finer distinction of its changes over time. It also
supports an interpretation of those against the backdrop of the changes in the
underlying indicators. The evolution in performance between 2010 and 2015 is
marked by the following colour scheme.
Strong
decline
Moderate
decline
Moderate
increase
Strong
increase
Indicator evolution
Declining by >20%
Declining by 10-20%
Increasing by 10-20%
Increasing by >20%

Continuing vocational training in EU enterprises
78
Composite indicator evolution
Declining by >10%
Declining by 5-10%
Increasing by 5-10%
Increasing by >10%
Table 10. Incidence, participation, intensity, expenditure and overall performance (SMOP index) in 2015 and 2010
incidence participation intensity expenditure SMOP
2010 2015 2010 2015 2010 2015 2010 2015 2010 2015
BE 77.6 83.9 51.8 53.9 12.5 13.1 0.9 0.9 1.05 1.14
LU 70.8 77.1 51.1 61.8 10.9 12.2 0.6 0.8 0.78 1.08
FR 76.1 78.9 45.4 48.3 8 8.3 1.6 1.4 1.10 1.07
NL 78.6 85 38.6 41.4 9.2 9 1.2 1.3 0.94 1.05
CZ (2) 90.6 83.7 6.9 0.7 1.05
NO 96.8 99.1 45.8 54.3 9.2 7.7 0.7 0.9 0.85 0.99
IE (1) 77.4 49.7 11.9 0.8 0.95
DK 90.9 86.6 37.1 34.6 10.9 5.5 0.7 1.5 0.79 0.91
ES 74.9 86.0 48.3 55.4 6.0 7.2 0.8 0.9 0.67 0.89
SI 68.0 84.1 43.1 58.3 9 8.4 0.6 0.7 0.63 0.86
SE (2) 93.1 52.2 7 0.8 0.85
UK 80.4 85.7 30.6 30.4 4.0 5.3 0.7 1.3 0.46 0.78
MT 53.9 61.6 35.8 35.8 8 7.8 1.4 1.2 0.78 0.74
EE 67.7 86.1 30.6 31.9 4.7 8.8 0.5 0.8 0.36 0.70
SK 69 70 43.6 56.8 7.3 6.5 0.9 0.7 0.70 0.69
EU-28 65.7 72.6 37.6 40.8 5.8 6.2 0.8 0.9 0.54 0.65
AT 86.9 88.1 33.2 45.4 6.2 6.5 0.8 0.5 0.62 0.60
PT 64.6 75.0 39.8 46.3 10.3 7.9 0.7 0.5 0.68 0.60
DE 72.8 77.3 39.5 38.1 5.7 5.5 0.8 0.7 0.58 0.55
FI 74.4 83.1 40.2 43.8 5.7 5.1 0.8 0.5 0.60 0.52
IT 55.6 60.2 36.0 45.9 5.5 6.3 0.4 0.5 0.34 0.48
CY 71.6 69.5 36.7 33.2 5.2 3.9 0.8 0.7 0.54 0.43
HU 48.7 43.8 19 19.4 3.5 3.0 1.4 1.4 0.44 0.39
LV 40.4 99.9 24.2 27.2 2.1 3.1 0.4 0.4 0.16 0.37
LT 51.9 61.6 18.6 25.6 4.0 3.1 0.5 0.7 0.23 0.33
HR 57.1 55.4 22.5 28.7 1.5 4.0 0.4 0.6 0.18 0.32
PL 22.5 44.7 30.5 37.1 4.0 4.8 0.5 0.5 0.19 0.32
BG 31.2 42.2 22.0 26.5 3.2 4.5 0.6 0.6 0.18 0.27
MK (1) 61.9 22 2.6 0.3 0.19
EL 27.8 21.7 16.3 18.5 1.7 3.0 0.5 0.6 0.11 0.14
RO (1) 24.1 26.7 17.8 21.3 3.8 4.4 0.3 0.14
(1) CVTS 4 data are not available for Ireland and North Macedonia (no participation in CVTS 4) and partly for Romania (missing data on expenditure) preventing the calculations of SMOP for 2010.
(2) CVTS 5 Data for Czechia and Sweden are not comparable over time (break in time series between CVTS 4 and CVTS 5). CVTS 5 data for Czechia on expenditure are not fully comparable to those for other countries.
Source: Eurostat, CVTS, dissemination database (accessed 27.4.2018); own calculations.

CHAPTER 3. CVET in enterprises: key indicators, breakdowns and trends
79
Figures 26 to 56 show the performance of key CVT indicators, CVTS 5
(2015) versus CVTS 4 (2010), standardised values (1=2015 maximum value in
each indicator across EU countries).
Figure 26. Performance of key CVT indicators, EU-28
Source: Own calculation based on Eurostat, CVTS 5 and CVTS 4 data.

Continuing vocational training in EU enterprises
80
Figure 27. Performance of key CVT indicators, Austria
Source: Own calculation based on Eurostat, CVTS 5 and CVTS 4 data.
Figure 28. Performance of key CVT indicators, Belgium
Source: Own calculation based on Eurostat, CVTS 5 and CVTS 4 data.

CHAPTER 3. CVET in enterprises: key indicators, breakdowns and trends
81
Figure 29. Performance of key CVT indicators, Bulgaria
Source: Own calculation based on Eurostat, CVTS 5 and CVTS 4 data.
Figure 30. Performance of key CVT indicators, Croatia
Source: Own calculation based on Eurostat, CVTS 5 and CVTS 4 data.
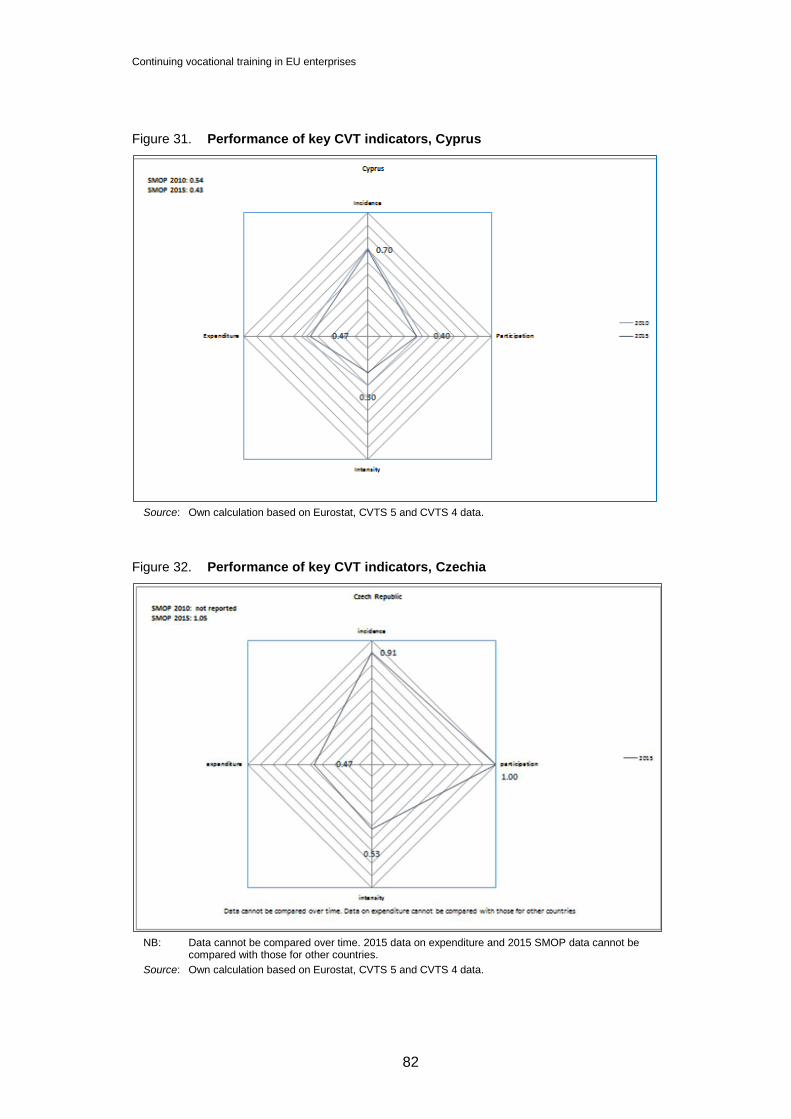
Continuing vocational training in EU enterprises
82
Figure 31. Performance of key CVT indicators, Cyprus
Source: Own calculation based on Eurostat, CVTS 5 and CVTS 4 data.
Figure 32. Performance of key CVT indicators, Czechia
NB: Data cannot be compared over time. 2015 data on expenditure and 2015 SMOP data cannot be
compared with those for other countries.
Source: Own calculation based on Eurostat, CVTS 5 and CVTS 4 data.

CHAPTER 3. CVET in enterprises: key indicators, breakdowns and trends
83
Figure 33. Performance of key CVT indicators, Denmark
Source: Own calculation based on Eurostat, CVTS 5 and CVTS 4 data.
Figure 34. Performance of key CVT indicators, Estonia
Source: Own calculation based on Eurostat, CVTS 5 and CVTS 4 data.

Continuing vocational training in EU enterprises
84
Figure 35. Performance of key CVT indicators, Finland
Source: Own calculation based on Eurostat, CVTS 5 and CVTS 4 data.
Figure 36. Performance of key CVT indicators, France
Source: Own calculation based on Eurostat, CVTS 5 and CVTS 4 data.

CHAPTER 3. CVET in enterprises: key indicators, breakdowns and trends
85
Figure 37. Performance of key CVT indicators, Germany
Source: Own calculation based on Eurostat, CVTS 5 and CVTS 4 data.
Figure 38. Performance of key CVT indicators, Greece
Source: Own calculation based on Eurostat, CVTS 5 and CVTS 4 data.

Continuing vocational training in EU enterprises
86
Figure 39. Performance of key CVT indicators, Hungary
Source: Own calculation based on Eurostat, CVTS 5 and CVTS 4 data.
Figure 40. Performance of key CVT indicators, Ireland
NB: 2010 data not available.
Source: Own calculation based on Eurostat, CVTS 5 and CVTS 4 data.
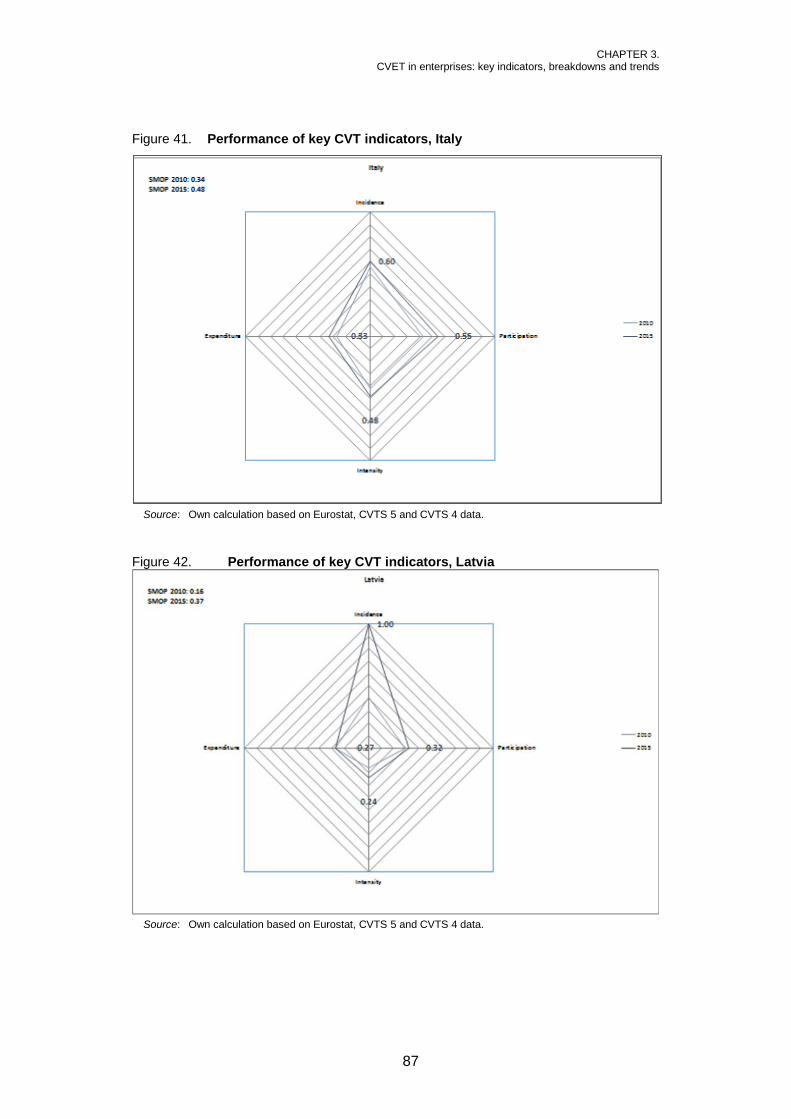
CHAPTER 3. CVET in enterprises: key indicators, breakdowns and trends
87
Figure 41. Performance of key CVT indicators, Italy
Source: Own calculation based on Eurostat, CVTS 5 and CVTS 4 data.
Figure 42. Performance of key CVT indicators, Latvia
Source: Own calculation based on Eurostat, CVTS 5 and CVTS 4 data.

Continuing vocational training in EU enterprises
88
Figure 43. Performance of key CVT indicators, Lithuania
Source: Own calculation based on Eurostat, CVTS 5 and CVTS 4 data.
Figure 44. Performance of key CVT indicators, Luxembourg
Source: Own calculation based on Eurostat, CVTS 5 and CVTS 4 data.
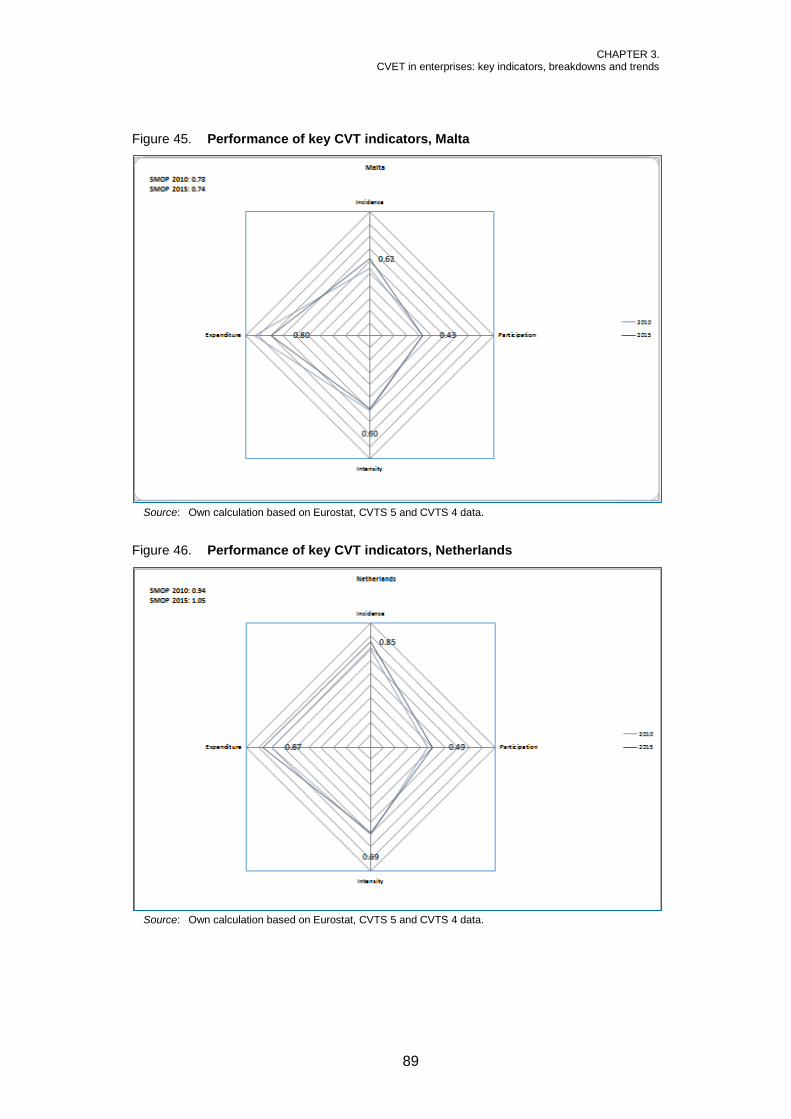
CHAPTER 3. CVET in enterprises: key indicators, breakdowns and trends
89
Figure 45. Performance of key CVT indicators, Malta
Source: Own calculation based on Eurostat, CVTS 5 and CVTS 4 data.
Figure 46. Performance of key CVT indicators, Netherlands
Source: Own calculation based on Eurostat, CVTS 5 and CVTS 4 data.
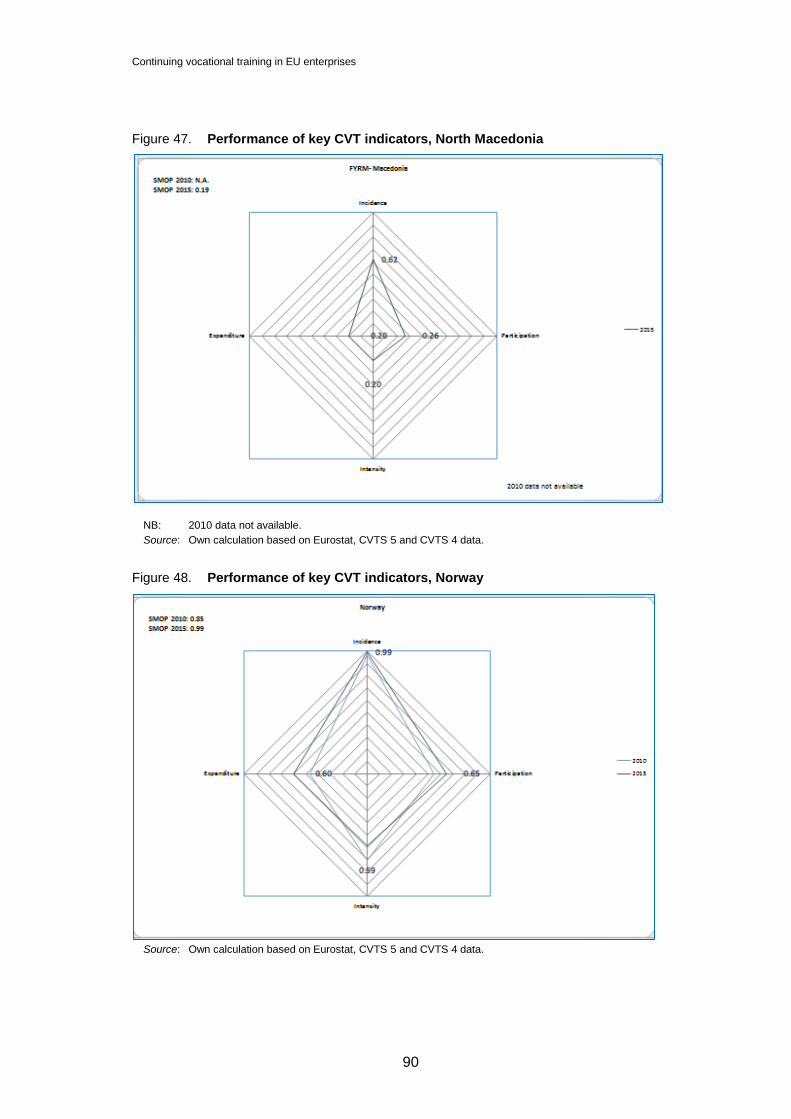
Continuing vocational training in EU enterprises
90
Figure 47. Performance of key CVT indicators, North Macedonia
NB: 2010 data not available.
Source: Own calculation based on Eurostat, CVTS 5 and CVTS 4 data.
Figure 48. Performance of key CVT indicators, Norway
Source: Own calculation based on Eurostat, CVTS 5 and CVTS 4 data.

CHAPTER 3. CVET in enterprises: key indicators, breakdowns and trends
91
Figure 49. Performance of key CVT indicators, Poland
Source: Own calculation based on Eurostat, CVTS 5 and CVTS 4 data.
Figure 50. Performance of key CVT indicators, Portugal
Source: Own calculation based on Eurostat, CVTS 5 and CVTS 4 data.

Continuing vocational training in EU enterprises
92
Figure 51. Performance of key CVT indicators, Romania
NB: Data on 2010 expenditure are not available and prevent the calculation of the 2010 SMOP.
Source: Own calculation based on Eurostat, CVTS 5 and CVTS 4 data.
Figure 52. Performance of key CVT indicators, Slovakia
Source: Own calculation based on Eurostat, CVTS 5 and CVTS 4 data.

CHAPTER 3. CVET in enterprises: key indicators, breakdowns and trends
93
Figure 53. Performance of key CVT indicators, Slovenia
Source: Own calculation based on Eurostat, CVTS 5 and CVTS 4 data.
Figure 54. Performance of key CVT indicators, Spain
Source: Own calculation based on Eurostat, CVTS 5 and CVTS 4 data.
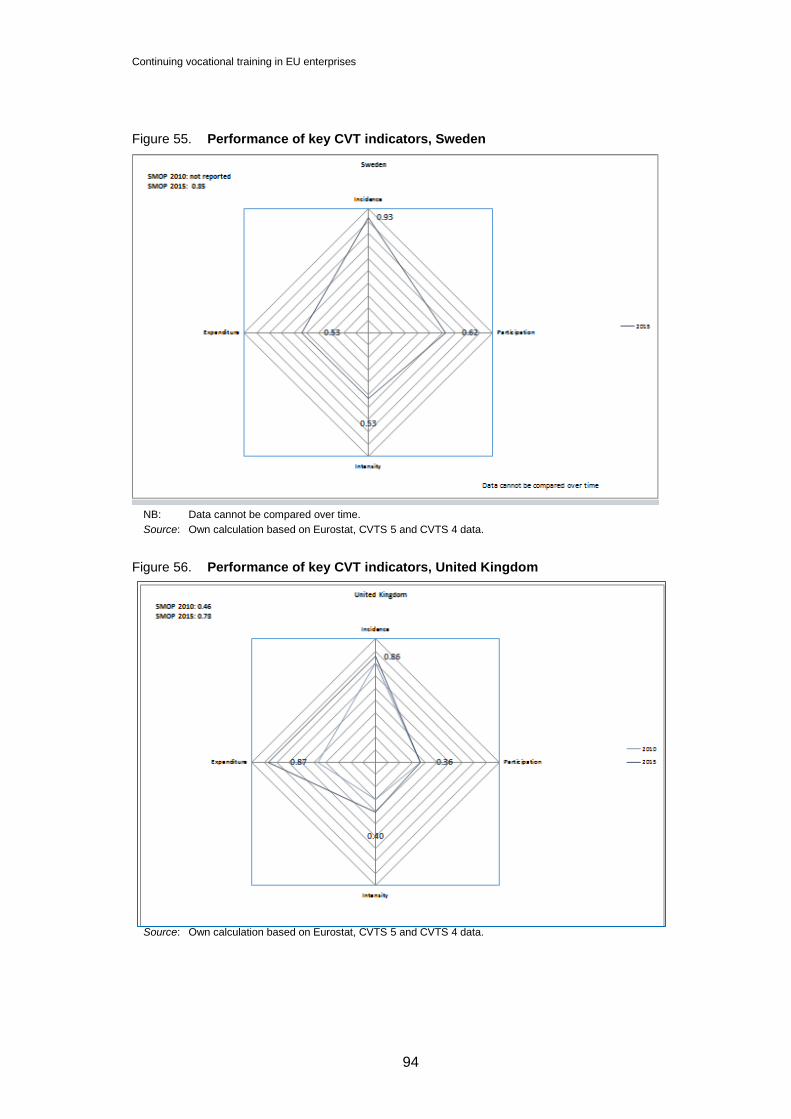
Continuing vocational training in EU enterprises
94
Figure 55. Performance of key CVT indicators, Sweden
NB: Data cannot be compared over time.
Source: Own calculation based on Eurostat, CVTS 5 and CVTS 4 data.
Figure 56. Performance of key CVT indicators, United Kingdom
Source: Own calculation based on Eurostat, CVTS 5 and CVTS 4 data.
95
CHAPTER 4. Main skills needs in enterprises
CVTS provides policy-relevant data on the main skill needs identified by
employers in the EU, in two different ways. A common battery of items (skills
bundles) is used for reporting on:
(a) main skills considered important for the development of enterprises in the
near future;
(b) main skills targeted by employer-sponsored CVT courses.
This allows relating the perceived importance of skills for the future of
companies in the EU to training course provision which actually occurred in the
reference year. Questions on main skills considered important in the near future
are answered by all enterprises, while questions on main skills targeted by CVT
courses are only asked of enterprises that provide CVT courses in the reference
year of the survey.
Question A12 of the European standard questionnaire (Eurostat, 2016) has
particular information on the skills and competences considered most important
for the development of the enterprise in the next few years. The question
presents a battery of 12 selected skills items (skills bundles), including an item
‘other’. In CVTS 4, respondents were asked to state whether or not each item
was deemed important. This was changed in CVTS 5 and respondents were
asked to state only the three most important items. This change in the survey
strategy implies a break in time series, limiting the comparison of results between
CVTS 4 and CVTS 5. Data for Sweden were not available due to low reliability.
The same battery of items (skills bundles) is used in CVTS 5 to survey the
content of the training provided by employers in question C5 of the European
standard questionnaire (Eurostat, 2016). Training enterprises are asked to
indicate from a list, the three most important skills/competences targeted in their
CVT courses. Identification of the three most important items is based on the
number of training hours sponsored during the reference year of the survey. A
methodological change occurred in CVTS 5, limiting comparability over time of
the relevant data. In CVTS 4, enterprises were asked to indicate from the list all
the skills bundles for which they sponsored CVT courses; in CVTS 5 the focus
was on the three most important ones. Data for Czechia (low reliability) and
Greece on main skills targeted by CVT courses were not available at the moment
of data extraction.

Continuing vocational training in EU enterprises
96
It is important to note that CVTS 5 results on skills considered important by
employers and skills targeted in their CVT courses no longer offer a
comprehensive view of enterprises’ skills needs. Enterprises only indicate, as
part of their answers, the skills bundles which they identify as the three most
important ones. Skill bundles that rank lower in their priority are no longer
reported and they are not present in the calculation of the indicators.
4.1. Main skill needs at the EU-28 level
Figure 57 and Figure 58 present the CVTS 5 estimates for the EU-28, excluding
data for Norway and North Macedonia, as well as those countries for which data
were unavailable. Given their weight among all enterprises, overall figures
strongly reflect the position of small enterprises.
When enterprises in the EU-28 are asked to declare the three skills bundles
they consider most important for their development in the near future, technical,
practical or job-specific skills come out on top, selected by 46% of enterprises.
Skills/competences in customer handling and teamwork are prioritised by 41% of
all enterprises. Other general skills such as problem-solving (26%) and
management skills (25%) complete the top four skills bundles. Information
technology (IT) skills, general and specialised IT skills are rated as most
important in the years to come by 21% (general IT) and 12% (professional IT) of
enterprises. Skills in office administration are listed in the top three skill needs in
the years to come by one out of seven enterprises (14%). Oral and written
communication, foreign language and literacy and numeracy are skills that are
less often (6% to 11%) indicated as most important for enterprises’ future
development.

CHAPTER 4. Main skills needs in enterprises
97
Figure 57. Main skills considered important in the near future, EU-28 average, 2015, % of enterprises quoting each option
NB: Enterprises were asked to indicate the three most important skills bundles for their development in
the near future. % values are percentages of enterprises quoting each option as one of the three most important skills bundles.
Source: Eurostat, CVTS, dissemination database (accessed 6.2.2018); own calculation.

Continuing vocational training in EU enterprises
98
Figure 58. Main skills targeted in CVT courses, EU-28 average, 2015, % of training enterprises quoting each option
NB: Training enterprises were asked to indicate the three most important skills bundles targeted in their
CVT courses (based on hours of training sponsored). % values are percentages of enterprises quoting each option as one of the three most important skills bundles.
Source: Eurostat, CVTS, dissemination database (accessed 6.2.2018); own calculations.
The importance of technical, practical or job-specific skills for enterprise
development in the next few years is often combined with priority provision of
related training courses: 65% of training enterprises state that skills in this
domain are a priority in their CVT course provision (among the three most
important skills/competences targeted by their CVT courses in relation to the
number of hours of training). A significantly smaller proportion of training
enterprises indicate that skills in customer handling (26%), management (23%)
and teamwork (20%) are among their top-three skills trained. Skills that are less
frequently prioritised in course provision are those in office administration (13%),
as well as general (13%) and specialised IT skills (10%). Least prioritised
subjects in CVT-course provision are foreign languages (8%), oral and written
communication skills (4%) and literacy and numeracy skills (1%).

CHAPTER 4. Main skills needs in enterprises
99
Figure 59. Main skills considered important in the near future by enterprise size class, EU-28 average, 2015, % of enterprises quoting each option
NB: Enterprises were asked to indicate the three most important skills bundles for their development in
the near future. % values are percentages of small, medium and large enterprises quoting each option as one of the three most important skills bundles. Range: absolute range in 2015 (this is the difference between the maximum and minimum indicator values across enterprise size classes in 2015). Relative range: relative range in 2015 (this is the absolute range expressed as a percentage of the minimum indicator value across enterprise size classes in 2015).
Source: Eurostat, CVTS, dissemination database (accessed 6.2.2018); own calculations.
The strategic importance of the different skills bundles shows small
variability across enterprise size classes at EU level in 2015 (Figure 59). Only for
management skills are there large differences between size classes; their
importance for future enterprise development rises with enterprise size. Some
differences can also be noted with respect to technical, practical or job-specific
skills, foreign language and professional IT skills, with large enterprises indicating
them as important more often than medium and small enterprises. Small
enterprises identify customer handling, team working, and office administration
skills as main skill needs more often than medium-sized and large enterprises,
but differences are quite small. General IT skills are more forward as main skill
needs put by medium-sized enterprises than small and large enterprises. For
skills related to problem-solving, oral and written communication and literacy and
numeracy, differences in the perceived importance between small, medium and
large enterprises are estimated to be negligible.
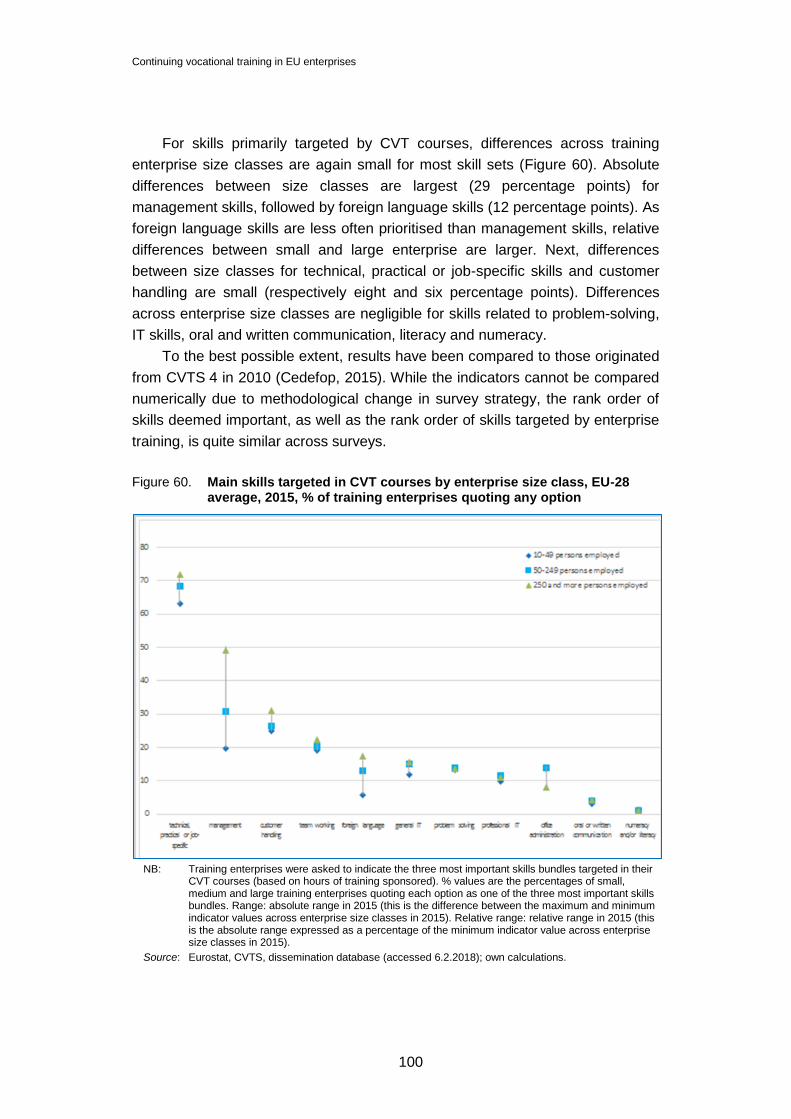
Continuing vocational training in EU enterprises
100
For skills primarily targeted by CVT courses, differences across training
enterprise size classes are again small for most skill sets (Figure 60). Absolute
differences between size classes are largest (29 percentage points) for
management skills, followed by foreign language skills (12 percentage points). As
foreign language skills are less often prioritised than management skills, relative
differences between small and large enterprise are larger. Next, differences
between size classes for technical, practical or job-specific skills and customer
handling are small (respectively eight and six percentage points). Differences
across enterprise size classes are negligible for skills related to problem-solving,
IT skills, oral and written communication, literacy and numeracy.
To the best possible extent, results have been compared to those originated
from CVTS 4 in 2010 (Cedefop, 2015). While the indicators cannot be compared
numerically due to methodological change in survey strategy, the rank order of
skills deemed important, as well as the rank order of skills targeted by enterprise
training, is quite similar across surveys.
Figure 60. Main skills targeted in CVT courses by enterprise size class, EU-28 average, 2015, % of training enterprises quoting any option
NB: Training enterprises were asked to indicate the three most important skills bundles targeted in their
CVT courses (based on hours of training sponsored). % values are the percentages of small, medium and large training enterprises quoting each option as one of the three most important skills bundles. Range: absolute range in 2015 (this is the difference between the maximum and minimum indicator values across enterprise size classes in 2015). Relative range: relative range in 2015 (this is the absolute range expressed as a percentage of the minimum indicator value across enterprise size classes in 2015).
Source: Eurostat, CVTS, dissemination database (accessed 6.2.2018); own calculations.

CHAPTER 4. Main skills needs in enterprises
101
4.2. Main skill needs in countries
This section focuses on the identification of cross country differences in main
skills considered important by enterprises and main skills targeted by employer-
sponsored CVT courses.
Table 11 focuses on cross country differences in main skills considered
important by enterprises for their future development. To facilitate cross country
comparisons, Table 11 highlights the three skills bundles that are most frequently
indicated by enterprises as being among the most important ones for their
development. To do this, the following colour scheme (with the EU-28 average
used as an example here below) is adopted for each country in Table 11.
Most frequent skills bundle considered important for enterprises’ future development
Second most frequent skills bundle considered important for enterprise future development
Third most frequent skills bundle considered important for enterprise future development
EU-28 technical, practical or job-specific skills
customer handling skills
team working skills
Based on available 2015 data, a clear pattern emerges and three sets of skill
bundles clearly dominate in almost all countries. These are technical, practical or
job-specific skills, customer handling skills and team working skills. The share of
enterprises that indicated the bundle of technical, practical or job-specific skills as
one of three most important ranges from 65% in France to 21% in Spain. For
customer handling skills, values range from 68% of enterprises in Cyprus to 22%
in Croatia. Values for team working skills range from 73% of enterprises in
Romania to 23% in Slovakia.

Continuing vocational training in EU enterprises
102
Table 11. Main skills considered important in the near future: 2015, % of enterprises quoting each option
Technical,
practical
or job-
specific
Customer
handling
Team
working
Problem-
solving
Management General
IT
Office
administration
Prof.
IT
Foreign
language
Oral or written
communication
Numeracy
and/or
literacy
Other
EU-28 46 41 41 26 25 21 14 12 11 8 6 4
AT 46 55 61 29 16 19 9 8 11 18 2 7
BE 61 45 39 29 16 27 9 6 11 8 2 0
BG 64 47 62 21 7 21 5 11 10 6 8 1
CY 44 68 59 31 16 21 6 11 16 9 3
CZ 42 34 34 24 13 20 7 5 15 19 12
DE 47 45 45 28 13 31 13 8 8 5 2 5
DK 46 45 35 20 31 29 7 14 6 10 4 4
EE 58 39 48 29 23 20 4 12 18 7 3 4
EL 50 48 33 22 15 29 6 18 20 9 1 1
ES 21 50 58 31 50 10 16 7 15 2 0 1
FI 47 55 39 22 42 17 11 11 5 4 2 6
FR 65 31 35 23 30 11 15 12 9 6 6 6
HR 47 22 31 20 18 41 15 8 19 4 3 9
HU 34 26 39 33 8 20 7 19 16 8 5 4
IE 48 56 48 16 36 24 14 11 2 11 4 10
IT 48 40 32 27 28 16 15 20 17 2 1 1
LT 47 45 44 28 31 35 2 11 19 4 4 1
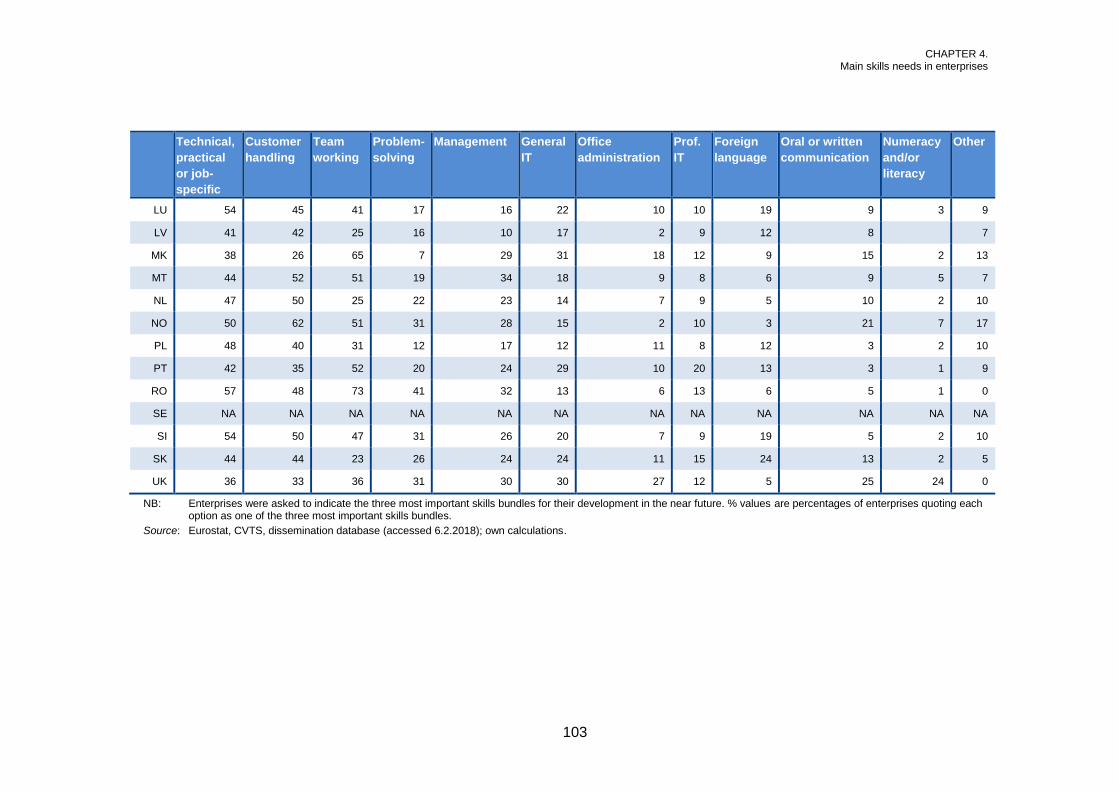
CHAPTER 4. Main skills needs in enterprises
103
Technical,
practical
or job-
specific
Customer
handling
Team
working
Problem-
solving
Management General
IT
Office
administration
Prof.
IT
Foreign
language
Oral or written
communication
Numeracy
and/or
literacy
Other
LU 54 45 41 17 16 22 10 10 19 9 3 9
LV 41 42 25 16 10 17 2 9 12 8 7
MK 38 26 65 7 29 31 18 12 9 15 2 13
MT 44 52 51 19 34 18 9 8 6 9 5 7
NL 47 50 25 22 23 14 7 9 5 10 2 10
NO 50 62 51 31 28 15 2 10 3 21 7 17
PL 48 40 31 12 17 12 11 8 12 3 2 10
PT 42 35 52 20 24 29 10 20 13 3 1 9
RO 57 48 73 41 32 13 6 13 6 5 1 0
SE NA NA NA NA NA NA NA NA NA NA NA NA
SI 54 50 47 31 26 20 7 9 19 5 2 10
SK 44 44 23 26 24 24 11 15 24 13 2 5
UK 36 33 36 31 30 30 27 12 5 25 24 0
NB: Enterprises were asked to indicate the three most important skills bundles for their development in the near future. % values are percentages of enterprises quoting each option as one of the three most important skills bundles.
Source: Eurostat, CVTS, dissemination database (accessed 6.2.2018); own calculations.

Continuing vocational training in EU enterprises
104
The overall importance of these skills bundles is illustrated by the fact that
they rank in the top three items for almost all countries. Only in Spain are
technical, practical or job-specific skills not among the three most important
skills needs. Customer handling skills are not in the top three in Croatia,
Hungary and North Macedonia, while team working skills are absent from the
top three in Finland and Slovakia.
It is important to recall that in selecting the three most important skills
bundles for their development in the near future, enterprises could opt for the
category ‘other’, indicating that they could not express their main skill needs
within the list of skills bundles available in the questionnaire. In most countries,
10% or fewer enterprises did so, Norway being the exception (17%). While
countries are encouraged to ask for further explanation on these needs, no
further detail is available in the European CVTS data.
Table 12 lists the cross country differences in the skill bundles targeted by
CVT courses. Table 12 highlights for each country the three skills bundles that
are most often targeted by enterprises in their CVT provision. To do this, the
following colour scheme (with the EU-28 average used as an example) is
adopted in Table 12 for each country.
Most frequent skills bundle targeted by CVT courses
Second most frequent skills bundle targeted by CVT courses
Third most frequent skills bundle targeted by CVT courses
EU-28 technical, practical or job-specific skills
customer handling skills
management skills
In the EU-28, technical, practical or job-specific skills are the most
frequently targeted in CVT course provision, followed by customer handling
and managerial skills. The skill bundle other skills ranks fourth, while team
working skills complete the top five. It is important to note that the other skills
bundle has to be characterised as a heterogeneous item as it is an aggregate
of all skills targeted outside the list of items in the CVTS questionnaire. In some
countries quite a large share of training enterprises indicated this item. The
highest shares are found in Norway (46%), Italy (36%) and the Netherlands
(35%).
In every country technical, practical or job-specific skills are the most
frequently indicated as a top subject of CVT courses. Customer handling skills
are also generally prioritised in most of countries: they only appear outside the
top three skills bundles in France, Croatia, Italy, Hungary, Romania and
Sweden. For the rest of skills bundles, the picture is more fragmented.

CHAPTER 4. Main skills needs in enterprises
105
Management skills are present in the top three skill bundles targeted by CVT
courses in 11 countries, while team working skills emerge in five countries
(Bulgaria, Estonia, Italy, Portugal and Romania); problem-solving skills are
highlighted in Greece, Croatia, Cyprus and Romania, as are general IT skills in
Belgium and professional IT skills in Hungary. In most countries,
communication skills, as well as literacy and numeracy, are less often indicated
as a top subject for enterprise CVT courses. Above-average provision of CVT
courses addressing communication skills can be found in Slovakia (12%),
Austria (11%) and Norway (10%). Foreign language skills are most frequently
prioritised in Slovakia (22% of training enterprises), Hungary (18%) and
Luxembourg (17%).
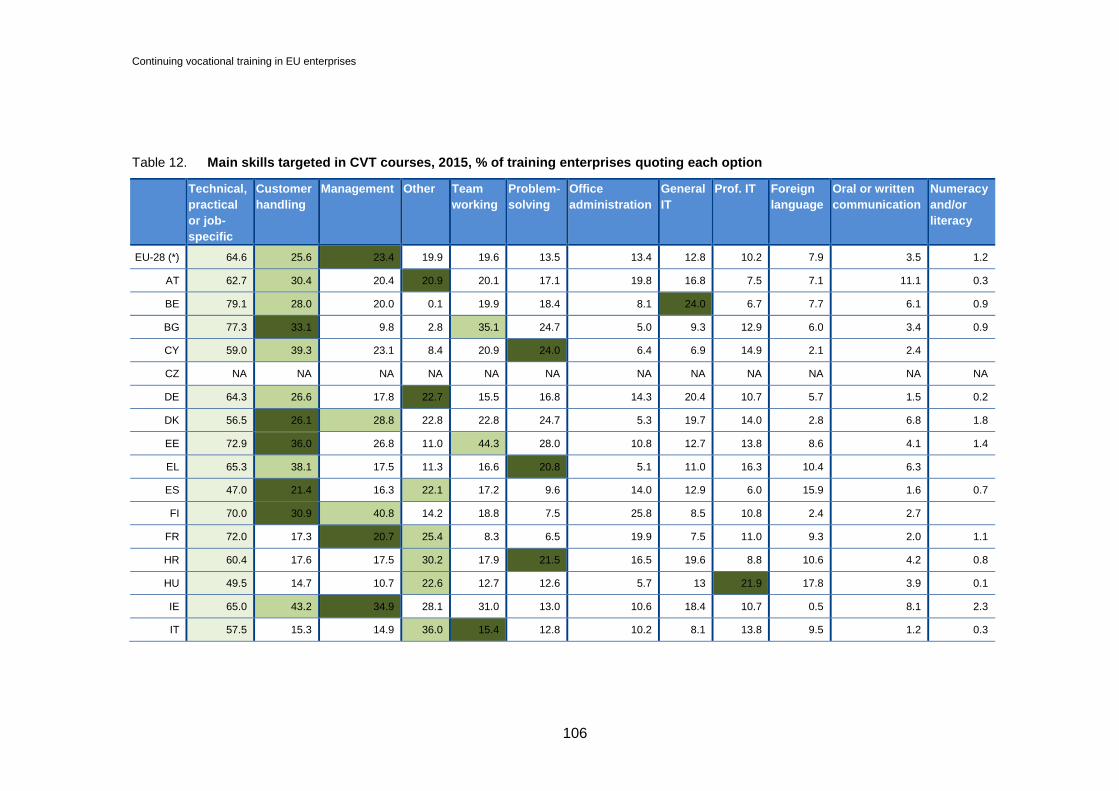
Continuing vocational training in EU enterprises
106
Table 12. Main skills targeted in CVT courses, 2015, % of training enterprises quoting each option
Technical,
practical
or job-
specific
Customer
handling
Management Other Team
working
Problem-
solving
Office
administration
General
IT
Prof. IT Foreign
language
Oral or written
communication
Numeracy
and/or
literacy
EU-28 (*) 64.6 25.6 23.4 19.9 19.6 13.5 13.4 12.8 10.2 7.9 3.5 1.2
AT 62.7 30.4 20.4 20.9 20.1 17.1 19.8 16.8 7.5 7.1 11.1 0.3
BE 79.1 28.0 20.0 0.1 19.9 18.4 8.1 24.0 6.7 7.7 6.1 0.9
BG 77.3 33.1 9.8 2.8 35.1 24.7 5.0 9.3 12.9 6.0 3.4 0.9
CY 59.0 39.3 23.1 8.4 20.9 24.0 6.4 6.9 14.9 2.1 2.4
CZ NA NA NA NA NA NA NA NA NA NA NA NA
DE 64.3 26.6 17.8 22.7 15.5 16.8 14.3 20.4 10.7 5.7 1.5 0.2
DK 56.5 26.1 28.8 22.8 22.8 24.7 5.3 19.7 14.0 2.8 6.8 1.8
EE 72.9 36.0 26.8 11.0 44.3 28.0 10.8 12.7 13.8 8.6 4.1 1.4
EL 65.3 38.1 17.5 11.3 16.6 20.8 5.1 11.0 16.3 10.4 6.3
ES 47.0 21.4 16.3 22.1 17.2 9.6 14.0 12.9 6.0 15.9 1.6 0.7
FI 70.0 30.9 40.8 14.2 18.8 7.5 25.8 8.5 10.8 2.4 2.7
FR 72.0 17.3 20.7 25.4 8.3 6.5 19.9 7.5 11.0 9.3 2.0 1.1
HR 60.4 17.6 17.5 30.2 17.9 21.5 16.5 19.6 8.8 10.6 4.2 0.8
HU 49.5 14.7 10.7 22.6 12.7 12.6 5.7 13 21.9 17.8 3.9 0.1
IE 65.0 43.2 34.9 28.1 31.0 13.0 10.6 18.4 10.7 0.5 8.1 2.3
IT 57.5 15.3 14.9 36.0 15.4 12.8 10.2 8.1 13.8 9.5 1.2 0.3
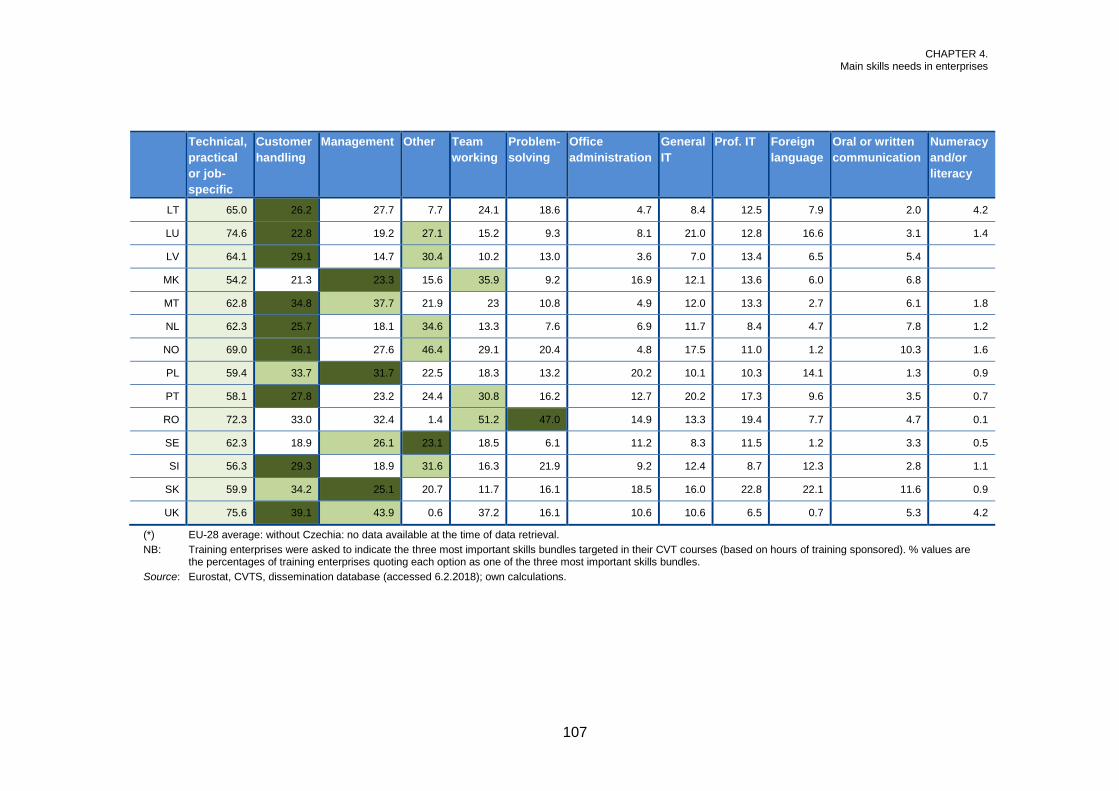
CHAPTER 4. Main skills needs in enterprises
107
Technical,
practical
or job-
specific
Customer
handling
Management Other Team
working
Problem-
solving
Office
administration
General
IT
Prof. IT Foreign
language
Oral or written
communication
Numeracy
and/or
literacy
LT 65.0 26.2 27.7 7.7 24.1 18.6 4.7 8.4 12.5 7.9 2.0 4.2
LU 74.6 22.8 19.2 27.1 15.2 9.3 8.1 21.0 12.8 16.6 3.1 1.4
LV 64.1 29.1 14.7 30.4 10.2 13.0 3.6 7.0 13.4 6.5 5.4
MK 54.2 21.3 23.3 15.6 35.9 9.2 16.9 12.1 13.6 6.0 6.8
MT 62.8 34.8 37.7 21.9 23 10.8 4.9 12.0 13.3 2.7 6.1 1.8
NL 62.3 25.7 18.1 34.6 13.3 7.6 6.9 11.7 8.4 4.7 7.8 1.2
NO 69.0 36.1 27.6 46.4 29.1 20.4 4.8 17.5 11.0 1.2 10.3 1.6
PL 59.4 33.7 31.7 22.5 18.3 13.2 20.2 10.1 10.3 14.1 1.3 0.9
PT 58.1 27.8 23.2 24.4 30.8 16.2 12.7 20.2 17.3 9.6 3.5 0.7
RO 72.3 33.0 32.4 1.4 51.2 47.0 14.9 13.3 19.4 7.7 4.7 0.1
SE 62.3 18.9 26.1 23.1 18.5 6.1 11.2 8.3 11.5 1.2 3.3 0.5
SI 56.3 29.3 18.9 31.6 16.3 21.9 9.2 12.4 8.7 12.3 2.8 1.1
SK 59.9 34.2 25.1 20.7 11.7 16.1 18.5 16.0 22.8 22.1 11.6 0.9
UK 75.6 39.1 43.9 0.6 37.2 16.1 10.6 10.6 6.5 0.7 5.3 4.2
(*) EU-28 average: without Czechia: no data available at the time of data retrieval.
NB: Training enterprises were asked to indicate the three most important skills bundles targeted in their CVT courses (based on hours of training sponsored). % values are the percentages of training enterprises quoting each option as one of the three most important skills bundles.
Source: Eurostat, CVTS, dissemination database (accessed 6.2.2018); own calculations.

108
CHAPTER 5.
Reasons for not providing (further) training
To expand employer-sponsored training, it is important to understand the
factors limiting provision; CVTS provides relevant data.
In CVTS, enterprises that do not provide any kind of training during the
reference year are asked about the reasons for not having done so.
Enterprises that provided training are asked about factors limiting the provision
of further training. In both CVTS 4 and CVTS 5, respondents were invited to
tick any applicable reason from a list of items (with answer categories not
being mutually exclusive).
The interpretation of these data should consider their context. Table 13
provides information on the large differences in training activity across
countries and enterprise size classes. In most countries the majority of
enterprises are training enterprises, and training incidence increases with
company size. In some countries, such as Latvia, Norway or Sweden, the
share of non-training enterprises is small or close to zero. In other countries,
such as Bulgaria, Greece, Hungary and Poland, training enterprises are a
minority, particularly among small enterprises (Table 13).
Table 13. Enterprises with and without training activity by size class, 2015, (%)
Enterprises with training activity
(basis for indicators on obstacles for
further training)
Enterprises without training activity
(basis for indicators on obstacles for
any training)
10-49 50-249250 or
more 10-49 50-249
250 or
more
EU-28 69 86 95 31 14 5
AT 87 95 99 13 5 1
BE 81 94 100 19 6 0
BG 38 56 78 62 44 22
CY 66 88 100 34 13 0
CZ 89 95 100 11 5 0
DE 73 87 99 27 13 2
DK 84 95 98 16 6 2
EE 85 92 99 16 8 1
EL 19 40 68 81 60 32
ES 84 97 99 16 3 1
FI 80 95 98 20 5 2
FR 75 98 100 25 3 0
HR 51 71 88 49 29 12
HU 38 65 91 62 35 9
IE 75 89 95 25 11 5

CHAPTER 5. Reasons for not providing (further) training
109
Enterprises with training activity
(basis for indicators on obstacles for
further training)
Enterprises without training activity
(basis for indicators on obstacles for
any training)
10-49 50-249
250 or
more 10-49 50-249
250 or
more
IT 57 82 93 43 18 7
LT 56 82 96 44 18 4
LU 73 92 97 27 8 3
LV 100 100 100 0 0 0
MK 60 69 81 40 31 19
MT 56 80 95 44 20 5
NL 82 94 98 18 6 2
NO 99 100 100 1 0 0
PL 39 65 86 61 35 14
PT 72 93 99 28 7 1
RO 22 38 67 78 62 33
SE 92 98 100 8 2 1
SI 81 95 100 19 5 1
SK 66 83 93 34 17 7
UK 84 94 97 16 6 3
Source: Eurostat, CVTS, dissemination database (accessed 6.2.2018).
It is argued that the lower incidence of training among small enterprises is
related to the more irregular occurrence of training needs and/or training
activities in these enterprises; this is under the assumptions of a smaller
propensity to innovation and larger propensity to concentrate training activities
in a given period of time for efficiency reasons. This would result in fluctuations
between the status training/non-training enterprises. For larger enterprises
training would be provided more steadily, so, within a short observation period,
such as that of CVTS, it is more likely that a small enterprise is found as a firm
that does not provide (further) training (Neubäumer and Kohaut, 2007, p. 254).
5.1. Reasons for not providing training
This section focuses on the reasons for not sponsoring any type of training
activities. The base for the percentages presented in this section is the number
of non-training enterprises.
Figure 61 shows the 2015 CVTS 5 results at EU level. They are further
broken down by enterprise size class. The main reasons for not providing
training, as indicated by EU enterprises, are the absence of current skills
needs and (where present) satisfaction of such needs by strategies different
from training. The absence of a current need (available qualification, skills and
competences match current needs) is the main reason for not sponsoring
training. It is indicated by 82% of non-training enterprises in the EU. The

Continuing vocational training in EU enterprises
110
average is largely driven by the findings for small and medium-sized
enterprises (82% in both cases). The absence of current needs is also an
important factor for non-training enterprises of large size but to a smaller extent
(69%). The second most important reasons which EU enterprises give for not
providing training is that skills needs are satisfied through recruitment of new
staff (55%). This is more often the case for non-training enterprises of large
size (71%) than for those of medium and small size (54% and 61%
respectively). In addition, one out of four (25%) of non-training enterprises
stress the importance of IVET as an alternative to CVT, with almost no
variation by size class.
Figure 61. Reasons for not providing CVT by enterprise size class, EU-28, 2015, % of non-training enterprises quoting each option
Source: Eurostat, CVTS, dissemination database (accessed 6.2.2018).
Factors which could be properly considered as obstacles are less
important reasons for not providing training but still play an important role. One
third (32%) of non-training enterprises point to a high workload and a lack of
time for staff to participate, again with little variation across enterprise sizes. A
slightly smaller share (28%) point to high costs of CVT courses, again with little
variation across enterprise sizes. Even fewer enterprises report difficulties with
the assessment of training needs (16%) or a lack of appropriate CVT courses
in the market (13%).
Figure 62 addresses the changes over time in reasons reported by
enterprises for not to train, based on the EU-28 average, and shows little

CHAPTER 5. Reasons for not providing (further) training
111
change between 2010 and 2015. Compared to 2010, the share of non-training
enterprises pointing to high CVT costs as a reason for no provision has
dropped from 32% to 28%, while the share of enterprises indicating no training
needs has increased from 78% to 82%. Over time, a larger share of non-
training enterprises reports meeting skills needs through recruitment of new
staff (49% in 2010 compared to 55% in 2015).
Figure 62. Reasons for not providing CVT, EU-28, 2015 and 2010, % of non-training enterprises quoting each option
Source: Eurostat, CVTS, dissemination database (accessed 6.2.2018); own calculations.
Figure 63 displays the evolution between 2010 and 2015 broken down by
enterprise size class, showing that dynamic for all size classes strongly
resembles the overall pattern. When deviations from the general pattern occur,
they are typically observed among large enterprises. The strategy to recruit
new staff to fulfil skill needs instead of providing training became more popular
from 2010, especially so among large enterprises (from 51% to 74% of non-
training large enterprises). Among large and medium-sized enterprises the
share of non-training enterprises due to high CVT costs has dropped sharper
than among small enterprises (respectively from 38% to 28%, from 37% to
31% and from 31% to 28%). While an increasing shares of SMEs point to
difficult needs assessments as a reason not to provide training, this is not the
case for large enterprises. Compared to 2010, medium-sized and large
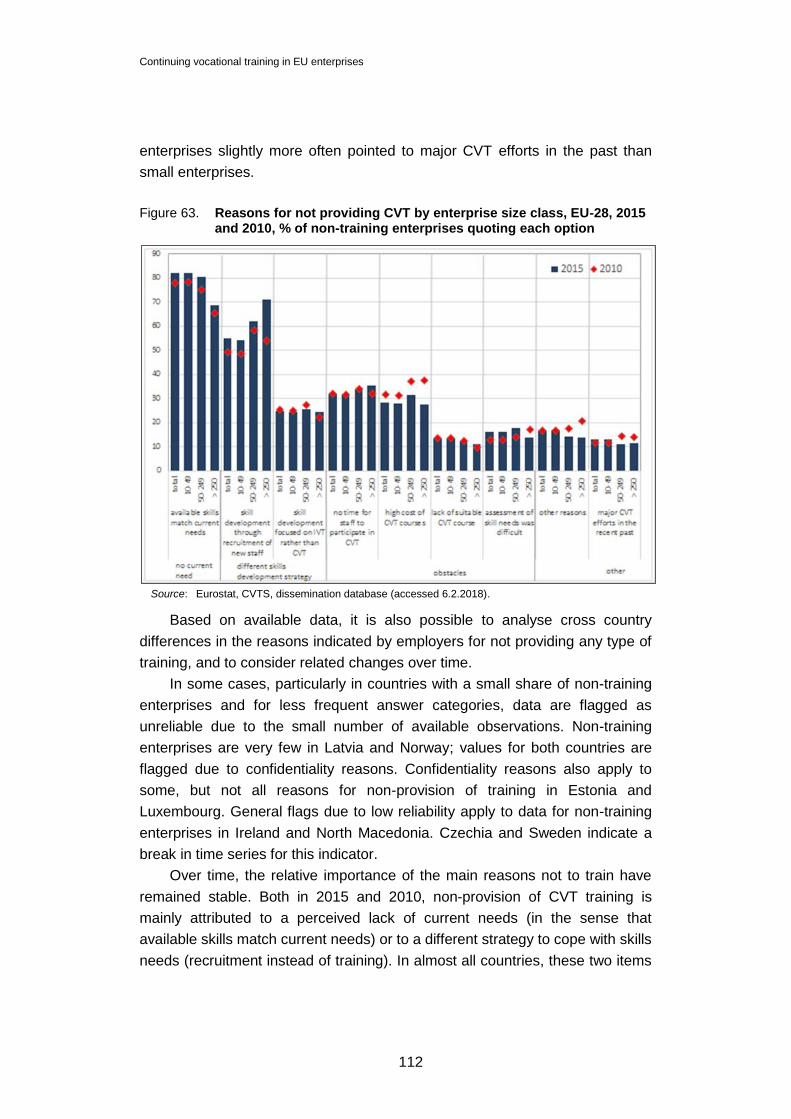
Continuing vocational training in EU enterprises
112
enterprises slightly more often pointed to major CVT efforts in the past than
small enterprises.
Figure 63. Reasons for not providing CVT by enterprise size class, EU-28, 2015 and 2010, % of non-training enterprises quoting each option
Source: Eurostat, CVTS, dissemination database (accessed 6.2.2018).
Based on available data, it is also possible to analyse cross country
differences in the reasons indicated by employers for not providing any type of
training, and to consider related changes over time.
In some cases, particularly in countries with a small share of non-training
enterprises and for less frequent answer categories, data are flagged as
unreliable due to the small number of available observations. Non-training
enterprises are very few in Latvia and Norway; values for both countries are
flagged due to confidentiality reasons. Confidentiality reasons also apply to
some, but not all reasons for non-provision of training in Estonia and
Luxembourg. General flags due to low reliability apply to data for non-training
enterprises in Ireland and North Macedonia. Czechia and Sweden indicate a
break in time series for this indicator.
Over time, the relative importance of the main reasons not to train have
remained stable. Both in 2015 and 2010, non-provision of CVT training is
mainly attributed to a perceived lack of current needs (in the sense that
available skills match current needs) or to a different strategy to cope with skills
needs (recruitment instead of training). In almost all countries, these two items
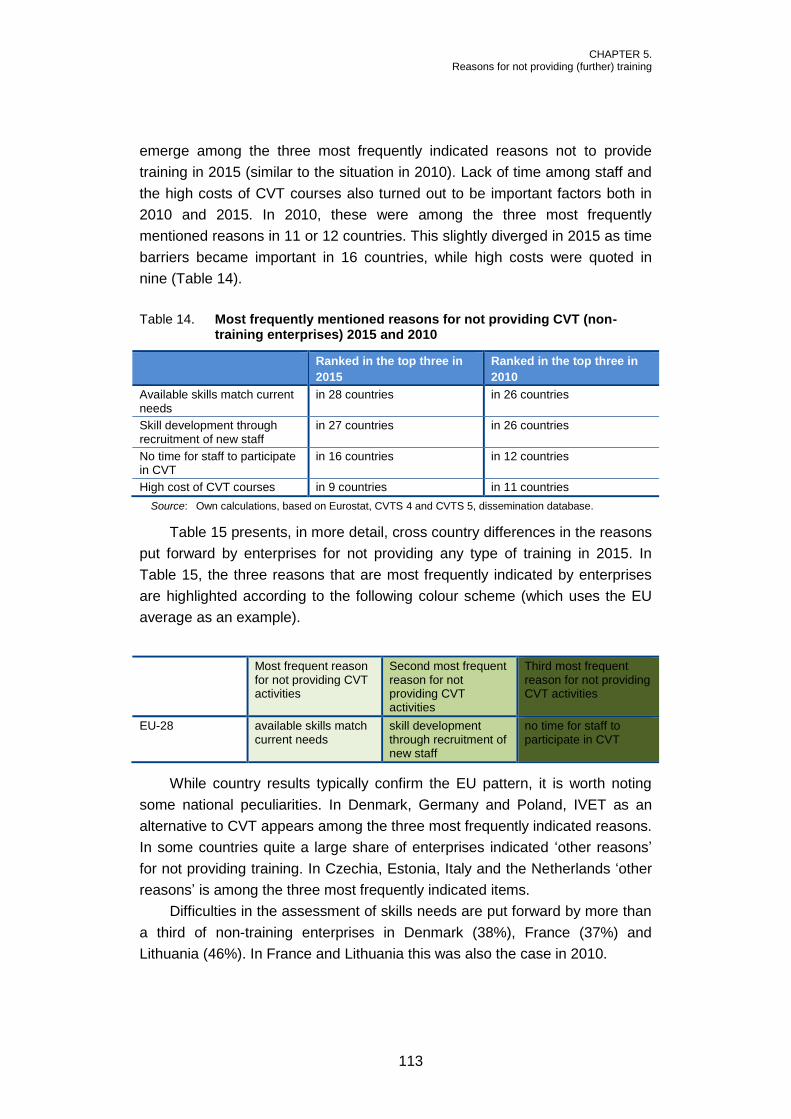
CHAPTER 5. Reasons for not providing (further) training
113
emerge among the three most frequently indicated reasons not to provide
training in 2015 (similar to the situation in 2010). Lack of time among staff and
the high costs of CVT courses also turned out to be important factors both in
2010 and 2015. In 2010, these were among the three most frequently
mentioned reasons in 11 or 12 countries. This slightly diverged in 2015 as time
barriers became important in 16 countries, while high costs were quoted in
nine (Table 14).
Table 14. Most frequently mentioned reasons for not providing CVT (non-training enterprises) 2015 and 2010
Ranked in the top three in
2015
Ranked in the top three in
2010
Available skills match current needs
in 28 countries in 26 countries
Skill development through recruitment of new staff
in 27 countries in 26 countries
No time for staff to participate in CVT
in 16 countries in 12 countries
High cost of CVT courses in 9 countries in 11 countries
Source: Own calculations, based on Eurostat, CVTS 4 and CVTS 5, dissemination database.
Table 15 presents, in more detail, cross country differences in the reasons
put forward by enterprises for not providing any type of training in 2015. In
Table 15, the three reasons that are most frequently indicated by enterprises
are highlighted according to the following colour scheme (which uses the EU
average as an example).
Most frequent reason for not providing CVT activities
Second most frequent reason for not providing CVT activities
Third most frequent reason for not providing CVT activities
EU-28 available skills match current needs
skill development through recruitment of new staff
no time for staff to participate in CVT
While country results typically confirm the EU pattern, it is worth noting
some national peculiarities. In Denmark, Germany and Poland, IVET as an
alternative to CVT appears among the three most frequently indicated reasons.
In some countries quite a large share of enterprises indicated ‘other reasons’
for not providing training. In Czechia, Estonia, Italy and the Netherlands ‘other
reasons’ is among the three most frequently indicated items.
Difficulties in the assessment of skills needs are put forward by more than
a third of non-training enterprises in Denmark (38%), France (37%) and
Lithuania (46%). In France and Lithuania this was also the case in 2010.

Continuing vocational training in EU enterprises
114
In most countries, the lack of suitable CVT courses is among the least
cited reasons for non-provision. It is, however, put forward by more than one in
four non-training enterprises in Spain (31%), Lithuania (26%) and Portugal
(30%). In Lithuania and Portugal, this was also the case in 2010.
Major CVT-efforts in the recent past are little mentioned. Above-average
shares of enterprises pointing to efforts in the past are reported for Spain
(22%), France (34%) and Slovenia (30%). In France and Slovenia this was
also the case in 2010.
5.2. Reasons limiting enterprise provision of more
training
In CVTS, enterprises providing (at least some) training during the reference
period are asked about the reasons which limited the provision of further
training. Results closely follow the patterns revealed by the analysis of non-
training enterprises.
Figure 64 shows the 2015 CVTS 5 results for the EU as a whole, broken
down by enterprise size class. The base for the calculation of the percentages
is training enterprises.
The majority of training enterprises (52%) saw no need for more training
activities in 2015 (in the sense that the level of training provided was
considered appropriate). Small enterprises (53%) indicated this item more
frequently than medium (47%) and large enterprises (43%).
Half of all training enterprises (50%) did not provide more training in 2015
as they preferred to recruit new staff with the skills required to fulfil company
needs. Large and medium-sized training enterprises more often (53% to 54%)
adopt this strategy compared to small (49%) enterprises.
Only a minority (16%) of training enterprises explain the absence of
further training activities by a focus on IVET. Small enterprises (17%) support
this item more often than large ones (13%).
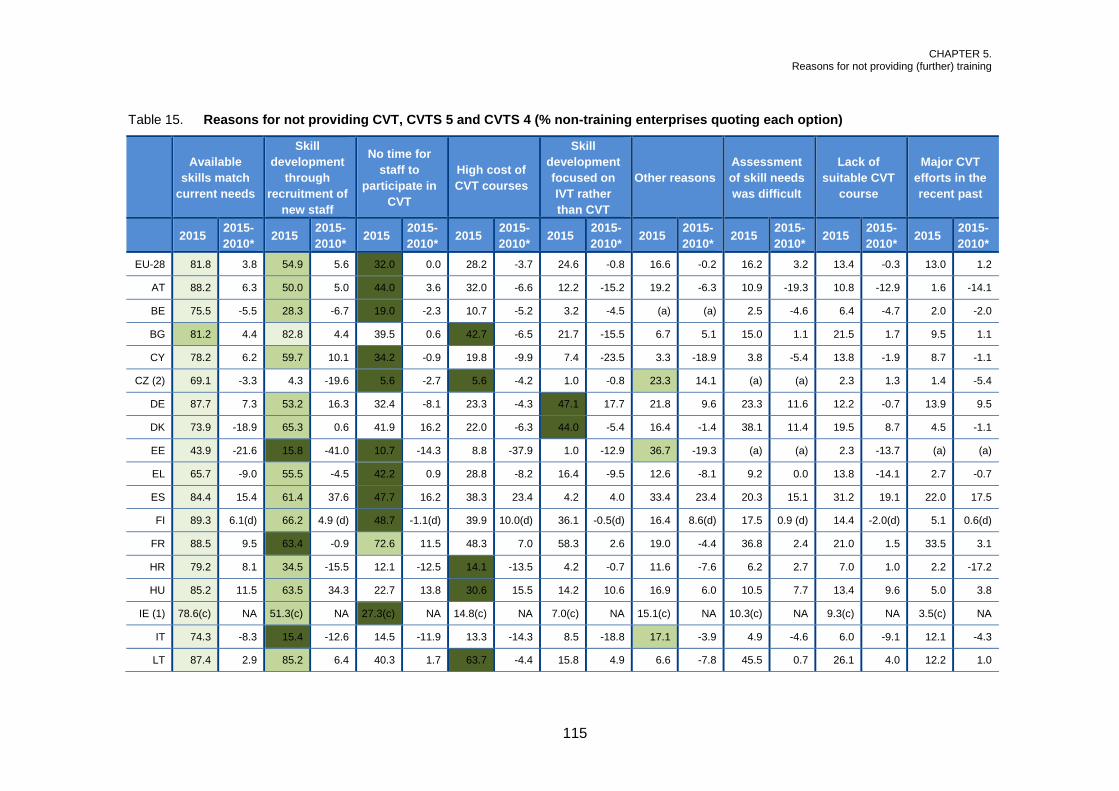
CHAPTER 5. Reasons for not providing (further) training
115
Table 15. Reasons for not providing CVT, CVTS 5 and CVTS 4 (% non-training enterprises quoting each option)
Available
skills match
current needs
Skill
development
through
recruitment of
new staff
No time for
staff to
participate in
CVT
High cost of
CVT courses
Skill
development
focused on
IVT rather
than CVT
Other reasons
Assessment
of skill needs
was difficult
Lack of
suitable CVT
course
Major CVT
efforts in the
recent past
2015 2015-
2010* 2015
2015-
2010* 2015
2015-
2010* 2015
2015-
2010* 2015
2015-
2010* 2015
2015-
2010* 2015
2015-
2010* 2015
2015-
2010* 2015
2015-
2010*
EU-28 81.8 3.8 54.9 5.6 32.0 0.0 28.2 -3.7 24.6 -0.8 16.6 -0.2 16.2 3.2 13.4 -0.3 13.0 1.2
AT 88.2 6.3 50.0 5.0 44.0 3.6 32.0 -6.6 12.2 -15.2 19.2 -6.3 10.9 -19.3 10.8 -12.9 1.6 -14.1
BE 75.5 -5.5 28.3 -6.7 19.0 -2.3 10.7 -5.2 3.2 -4.5 (a) (a) 2.5 -4.6 6.4 -4.7 2.0 -2.0
BG 81.2 4.4 82.8 4.4 39.5 0.6 42.7 -6.5 21.7 -15.5 6.7 5.1 15.0 1.1 21.5 1.7 9.5 1.1
CY 78.2 6.2 59.7 10.1 34.2 -0.9 19.8 -9.9 7.4 -23.5 3.3 -18.9 3.8 -5.4 13.8 -1.9 8.7 -1.1
CZ (2) 69.1 -3.3 4.3 -19.6 5.6 -2.7 5.6 -4.2 1.0 -0.8 23.3 14.1 (a) (a) 2.3 1.3 1.4 -5.4
DE 87.7 7.3 53.2 16.3 32.4 -8.1 23.3 -4.3 47.1 17.7 21.8 9.6 23.3 11.6 12.2 -0.7 13.9 9.5
DK 73.9 -18.9 65.3 0.6 41.9 16.2 22.0 -6.3 44.0 -5.4 16.4 -1.4 38.1 11.4 19.5 8.7 4.5 -1.1
EE 43.9 -21.6 15.8 -41.0 10.7 -14.3 8.8 -37.9 1.0 -12.9 36.7 -19.3 (a) (a) 2.3 -13.7 (a) (a)
EL 65.7 -9.0 55.5 -4.5 42.2 0.9 28.8 -8.2 16.4 -9.5 12.6 -8.1 9.2 0.0 13.8 -14.1 2.7 -0.7
ES 84.4 15.4 61.4 37.6 47.7 16.2 38.3 23.4 4.2 4.0 33.4 23.4 20.3 15.1 31.2 19.1 22.0 17.5
FI 89.3 6.1(d) 66.2 4.9 (d) 48.7 -1.1(d) 39.9 10.0(d) 36.1 -0.5(d) 16.4 8.6(d) 17.5 0.9 (d) 14.4 -2.0(d) 5.1 0.6(d)
FR 88.5 9.5 63.4 -0.9 72.6 11.5 48.3 7.0 58.3 2.6 19.0 -4.4 36.8 2.4 21.0 1.5 33.5 3.1
HR 79.2 8.1 34.5 -15.5 12.1 -12.5 14.1 -13.5 4.2 -0.7 11.6 -7.6 6.2 2.7 7.0 1.0 2.2 -17.2
HU 85.2 11.5 63.5 34.3 22.7 13.8 30.6 15.5 14.2 10.6 16.9 6.0 10.5 7.7 13.4 9.6 5.0 3.8
IE (1) 78.6(c) NA 51.3(c) NA 27.3(c) NA 14.8(c) NA 7.0(c) NA 15.1(c) NA 10.3(c) NA 9.3(c) NA 3.5(c) NA
IT 74.3 -8.3 15.4 -12.6 14.5 -11.9 13.3 -14.3 8.5 -18.8 17.1 -3.9 4.9 -4.6 6.0 -9.1 12.1 -4.3
LT 87.4 2.9 85.2 6.4 40.3 1.7 63.7 -4.4 15.8 4.9 6.6 -7.8 45.5 0.7 26.1 4.0 12.2 1.0

Continuing vocational training in EU enterprises
116
Available
skills match
current needs
Skill
development
through
recruitment of
new staff
No time for
staff to
participate in
CVT
High cost of
CVT courses
Skill
development
focused on
IVT rather
than CVT
Other reasons
Assessment
of skill needs
was difficult
Lack of
suitable CVT
course
Major CVT
efforts in the
recent past
2015 2015-
2010* 2015
2015-
2010* 2015
2015-
2010* 2015
2015-
2010* 2015
2015-
2010* 2015
2015-
2010* 2015
2015-
2010* 2015
2015-
2010* 2015
2015-
2010*
LU 70.1 -8.8 22.3 -16.9 16.1 -1.4 6.0 -6.3 4.2 -1.1 15.3 -2.5 (a) (a) 3.5 -0.2 (a) (a)
LV (a) (a) (a) (a) (a) (a) (a) (a) (a) (a) 100.0 78.2 NA NA NA NA (a) (a)
MK (1) 47.2(c) NA 28.1(c) NA 20.4(c) NA 26.8(c) NA 8.6(c) NA 17.9(c) NA 7.7(c) NA 10.2(c) NA 2.8(c) NA
MT 79.9 -8.4 60.9 -6.1 39.6 4.9 20.7 -3.2 6.9 -1.4 15.0 -3.8 11.5 2.0 8.2 -1.4 3.8 -0.9
NL 73.1 3.1 53.5 11.5 9.5 -16.7 14.1 -6.4 5.9 -8.6 33.3 17.1 3.1 -3.0 4.4 -2.8 2.2 -1.5
NO 100.0 13.1(d) 30.0 -2.1(d) 2.9 -
14.3(d) 44.6 31.9(d) (a) (a.d) (a) (a.d) (a) (a) (a) (a.d) (a) (a.d)
PL 85.2 3.8 70.4 1.4 24.9 0.5 33.7 -9.8 38.3 -0.2 17.7 -6.5 12.1 3.2 11.4 1.0 16.1 0.2
PT 76.5 2.9 64.4 5.3 40.5 4.0 46.3 -7.6 22.3 -5.2 40.4 3.0 30.6 1.0 30.3 -0.8 7.9 -0.3
RO 83.5 19.1 78.3 15.6 26.1 11.7 34.0 4.3 5.4 3.9 1.5 0.4 6.7 2.9 8.0 3.9 5.6 3.1
SE (2) (c) (c) (c) (c) (c) (c) (c) (c) (c) (c) (c) (c) (c) (c) (c) (c) (c) (c)
SI 92.0 3.6 64.1 3.8 20.8 2.8 31.3 -9.5 11.9 -19.3 13.0 2.4 5.5 -0.7 10.1 1.7 30.0 0.3
SK 74.2 -10.5 48.1 1.6 30.2 11.4 30.6 -1.6 22.9 -11.5 12.2 0.5 7.9 0.0 8.9 0.1 15.0 -9.7
UK 88.7 5.9 73.2 8.5 35.7 -5.2 19.1 -6.3 23.3 5.9 10.8 -6.5 30.8 9.8 19.4 6.3 13.6 1.7
(1) No participation in CVTS 4
(2) Break in time series between CVTS 4 and CVTS 5.
(a) Confidential in CVTS 5.
(b) Confidential in CVTS 4.
(c) Low reliability in CVTS 5.
(d) Low reliability in CVTS 4.
(*) = difference between 2015 and 2010 in percentage points; negative values point to decreasing shares of enterprises citing this reason.
Source: Eurostat, CVTS, dissemination database (accessed 6.2.2018); own calculations.

CHAPTER 5. Reasons for not providing (further) training
117
Figure 64. Reasons for not providing more CVT by enterprise size class, EU-28, 2015, % training enterprises quoting each option
Source: Eurostat, CVTS, dissemination database (accessed 6.2.2018).
Among reasons which can be classified as proper obstacles, lack of time
finds most support, being indicated by 44% of training enterprises, with almost
no variation by size. Costs were indicated as a barrier to more training by one
out of three training enterprises (34%) again with no significant variation
according to enterprise size.
Only a minority of training enterprises report difficulties with needs
assessment (13%) or the absence of appropriate training opportunities (16%).
A further 20% of training firms, with no variation according to size,
indicated past CVT efforts as a reason limiting further training provision in 2015
Figure 65 shows comparisons over time of the reasons limiting provision
of further CVT, as indicated by training enterprises in the EU as a whole. In
2015 (CVTS 5), the three most frequently mentioned reasons are identical to
those in 2010 (CVTS 4).

Continuing vocational training in EU enterprises
118
Figure 65. Reasons for not providing more CVT, EU-28, 2015 and 2010, % of training enterprises quoting each option
Source: Eurostat, CVTS, dissemination database (accessed 6.2.2018); own calculations.
Between 2010 and 2015, a general small decline is observed in the
importance of almost all reasons preventing the provision of further training.
Compared to 2010, the share of training enterprises pointing to major CVT
efforts in the past dropped from 27% to 20% in 2015. Also the lack of suitable
CVT courses is less often mentioned as a barrier. High CVT costs as a reason
for not extending CVT provision dropped from 38% to 34%, while the share of
enterprises indicating no training needs declined from 56% to 52%. The only
item growing in importance is the recruitment of new staff to meet skills needs
(44% in 2010 compared to 50% in 2015).
Figure 66 shows relevant changes between 2010 and 2015 broken down
by enterprise size. In general terms, the overall pattern is reflected by all size
classes.
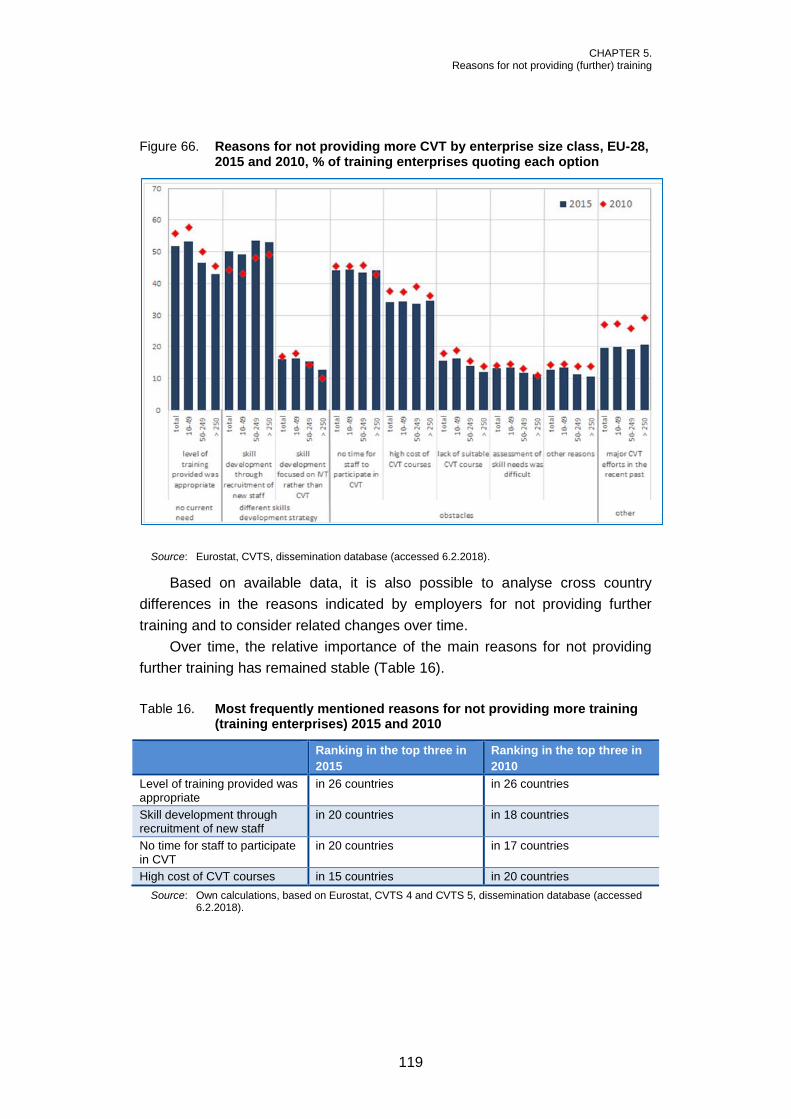
CHAPTER 5. Reasons for not providing (further) training
119
Figure 66. Reasons for not providing more CVT by enterprise size class, EU-28, 2015 and 2010, % of training enterprises quoting each option
Source: Eurostat, CVTS, dissemination database (accessed 6.2.2018).
Based on available data, it is also possible to analyse cross country
differences in the reasons indicated by employers for not providing further
training and to consider related changes over time.
Over time, the relative importance of the main reasons for not providing
further training has remained stable (Table 16).
Table 16. Most frequently mentioned reasons for not providing more training (training enterprises) 2015 and 2010
Ranking in the top three in
2015
Ranking in the top three in
2010
Level of training provided was appropriate
in 26 countries in 26 countries
Skill development through recruitment of new staff
in 20 countries in 18 countries
No time for staff to participate in CVT
in 20 countries in 17 countries
High cost of CVT courses in 15 countries in 20 countries
Source: Own calculations, based on Eurostat, CVTS 4 and CVTS 5, dissemination database (accessed 6.2.2018).
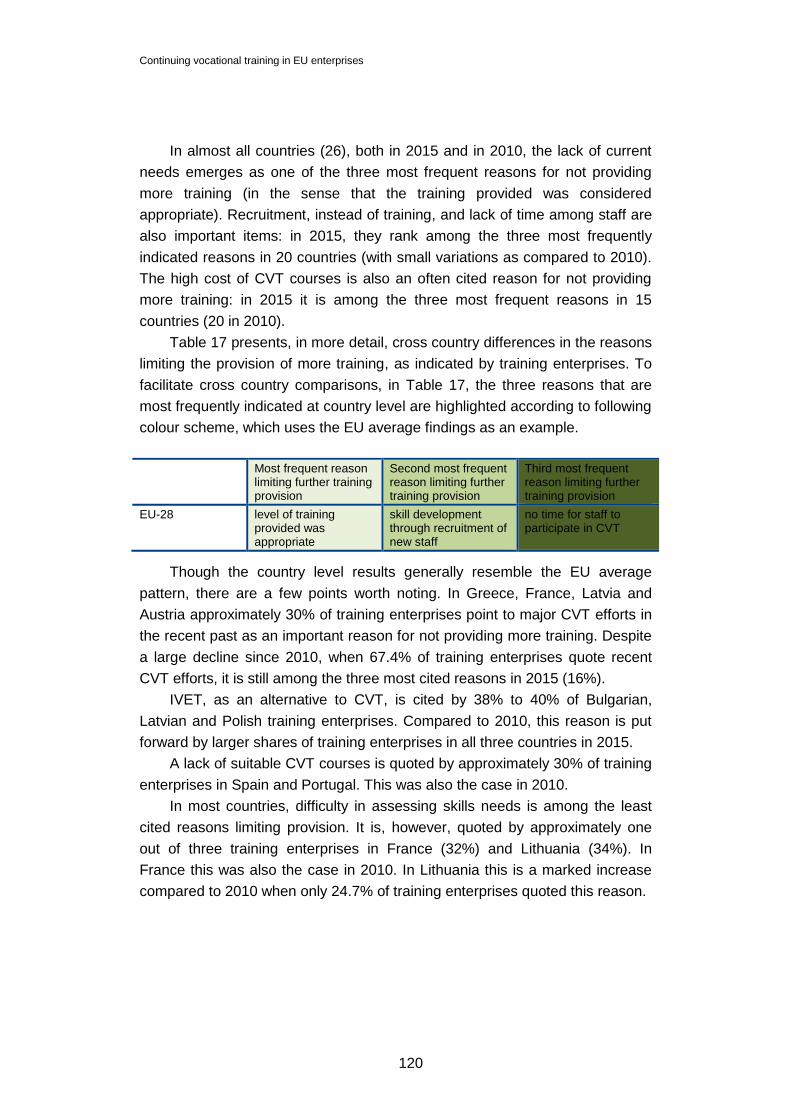
Continuing vocational training in EU enterprises
120
In almost all countries (26), both in 2015 and in 2010, the lack of current
needs emerges as one of the three most frequent reasons for not providing
more training (in the sense that the training provided was considered
appropriate). Recruitment, instead of training, and lack of time among staff are
also important items: in 2015, they rank among the three most frequently
indicated reasons in 20 countries (with small variations as compared to 2010).
The high cost of CVT courses is also an often cited reason for not providing
more training: in 2015 it is among the three most frequent reasons in 15
countries (20 in 2010).
Table 17 presents, in more detail, cross country differences in the reasons
limiting the provision of more training, as indicated by training enterprises. To
facilitate cross country comparisons, in Table 17, the three reasons that are
most frequently indicated at country level are highlighted according to following
colour scheme, which uses the EU average findings as an example.
Most frequent reason limiting further training provision
Second most frequent reason limiting further training provision
Third most frequent reason limiting further training provision
EU-28 level of training provided was appropriate
skill development through recruitment of new staff
no time for staff to participate in CVT
Though the country level results generally resemble the EU average
pattern, there are a few points worth noting. In Greece, France, Latvia and
Austria approximately 30% of training enterprises point to major CVT efforts in
the recent past as an important reason for not providing more training. Despite
a large decline since 2010, when 67.4% of training enterprises quote recent
CVT efforts, it is still among the three most cited reasons in 2015 (16%).
IVET, as an alternative to CVT, is cited by 38% to 40% of Bulgarian,
Latvian and Polish training enterprises. Compared to 2010, this reason is put
forward by larger shares of training enterprises in all three countries in 2015.
A lack of suitable CVT courses is quoted by approximately 30% of training
enterprises in Spain and Portugal. This was also the case in 2010.
In most countries, difficulty in assessing skills needs is among the least
cited reasons limiting provision. It is, however, quoted by approximately one
out of three training enterprises in France (32%) and Lithuania (34%). In
France this was also the case in 2010. In Lithuania this is a marked increase
compared to 2010 when only 24.7% of training enterprises quoted this reason.
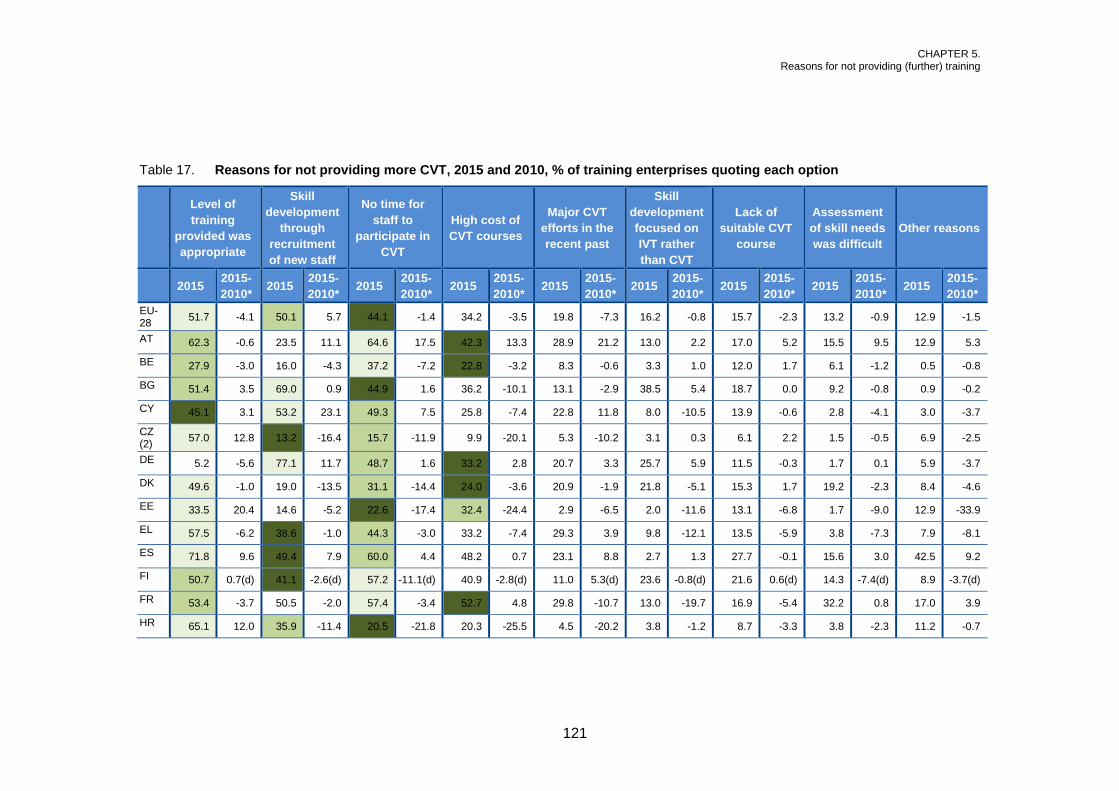
CHAPTER 5. Reasons for not providing (further) training
121
Table 17. Reasons for not providing more CVT, 2015 and 2010, % of training enterprises quoting each option
Level of
training
provided was
appropriate
Skill
development
through
recruitment
of new staff
No time for
staff to
participate in
CVT
High cost of
CVT courses
Major CVT
efforts in the
recent past
Skill
development
focused on
IVT rather
than CVT
Lack of
suitable CVT
course
Assessment
of skill needs
was difficult
Other reasons
2015 2015-
2010* 2015
2015-
2010* 2015
2015-
2010* 2015
2015-
2010* 2015
2015-
2010* 2015
2015-
2010* 2015
2015-
2010* 2015
2015-
2010* 2015
2015-
2010*
EU-28
51.7 -4.1 50.1 5.7 44.1 -1.4 34.2 -3.5 19.8 -7.3 16.2 -0.8 15.7 -2.3 13.2 -0.9 12.9 -1.5
AT 62.3 -0.6 23.5 11.1 64.6 17.5 42.3 13.3 28.9 21.2 13.0 2.2 17.0 5.2 15.5 9.5 12.9 5.3
BE 27.9 -3.0 16.0 -4.3 37.2 -7.2 22.8 -3.2 8.3 -0.6 3.3 1.0 12.0 1.7 6.1 -1.2 0.5 -0.8
BG 51.4 3.5 69.0 0.9 44.9 1.6 36.2 -10.1 13.1 -2.9 38.5 5.4 18.7 0.0 9.2 -0.8 0.9 -0.2
CY 45.1 3.1 53.2 23.1 49.3 7.5 25.8 -7.4 22.8 11.8 8.0 -10.5 13.9 -0.6 2.8 -4.1 3.0 -3.7
CZ (2)
57.0 12.8 13.2 -16.4 15.7 -11.9 9.9 -20.1 5.3 -10.2 3.1 0.3 6.1 2.2 1.5 -0.5 6.9 -2.5
DE 5.2 -5.6 77.1 11.7 48.7 1.6 33.2 2.8 20.7 3.3 25.7 5.9 11.5 -0.3 1.7 0.1 5.9 -3.7
DK 49.6 -1.0 19.0 -13.5 31.1 -14.4 24.0 -3.6 20.9 -1.9 21.8 -5.1 15.3 1.7 19.2 -2.3 8.4 -4.6
EE 33.5 20.4 14.6 -5.2 22.6 -17.4 32.4 -24.4 2.9 -6.5 2.0 -11.6 13.1 -6.8 1.7 -9.0 12.9 -33.9
EL 57.5 -6.2 38.6 -1.0 44.3 -3.0 33.2 -7.4 29.3 3.9 9.8 -12.1 13.5 -5.9 3.8 -7.3 7.9 -8.1
ES 71.8 9.6 49.4 7.9 60.0 4.4 48.2 0.7 23.1 8.8 2.7 1.3 27.7 -0.1 15.6 3.0 42.5 9.2
FI 50.7 0.7(d) 41.1 -2.6(d) 57.2 -11.1(d) 40.9 -2.8(d) 11.0 5.3(d) 23.6 -0.8(d) 21.6 0.6(d) 14.3 -7.4(d) 8.9 -3.7(d)
FR 53.4 -3.7 50.5 -2.0 57.4 -3.4 52.7 4.8 29.8 -10.7 13.0 -19.7 16.9 -5.4 32.2 0.8 17.0 3.9
HR 65.1 12.0 35.9 -11.4 20.5 -21.8 20.3 -25.5 4.5 -20.2 3.8 -1.2 8.7 -3.3 3.8 -2.3 11.2 -0.7

Continuing vocational training in EU enterprises
122
Level of
training
provided was
appropriate
Skill
development
through
recruitment
of new staff
No time for
staff to
participate in
CVT
High cost of
CVT courses
Major CVT
efforts in the
recent past
Skill
development
focused on
IVT rather
than CVT
Lack of
suitable CVT
course
Assessment
of skill needs
was difficult
Other reasons
2015 2015-
2010* 2015
2015-
2010* 2015
2015-
2010* 2015
2015-
2010* 2015
2015-
2010* 2015
2015-
2010* 2015
2015-
2010* 2015
2015-
2010* 2015
2015-
2010*
HU 57.0 -4.5 34.2 14.5 24.5 8.0 31.6 4.5 5.3 1.7 18.1 8.7 8.2 5.1 8.7 1.8
IE (1)
22.1 44.5 49.8 36.1 12.8 8.6 17.5 9.4 10.6
IT 55.0 -23.3 5.0 -5.3 16.7 -16.5 13.2 -14.9 15.5 -51.9 4.0 -12.0 5.8 -11.2 3.8 -8.3 10.0 -8.9
LT 65.6 13.6 75.5 11.2 38.4 3.8 62.7 7.5 21.7 -0.2 14.6 7.2 20.0 7.4 34.2 9.5 13.1 5.5
LU 32.7 3.8 6.5 -15.2 16.2 -17.6 17.2 -5.7 2.5 -3.1 1.2 -4.6 9.2 -5.5 3.0 -3.8 6.4 -8.1
LV 74.4 14.0 73.1 13.0 36.4 0.1 46.4 -2.6 28.6 2.9 40.2 10.5 18.8 2.0 19.8 5.1 20.7 1.5
MK (1)
30.3(c) 8.7(c) 18.8(c) 17.8(c) 31.9(c) 9.4(c) 41.8(c) 19.1(c) 17.6(c)
MT 55.7 -2.9 48.6 3.2 55.5 3.5 31.0 -6.1 16.3 0.7 8.6 1.7 21.9 4.1 12.5 0.4 7.8 -10.0
NL 35.7 -31.1 41.0 -5.3 30.1 -9.2 29.1 -6.8 7.7 -4.9 11.9 -2.9 10.7 -2.4 10.8 1.9 14.1 1.4
NO 28.6 2.1 20.3 4.3 34.9 -6.2 31.2 0.0 18.3 0.2 10.2 -1.6 14.0 -1.1 8.5 0.6 11.7 0.4
PL 79.6 1.5 68.3 7.0 18.1 5.2 35.5 -2.2 15.7 4.3 37.5 16.9 8.9 0.1 7.7 2.1 15.7 -1.8
PT 65.6 5.4 56.2 10.6 38.1 1.6 50.0 -2.7 17.0 4.1 20.7 6.7 30.2 3.1 17.1 2.1 27.9 3.2
RO 55.6 14.1 27.4 -6.7 15.8 0.2 18.0 -9.4 4.4 -2.3 2.6 0.5 4.9 0.1 2.1 -0.3 0.3 -1.0
SE (2)
(c) (c.d) (c) (c.d) (c) (c.d) (c) (c.d) (c) (c.d) (c) (c.d) (c) (c.d) (c) (c.d) (c) (c.d)
SI (c) (c) (c) (c) (c) (c) (c) (c) (c) (c) (c) (c) (c) (c) (c) (c) (c) (c)
SK 57.7 -9.6 30.7 9.4 27.2 -0.9 31.5 -6.7 21.5 -5.8 17.1 6.2 8.5 -1.2 4.0 -1.0 5.7 -6.2

CHAPTER 5. Reasons for not providing (further) training
123
Level of
training
provided was
appropriate
Skill
development
through
recruitment
of new staff
No time for
staff to
participate in
CVT
High cost of
CVT courses
Major CVT
efforts in the
recent past
Skill
development
focused on
IVT rather
than CVT
Lack of
suitable CVT
course
Assessment
of skill needs
was difficult
Other reasons
2015 2015-
2010* 2015
2015-
2010* 2015
2015-
2010* 2015
2015-
2010* 2015
2015-
2010* 2015
2015-
2010* 2015
2015-
2010* 2015
2015-
2010* 2015
2015-
2010*
UK 83.9 1.1 70.8 7.6 56.3 0.9 30.7 -10.6 23.1 -1.0 23.4 2.6 20.8 1.1 20.3 -0.9 4.1 -2.9
(1) No participation in CVTS 4.
(2) Break in time series between CVTS 4 and CVTS 5.
(a) Confidential in CVTS 5.
(b) Confidential in CVTS 4.
(c) Low reliability in CVTS 5.
(d) Low reliability in CVTS 4.
(*) = difference between 2015 and 2010 in percentage points; negative values point to decreasing shares of enterprises citing this reason.
Source: Eurostat, CVTS, dissemination database (accessed 6.2.2018); own calculations.

124
CHAPTER 6.
Conclusions and outlook
The quality of the CVTS data has been assessed as good, particularly their
comparability over time and across countries. As the framework of CVTS had
already matured in course of the earlier waves, changes in methods (including
the standard questionnaire) between CVTS 4 and CVTS 5 have been small.
The key performance CVT indicators on incidence, participation, intensity or
expenditure were not affected by major changes in their definition and
calculation, so that they could be compared over time. However, some data
issues emerged. Developments in CVT over time could not be properly
assessed in Czechia and Sweden (due to methodological changes in the
implementation of the survey and consequent breaks in time series), Ireland
and North Macedonia (which did not participate in CVTS 4) as well as in
Romania (with missing expenditure data from CVTS 4). Geographic
comparability of 2015 expenditure data for Czechia has been assessed to be
weak, due to the adoption of a different definition. Particular caution should
also be used when interpreting 2015 CVTS 5 results for Germany, Ireland and
the UK, due to high non-response rates, and Portugal, which derived some of
the key data from administrative registers in both CVTS 4 and CVTS 5. A
major methodological change in occurred in CVTS 5 compared to CVTS:
employers were no longer asked to indicate all the skills they considered
important for the development of their enterprise in the next few years, only the
three most important ones. A similar change concerned the measurement
approach for the skills targeted in their CVT courses provision: employers were
requested to indicate the three most important ones based on hours of training
provided. These changes unfavourably affected related data in terms of
information content and proper comparability over time. Nevertheless, data
have been considered still relevant and have been analysed; comparisons
over time have been carried to the best possible extent, based on main
patterns emerging from the data rather than on value comparisons. Sectoral
analysis has also been limited: to comply with statistical reliability and
confidentiality thresholds, results by economic sector of activity had to be
produced with a high level of aggregation. This led to considering categories
which were too few in number and which presented a high level of internal
heterogeneity, hampering analytical possibilities. This is why sectoral analysis

CHAPTER 6. Conclusions and outlook
125
is given less prominence in the report, though available sectoral breakdowns
are displayed.
With such limitations, it has been possible to analyse four key dimensions
of enterprise performance on CVT and related changes over time at country
level: incidence, participation, intensity and expenditure. For each dimension,
one indicator has been selected, based on methodological considerations. The
four selected indicators are:
(a) incidence: enterprises providing any type of CVT as % of all enterprises
surveyed;
(b) participation: participants in CVT courses as % of persons employed in all
enterprises surveyed;
(c) intensity: number of hours of CVT courses per 1 000 hours worked by
persons employed in all enterprises surveyed;
(d) expenditure: total monetary expenditure on CVT courses (direct costs plus
contributions minus receipts) as % of total labour costs of all enterprises
surveyed.
These four indicators have been brought together to derive a composite
index measuring levels and changes of overall enterprise training performance,
at country and EU level.
The dynamic of the composite index between 2010 and 2015 indicates
moderate but positive changes.
For 15 countries, as well as the EU average, an increase in overall
performance of more than 10% is reported: Bulgaria, Croatia, Denmark,
Estonia, Greece, Italy, Latvia, Lithuania, Luxembourg, the Netherlands,
Norway, Poland, Slovenia, Spain and the UK. Positive progresses involved
most of the countries which had particularly low scores in 2010 (Bulgaria,
Greece, Croatia, Latvia, Lithuania and Poland), even though their ranking on
the composite index is still low. For six countries, the overall performance did
not change more than 10% between 2010 and 2015 so that their SMOP can
be considered remaining fairly stable at high levels (Belgium and France) or
medium levels (Germany, Malta, Austria and Slovakia). Only in four countries
did overall performance fall by more than 10% between 2010 and 2015:
Hungary, Portugal and Finland (by 11% to 13%) and Cyprus (21%).
Table 18 summarises the key results for the EU-28 as a whole,
considering the four key performance indicators underlying the composite
index. They show signs of moderate but favourable progress. For the EU-28,
training incidence has reached 73% in 2015, showing a positive increase of
seven percentage points or 10.5% over the 2010 baseline. Training
participation and training intensity (hours spent in training) grew less quickly by

Continuing vocational training in EU enterprises
126
8.5% and 7% respectively compared to 2010. Total monetary expenditure was
fairly stable and the relative increase 12.5% is largely due to a small base
effect. Progress for the EU as a whole reflects different patterns at country
level. However, for most countries and dimensions of analysis, changes were
favourable (with indicators raising more than 10% compared to the 2010
baselines) or relatively stable (with positive or negative changes no larger than
10%).
Table 18. EU-28 results for incidence, participation, intensity and expenditure in 2015 and 2010
Indicator value Absolute
difference
Relative
difference (in
%)
2010 2015 2015-2010 2015-2010
Incidence (%) 65.7 72.6 6.9 10.50%
Participation (%) 37.6 40.8 3.2 8.51%
Intensity (hours) 5.8 6.2 0.4 6.90%
Expenditure (%) 0.8 0.9 0.1 12.50%
Source: Eurostat, CVTS4 and CVTS 5, dissemination database (accessed 6.2.2018); own calculations.
The report shows that the training gap between large and small
enterprises narrowed over 2010-15. This is summarised in Table 19. For the
EU-28 average, this occurred on all four indicators, both in terms of absolute
and relative performance gaps. As measured by the relative performance gap
between large and small enterprises, inequities in training incidence fell from
50% in 2010 to 38% in 2015; inequities in training participation fell from 84% to
59%, in training intensity from 100% to 68% and in training expenditure from
43% to 25%. Training gaps also reduced in most countries. In relative terms,
inequalities in training provision between small and large enterprises dropped
in 21 countries. Inequalities in participation rates between small and large
enterprises dropped in 16 countries, while inequalities in training intensity and
total monetary expenditure dropped in 14 countries.
Table 19. Enterprise size class and key CVT indicators
Incidence Participation Intensity Spending
2015 EU-28 Small (S) 69.3% 30.0% 4.4 hours 0.8%
Medium (M) 85.6% 37.2% 5.7 hours 0.9%
Large (L) 95.3% 47.7% 7.4 hours 1.0%
2015 Country differences
L>M>S 27 countries and EU-28
23 countries and EU-28
24 countries and EU-28
20 countries and EU-28
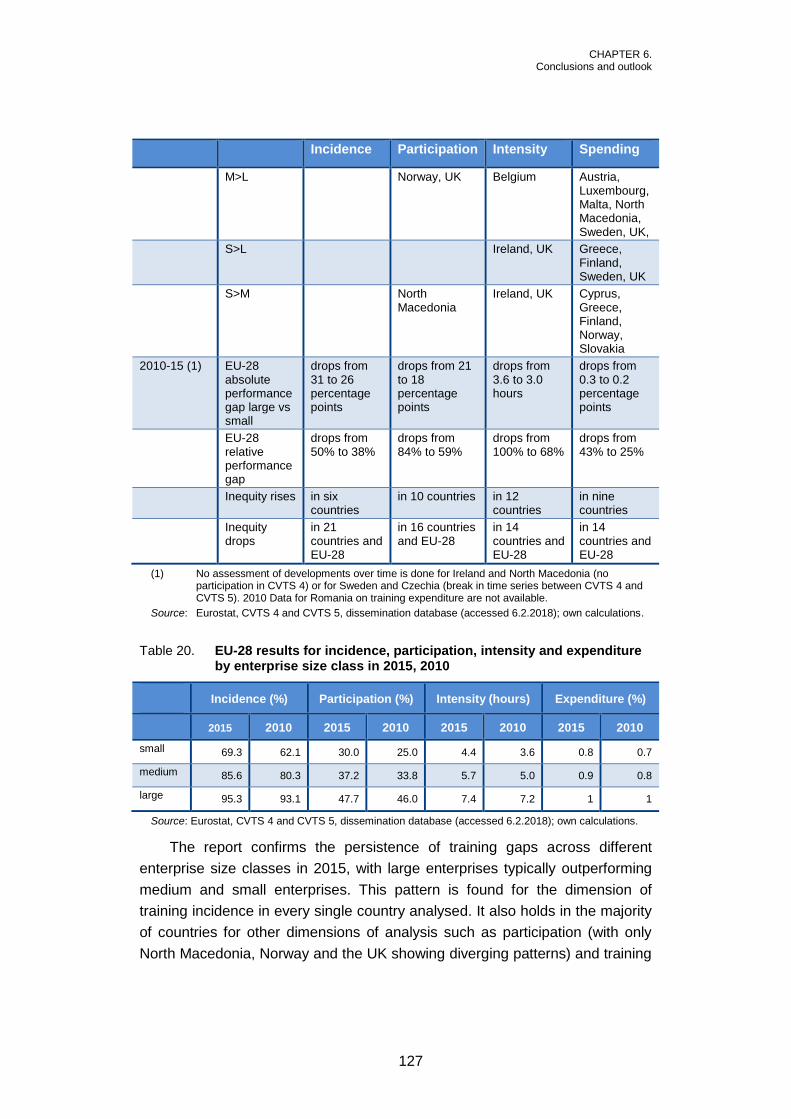
CHAPTER 6. Conclusions and outlook
127
Incidence Participation Intensity Spending
M>L Norway, UK Belgium Austria, Luxembourg, Malta, North Macedonia, Sweden, UK,
S>L Ireland, UK Greece, Finland, Sweden, UK
S>M North Macedonia
Ireland, UK Cyprus, Greece, Finland, Norway, Slovakia
2010-15 (1) EU-28 absolute performance gap large vs small
drops from 31 to 26 percentage points
drops from 21 to 18 percentage points
drops from 3.6 to 3.0 hours
drops from 0.3 to 0.2 percentage points
EU-28 relative performance gap
drops from 50% to 38%
drops from 84% to 59%
drops from 100% to 68%
drops from 43% to 25%
Inequity rises in six countries
in 10 countries in 12 countries
in nine countries
Inequity drops
in 21 countries and EU-28
in 16 countries and EU-28
in 14 countries and EU-28
in 14 countries and EU-28
(1) No assessment of developments over time is done for Ireland and North Macedonia (no participation in CVTS 4) or for Sweden and Czechia (break in time series between CVTS 4 and CVTS 5). 2010 Data for Romania on training expenditure are not available.
Source: Eurostat, CVTS 4 and CVTS 5, dissemination database (accessed 6.2.2018); own calculations.
Table 20. EU-28 results for incidence, participation, intensity and expenditure by enterprise size class in 2015, 2010
Incidence (%) Participation (%) Intensity (hours) Expenditure (%)
2015 2010 2015 2010 2015 2010 2015 2010
small 69.3 62.1 30.0 25.0 4.4 3.6 0.8 0.7
medium 85.6 80.3 37.2 33.8 5.7 5.0 0.9 0.8
large 95.3 93.1 47.7 46.0 7.4 7.2 1 1
Source: Eurostat, CVTS 4 and CVTS 5, dissemination database (accessed 6.2.2018); own calculations.
The report confirms the persistence of training gaps across different
enterprise size classes in 2015, with large enterprises typically outperforming
medium and small enterprises. This pattern is found for the dimension of
training incidence in every single country analysed. It also holds in the majority
of countries for other dimensions of analysis such as participation (with only
North Macedonia, Norway and the UK showing diverging patterns) and training

Continuing vocational training in EU enterprises
128
intensity (with exceptions being Belgium, Ireland and the UK). Training gaps
across enterprise size classes are smaller when measured in in terms of total
monetary expenditure (expressed as % of total labour costs); in more countries
the break-down by enterprise size class does not conform to the pattern of
increasing expenditure with increasing size. Results are mirrored by EU
averages (Table 20). In 2015 in the EU, almost all large enterprises (95.3%)
provided training to their staff (but only 69.3% of small enterprises did so). In
large enterprises, staff participation in CVT courses (47.7%) was considerably
higher than in small enterprises (30%), as was the corresponding time devoted
to training (7.4 hours per 1 000 hours worked as opposed to 4.4). Although
smaller, differences also persist in total monetary expenditure on CVT courses
(1.0% of total labour cost in large enterprise as opposed to 0.8% in small ones)
(Table 20).
Policy attention paid to SME training patterns should be kept particularly
high in countries where, by international comparisons, they account for a larger
share of the economy. This is the case in Bulgaria, Greece, Italy, Cyprus,
Latvia, Lithuania and Romania, which also present comparatively lower levels
of enterprise training performance.
The report also analyses the reasons reported by EU enterprises for not
providing (further) training in 2015, indicating a stable, yet not fully reassuring,
picture compared to previous survey waves. A majority of enterprises who did
not provide training to their staff (82%) identified no need as the main reason;
they perceive available skills matching their current needs. Even among large
enterprises a clear majority (69%) states that available qualification, skills and
competences match current needs; 55% of non-training enterprises adopt a
skill development strategy other than training in the form of recruitment of new
staff with the required skills to fulfil company needs. Larger non-training
enterprises more often adopt this strategy compared to medium-sized and
small enterprises. One in four non-training enterprises stresses the importance
of IVT as an alternative to CVT, with no or small variation by size class.
Reasons which can be more properly considered as obstacles for non-training
enterprises are less frequently indicated, but they still play an important role.
The major obstacles are time and cost. One third of non-training enterprises
quote a high workload and a lack of time for staff to participate; a slightly
smaller share (28%) of enterprises quotes high costs of CVT courses. Both
time and cost barriers are reported with little variation across enterprise sizes.
A similar pattern emerges from the analysis of the reasons not to provide
further training, as indicated by firms which sponsored training activities.
Findings are coherent with those of previous survey waves, CVTS 3 for 2005

CHAPTER 6. Conclusions and outlook
129
and CVTS 4 for 2010. They suggest the importance of policies continuing to
act in two directions: increasing awareness of the importance of training as a
way to update and enlarge skills and competences in a way which goes
beyond the mere satisfaction of short-term skills needs (a way which considers
training as an investment for continuous skills development in a broader and
longer-term perspective); and removing obstacles to training, particularly
related to time and cost,
The report also analyses the main skill needs identified by employers as
captured in the CVTS methodological framework. When EU-28 enterprises are
asked to indicate the top three skills which they consider important for their
development in the near future, technical, practical or job-specific skills come
out on top, selected by 46% of enterprises. The importance of technical,
practical or job-specific skills is often combined with priority provision of related
training courses: 65% of training enterprises state that this skills domain is a
top subject for their CVT courses. Skills/competences in customer handling
and teamwork are considered important by 41% of all enterprises and
prioritised in training provision by, respectively, 26% (customer handling) and
20% (teamwork) of training enterprises. These three skill bundles (technical,
practical or job-specific skills, customer handling skills and team working skills)
are those most frequently indicated as important by enterprises in the EU and
are the main skills considered important by enterprises in almost all countries.
In every country technical, practical or job-specific skills are the most
frequently indicated priority target of CVT courses. Next to technical, practical
or job-specific skills, customer handling skills are generally prioritised as a
subject of employer-sponsored CVT courses (26% of training enterprises in the
EU) and across most of countries. Management skills are present in the top
three of skill bundles targeted in 11 countries, while team working skills are
present in the top three of skill bundles targeted by training in five countries
(Bulgaria, Estonia, Italy, Portugal and Romania).
Main skill needs do not differ considerably across enterprise size classes
for the EU-28. Only for management skills do large differences between size
classes exist, and the importance of management skills for future enterprise
development rises with enterprise size. This also holds for skills primarily
targeted by courses. Compared to the CVTS 4 survey, the rank order of skills
deemed important, as well as the rank order of skills targeted by enterprises, is
similar over time for the EU-28 average. Based on CVTS metrics, technical
practical and job-related skills emerge as the top priority for employers both
when indicating main skills important for enterprises development and when

Continuing vocational training in EU enterprises
130
prioritising provision of CVT to their staff. In contrast, literacy and numeracy
skills emerge as a low priority.
In conclusion, the report shows that CVTS data are a unique and precious
source of policy-relevant information. It provides a coherent synthetic statistical
picture of employer-sponsored CVT in Europe and related changes over time.
It shows that a moderate but favourable expansion in the provision of
employer-sponsored CVT has occurred in EU enterprises, and that a reduction
in inequalities based on their size has occurred in 2015 compared to 2010. The
report also shows that, despite progress achieved, notable training gaps
persist among EU enterprises in the provision of employer-sponsored CVT,
across countries and enterprise size classes, with resulting training levels
comparatively lower in small and medium firms. In line with previous results,
the report confirms that the main reasons which employers indicate for not
providing (further) training relate to the perceived absence of a need and the
adoption of a different skills development strategy. Yet, obstacles to training,
related to time and cost, continue to play an important role. In the EU as a
whole, no major variation is observed in the patterns of skills considered
important by employers. Policy implications of key findings are discussed in the
relevant section of the executive summary.

131
Abbreviations and acronyms
Cedefop European Centre for the Development of Vocational Training
CVET continuing vocational education and training
CVT continuing vocational training
CVTS continuing vocational training survey
EU European Union
ISCED International standard classification of education
IT information technology
IVT initial vocational training
LLL lifelong learning
LFS labour force survey
NACE Statistical classification of economic activities in the European Community
n.e.c. not elsewhere classified
NSA national statistics authority
PAC personnel absence costs
LCS labour cost survey
PPS purchasing power standards
SME medium-sized enterprise
SMOP surface measure of overall performance
TME total monetary expenditure
VET vocational education and training
132
References
[URLs accessed 14.2.2019]
Arasanz Diaz, J. (2009). Spain: collective bargaining and continuous
vocational training. Dublin: Eurofound.
http://www.eurofound.europa.eu/eiro/studies/tn0804048s/es0804049q.htm
Behringer, F. et al. (2008). Overview of key results of CVTS2: a graphical
presentation in the form of radar charts. In: Markowitsch, J.; Hefler, G.
(eds). Enterprise training in Europe: comparative studies on cultures,
markets and public support initiatives, pp. 6-23. Münster: Lit Verlag.
Cedefop (2008). Sectoral training funds in Europe. Luxembourg: Publications
Office. Cedefop Panorama series; No 156.
http://www.cedefop.europa.eu/EN/Files/5189_en.pdf
Cedefop (2010). Employer-provided vocational training in Europe. Evaluation
and interpretation of the third continuing vocational training survey.
Luxembourg: Publications Office. Cedefop research paper; No 2.
http://www.cedefop.europa.eu/it/publications-and-
resources/publications/5502
Cedefop (2015). Job-related adult learning and continuing vocational training in
Europe. A statistical picture. Luxembourg: Publications Office. Cedefop
research paper; No 48. http://www.cedefop.europa.eu/it/publications-and-
resources/publications/5548
Chivu, L. (2009). Romania: collective bargaining and continuous vocational
training. Dublin: Eurofound.
http://www.eurofound.europa.eu/eiro/studies/tn0804048s/ro0804049q.htm
Council of the European Union (2009). Council conclusions of 12 May 2009 on
a strategic framework for European cooperation in education and training
(ET 2020). Official Journal of the European Union, C 119, 28.5.2009,
pp. 2-10.
http://eurlex.europa.eu/LexUriServ/LexUriServ.do?uri=OJ:C:2009:119:000
2:0010:en:PDF
Council of the European Union (2011). Council resolution on a renewed
European agenda for adult learning. Official Journal of the European
Union, C 372, 20.12.2011, pp. 1-6. http://eur-
lex.europa.eu/LexUriServ/LexUriServ.do?uri=OJ:C:2011:372:0001:0006:e
n:PDF
Council of the European Union (2018). Council Decision (EU) 2018/1215 of 16
July 2018 on guidelines for the employment policies of the Member
States. Official Journal of the European Union, L 224/4, 5.9.2018.
https://eur-lex.europa.eu/legal-
content/EN/TXT/PDF/?uri=CELEX:32018D1215&from=EN

References
133
European Commission (2005). Statistics relating to vocational training in
enterprises. Commission Regulation (EC) No 198/2006 of 3 February
2006 implementing Regulation (EC) No 1552/2005. https://eur-
lex.europa.eu/legal-
content/EN/TXT/?qid=1415897446863&uri=CELEX:32006R0198
European Commission (2010a). An agenda for new skills and jobs. A
European contribution towards full employment. Communication from the
Commission to the European Parliament, the Council, the European
Economic and Social Committee and the Committee of the Regions.
https://publications.europa.eu/en/publication-detail/-/publication/7f39a8c6-
068e-434d-a7ce-a9665bf227f9
European, Commission (2010b). Statistics relating to vocational training in
enterprises, as regards the data to be collected, the sampling, precision
and quality requirements. Commission Regulation (EU) No 822/2010 of 17
September 2010 amending Regulation (EC) No 198/2006 implementing
Regulation (EC) No 1552/2005 of the European Parliament and of the
Council. https://eur-lex.europa.eu/legal-
content/EN/TXT/?qid=1415897446863&uri=CELEX:32010R0822
European Commission (2011). Supporting vocational education and training in
Europe. The Bruges communiqué. Luxembourg: Publications Office.
http://ec.europa.eu/education/library/publications/2011/bruges_en.pdf
European Commission (2012a). Rethinking education: investing in skills for
better socioeconomic outcomes. Communication from the Commission to
the European Parliament, the Council, the European Economic and Social
Committee and the Committee of the Regions. COM(2012) 669 final.
http://eurlex.europa.eu/LexUriServ/LexUriServ.do?uri=COM:2012:0669:FI
N:EN:PDF
European Commission (2012b). Education and training for a smart,
sustainable and inclusive Europe: analysis of the implementation of the
strategic framework for European cooperation in education and training
(ET 2020) at the European and national levels. Communication from the
Commission to the European Parliament, the Council, the European
Economic and Social Committee and the Committee of Region.
SEC(2011) 1607 final. http://aei.pitt.edu/42905/1/SEC_(2011)_1607.pdf
European Commission (2014a). Taking stock of the Europe 2020 strategy for
smart, sustainable and inclusive growth. Communication from the
Commission to the European Parliament, the Council, the European
Economic and Social Committee and the Committee of the Regions.
COM(2014) 130 final/2.
http://eurlex.europa.eu/resource.html?uri=cellar:2f43f773-b05c-11e3-86f9-
01aa75ed71a1.0001.01/DOC_1&format=PDF
European Commission (2014b). Amending Regulation (EC) No 198/2006 as
regards the data to be collected, and the sampling, precision and quality

Continuing vocational training in EU enterprises
134
requirements. Commission Regulation (EU) No 1153/2014 of 29 October
2014. https://eur-lex.europa.eu/legal-
content/EN/TXT/?qid=1415897446863&uri=CELEX:32014R1153
Eurostat (2012). CVTS 4 manual – Version 6. European Commission.
https://circabc.europa.eu/sd/a/76f1c351-6b9c-497a-b3b0-
876820d91507/1_MANUAL_Version6.pdf
Eurostat (2015). Continuing vocational training survey 2010 (CVTS 4). EU
quality report. European Commission.
https://circabc.europa.eu/sd/a/df1e99e0-18b1-47e8-92c0-
ece31c25f883/CVTS 4_QR_final_20151020.pdf
Eurostat (2016). CVTS 5 manual – Version 1.2. European Commission.
https://circabc.europa.eu/sd/a/43cebda2-6b09-4298-b9b9-
ba57d1f42301/1_CVTS 5manual_V1-2_20161201.pdf
Giaccone, M. (2009). Italy: collective bargaining and continuous vocational
training. Dublin: Eurofound.
http://www.eurofound.europa.eu/eiro/studies/tn0804048s/it0804049q.htm
Johanson, R. (2009). A review of national training funds. Social protection
discussion paper No 0922. Washington DC.: World Bank.
http://documents.worldbank.org/curated/en/893311468178131914/A-
review-of-national-training-funds
Mosley, H.; Mayer, A. (1999). Benchmarking national labour market
performance: a radar chart approach. Discussion paper FS I 99-202.
Berlin: WZB – Wissenschaftszentrum Berlin für Sozialforschung.
Müller, N.; Behringer, F. (2012). Subsidies and levies as policy instruments to
encourage employer-provided training. OECD education working paper
No 80. Paris: OECD.
Naumann, R.; Rego, R.; Wochnik, M. (2009). Portugal: collective bargaining
and continuous vocational training in Europe. Eurwork Observatory,
Eurofound.
https://www.eurofound.europa.eu/publications/report/2009/portugal-
collective-bargaining-and-continuous-vocational-training-in-europe
Neubäumer R. & Kohaut, S (2007). A double hurdle approach for company
further training behaviour and an empirical test of this using data from the
IAB establishment panel. Zeitschrift für Arbeitsmarkt Forschung [Journal
for Labour Market Research], Vol. 40(2/3), pp. 251-269. Nürnberg: Institut
für Arbeitsmarkt- und Berufsforschung (IAB), [Institute for Employment
Research. https://ideas.repec.org/a/iab/iabzaf/v2007i2-3p251-269.html
135
Further reading
[URLs accessed 14.2.2019]
Cedefop (2011). The impact of vocational education and training on company
performance. Luxembourg: Publications Office. Cedefop research paper;
No 19. http://www.cedefop.europa.eu/en/publications-and-
resources/publications/5519
Cedefop (2012). Learning and innovation in enterprises. Luxembourg:
Publications Office. Cedefop research paper; No 27.
http://www.cedefop.europa.eu/EN/Files/5527_en.pdf
European Commission (2000). A memorandum on lifelong learning.
Commission staff working paper. SEC(2000) 1832.
http://arhiv.acs.si/dokumenti/Memorandum_on_Lifelong_Learning.pdf
European Commission (2001). Making a European area of lifelong learning a
reality. Communication from the Commission, COM(2001) 678 final.
http://eurlex.europa.eu/LexUriServ/LexUriServ.do?uri=COM:2001:0678:FI
N:EN:PDF
European Commission (2007). Action plan on adult learning: it is always a
good time to learn. Communication from the Commission to the Council,
the European Parliament, the European Economic and Social Committee
and the Committee of the Regions. COM(2007) 558 final.
http://eurlex.europa.eu/LexUriServ/LexUriServ.do?uri=COM:2007:0558:FI
N:EN:PDF
European Commission et al. (2013). Funding of education in Europe 2000-
2012: the impact of the economic crisis. Eurydice report. Luxembourg:
Publications Office. https://publications.europa.eu/en/publication-detail/-
/publication/ec383cc3-a5c9-4146-846c-fb18dea32aca/language-
en/format-PDF
European Commission; EACEA; Eurydice (2015). Adult education and training
in Europe: widening access to learning opportunities. Eurydice report.
Luxembourg: Publications Office.
https://publications.europa.eu/en/publication-detail/-/publication/aaeac7ed-
7bad-11e5-9fae-01aa75ed71a1
Hefler, G.; Markowitsch, J. (2008). To train or not to train: explaining
differences in average enterprise training performance in Europe, a
framework approach. In: Markowitsch, J.; Hefler, G. (eds). Enterprise
training in Europe: comparative studies on cultures, markets and public
support initiatives, pp. 23-60. Vienna: LIT-Verlag.
Markowitsch, J.; Käpplinger, B.; Hefler, G. (2013). Firm-provided training in
Europe and the limits of national skills strategies. European journal of

Continuing vocational training in EU enterprises
136
education, Vol. 48, No 2, pp. 281-291.
http://onlinelibrary.wiley.com/doi/10.1111/ejed.12030/pdf
Moraal, D.; Grünewald, U. (2004). Moderne Weiterbildungsformen in der Arbeit
und Probleme ihrer Erfassung und Bewertung in Europa [Modern forms of
training in the work and problems of their collection and evaluation in
Europe]. Zeitschrift für Berufs- und Wirtschaftspädagogik, Vol. 18,
pp. 174-186.
UOE (2005). UOE data collection on education systems, Vol. 1 – Manual
concepts, definitions and classifications. Montreal: UNESCO.

137
Web links
[URLs accessed 19.3.2019]
Reference Metadata in Euro SDMX Metadata Structure (ESMS)
https://ec.europa.eu/eurostat/cache/metadata/en/trng_cvt_esms.htm
Eurostat’s own quality assessment of CVTS 4
https://ec.europa.eu/eurostat/web/education-and-training/quality

138
ANNEX 1. CVTS 5 data quality
A.1.1 Geographic coverage
The geographic coverage of CVTS has increased over time. The first CVTS
round in 1993 was carried out as a pilot survey with a sample of 50 000
enterprises in all 12 EU Member States at the time. The second round of the
CVTS took place in 1999 and covered 24 of the current EU-28 Member States
(Croatia, Cyprus, Malta and Slovakia were not included and in Poland only the
region of Pomorskie was surveyed). In 2005, the third CVTS survey covered
the EU-27 of that time and also Norway. In 2010 coverage included the 27 EU
Member States (excluding Ireland) and Norway. The fifth CVTS round in 2015
covers 30 countries, the current EU-28 Member States as well as Norway and
North Macedonia.
Table A 1. Country coverage in the CVTS rounds 1-5
CVTS 1
(1993)
CVTS 2
(1999)
CVTS 3
(2005)
CVTS 4
(2010)
CVTS 5
(2015)
AT X X X X
BE X X X X X
BG X X X X
CY X X X
CZ X X X X
DE X X X X X
DK X X X X X
EE X X X X
EL X X X X X
ES X X X X X
FI X X X X
FR X X X X X
HR X X
HU X X X X
IE X X X X
IT X X X X X
LT X X X X
LU X X X X X
LV X X X X
MK X
MT X X X
NL X X X X X
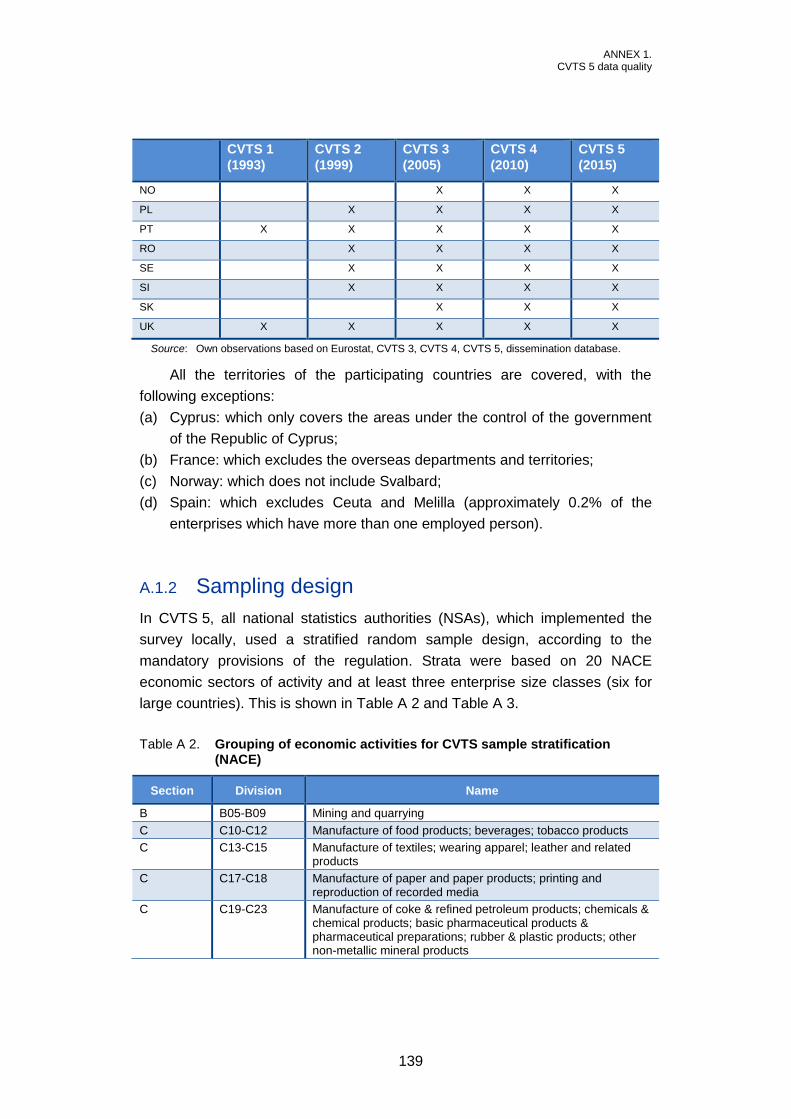
ANNEX 1. CVTS 5 data quality
139
CVTS 1
(1993)
CVTS 2
(1999)
CVTS 3
(2005)
CVTS 4
(2010)
CVTS 5
(2015)
NO X X X
PL X X X X
PT X X X X X
RO X X X X
SE X X X X
SI X X X X
SK X X X
UK X X X X X
Source: Own observations based on Eurostat, CVTS 3, CVTS 4, CVTS 5, dissemination database.
All the territories of the participating countries are covered, with the
following exceptions:
(a) Cyprus: which only covers the areas under the control of the government
of the Republic of Cyprus;
(b) France: which excludes the overseas departments and territories;
(c) Norway: which does not include Svalbard;
(d) Spain: which excludes Ceuta and Melilla (approximately 0.2% of the
enterprises which have more than one employed person).
A.1.2 Sampling design
In CVTS 5, all national statistics authorities (NSAs), which implemented the
survey locally, used a stratified random sample design, according to the
mandatory provisions of the regulation. Strata were based on 20 NACE
economic sectors of activity and at least three enterprise size classes (six for
large countries). This is shown in Table A 2 and Table A 3.
Table A 2. Grouping of economic activities for CVTS sample stratification (NACE)
Section Division Name
B B05-B09 Mining and quarrying
C C10-C12 Manufacture of food products; beverages; tobacco products
C C13-C15 Manufacture of textiles; wearing apparel; leather and related products
C C17-C18 Manufacture of paper and paper products; printing and reproduction of recorded media
C C19-C23 Manufacture of coke & refined petroleum products; chemicals & chemical products; basic pharmaceutical products & pharmaceutical preparations; rubber & plastic products; other non-metallic mineral products
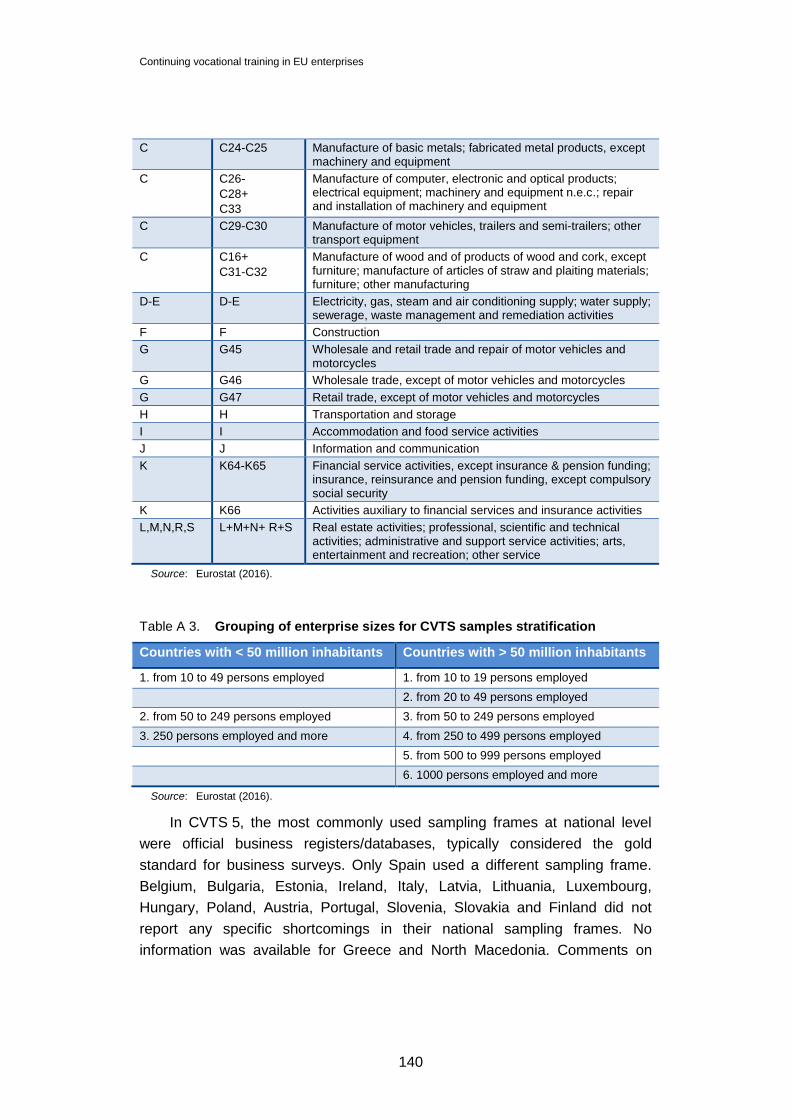
Continuing vocational training in EU enterprises
140
C C24-C25 Manufacture of basic metals; fabricated metal products, except machinery and equipment
C C26-
C28+
C33
Manufacture of computer, electronic and optical products; electrical equipment; machinery and equipment n.e.c.; repair and installation of machinery and equipment
C C29-C30 Manufacture of motor vehicles, trailers and semi-trailers; other transport equipment
C C16+
C31-C32
Manufacture of wood and of products of wood and cork, except furniture; manufacture of articles of straw and plaiting materials; furniture; other manufacturing
D-E D-E Electricity, gas, steam and air conditioning supply; water supply; sewerage, waste management and remediation activities
F F Construction
G G45 Wholesale and retail trade and repair of motor vehicles and motorcycles
G G46 Wholesale trade, except of motor vehicles and motorcycles
G G47 Retail trade, except of motor vehicles and motorcycles
H H Transportation and storage
I I Accommodation and food service activities
J J Information and communication
K K64-K65 Financial service activities, except insurance & pension funding; insurance, reinsurance and pension funding, except compulsory social security
K K66 Activities auxiliary to financial services and insurance activities
L,M,N,R,S L+M+N+ R+S Real estate activities; professional, scientific and technical activities; administrative and support service activities; arts, entertainment and recreation; other service
Source: Eurostat (2016).
Table A 3. Grouping of enterprise sizes for CVTS samples stratification
Countries with < 50 million inhabitants Countries with > 50 million inhabitants
1. from 10 to 49 persons employed 1. from 10 to 19 persons employed
2. from 20 to 49 persons employed
2. from 50 to 249 persons employed 3. from 50 to 249 persons employed
3. 250 persons employed and more 4. from 250 to 499 persons employed
5. from 500 to 999 persons employed
6. 1000 persons employed and more
Source: Eurostat (2016).
In CVTS 5, the most commonly used sampling frames at national level
were official business registers/databases, typically considered the gold
standard for business surveys. Only Spain used a different sampling frame.
Belgium, Bulgaria, Estonia, Ireland, Italy, Latvia, Lithuania, Luxembourg,
Hungary, Poland, Austria, Portugal, Slovenia, Slovakia and Finland did not
report any specific shortcomings in their national sampling frames. No
information was available for Greece and North Macedonia. Comments on

ANNEX 1. CVTS 5 data quality
141
minor issues related to the sampling registers used for CVTS 5 are shown in
Table A 4.
Table A 4. Sampling frame shortcomings
Country Sampling frame shortcomings
Croatia Time lag between the last update of the sampling frame and the moment of the actual sampling from the Statistic business register. In the field enterprises often provide activities from the Administrative business register, so for the processing we have opted to use SBR data since they are updated daily and considered to be more accurate.
Cyprus The sampling frame was extracted from the Cyprus Statistical business register. The register covers all legal units, enterprises, local units and enterprise groups carrying out an economic activity according to the Statistical classification of economics activities NACE Rev. 2 of the EU. It is updated on an annual basis. The sample was selected from the sampling frame with 2014 as reference year, since this was the latest available version. Some enterprises in the sample were ineligible (did not belong to the target population of enterprises).
Czechia Business register was used to draw a sampling frame and a sample. The sampling was done in December (with data available on 2015.11.2030), however, some data (e.g. on employed persons) referred to September 2015. It also did not reflect creation of new firms or their abolishment provided it was done in December.
Denmark The enterprises are sampled based on their CVR-number. However, the activities of some companies involve several CVR-numbers which means that the answers in the interview cannot be related to the specific CVR-number sampled. As various people in the enterprise had to answer specific parts of the interview, several inconsistencies in the answers were found in the data. The follow-up and corrections necessary demanded considerable effort.
France The French Statistical business register (SIRENE register) can be useful as a database due to the vast amount of administrative data which it contains, since enterprises are identified in all national registers by their SIRENE number. Some data are updated daily, although there is no updating of all the data at the same time on a fixed date. That also means that, for a given variable, the update is not the same for all enterprises, so that the value available is the one most recently registered for this enterprise.
Germany The time lag of address data was only two months, but the time lag of data about the number of employees was two years.
Malta The NSO makes regular updates to its business register, which in turn is used as the sampling frame for this survey. There is a time lag from the date of the last update up to the date when sampling is conducted.
Netherlands National business register of 31.12.2015. This register contains (all) enterprises and their legal units in the Netherlands. Shortcomings include timeliness (e.g. time lag between last update of the sampling frame and the moment of the actual sampling), geographic coverage, and coverage of different subpopulations.
Norway The sampling frame was the Norwegian Business register. The register is of good quality and both over- and under-coverage are usually fairly small. However, there are changes, especially among the smallest enterprises, which are less stable. Small enterprises more often close down than the large ones and they are also more prone to be taken over by others than large local units. Accordingly, we must expect some movement between different size groups from the point of time when the sample was drawn to the time of interview.

Continuing vocational training in EU enterprises
142
Country Sampling frame shortcomings
Romania The sampling frame used to draw the sample was built using the Romanian Business register and contained the statistical information related to the reference period, the calendar year 2015. The register was designed and implemented having administrative files and statistical sources as main data sources. The main administrative source of data for REGIS is the Fiscal register. The Trade register is used as a consultation data source to improve the quality of the register. Other files used as source of data for the REGIS in Romania are: balance sheet files; VAT files; an exclusively REGIS survey for the new enterprises regarding their main activity and size. The information received from different data sources (surveys carried out by INS in Romania) is also complemented. As a consequence, the main over/under coverage problems are related to information quality concerning size class of enterprises by number of employees.
Spain The Social Security contribution accounts only include workers covered by the Social Security regime (although these are the majority). Workers included under the Special regime for civil servants are not included but the majority work in agencies with NACE 84 and 85 would therefore not be included in the target population. Contribution accounts are updated continuously.
Sweden Swedish Företagsregister or business register. The register contains information on all of the country’s enterprises. It is updated with information from the tax authorities (weekly), Sweden Address Change AB (bi-weekly), Statistics Sweden's business census (annually in November) and feedback from external users (continuously). There can be a lag of one day to one year for number of employed persons.
Source: CVTS 5 national quality reports.
A.1.3 Characteristics of the data collection
Participation in the 2015 CVTS was compulsory in 23 participating countries
and voluntary in seven others (Austria, Belgium, Denmark, Germany, North
Macedonia, Norway and the UK).
In Czechia and Malta, exemptions from compulsory participation were
possible. Compared to CVTS 4 only Slovakia changed participation from
voluntary (CVTS 4) to mandatory (CVTS 5).
In all countries except Spain, the CVTS survey was implemented as a
stand-alone survey both in CVTS 5 and CVTS 4. In Spain, the CVTS survey
was embedded in the annual labour survey. This is a multiple purpose
enterprise survey conducted on a yearly basis from reference year 2013. It
collects information about the way companies adapt to economic changes in
their environment, through internal flexibility measures such as geographic or
functional mobility, wage flexibility, workday or timetable modifications, or
through other – external – measures, as well as labour relations regulation,
employer associations, vocational training related issues and economic
prospects.
The data collection approach is determined nationally: countries
implement the survey according to the approach that is best suited to obtaining

ANNEX 1. CVTS 5 data quality
143
a sufficiently high response rate. In many countries, multi-mode data collection
methods were implemented to ensure participation by enterprises. The
questionnaire was mostly self-administered online or on paper. Face-to-face
interviews were carried out only in Germany, Greece, Cyprus and the UK.
Telephone interviews were used in Denmark, France, Austria and also the UK.
Various countries use administrative sources for background variables on
sector of activity (var A1), employment (var A2tot, A2m, A2f), hours worked
(var A4) and labour costs (var A5). Only Portugal conducted the survey by
using data from administrative sources on participation in CVT and paid
working time spent on CVT. Spain uses administrative data on enterprises’
contributions to funds aimed at CVT. In Belgium, data from administrative
sources were used to impute missing values on participation in CVT, paid
working time spent on CVT, total cost of CVT provision, as well as on
enterprises’ contributions to funds aimed at CVT and subsidies or fund receipts
aimed at CVT provision.
Table A 5. Administrative data used in CVTS 5 on key CVT indicators
Contributions to funds
aimed at CVT
Subsidies or fund receipts aimed at
CVT
Persons employed
participating in CVT course
Paid working time spent on CVT
Total costs of
CVT provision
total by gender
total internal/external
B5a B5b C1 tot
C2m, C2f
C3 tot
C3i, C3e C7sub
Belgium X X X X X
Spain X
Portugal X X X X
Source: Own observations based on national quality reports.
A.1.4 Deviation in concepts or definitions
For CVTS 4 and CVTS 5 most countries conducted their surveys in line with
the regulations. Some deviations are reported in an effort to adapt the
regulations efficiently at national level (e.g. slight changes in the questionnaire,
including wording and sequence of questions, use of administrative data for
the completion of specific items of the questionnaire). For North Macedonia no
country report is available.
In CVTS 5, only some countries report deviation in concept definitions for
certain variables, which should be kept in mind when reading the data. Data for

Continuing vocational training in EU enterprises
144
Belgium, Denmark and Spain refer to employees rather than persons
employed. In Italy, data for persons employed refer to the annual average in
2015 and not the situation at the end of the reference period. In Czechia, the
definition of persons employed has been used in a way which does not include
persons working under contracts of services without an employment
relationship. This kind of contracting staff is a national speciality; it is usually
done just for a short time period and it could distort the results by introducing
bias in international comparisons. Also for the national analysis and comparing
results with other surveys it is more convenient not to include those working
under contracts of services in the concept of persons employed.
In CVTS 5, only five countries indicate deviations from the model
questionnaire, with no or minor implications for the data presented in this
report.
Table A 6. Deviations in variable implementation
No deviations Belgium, Bulgaria, Cyprus, Denmark, Estonia, Finland, France, Croatia, Hungary, Ireland, Italy, Latvia, Lithuania, Luxembourg, Malta, Netherlands, Norway, Poland, Portugal, Romania, Slovenia, Slovakia, United Kingdom
Deviation with no impact Austria, Czechia, Germany, Sweden
Deviations Spain
Source: Own observations based on national quality reports.
In Austria the question on staff representative involvement in CVT used
two separate questions: one on whether there are staff
representatives/committees, and one on whether they are involved in the CVT
management process.
In Czechia some variables were split into more detailed variables, some
items were added (e.g. statistics for persons employed at the age of 55 years
and older, or number of persons employed who attended courses that were
part of formal education). In section D, questions were added following a
discussion with representatives of various national interest groups during the
questionnaire development.
In Germany, the costs for training centre, rooms and teaching materials
were surveyed in two questions.
In Sweden, the ordering of the questions D3b-D3iT and questions E1a-E1i
were different in the Swedish questionnaire compared to the Eurostat manual.
In Spain the question ‘Is there a specific person or unit within the
enterprise having the responsibility for the organisation of CVT?’ has three
answer categories instead of two.

ANNEX 1. CVTS 5 data quality
145
In answering the question on the most important training providers the
enterprise used for all external CVT courses, respondents are asked to tick the
three most important training providers from a list. Respondents are asked to
consider the most important providers in relation to the number of all training
hours during paid working time in external courses. In Spain, respondents are
asked to consider the most important training providers for external CVT
courses undertaken both during and outside working hours.
Table A 7. Deviations from questionnaire
No deviations Austria, Belgium, Bulgaria, Cyprus, Denmark, Germany, Spain, France, Croatia, Hungary, Ireland, Latvia, Lithuania, Luxembourg, Malta, Netherlands, Norway, Poland, Portugal, Romania, Sweden, Slovenia, Slovakia, United Kingdom
Deviations Czechia, Finland, Italy, Estonia
Source: Own observations based on national quality reports.
The total number of hours worked was not included in the Czech version
of the CVTS questionnaire but appended to the data matrix from the labour
cost survey (LCS).
On CVT costs, Czech companies were asked to fill in the total amount of
money spent on any training (of any kind, not only courses) in question C7sub
of the European standard questionnaire (Eurostat, 2016). According to the
Czech experience, enterprises are not able to distinguish between expenditure
on different forms of education and they only record the total amount spent on
training in their accountancy. This makes expenditure data from Czechia in
2015 not comparable with other countries and not comparable with previous
CVTS. The total labour costs of persons employed was also absent from the
Czech version of the CVTS questionnaire but appended to the data matrix
form as a result of estimations based on the LCS survey data (2).
Due to an error, variables A12o (answer category ‘do not know’ on the
question about skills deemed most important) and D2Be (answer category
‘other’ on the question about methods used to assess outcomes of CVT
activities) were absent from the Finnish CVTS 5 questionnaire. In Italy, the
number of persons employed is an average of 2015.
(2) The following formula was used: as a sum of the following variables: wages
without other personal expenditure + social expenditures without cars and
compensation money + personal expenditures + compensation money to
surrenders + number of cars usable also for personal purposes * 48 000 of CZK +
taxes and sanctions related to employing people - subsidies.

Continuing vocational training in EU enterprises
146
In Estonia, questions A1 (principal economic activity of enterprise), A2
(number of persons employed in 2015) and A5 (total labour costs of persons
employed in 2015) were not asked in the questionnaire but entered from the
business register. Question A4 (total number of hours worked by persons
employed in 2015) was moved into section C as both A4 and C3tot (paid
working time (in hours) spent on all CVT courses in 2015) concern the concept
of paid working time. However, this caused an unforeseen consequence as the
people with no CVT in the year did not answer section C and therefore did not
provide any answer for A4 as well. This was only discovered after the data
collection was complete. To provide better data and limit the rate of non-
response, some of the missing values were entered from other sources (with
the same definition for the variable) for enterprises which had filled both
questionnaires. This left a fairly low rate of non-response, which we were able
to impute later on for the imputed dataset.
Due to question A9 (Does the enterprise regularly assess future skill
needs?) and A10 (How does enterprise usually react to future skills needs?)
sharing a similar concept (future needs), the question A10 was only asked if
the answer to the previous question A9 was ‘yes’ (2 or 3). In the case of
A9=no, the answers for A10 were coded as non-response (9) to comply with
Eurostat coding, but the majority non-response was ‘not applicable’ (8).
For question B2 (Provision of CVT forms in 2015), enterprises were first
asked to select any CVT forms used from a list, then asked about the absolute
number of participants for each of the selected forms of CVT. This differs from
the manual which uses a yes/no question for each form used and then asks
about the percentage of staff participating immediately following each form. For
Eurostat, the percentages were calculated later, based on these answers.

147
ANNEX 2. Complementary tables and figures
A.2.1 Relative participation rates
Differences in staff participation across all enterprise size classes can also be
examined by relative participation rates. We therefore use an index number
relative to the participation rate of staff working in medium-sized enterprises
(which is made equal to 100 in all countries and on the EU average). The
participation rate of staff in small enterprises is then expressed in relation to
that of staff in medium-sized enterprises (81% for the estimated EU average).
For large enterprises, the relative participation rate in 2015 is, on average,
128% of medium-sized enterprises. The last column of Table A 8, range
(maximum-minimum) shows the range of relative participation rates, providing
an indicator of the magnitude of a country's overall inequity of participation.
Table A 8. Participation in CVT courses, participation rate and relative participation rate of persons employed by enterprise size class (all enterprises), CVTS 5
Participation rate in %
Relative participation rates
(index, 50-249 persons
employed = 100)
Range
(max-
min)
Total
10-49
persons
employed
50-249
persons
employed
250 or
more
persons
employed
10-49
persons
employed
50-249
persons
employed
250 or
more
persons
employed
EU-28 40.8 30.0 37.2 47.7 81 100 128 48
AT 45.4 35.3 41.2 54.9 86 100 133 48
BE 53.9 41.5 56.3 59.2 74 100 105 31
BG 26.5 15.7 21.9 40 72 100 183 111
CY 33.2 21.7 32.2 51.9 67 100 161 94
CZ 83.7 80.9 84.1 84.9 96 100 101 5
DE 38.1 31.9 33.6 41.8 95 100 124 29
DK 34.6 25.4 31.2 41.8 81 100 134 53
EE 31.9 21.2 27.8 47.5 76 100 171 95
EL 18.5 4.6 14.7 36.7 31 100 250 218
ES 55.4 38.9 50.1 69 78 100 138 60
FI 43.8 37.6 41.7 48.9 90 100 117 27
FR 48.3 27.4 40.8 62.3 67 100 153 86

Continuing vocational training in EU enterprises
148
Participation rate in %
Relative participation rates
(index, 50-249 persons
employed = 100)
Range
(max-
min)
Total
10-49
persons
employed
50-249
persons
employed
250 or
more
persons
employed
10-49
persons
employed
50-249
persons
employed
250 or
more
persons
employed
HR 28.7 16 21.2 40.2 75 100 190 114
HU 19.4 10.6 14.6 27.4 73 100 188 115
IE 49.7 33.2 43.8 62.9 76 100 144 68
IT 45.9 28.4 42.9 63.1 66 100 147 81
LT 25.6 14.4 24.1 38.3 60 100 159 99
LU 61.8 36.8 62.1 76.7 59 100 124 64
LV 27.2 15.7 25.6 41.6 61 100 163 101
MK 22 17.7 16.9 29.7 105 100 176 76
MT 35.8 18.9 34.2 52.8 55 100 154 99
NL 41.4 34.1 41.1 44.2 83 100 108 25
NO 54.3 53.1 55.3 54.3 96 100 98 4
PL 37.1 15.1 26 55.4 58 100 213 155
PT 46.3 32.9 44.9 61.4 73 100 137 63
RO 21.3 8.8 13.7 32.6 64 100 238 174
SE 52.2 46.9 52.7 55.3 89 100 105 16
SI 58.3 42.8 54 72 79 100 133 54
SK 56.8 42.5 52.1 66.8 82 100 128 47
UK 30.4 30.3 32.2 29.9 94 100 93 7
Source: Eurostat, CVTS, dissemination database (accessed 6.2.2018); own calculations.
On average in the EU, the chances of a person employed in a small
enterprise participating in employer-financed training are 19% lower than those
of a person employed in a medium-sized enterprise (relative participation rate
at 81), while those of a person employed in a large firm are 28% higher
(relative participation rate at 128, Table A 8).
In all countries but North Macedonia, the chances of participating in CVT
courses are lower for staff working in small enterprises than for staff working in
medium-sized enterprises. In 10 countries the differences are quite high and
the relative participation rate in small enterprises is lower than 70%. Four of
these countries are east European (Latvia, Lithuania, Poland, Romania), four
are south European (Greece, Italy, Cyprus and Malta) but France and
Luxembourg also belong to this group. Further, in three of these countries

ANNEX 2. Complementary tables and figures
149
(Greece, Poland and Romania) the chances of staff of large enterprises
participating in employer-financed CVT are at least double the chances of staff
of medium-sized enterprises.
A more equal distribution of training participation between SMEs appears
in the Netherlands, Finland and Sweden, as the chances of participation do not
differ strongly between staff of small, medium-sized and large enterprises (at
most 20% higher than the reference group).
A quasi-equal distribution of training participation appears in Czechia,
Norway and the UK, as the differences in participation rates between staff of
small, medium-sized and large enterprises are small (only 4-7% higher than
the reference group).
Compared to 2010, inequity in participation rates by size class has
decreased in the EU-28 as the relative participation rate of staff in small
enterprises was 74% and the relative participation rate for staff in for large
enterprises was 136%, leading to a range of 62% Table A 9.
In most countries, the opportunities for staff from large enterprises to
participate in employer-financed training in 2015 are closer to the reference
group (staff in medium-sized enterprises) than in 2010, indicating an increase
in equity between staff in medium-sized and large enterprises. Only in
Denmark, Estonia, France, Croatia, Portugal and Austria did inequities
between staff large and medium-sized enterprises increase markedly between
2010 and 2015.
However, notable increases in relative participation rates in large
enterprises occurred in 16 countries (Belgium, Bulgaria, Czechia, Greece, Italy,
Cyprus, Latvia, Lithuania, Luxembourg, Malta, the Netherlands, Poland,
Romania, Slovenia, Finland and the UK), indicating significant increases in
inequity between staff in medium-sized and large enterprises.
When considering relative participation rates of staff in small enterprises,
smaller changes between 2010 and 2015 occurred. Increases in inequity are
observed in Denmark, Greece, Croatia, Cyprus, Lithuania, Luxembourg and
Finland, as relative participation rates of staff in small enterprises decreased.
Notable increases in relative participation rates in small enterprises
occurred in 10 countries (Bulgaria, Czechia, Germany, Malta, Poland, Portugal,
Romania, Slovenia and Slovakia), indicating significant increases in equity
between staff in small and medium-sized enterprises.
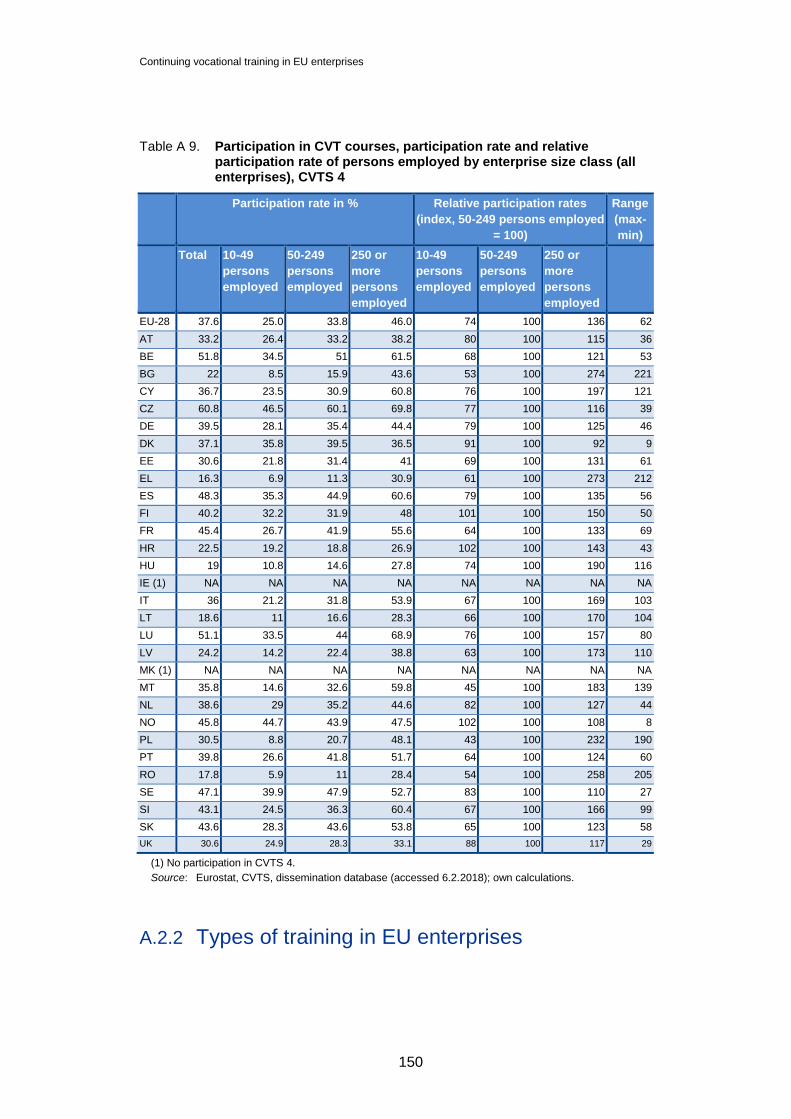
Continuing vocational training in EU enterprises
150
Table A 9. Participation in CVT courses, participation rate and relative participation rate of persons employed by enterprise size class (all enterprises), CVTS 4
Participation rate in % Relative participation rates
(index, 50-249 persons employed
= 100)
Range
(max-
min)
Total 10-49
persons
employed
50-249
persons
employed
250 or
more
persons
employed
10-49
persons
employed
50-249
persons
employed
250 or
more
persons
employed
EU-28 37.6 25.0 33.8 46.0 74 100 136 62
AT 33.2 26.4 33.2 38.2 80 100 115 36
BE 51.8 34.5 51 61.5 68 100 121 53
BG 22 8.5 15.9 43.6 53 100 274 221
CY 36.7 23.5 30.9 60.8 76 100 197 121
CZ 60.8 46.5 60.1 69.8 77 100 116 39
DE 39.5 28.1 35.4 44.4 79 100 125 46
DK 37.1 35.8 39.5 36.5 91 100 92 9
EE 30.6 21.8 31.4 41 69 100 131 61
EL 16.3 6.9 11.3 30.9 61 100 273 212
ES 48.3 35.3 44.9 60.6 79 100 135 56
FI 40.2 32.2 31.9 48 101 100 150 50
FR 45.4 26.7 41.9 55.6 64 100 133 69
HR 22.5 19.2 18.8 26.9 102 100 143 43
HU 19 10.8 14.6 27.8 74 100 190 116
IE (1) NA NA NA NA NA NA NA NA
IT 36 21.2 31.8 53.9 67 100 169 103
LT 18.6 11 16.6 28.3 66 100 170 104
LU 51.1 33.5 44 68.9 76 100 157 80
LV 24.2 14.2 22.4 38.8 63 100 173 110
MK (1) NA NA NA NA NA NA NA NA
MT 35.8 14.6 32.6 59.8 45 100 183 139
NL 38.6 29 35.2 44.6 82 100 127 44
NO 45.8 44.7 43.9 47.5 102 100 108 8
PL 30.5 8.8 20.7 48.1 43 100 232 190
PT 39.8 26.6 41.8 51.7 64 100 124 60
RO 17.8 5.9 11 28.4 54 100 258 205
SE 47.1 39.9 47.9 52.7 83 100 110 27
SI 43.1 24.5 36.3 60.4 67 100 166 99
SK 43.6 28.3 43.6 53.8 65 100 123 58
UK 30.6 24.9 28.3 33.1 88 100 117 29
(1) No participation in CVTS 4.
Source: Eurostat, CVTS, dissemination database (accessed 6.2.2018); own calculations.
A.2.2 Types of training in EU enterprises

ANNEX 2. Complementary tables and figures
151
Table A 10. Percentage of enterprises providing any other form of CVT, by form of training, CVTS 5 and CVTS 4
CVT courses Other forms of CVT
CVT
courses
CVT
courses
Guided
on-the-
job
training
Guided
on-the-
job
training
Job rotation,
exchanges,
secondments
Job rotation,
exchanges,
secondments
Conferences,
workshops,
trade fairs
and lectures
Conferences,
workshops,
trade fairs
and lectures
Learning/quality
circles
Learning/quality
circles
Self-
directed
learning
Self-
directed
learning
2015
Change
2015 -
2010*
2015
Change
2015 -
2010*
2015 Change 2015
-2010* 2015
Change 2015
-2010* 2015
Change 2015 -
2010* 2015
Change
2015 -
2010*
EU-28
61.2 5.6 44.2 10.0 12.5 2.8 39.3 4.9 12.4 3.0 21.5 7.4
AT 81.6 9.2 48.7 9.4 17.1 -2.8 65.4 1.7 26.5 4.0 21.6 8.6
BE 78.4 6.6 47.8 7.4 19.0 5.0 49.0 8.7 18.3 6.0 24.1 7.1
BG 31.9 11.4 28.8 7.8 9.2 5.4 16.5 0.7 10.6 1.2 8.3 1.6
CY 52.1 4.4 37.4 -3.6 7.2 -4.7 28.2 -10.2 16.7 -13.8 10.7 -1.9
CZ (2)
89.4 26.9 26.6 -15.4 6.3 1.8 21.5 -20.2 3.5 -2.5 11.7 -4.2
DE 61.9 0.6 64.3 18.9 9.9 2.9 59.3 3.4 18.5 6.7 26.4 11.6
DK 69.9 -6.4 45.5 -10.2 11.1 -11.4 57.3 -5.3 19.1 0.6 29.8 -2.7
EE 64.4 7.5 65.7 30.0 16.0 -2.2 39.5 1.2 6.4 -2.0 19.2 -2.2
EL 12.7 -8.1 10.5 -0.6 2.0 -0.4 6.9 -7.3 6.6 -0.8 3.9 -1.5
ES 80.6 9.3 47.1 12.1 14.5 7.6 28.3 5.5 16.4 5.7 25.8 5.7
FI 78.0 11.5 44.6 7.8 14.5 4.2 46.5 5.4 8.6 1.3 31.2 7.7
FR 75.1 4.2 23.5 0.0 8.3 -1.7 26.5 3.6 7.1 -1.7 11.6 2.9
HR 42.7 -7.1 27.8 2.5 12.7 5.1 35.3 2.2 8.3 2.3 15.5 7.9
HU 32.1 -5.9 21.3 2.1 3.3 -0.7 26.6 -1.1 5.3 0.4 8.8 0.9
IE (1)
57.1 : 59.5 : 18.2 : 52.7 : 15.1 : 36.6 :

Continuing vocational training in EU enterprises
152
CVT courses Other forms of CVT
CVT
courses
CVT
courses
Guided
on-the-
job
training
Guided
on-the-
job
training
Job rotation,
exchanges,
secondments
Job rotation,
exchanges,
secondments
Conferences,
workshops,
trade fairs
and lectures
Conferences,
workshops,
trade fairs
and lectures
Learning/quality
circles
Learning/quality
circles
Self-
directed
learning
Self-
directed
learning
2015
Change
2015 -
2010*
2015
Change
2015 -
2010*
2015 Change 2015
-2010* 2015
Change 2015
-2010* 2015
Change 2015 -
2010* 2015
Change
2015 -
2010*
IT 52.3 5.5 28.0 4.1 9.8 -0.3 26.7 0.7 3.6 0.1 12.3 5.9
LT 43.7 6.7 36.3 13.0 3.9 2.4 41.3 5.6 21.7 7.3 20.5 6.4
LU 71.9 6.5 52.6 13.5 26.9 14.9 54.9 14.0 26.1 11.5 30.8 11.6
LV 31.3 4.7 99.9 78.0 9.8 5.1 30.1 10.1 8.6 4.4 9.1 4.6
MK (1)
45.9 : 21.8 : 14.1 : 22.6 : 11.4 : 8.1 :
MT 43.3 5.8 49.7 13.8 15.6 3.2 27.1 -11.0 16.4 6.3 17.3 2.7
NL 75.5 5.7 50.9 11.7 24.7 12.1 59.1 9.1 29.2 12.6 42.5 13.9
NO 90.4 0.8 73.7 2.5 29.5 -5.9 49.4 -3.5 23.8 1.8 42.6 12.6
PL 29.2 8.7 31.7 23.4 10.0 7.8 24.2 13.6 1.9 1.3 9.3 6.7
PT 53.8 9.3 57.7 16.6 10.2 4.6 34.4 4.9 16.8 5.8 15.5 6.5
RO 21.1 5.1 13.0 3.5 4.8 0.8 10.1 1.4 4.2 0.9 11.7 2.9
SE (2)
81.6 5.2 73.1 23.4 38.6 6.0 60.6 10.3 10.5 4.4 47.0 28.2
SI 72.9 32.1 59.2 11.8 14.4 5.7 55.4 6.7 19.3 4.5 21.7 9.9
SK 63.6 10.0 33.3 1.4 11.1 4.2 40.7 -4.1 19.1 0.7 24.5 0.5
UK 67.1 7.2 62.7 3.4 18.2 2.4 52.9 6.6 15.9 1.9 33.9 8.0
(1) No participation in CVTS 4.
(2) Break in time series between CVTS 4 and CVTS 5.
(*) = difference between 2015 and 2010 in percentage points.
Source: Eurostat, CVTS, dissemination database (accessed 6.2.2018); own calculations.
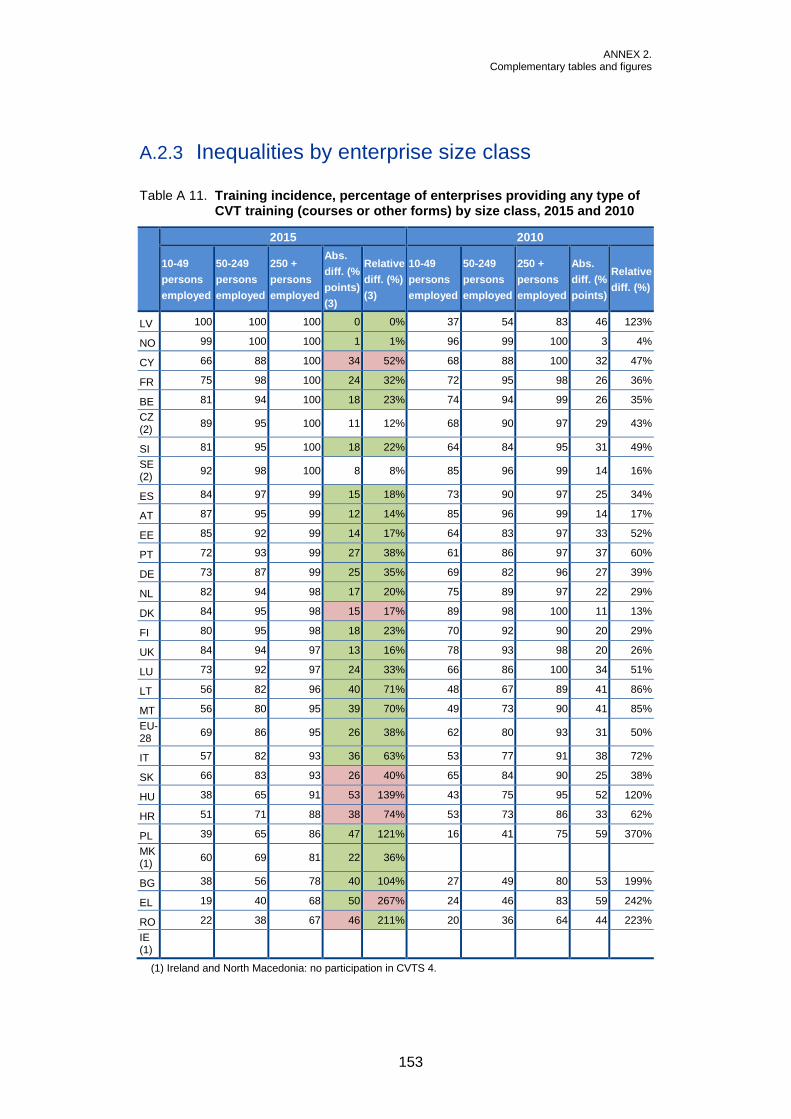
ANNEX 2. Complementary tables and figures
153
A.2.3 Inequalities by enterprise size class
Table A 11. Training incidence, percentage of enterprises providing any type of CVT training (courses or other forms) by size class, 2015 and 2010
2015 2010
10-49
persons
employed
50-249
persons
employed
250 +
persons
employed
Abs.
diff. (%
points)
(3)
Relative
diff. (%)
(3)
10-49
persons
employed
50-249
persons
employed
250 +
persons
employed
Abs.
diff. (%
points)
Relative
diff. (%)
LV 100 100 100 0 0% 37 54 83 46 123%
NO 99 100 100 1 1% 96 99 100 3 4%
CY 66 88 100 34 52% 68 88 100 32 47%
FR 75 98 100 24 32% 72 95 98 26 36%
BE 81 94 100 18 23% 74 94 99 26 35%
CZ (2)
89 95 100 11 12% 68 90 97 29 43%
SI 81 95 100 18 22% 64 84 95 31 49%
SE (2)
92 98 100 8 8% 85 96 99 14 16%
ES 84 97 99 15 18% 73 90 97 25 34%
AT 87 95 99 12 14% 85 96 99 14 17%
EE 85 92 99 14 17% 64 83 97 33 52%
PT 72 93 99 27 38% 61 86 97 37 60%
DE 73 87 99 25 35% 69 82 96 27 39%
NL 82 94 98 17 20% 75 89 97 22 29%
DK 84 95 98 15 17% 89 98 100 11 13%
FI 80 95 98 18 23% 70 92 90 20 29%
UK 84 94 97 13 16% 78 93 98 20 26%
LU 73 92 97 24 33% 66 86 100 34 51%
LT 56 82 96 40 71% 48 67 89 41 86%
MT 56 80 95 39 70% 49 73 90 41 85%
EU-28
69 86 95 26 38% 62 80 93 31 50%
IT 57 82 93 36 63% 53 77 91 38 72%
SK 66 83 93 26 40% 65 84 90 25 38%
HU 38 65 91 53 139% 43 75 95 52 120%
HR 51 71 88 38 74% 53 73 86 33 62%
PL 39 65 86 47 121% 16 41 75 59 370%
MK (1)
60 69 81 22 36%
BG 38 56 78 40 104% 27 49 80 53 199%
EL 19 40 68 50 267% 24 46 83 59 242%
RO 22 38 67 46 211% 20 36 64 44 223%
IE (1)
(1) Ireland and North Macedonia: no participation in CVTS 4.
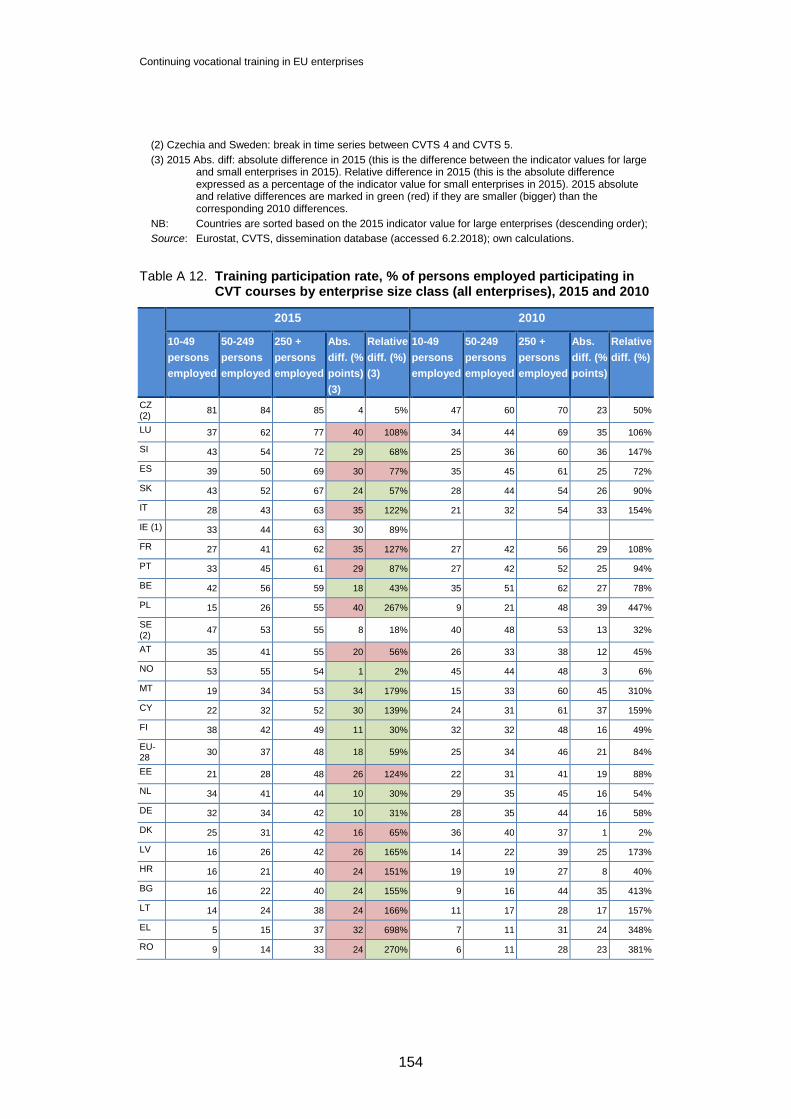
Continuing vocational training in EU enterprises
154
(2) Czechia and Sweden: break in time series between CVTS 4 and CVTS 5.
(3) 2015 Abs. diff: absolute difference in 2015 (this is the difference between the indicator values for large and small enterprises in 2015). Relative difference in 2015 (this is the absolute difference expressed as a percentage of the indicator value for small enterprises in 2015). 2015 absolute and relative differences are marked in green (red) if they are smaller (bigger) than the corresponding 2010 differences.
NB: Countries are sorted based on the 2015 indicator value for large enterprises (descending order);
Source: Eurostat, CVTS, dissemination database (accessed 6.2.2018); own calculations.
Table A 12. Training participation rate, % of persons employed participating in CVT courses by enterprise size class (all enterprises), 2015 and 2010
2015 2010
10-49
persons
employed
50-249
persons
employed
250 +
persons
employed
Abs.
diff. (%
points)
(3)
Relative
diff. (%)
(3)
10-49
persons
employed
50-249
persons
employed
250 +
persons
employed
Abs.
diff. (%
points)
Relative
diff. (%)
CZ (2)
81 84 85 4 5% 47 60 70 23 50%
LU 37 62 77 40 108% 34 44 69 35 106%
SI 43 54 72 29 68% 25 36 60 36 147%
ES 39 50 69 30 77% 35 45 61 25 72%
SK 43 52 67 24 57% 28 44 54 26 90%
IT 28 43 63 35 122% 21 32 54 33 154%
IE (1) 33 44 63 30 89%
FR 27 41 62 35 127% 27 42 56 29 108%
PT 33 45 61 29 87% 27 42 52 25 94%
BE 42 56 59 18 43% 35 51 62 27 78%
PL 15 26 55 40 267% 9 21 48 39 447%
SE (2)
47 53 55 8 18% 40 48 53 13 32%
AT 35 41 55 20 56% 26 33 38 12 45%
NO 53 55 54 1 2% 45 44 48 3 6%
MT 19 34 53 34 179% 15 33 60 45 310%
CY 22 32 52 30 139% 24 31 61 37 159%
FI 38 42 49 11 30% 32 32 48 16 49%
EU-28
30 37 48 18 59% 25 34 46 21 84%
EE 21 28 48 26 124% 22 31 41 19 88%
NL 34 41 44 10 30% 29 35 45 16 54%
DE 32 34 42 10 31% 28 35 44 16 58%
DK 25 31 42 16 65% 36 40 37 1 2%
LV 16 26 42 26 165% 14 22 39 25 173%
HR 16 21 40 24 151% 19 19 27 8 40%
BG 16 22 40 24 155% 9 16 44 35 413%
LT 14 24 38 24 166% 11 17 28 17 157%
EL 5 15 37 32 698% 7 11 31 24 348%
RO 9 14 33 24 270% 6 11 28 23 381%
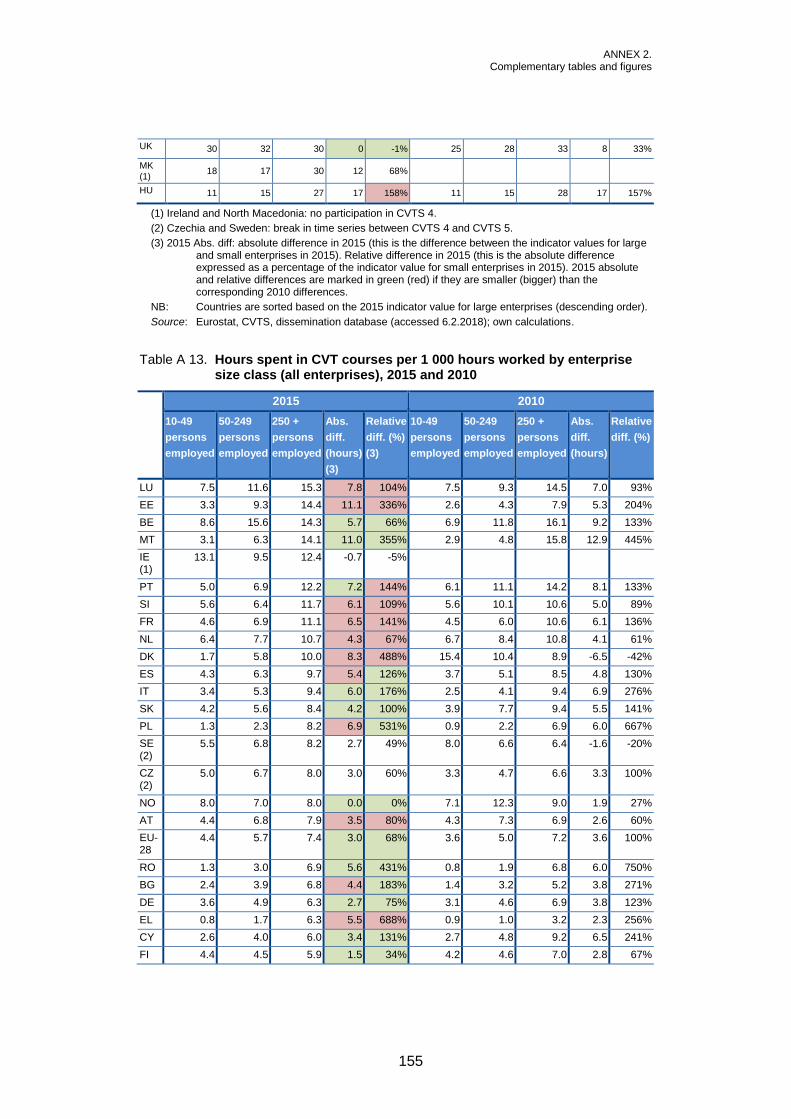
ANNEX 2. Complementary tables and figures
155
UK 30 32 30 0 -1% 25 28 33 8 33%
MK (1)
18 17 30 12 68%
HU 11 15 27 17 158% 11 15 28 17 157%
(1) Ireland and North Macedonia: no participation in CVTS 4.
(2) Czechia and Sweden: break in time series between CVTS 4 and CVTS 5.
(3) 2015 Abs. diff: absolute difference in 2015 (this is the difference between the indicator values for large and small enterprises in 2015). Relative difference in 2015 (this is the absolute difference expressed as a percentage of the indicator value for small enterprises in 2015). 2015 absolute and relative differences are marked in green (red) if they are smaller (bigger) than the corresponding 2010 differences.
NB: Countries are sorted based on the 2015 indicator value for large enterprises (descending order).
Source: Eurostat, CVTS, dissemination database (accessed 6.2.2018); own calculations.
Table A 13. Hours spent in CVT courses per 1 000 hours worked by enterprise size class (all enterprises), 2015 and 2010
2015 2010
10-49
persons
employed
50-249
persons
employed
250 +
persons
employed
Abs.
diff.
(hours)
(3)
Relative
diff. (%)
(3)
10-49
persons
employed
50-249
persons
employed
250 +
persons
employed
Abs.
diff.
(hours)
Relative
diff. (%)
LU 7.5 11.6 15.3 7.8 104% 7.5 9.3 14.5 7.0 93%
EE 3.3 9.3 14.4 11.1 336% 2.6 4.3 7.9 5.3 204%
BE 8.6 15.6 14.3 5.7 66% 6.9 11.8 16.1 9.2 133%
MT 3.1 6.3 14.1 11.0 355% 2.9 4.8 15.8 12.9 445%
IE (1)
13.1 9.5 12.4 -0.7 -5%
PT 5.0 6.9 12.2 7.2 144% 6.1 11.1 14.2 8.1 133%
SI 5.6 6.4 11.7 6.1 109% 5.6 10.1 10.6 5.0 89%
FR 4.6 6.9 11.1 6.5 141% 4.5 6.0 10.6 6.1 136%
NL 6.4 7.7 10.7 4.3 67% 6.7 8.4 10.8 4.1 61%
DK 1.7 5.8 10.0 8.3 488% 15.4 10.4 8.9 -6.5 -42%
ES 4.3 6.3 9.7 5.4 126% 3.7 5.1 8.5 4.8 130%
IT 3.4 5.3 9.4 6.0 176% 2.5 4.1 9.4 6.9 276%
SK 4.2 5.6 8.4 4.2 100% 3.9 7.7 9.4 5.5 141%
PL 1.3 2.3 8.2 6.9 531% 0.9 2.2 6.9 6.0 667%
SE (2)
5.5 6.8 8.2 2.7 49% 8.0 6.6 6.4 -1.6 -20%
CZ (2)
5.0 6.7 8.0 3.0 60% 3.3 4.7 6.6 3.3 100%
NO 8.0 7.0 8.0 0.0 0% 7.1 12.3 9.0 1.9 27%
AT 4.4 6.8 7.9 3.5 80% 4.3 7.3 6.9 2.6 60%
EU-28
4.4 5.7 7.4 3.0 68% 3.6 5.0 7.2 3.6 100%
RO 1.3 3.0 6.9 5.6 431% 0.8 1.9 6.8 6.0 750%
BG 2.4 3.9 6.8 4.4 183% 1.4 3.2 5.2 3.8 271%
DE 3.6 4.9 6.3 2.7 75% 3.1 4.6 6.9 3.8 123%
EL 0.8 1.7 6.3 5.5 688% 0.9 1.0 3.2 2.3 256%
CY 2.6 4.0 6.0 3.4 131% 2.7 4.8 9.2 6.5 241%
FI 4.4 4.5 5.9 1.5 34% 4.2 4.6 7.0 2.8 67%

Continuing vocational training in EU enterprises
156
HU 1.1 1.4 5.0 3.9 355% 1.2 1.9 6.2 5.0 417%
HR 2.8 3.8 4.7 1.9 68% 3.3 2.6 1.0 -2.3 -70%
LV 1.6 2.9 4.7 3.1 194% 1.2 1.9 3.2 2.0 167%
LT 1.8 2.8 4.4 2.6 144% 2.6 4.9 4.3 1.7 65%
UK 7.5 7.2 4.0 -3.5 -47% 3.6 4.8 3.9 0.3 8%
MK (1)
2.5 2.4 3.0 0.5 20%
(1) Ireland and North Macedonia: no participation in CVTS 4.
(2) Czechia and Sweden: break in time series between CVTS 4 and CVTS 5.
(3) 2015 Abs. diff: absolute difference in 2015 (this is the difference between the indicator values for large and small enterprises in 2015). Relative difference in 2015 (this is the absolute difference expressed as a percentage of the indicator value for small enterprises in 2015). 2015 absolute and relative differences are marked in green (red) if they are smaller (bigger) than the corresponding 2010 differences.
NB: Countries are sorted based on the 2015 indicator value for large enterprises (descending order).
Source: Eurostat, CVTS, dissemination database (accessed 6.2.2018); own calculations.
Table A 14. Direct enterprise monetary expenditure on CVT courses as % of total labour cost by size class (all enterprises), 2015 and 2010
2015 2010
10-49
persons
employed
50-249
persons
employed
250 +
persons
employed
Abs.
diff. %
points)
(3)
Relative
diff. (%)
(3)
10-49
persons
employed
50-249
persons
employed
250 +
persons
employed
Abs.
diff. (%
points)
Relative
diff. (%)
DK 0.4 0.6 1.8 1.4 350% 0.8 0.6 0.7 -0.1 -13%
NL 1.0 1.1 1.3 0.3 30% 0.8 0.9 1.3 0.5 63%
MT 0.8 1.2 1.1 0.3 38% 1.4 1.2 1.4 0.0 0%
LU 0.6 1.2 1.1 0.5 83% 0.7 0.8 0.8 0.1 14%
BE 0.6 0.7 1.0 0.4 67% 0.4 0.7 1.2 0.8 200%
UK 1.5 1.7 1.0 -0.5 -33% 0.8 0.8 0.6 -0.2 -25%
IE (1)
0.6 0.9 1.0 0.4 67%
NO 1.0 0.8 1.0 0.0 0% 0.7 0.7 0.6 -0.1 -14%
EE 0.6 0.7 1.0 0.4 67% 0.5 0.6 0.5 0.0 0%
FR 0.2 0.3 0.9 0.7 350% 0.5 0.8 1.3 0.8 160%
HR 0.4 0.5 0.9 0.5 125% 0.3 0.8 0.3 0.0 0%
LT 0.6 0.6 0.8 0.2 33% 0.8 0.6 0.6 -0.2 -25%
PT 0.5 0.5 0.8 0.3 60% 0.7 0.9 1 0.3 43%
EU-28
0.5 0.7 0.8 0.3 60% 0.5 0.6 0.9 0.4 80%
SI 0.7 0.7 0.8 0.1 14% 0.3 0.7 0.9 0.6 200%
SK 0.7 0.7 0.8 0.1 14% 1 0.9 0.9 -0.1 -10%
DE 0.6 0.7 0.8 0.2 33% 0.6 0.7 0.8 0.2 33%
HU 0.3 0.5 0.8 0.5 167% 0.4 0.6 1.1 0.7 175%
SE (2)
0.8 0.9 0.7 -0.1 -13% 0.9 1 0.9 0.0 0%
PL 0.3 0.4 0.7 0.4 133% 0.2 0.4 0.8 0.6 300%
CZ (2)
0.6 0.7 0.7 0.1 17% 0.5 0.7 0.8 0.3 60%

ANNEX 2. Complementary tables and figures
157
2015 2010
10-49
persons
employed
50-249
persons
employed
250 +
persons
employed
Abs.
diff. %
points)
(3)
Relative
diff. (%)
(3)
10-49
persons
employed
50-249
persons
employed
250 +
persons
employed
Abs.
diff. (%
points)
Relative
diff. (%)
BG 0.6 0.7 0.6 0.0 0% 0.4 0.7 0.7 0.3 75%
ES 0.4 0.5 0.6 0.2 50% 0.4 0.4 0.7 0.3 75%
AT 0.5 0.6 0.6 0.1 20% 0.6 0.8 1 0.4 67%
FI 0.6 0.6 0.6 0.0 0% 0.5 0.6 0.8 0.3 60%
IT 0.3 0.4 0.5 0.2 67% 0.3 0.3 0.4 0.1 33%
RO (1)
0.3 0.3 0.4 0.1 33%
EL 0.1 0.3 0.4 0.3 300% 0.1 0.1 0.4 0.3 300%
CY 0.4 0.3 0.4 0.0 0% 0.5 0.5 0.7 0.2 40%
LV 0.3 0.4 0.4 0.1 33% 0.3 0.3 0.5 0.2 67%
MK (1)
0.3 0.4 0.2 -0.1 -33%
(1) No CVTS 4 data available for Ireland and North Macedonia (no participation) and Romania (missing).
(2) Czechia and Sweden: break in time series between CVTS 4 and CVTS 5. CVTS 5 data for Czechia are not fully comparable to those of other countries.
(3) 2015 Abs. diff: absolute difference in 2015 (this is the difference between the indicator values for large and small enterprises in 2015). Relative difference in 2015 (this is the absolute difference expressed as a percentage of the indicator value for small enterprises in 2015). 2015 absolute and relative differences are marked in green (red) if they are smaller (bigger) than the corresponding 2010 differences.
NB: Countries are sorted based on the 2015 indicator value for large enterprises (descending order).
Source: Eurostat, CVTS, dissemination database (accessed 6.2.2018); own calculations.
Table A 15 Total enterprise monetary expenditure on CVT courses as % of total labour cost by size class (all enterprises), 2015 and 2010
2015 2010
10-49
persons
employed
50-249
persons
employed
250 +
persons
employed
Abs.
diff. %
points)
(3)
Relative
diff. (%)
(3)
10-49
persons
employed
50-249
persons
employed
250 +
persons
employed
Abs.
diff. (%
points)
Relative
diff. (%)
DK 0.4 0.6 2.5 2.1 525% 0.8 0.7 0.7 -0.1 -13%
FR 0.9 1.2 1.7 0.8 89% 1 1.4 1.8 0.8 80%
HU 1 1.1 1.6 0.6 60% 1 1.3 1.6 0.6 60%
NL 1.1 1.2 1.3 0.2 18% 0.9 1 1.4 0.5 56%
BE 0.7 0.7 1.2 0.5 71% 0.6 0.7 1.2 0.6 100%
MT 0.9 1.3 1.2 0.3 33% 1.4 1.2 1.5 0.1 7%
UK 1.6 1.7 1.1 -0.5 -31% 0.8 0.8 0.6 -0.2 -25%
EU-28
0.8 0.9 1 0.2 25% 0.7 0.8 1 0.3 43%
IE (1)
0.6 0.9 1 0.4 67%
NO 0.9 0.8 1 0.1 11% 0.6 0.7 0.6 0 0%
EE 0.6 0.7 0.9 0.3 50% 0.4 0.6 0.5 0.1 25%
ES 0.7 0.8 0.9 0.2 29% 0.8 0.8 0.9 0.1 13%

Continuing vocational training in EU enterprises
158
2015 2010
10-49
persons
employed
50-249
persons
employed
250 +
persons
employed
Abs.
diff. %
points)
(3)
Relative
diff. (%)
(3)
10-49
persons
employed
50-249
persons
employed
250 +
persons
employed
Abs.
diff. (%
points)
Relative
diff. (%)
HR 0.3 0.4 0.9 0.6 200% 0.3 0.7 0.2 -0.1 -33%
DE 0.6 0.7 0.8 0.2 33% 0.6 0.7 0.9 0.3 50%
SK 0.7 0.6 0.8 0.1 14% 1.1 0.8 0.9 -0.2 -18%
PT 0.4 0.5 0.8 0.4 100% 0.5 0.7 1 0.5 100%
CY 0.7 0.6 0.7 0 0% 0.8 0.7 1 0.2 25%
LT 0.6 0.6 0.7 0.1 17% 0.5 0.4 0.6 0.1 20%
LU 0.6 1 0.7 0.1 17% 0.7 0.7 0.5 -0.2 -29%
PL 0.3 0.4 0.7 0.4 133% 0.1 0.4 0.6 0.5 500%
SE (2)
0.9 0.8 0.7 -0.2 -22% 0.9 0.9 0.9 0 0%
SI 0.7 0.7 0.7 0 0% 0.3 0.6 0.9 0.6 200%
CZ (2)
0.5 0.6 0.7 0.2 40% 0.4 0.6 0.7 0.3 75%
AT 0.6 0.7 0.6 0 0% 0.6 0.7 0.9 0.3 50%
BG 0.6 0.6 0.6 0 0% 0.4 0.8 0.6 0.2 50%
EL 0.7 0.6 0.6 -0.1 -14% 0.4 0.4 0.5 0.1 25%
IT 0.5 0.5 0.6 0.1 20% 0.4 0.4 0.5 0.1 25%
FI 0.6 0.5 0.5 -0.1 -17% 0.5 0.6 0.8 0.3 60%
LV 0.4 0.4 0.4 0 0% 0.3 0.3 0.5 0.2 67%
RO (1)
0.3 0.2 0.4 0.1 33%
MK (1)
0.3 0.4 0.3 0 0%
(1) No CVTS 4 data available for Ireland and North Macedonia (no participation) and Romania (missing).
(2) Czechia and Sweden: break in time series between CVTS 4 and CVTS 5. CVTS 5 data for Czechia are not fully comparable to those of other countries.
(3) 2015 Abs. diff: absolute difference in 2015 (this is the difference between the indicator values for large and small enterprises in 2015). Relative difference in 2015 (this is the absolute difference expressed as a percentage of the indicator value for small enterprises in 2015). 2015 absolute and relative differences are marked in green (red) if they are smaller (bigger) than the corresponding 2010 differences.
NB: Countries are sorted based on the 2015 indicator value for large enterprises (descending order);
Source: Eurostat, CVTS, dissemination database (accessed 6.2.2018); own calculations.
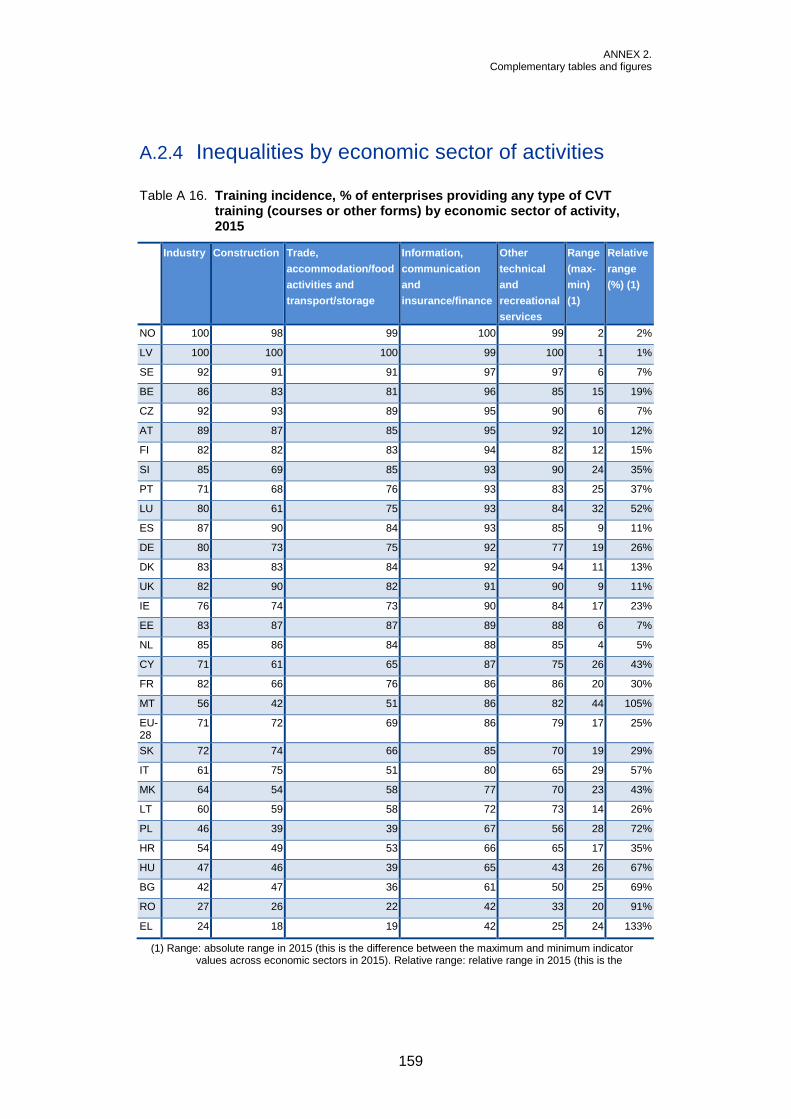
ANNEX 2. Complementary tables and figures
159
A.2.4 Inequalities by economic sector of activities
Table A 16. Training incidence, % of enterprises providing any type of CVT training (courses or other forms) by economic sector of activity, 2015
Industry Construction Trade,
accommodation/food
activities and
transport/storage
Information,
communication
and
insurance/finance
Other
technical
and
recreational
services
Range
(max-
min)
(1)
Relative
range
(%) (1)
NO 100 98 99 100 99 2 2%
LV 100 100 100 99 100 1 1%
SE 92 91 91 97 97 6 7%
BE 86 83 81 96 85 15 19%
CZ 92 93 89 95 90 6 7%
AT 89 87 85 95 92 10 12%
FI 82 82 83 94 82 12 15%
SI 85 69 85 93 90 24 35%
PT 71 68 76 93 83 25 37%
LU 80 61 75 93 84 32 52%
ES 87 90 84 93 85 9 11%
DE 80 73 75 92 77 19 26%
DK 83 83 84 92 94 11 13%
UK 82 90 82 91 90 9 11%
IE 76 74 73 90 84 17 23%
EE 83 87 87 89 88 6 7%
NL 85 86 84 88 85 4 5%
CY 71 61 65 87 75 26 43%
FR 82 66 76 86 86 20 30%
MT 56 42 51 86 82 44 105%
EU-28
71 72 69 86 79 17 25%
SK 72 74 66 85 70 19 29%
IT 61 75 51 80 65 29 57%
MK 64 54 58 77 70 23 43%
LT 60 59 58 72 73 14 26%
PL 46 39 39 67 56 28 72%
HR 54 49 53 66 65 17 35%
HU 47 46 39 65 43 26 67%
BG 42 47 36 61 50 25 69%
RO 27 26 22 42 33 20 91%
EL 24 18 19 42 25 24 133%
(1) Range: absolute range in 2015 (this is the difference between the maximum and minimum indicator values across economic sectors in 2015). Relative range: relative range in 2015 (this is the

Continuing vocational training in EU enterprises
160
absolute range expressed as a percentage of the minimum indicator value across economic sectors in 2015).
NB: Countries are sorted based on the 2015 indicator value in the sector of Information, communication and finance (descending order).
Source: Eurostat, CVTS, dissemination database (accessed 6.2.2018); own calculations.
Table A 17. Training participation rate, % of persons employed participating in CVT courses by enterprise economic sector of activity (all enterprises), 2015
Industry Construction
Trade,
accommodation/food
activities and
transport/storage
Information,
communication
and
insurance/finance
Other
technical
and
recreational
services
Range
(max-
min)
(1)
Relative
range
(%) (1)
CZ 87 90 81 87 77 9 12%
LU 68 36 49 80 69 44 121%
IE 53 38 39 78 48 41 108%
SI 61 32 60 76 49 45 141%
SK 62 51 45 75 62 30 65%
AT 45 34 44 74 39 40 116%
IT 45 45 41 74 42 33 80%
ES 57 49 54 74 51 25 50%
BE 64 44 55 70 41 29 72%
PT 42 42 50 70 38 32 83%
PL 39 24 35 62 28 39 161%
MT 39 7 25 62 41 55 753%
SE 61 49 48 61 47 14 29%
FR 56 38 45 61 43 24 63%
NO 50 61 48 61 63 15 30%
CY 31 13 28 59 33 47 375%
EL 19 12 14 57 8 49 640%
EU-28
44 37 38 56 37 19 51%
HR 21 13 35 56 24 43 320%
NL 46 50 36 55 41 20 56%
EE 26 27 33 53 33 27 105%
DK 31 26 32 51 37 25 96%
MK 22 12 20 50 17 38 315%
LT 26 20 23 49 28 29 147%
BG 24 22 27 49 24 27 126%
LV 25 22 27 48 25 26 118%
DE 42 35 40 46 28 19 68%
FI 46 48 40 46 43 9 22%
RO 25 10 18 40 17 30 303%
UK 24 41 27 38 36 18 65%
HU 18 16 22 27 15 12 79%
(1) Range: absolute range in 2015 (this is the difference between the maximum and minimum indicator values across economic sectors in 2015). Relative range: relative range in 2015 (this is the absolute range expressed as a percentage of the minimum indicator value across economic sectors in 2015).
NB: Countries are sorted based on the 2015 indicator value in the sector of Information, communication and finance (descending order).
Source: Eurostat, CVTS, dissemination database (accessed 6.2.2018); own calculations.
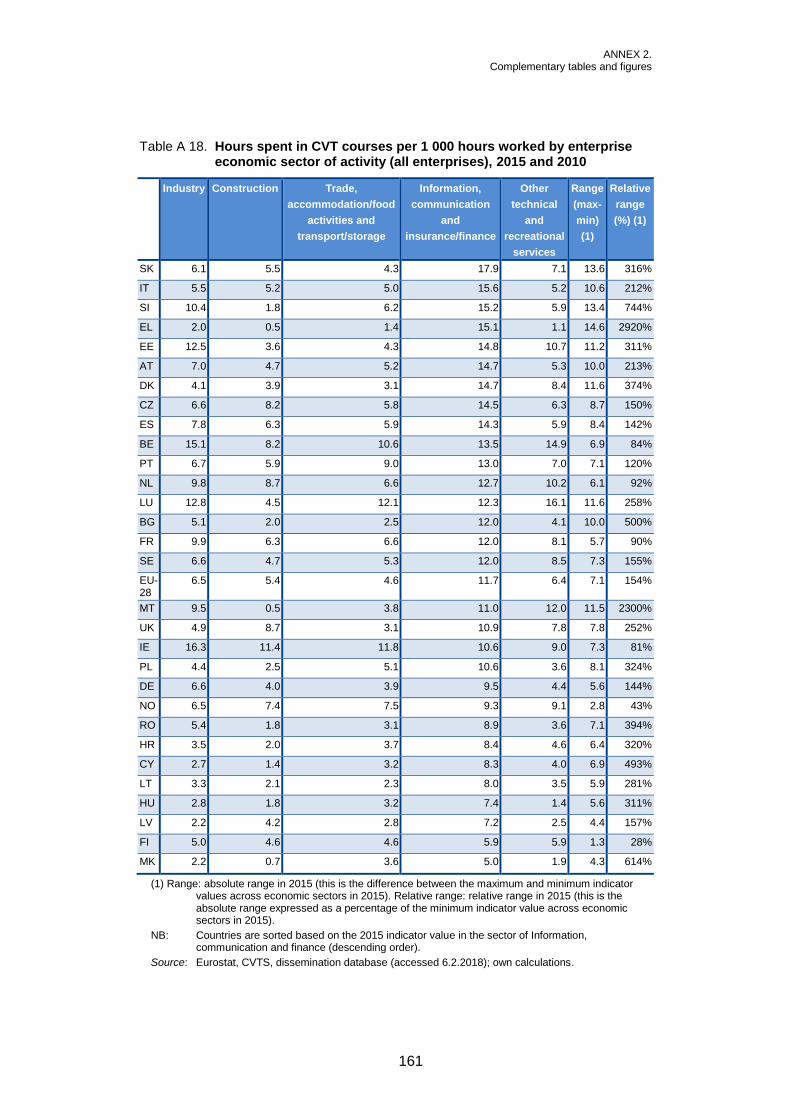
ANNEX 2. Complementary tables and figures
161
Table A 18. Hours spent in CVT courses per 1 000 hours worked by enterprise economic sector of activity (all enterprises), 2015 and 2010
Industry Construction Trade,
accommodation/food
activities and
transport/storage
Information,
communication
and
insurance/finance
Other
technical
and
recreational
services
Range
(max-
min)
(1)
Relative
range
(%) (1)
SK 6.1 5.5 4.3 17.9 7.1 13.6 316%
IT 5.5 5.2 5.0 15.6 5.2 10.6 212%
SI 10.4 1.8 6.2 15.2 5.9 13.4 744%
EL 2.0 0.5 1.4 15.1 1.1 14.6 2920%
EE 12.5 3.6 4.3 14.8 10.7 11.2 311%
AT 7.0 4.7 5.2 14.7 5.3 10.0 213%
DK 4.1 3.9 3.1 14.7 8.4 11.6 374%
CZ 6.6 8.2 5.8 14.5 6.3 8.7 150%
ES 7.8 6.3 5.9 14.3 5.9 8.4 142%
BE 15.1 8.2 10.6 13.5 14.9 6.9 84%
PT 6.7 5.9 9.0 13.0 7.0 7.1 120%
NL 9.8 8.7 6.6 12.7 10.2 6.1 92%
LU 12.8 4.5 12.1 12.3 16.1 11.6 258%
BG 5.1 2.0 2.5 12.0 4.1 10.0 500%
FR 9.9 6.3 6.6 12.0 8.1 5.7 90%
SE 6.6 4.7 5.3 12.0 8.5 7.3 155%
EU-28
6.5 5.4 4.6 11.7 6.4 7.1 154%
MT 9.5 0.5 3.8 11.0 12.0 11.5 2300%
UK 4.9 8.7 3.1 10.9 7.8 7.8 252%
IE 16.3 11.4 11.8 10.6 9.0 7.3 81%
PL 4.4 2.5 5.1 10.6 3.6 8.1 324%
DE 6.6 4.0 3.9 9.5 4.4 5.6 144%
NO 6.5 7.4 7.5 9.3 9.1 2.8 43%
RO 5.4 1.8 3.1 8.9 3.6 7.1 394%
HR 3.5 2.0 3.7 8.4 4.6 6.4 320%
CY 2.7 1.4 3.2 8.3 4.0 6.9 493%
LT 3.3 2.1 2.3 8.0 3.5 5.9 281%
HU 2.8 1.8 3.2 7.4 1.4 5.6 311%
LV 2.2 4.2 2.8 7.2 2.5 4.4 157%
FI 5.0 4.6 4.6 5.9 5.9 1.3 28%
MK 2.2 0.7 3.6 5.0 1.9 4.3 614%
(1) Range: absolute range in 2015 (this is the difference between the maximum and minimum indicator values across economic sectors in 2015). Relative range: relative range in 2015 (this is the absolute range expressed as a percentage of the minimum indicator value across economic sectors in 2015).
NB: Countries are sorted based on the 2015 indicator value in the sector of Information, communication and finance (descending order).
Source: Eurostat, CVTS, dissemination database (accessed 6.2.2018); own calculations.
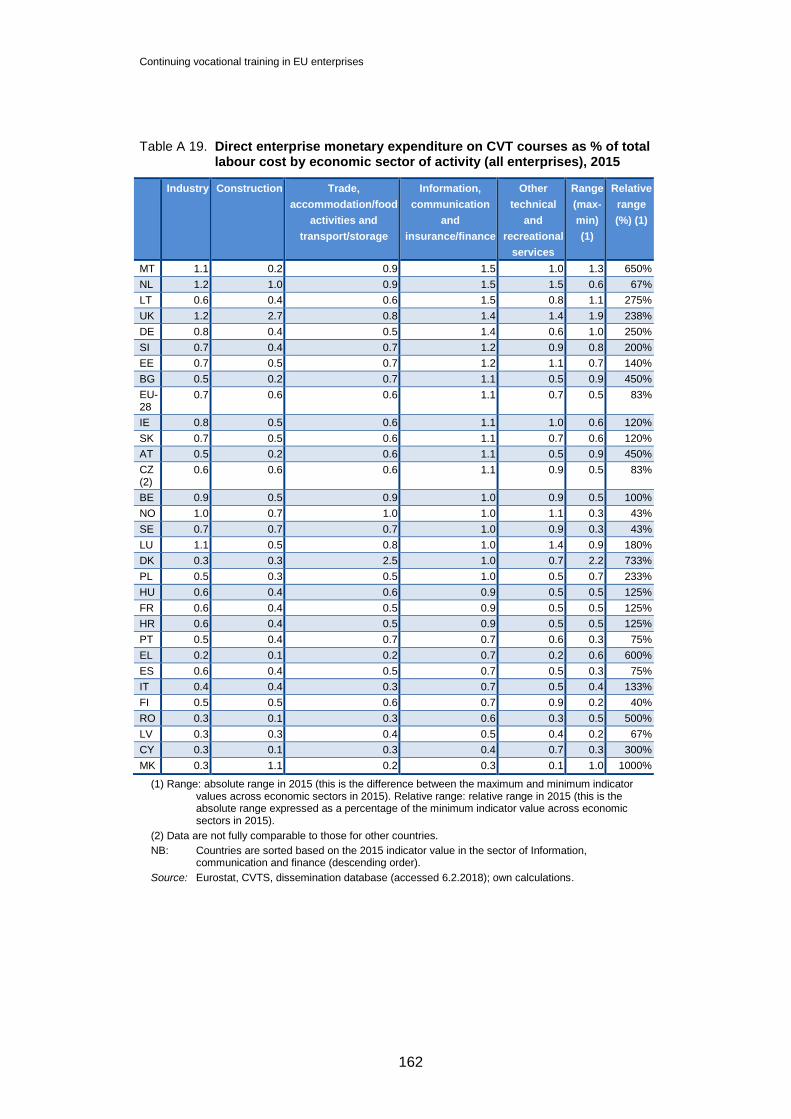
Continuing vocational training in EU enterprises
162
Table A 19. Direct enterprise monetary expenditure on CVT courses as % of total labour cost by economic sector of activity (all enterprises), 2015
Industry Construction Trade,
accommodation/food
activities and
transport/storage
Information,
communication
and
insurance/finance
Other
technical
and
recreational
services
Range
(max-
min)
(1)
Relative
range
(%) (1)
MT 1.1 0.2 0.9 1.5 1.0 1.3 650%
NL 1.2 1.0 0.9 1.5 1.5 0.6 67%
LT 0.6 0.4 0.6 1.5 0.8 1.1 275%
UK 1.2 2.7 0.8 1.4 1.4 1.9 238%
DE 0.8 0.4 0.5 1.4 0.6 1.0 250%
SI 0.7 0.4 0.7 1.2 0.9 0.8 200%
EE 0.7 0.5 0.7 1.2 1.1 0.7 140%
BG 0.5 0.2 0.7 1.1 0.5 0.9 450%
EU-28
0.7 0.6 0.6 1.1 0.7 0.5 83%
IE 0.8 0.5 0.6 1.1 1.0 0.6 120%
SK 0.7 0.5 0.6 1.1 0.7 0.6 120%
AT 0.5 0.2 0.6 1.1 0.5 0.9 450%
CZ (2)
0.6 0.6 0.6 1.1 0.9 0.5 83%
BE 0.9 0.5 0.9 1.0 0.9 0.5 100%
NO 1.0 0.7 1.0 1.0 1.1 0.3 43%
SE 0.7 0.7 0.7 1.0 0.9 0.3 43%
LU 1.1 0.5 0.8 1.0 1.4 0.9 180%
DK 0.3 0.3 2.5 1.0 0.7 2.2 733%
PL 0.5 0.3 0.5 1.0 0.5 0.7 233%
HU 0.6 0.4 0.6 0.9 0.5 0.5 125%
FR 0.6 0.4 0.5 0.9 0.5 0.5 125%
HR 0.6 0.4 0.5 0.9 0.5 0.5 125%
PT 0.5 0.4 0.7 0.7 0.6 0.3 75%
EL 0.2 0.1 0.2 0.7 0.2 0.6 600%
ES 0.6 0.4 0.5 0.7 0.5 0.3 75%
IT 0.4 0.4 0.3 0.7 0.5 0.4 133%
FI 0.5 0.5 0.6 0.7 0.9 0.2 40%
RO 0.3 0.1 0.3 0.6 0.3 0.5 500%
LV 0.3 0.3 0.4 0.5 0.4 0.2 67%
CY 0.3 0.1 0.3 0.4 0.7 0.3 300%
MK 0.3 1.1 0.2 0.3 0.1 1.0 1000%
(1) Range: absolute range in 2015 (this is the difference between the maximum and minimum indicator values across economic sectors in 2015). Relative range: relative range in 2015 (this is the absolute range expressed as a percentage of the minimum indicator value across economic sectors in 2015).
(2) Data are not fully comparable to those for other countries.
NB: Countries are sorted based on the 2015 indicator value in the sector of Information, communication and finance (descending order).
Source: Eurostat, CVTS, dissemination database (accessed 6.2.2018); own calculations.


Continuing vocational training in EU enterprises
Continuing vocational training in EU enterprises
Research paper
Developments and challenges ahead
This publication provides a comparative statistical analysis of skills development through continuing vocational training (CVT) in EU enterprises. It is based on data from the latest rounds of the CVTS survey (CVTS 5, 2015 and CVTS 4, 2010) covering EU-Member States, Norway and North Macedonia and reporting on progress towards key policy objectives. The analysis considers indicators on enterprise CVT provision, staff participation, time devoted to training and enterprise expenditure. These are analysed and then summarised by means of a composite index. Results are further complemented with an analysis of data concerning the reasons given by enterprises for not providing (further) training and main skill needs in companies. The report pays particular attention to training efforts of SMEs.
Developments and challenges ahead
Europe 123, ‘SERVICE POST’, 57001 Thermi, GREECETel. +30 2310490111, Fax +30 2310490020Email: [email protected]
5573 ΕΝ - TI-B
C-19-003-E
N-N
- doi:10.2801/704583
EN 1831-5860