continuity insights & 2011-2012 - abm-website … · 2011-2012 continuity insights & kpmg...
TRANSCRIPT
Continuity Insights & KPMG LLP Present The
2011-2012 Global Business Continuity Management (BCM) Program Benchmarking Study
$500 Million to $1 BillionSegment Report
(Final Results)
Sponsored by:
2011-2012 Global Business Continuity Management Program Benchmarking Study
©2012 Continuity Insights/KPMG LLP
2011-2012 Continuity Insights & KPMG LLP Global Business Continuity Management Program Benchmarking Study Executive Summary The complex environment in which businesses operate today creates the need for sophisticated business continuity management (BCM) programs that address a wide range of threats, including natural disasters, technology issues and manmade incidents. It is also important that these programs stay in sync with the strategic goals of the organization. The 2011-2012 Continuity Insights & KPMG LLP Global Business Continuity Management Program Benchmarking Study is a comprehensive look at the current state of BCM programs and the drivers for further program development. Data used in this report is based on anonymous survey responses from 685 executives in public and private companies, government agencies and authorities, educational institutions, and not-for-profit entities. Respondents come from over 40 countries with approximately one-third working for organizations with headquarters outside the United States. The online survey, conducted by Continuity Insights between November 2011 and January 2012, explores changes to the global risk landscape, supply chain interdependencies, the emergence and increased usage of cloud computing, mobile applications, and social media. Business continuity professionals should use this report to target underdeveloped capabilities within their own BCM programs. In addition to the report, readers can view the full collection of survey responses on the Continuity Insights Web site (www.continuityinsights.com). Research Methodology Respondents for the 2011-2012 Continuity Insights & KPMG LLP Global Business Continuity Management Program Benchmarking Study were obtained from the Continuity Insights subscriber base by way of its publications, Web site, and email deployments, as well as from other professional organizations that supported the study. The 20-minute online survey comprised 52 questions and was fielded from November 2011 through January 2012. Data was collected from 958 respondents, of which 685 respondents completed the entire survey. An average of 785 responses was collected for each question. KPMG business continuity professionals developed the survey questionnaire. Mint Jutras prepared the resulting tabulation and supplied analysis for select data points. For more information on the study methodology, please contact Mint Jutras at [email protected]. Requests For Benchmarking Reports & Key Contacts If you would like to benchmark your organization by leveraging the 2011-2012Continuity Insights and KPMG LLP Business Continuity Management (BCM) Program Benchmarking Study or custom reports, please provide the following information to Bob Nakao at [email protected]: • Your name • Your organization • Your title • Your e-mail address • The complete study and/or custom report(s) you would like to receive: industry, type of entity, region of HQ operation, number of employees or annual revenue. You will be provided the custom report(s), if available, generally within five (5) business days of the receipt of your request. Other custom reports are available by type of entity include public companies, private companies, government agencies and authorities, and not for profits. Custom reports for industries include education, financial services, computers/information technology/ telecommunications, government, healthcare, manufacturing, professional services, and utilities.
2011-2012 Global Business Continuity Management Program Benchmarking Study
©2012 Continuity Insights/KPMG LLP
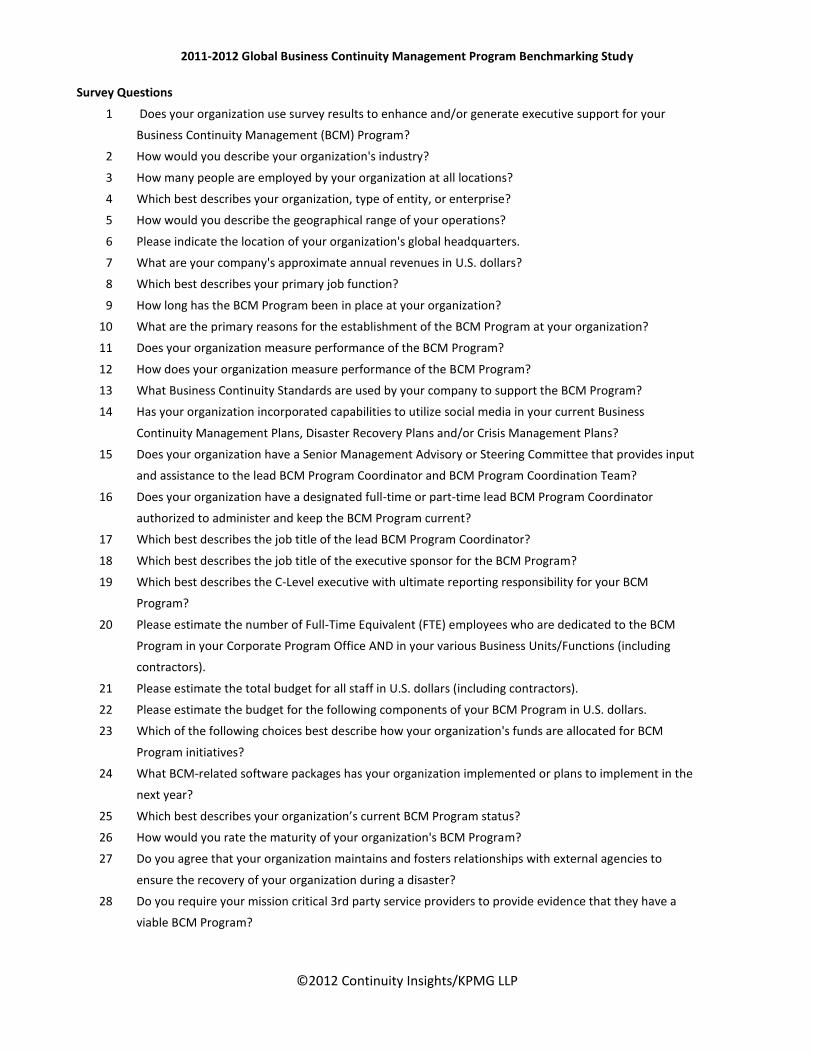
Survey Questions
1 Does your organization use survey results to enhance and/or generate executive support for your
Business Continuity Management (BCM) Program?
2 How would you describe your organization's industry?
3 How many people are employed by your organization at all locations?
4 Which best describes your organization, type of entity, or enterprise?
5 How would you describe the geographical range of your operations?
6 Please indicate the location of your organization's global headquarters.
7 What are your company's approximate annual revenues in U.S. dollars?
8 Which best describes your primary job function?
9 How long has the BCM Program been in place at your organization?
10 What are the primary reasons for the establishment of the BCM Program at your organization?
11 Does your organization measure performance of the BCM Program?
12 How does your organization measure performance of the BCM Program?
13 What Business Continuity Standards are used by your company to support the BCM Program?
14 Has your organization incorporated capabilities to utilize social media in your current Business
Continuity Management Plans, Disaster Recovery Plans and/or Crisis Management Plans?
15 Does your organization have a Senior Management Advisory or Steering Committee that provides input
and assistance to the lead BCM Program Coordinator and BCM Program Coordination Team?
16 Does your organization have a designated full-time or part-time lead BCM Program Coordinator
authorized to administer and keep the BCM Program current?
17 Which best describes the job title of the lead BCM Program Coordinator?
18 Which best describes the job title of the executive sponsor for the BCM Program?
19 Which best describes the C-Level executive with ultimate reporting responsibility for your BCM
Program?
20 Please estimate the number of Full-Time Equivalent (FTE) employees who are dedicated to the BCM
Program in your Corporate Program Office AND in your various Business Units/Functions (including
contractors).
21 Please estimate the total budget for all staff in U.S. dollars (including contractors).
22 Please estimate the budget for the following components of your BCM Program in U.S. dollars.
23 Which of the following choices best describe how your organization's funds are allocated for BCM
Program initiatives?
24 What BCM-related software packages has your organization implemented or plans to implement in the
next year?
25 Which best describes your organization’s current BCM Program status?
26 How would you rate the maturity of your organization's BCM Program?
27 Do you agree that your organization maintains and fosters relationships with external agencies to
ensure the recovery of your organization during a disaster?
28 Do you require your mission critical 3rd party service providers to provide evidence that they have a
viable BCM Program?

2011-2012 Global Business Continuity Management Program Benchmarking Study
©2012 Continuity Insights/KPMG LLP
29 How are 3rd party service providers (Utilities, Information Technology, or Business Process Service
Providers) integrated within your BCM Program?
30 How are key supply chain stakeholders that you rely on to deliver your products or services to market
integrated within your BCM Program?
31 How well integrated is your BCM Program with the following capabilities?
32 How often does your organization conduct Risk Assessments?
33 How often does your organization conduct a Business Impact Analysis (BIA)?
34 How much would you estimate business disruptions have cost your organization in both outlays and
internal (soft) costs in the past 12 months?
35 What would you estimate the total financial impact would be of a major disruption or outage that lasts
for 5 business days?
36 Has your organization experienced an incident or interruption in the past year that caused you to
activate any documented BCM Plans, Crisis Management Plans, or Disaster Recovery Plans?
37 For the most recent interruption that required you to activate one or more BCM Plans, how well was
your recovery time objective met?
38 When was your company's most recent Business Continuity Plan exercise?
39 What elements of your BCM Program were utilized during your most recent exercise?
40 What external companies or agencies have been involved with your most recent BCM Program
exercise?
41 What percentage of your IT budget does your organization spend on disaster recovery capabilities?
42 What is your organization's current IT recovery strategy?
43 Which elements of your organization's current IT recovery strategy are undergoing change?
44 Is cyberterrorism included in your organization's current BCM Plans, Disaster Recovery Plans, and/or
Crisis Management Plans?
45 What percentage of your organization's application data is currently stored in the cloud?
46 When did your organization last conduct a test(s) of the IT Disaster Recovery Plans with representatives
from other key stakeholder companies or agencies?
47 How frequently does your organization carry out full scenario testing of its Disaster Recovery Plan?
48 Please indicate which of the following are utilized by your organization, and have an IT Disaster
Recovery Plan with documented procedures and written guidelines.
49 Did your organization’s employees receive sufficient Business Continuity Management training in the
past year?
50 What was your organization’s investment in Disaster/Emergency Management and BCM training this
past year in comparison to the year before?
51 What types of ongoing BCM training are utilized by your organization?
2011-2012 Global Business Continuity Management Program Benchmarking Study
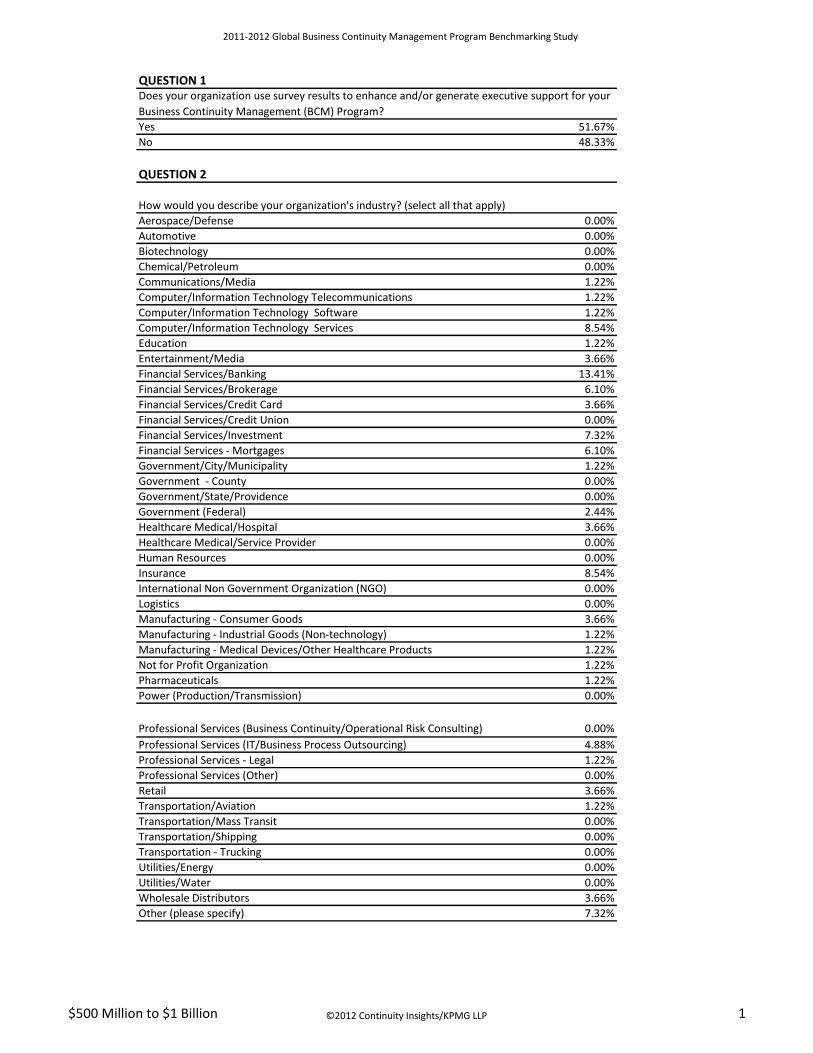
QUESTION 1
51.67%
48.33%
QUESTION 2
Aerospace/Defense 0.00%
Automotive 0.00%
Biotechnology 0.00%
Chemical/Petroleum 0.00%
Communications/Media 1.22%
Computer/Information Technology Telecommunications 1.22%
Computer/Information Technology Software 1.22%
Computer/Information Technology Services 8.54%
Education 1.22%
Entertainment/Media 3.66%
Financial Services/Banking 13.41%
Financial Services/Brokerage 6.10%
Financial Services/Credit Card 3.66%
Financial Services/Credit Union 0.00%
Financial Services/Investment 7.32%
Financial Services - Mortgages 6.10%
Government/City/Municipality 1.22%
Government - County 0.00%
Government/State/Providence 0.00%
Government (Federal) 2.44%
Healthcare Medical/Hospital 3.66%
Healthcare Medical/Service Provider 0.00%
Human Resources 0.00%
Insurance 8.54%
International Non Government Organization (NGO) 0.00%
Logistics 0.00%
Manufacturing - Consumer Goods 3.66%
Manufacturing - Industrial Goods (Non-technology) 1.22%
Manufacturing - Medical Devices/Other Healthcare Products 1.22%
Not for Profit Organization 1.22%
Pharmaceuticals 1.22%
Power (Production/Transmission) 0.00%
0.00%
Professional Services (IT/Business Process Outsourcing) 4.88%
Professional Services - Legal 1.22%
Professional Services (Other) 0.00%
Retail 3.66%
Transportation/Aviation 1.22%
Transportation/Mass Transit 0.00%
Transportation/Shipping 0.00%
Transportation - Trucking 0.00%
Utilities/Energy 0.00%
Utilities/Water 0.00%
Wholesale Distributors 3.66%
Other (please specify) 7.32%
Professional Services (Business Continuity/Operational Risk Consulting)
Does your organization use survey results to enhance and/or generate executive support for your
Business Continuity Management (BCM) Program?
Yes
No
How would you describe your organization's industry? (select all that apply)
$500 Million to $1 Billion ©2012 Continuity Insights/KPMG LLP 1
2011-2012 Global Business Continuity Management Program Benchmarking Study
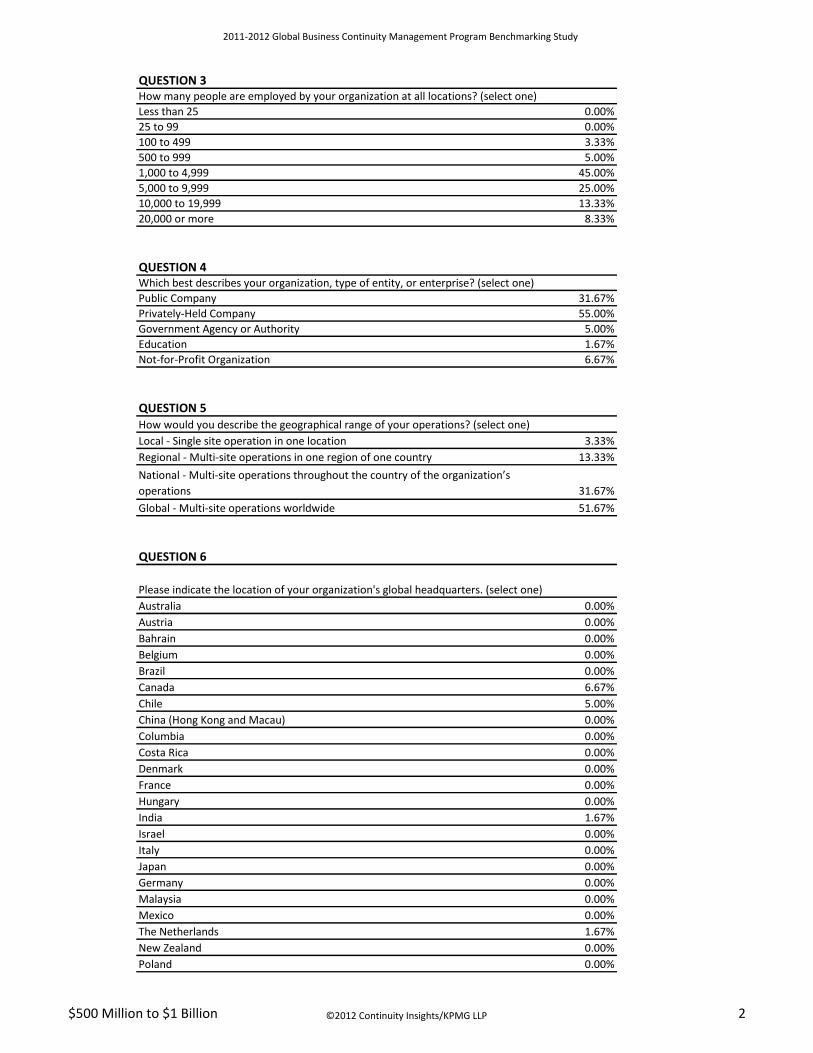
QUESTION 3How many people are employed by your organization at all locations? (select one)
Less than 25 0.00%
25 to 99 0.00%
100 to 499 3.33%
500 to 999 5.00%
1,000 to 4,999 45.00%
5,000 to 9,999 25.00%
10,000 to 19,999 13.33%
20,000 or more 8.33%
QUESTION 4Which best describes your organization, type of entity, or enterprise? (select one)
Public Company 31.67%
Privately-Held Company 55.00%
Government Agency or Authority 5.00%
Education 1.67%
Not-for-Profit Organization 6.67%
QUESTION 5How would you describe the geographical range of your operations? (select one)
Local - Single site operation in one location 3.33%
Regional - Multi-site operations in one region of one country 13.33%
31.67%
Global - Multi-site operations worldwide 51.67%
QUESTION 6
Australia 0.00%
Austria 0.00%
Bahrain 0.00%
Belgium 0.00%
Brazil 0.00%
Canada 6.67%
Chile 5.00%
China (Hong Kong and Macau) 0.00%
Columbia 0.00%
Costa Rica 0.00%
Denmark 0.00%
France 0.00%
Hungary 0.00%
India 1.67%
Israel 0.00%
Italy 0.00%
Japan 0.00%
Germany 0.00%
Malaysia 0.00%
Mexico 0.00%
The Netherlands 1.67%
New Zealand 0.00%
Poland 0.00%
National - Multi-site operations throughout the country of the organization’s
operations
Please indicate the location of your organization's global headquarters. (select one)
$500 Million to $1 Billion ©2012 Continuity Insights/KPMG LLP 2
2011-2012 Global Business Continuity Management Program Benchmarking Study
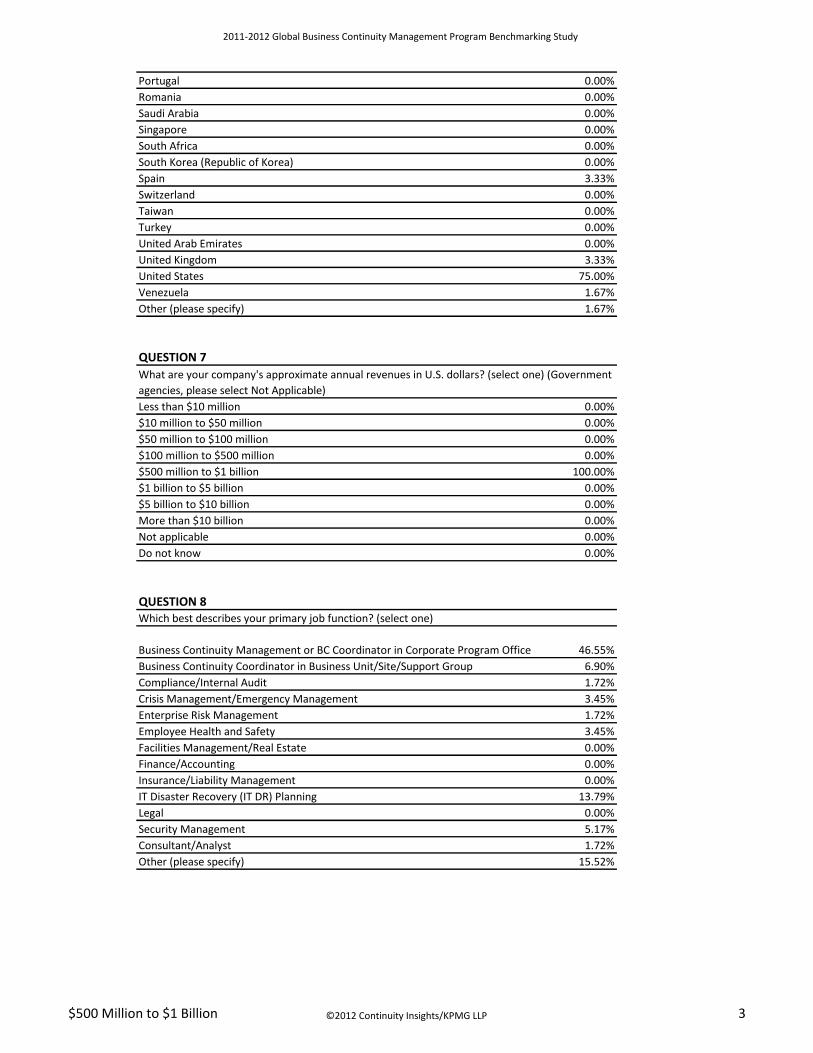
Portugal 0.00%
Romania 0.00%
Saudi Arabia 0.00%
Singapore 0.00%
South Africa 0.00%
South Korea (Republic of Korea) 0.00%
Spain 3.33%
Switzerland 0.00%
Taiwan 0.00%
Turkey 0.00%
United Arab Emirates 0.00%
United Kingdom 3.33%
United States 75.00%
Venezuela 1.67%
Other (please specify) 1.67%
QUESTION 7
Less than $10 million 0.00%
$10 million to $50 million 0.00%
$50 million to $100 million 0.00%
$100 million to $500 million 0.00%
$500 million to $1 billion 100.00%
$1 billion to $5 billion 0.00%
$5 billion to $10 billion 0.00%
More than $10 billion 0.00%
Not applicable 0.00%
Do not know 0.00%
QUESTION 8Which best describes your primary job function? (select one)
46.55%
Business Continuity Coordinator in Business Unit/Site/Support Group 6.90%
Compliance/Internal Audit 1.72%
Crisis Management/Emergency Management 3.45%
Enterprise Risk Management 1.72%
Employee Health and Safety 3.45%
Facilities Management/Real Estate 0.00%
Finance/Accounting 0.00%
Insurance/Liability Management 0.00%
IT Disaster Recovery (IT DR) Planning 13.79%
Legal 0.00%
Security Management 5.17%
Consultant/Analyst 1.72%
Other (please specify) 15.52%
Business Continuity Management or BC Coordinator in Corporate Program Office
What are your company's approximate annual revenues in U.S. dollars? (select one) (Government
agencies, please select Not Applicable)
$500 Million to $1 Billion ©2012 Continuity Insights/KPMG LLP 3
2011-2012 Global Business Continuity Management Program Benchmarking Study
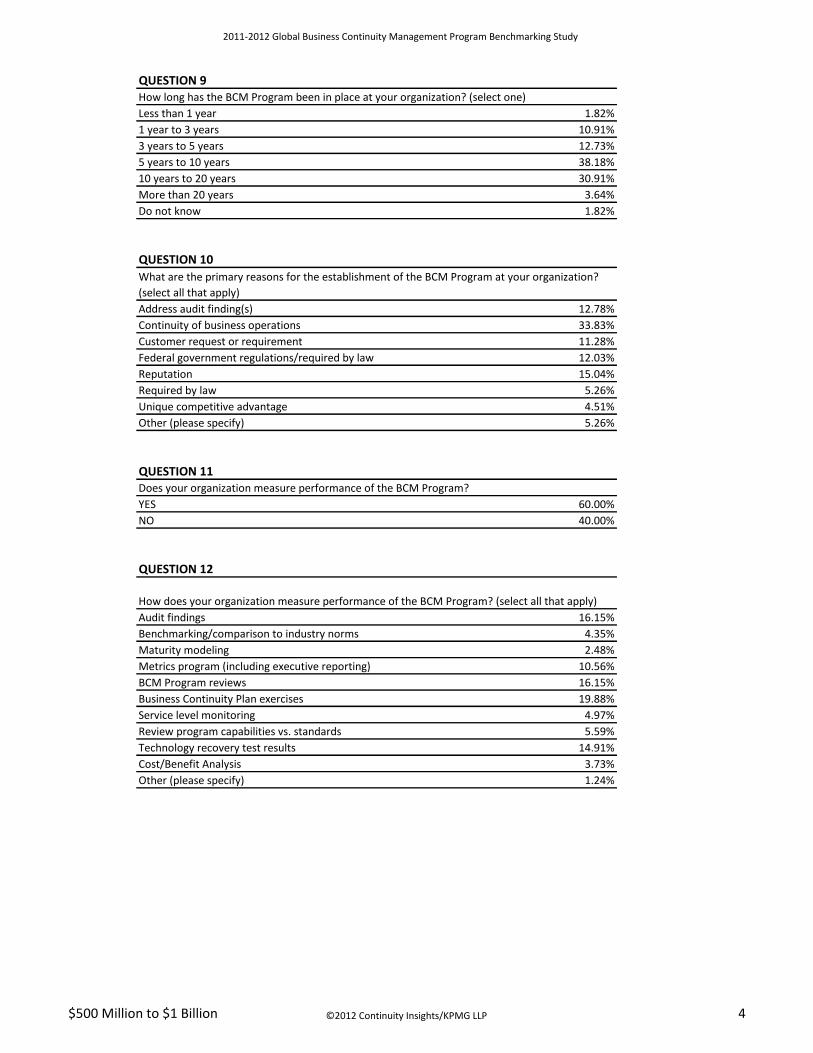
QUESTION 9How long has the BCM Program been in place at your organization? (select one)
Less than 1 year 1.82%
1 year to 3 years 10.91%
3 years to 5 years 12.73%
5 years to 10 years 38.18%
10 years to 20 years 30.91%
More than 20 years 3.64%
Do not know 1.82%
QUESTION 10
Address audit finding(s) 12.78%
Continuity of business operations 33.83%
Customer request or requirement 11.28%
Federal government regulations/required by law 12.03%
Reputation 15.04%
Required by law 5.26%
Unique competitive advantage 4.51%
Other (please specify) 5.26%
QUESTION 11Does your organization measure performance of the BCM Program?
YES 60.00%
NO 40.00%
QUESTION 12
Audit findings 16.15%
Benchmarking/comparison to industry norms 4.35%
Maturity modeling 2.48%
Metrics program (including executive reporting) 10.56%
BCM Program reviews 16.15%
Business Continuity Plan exercises 19.88%
Service level monitoring 4.97%
Review program capabilities vs. standards 5.59%
Technology recovery test results 14.91%
Cost/Benefit Analysis 3.73%
Other (please specify) 1.24%
What are the primary reasons for the establishment of the BCM Program at your organization?
(select all that apply)
How does your organization measure performance of the BCM Program? (select all that apply)
$500 Million to $1 Billion ©2012 Continuity Insights/KPMG LLP 4
2011-2012 Global Business Continuity Management Program Benchmarking Study
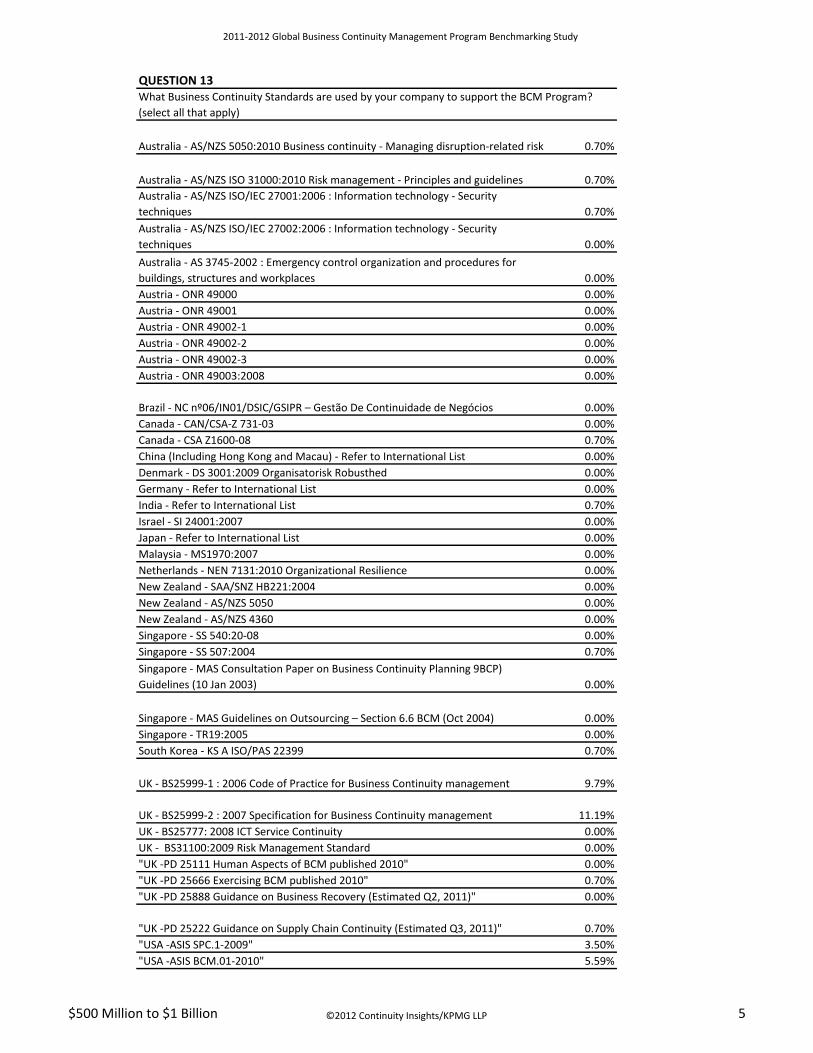
QUESTION 13
0.70%
0.70%
0.70%
0.00%
0.00%
Austria - ONR 49000 0.00%
Austria - ONR 49001 0.00%
Austria - ONR 49002-1 0.00%
Austria - ONR 49002-2 0.00%
Austria - ONR 49002-3 0.00%
Austria - ONR 49003:2008 0.00%
0.00%
Canada - CAN/CSA-Z 731-03 0.00%
Canada - CSA Z1600-08 0.70%
China (Including Hong Kong and Macau) - Refer to International List 0.00%
Denmark - DS 3001:2009 Organisatorisk Robusthed 0.00%
Germany - Refer to International List 0.00%
India - Refer to International List 0.70%
Israel - SI 24001:2007 0.00%
Japan - Refer to International List 0.00%
Malaysia - MS1970:2007 0.00%
Netherlands - NEN 7131:2010 Organizational Resilience 0.00%
New Zealand - SAA/SNZ HB221:2004 0.00%
New Zealand - AS/NZS 5050 0.00%
New Zealand - AS/NZS 4360 0.00%
Singapore - SS 540:20-08 0.00%
Singapore - SS 507:2004 0.70%
0.00%
0.00%
Singapore - TR19:2005 0.00%
South Korea - KS A ISO/PAS 22399 0.70%
9.79%
11.19%
UK - BS25777: 2008 ICT Service Continuity 0.00%
UK - BS31100:2009 Risk Management Standard 0.00%
"UK -PD 25111 Human Aspects of BCM published 2010" 0.00%
"UK -PD 25666 Exercising BCM published 2010" 0.70%
"UK -PD 25888 Guidance on Business Recovery (Estimated Q2, 2011)" 0.00%
0.70%
"USA -ASIS SPC.1-2009" 3.50%
"USA -ASIS BCM.01-2010" 5.59%
"UK -PD 25222 Guidance on Supply Chain Continuity (Estimated Q3, 2011)"
Brazil - NC nº06/IN01/DSIC/GSIPR – Gestão De Continuidade de Negócios
Singapore - MAS Consultation Paper on Business Continuity Planning 9BCP)
Guidelines (10 Jan 2003)
Singapore - MAS Guidelines on Outsourcing – Section 6.6 BCM (Oct 2004)
UK - BS25999-1 : 2006 Code of Practice for Business Continuity management
UK - BS25999-2 : 2007 Specification for Business Continuity management
Australia - AS/NZS 5050:2010 Business continuity - Managing disruption-related risk
Australia - AS/NZS ISO 31000:2010 Risk management - Principles and guidelines
Australia - AS/NZS ISO/IEC 27001:2006 : Information technology - Security
techniques
Australia - AS/NZS ISO/IEC 27002:2006 : Information technology - Security
techniques
Australia - AS 3745-2002 : Emergency control organization and procedures for
buildings, structures and workplaces
What Business Continuity Standards are used by your company to support the BCM Program?
(select all that apply)
$500 Million to $1 Billion ©2012 Continuity Insights/KPMG LLP 5
2011-2012 Global Business Continuity Management Program Benchmarking Study
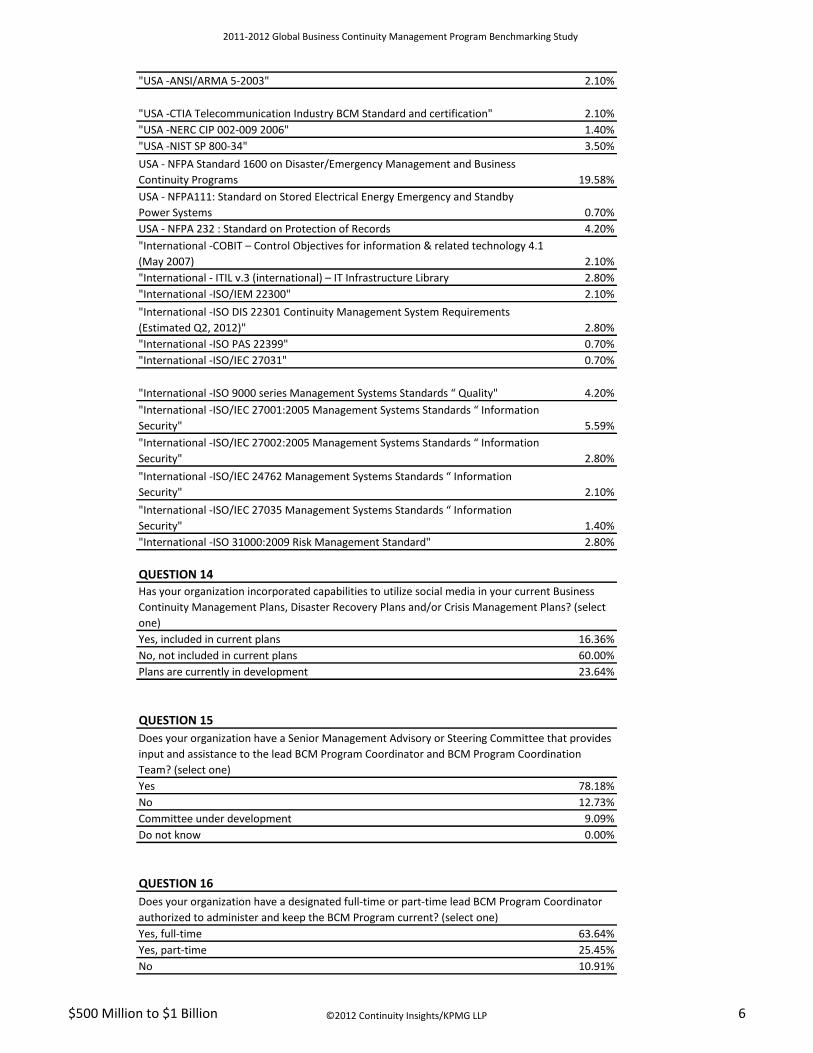
"USA -ANSI/ARMA 5-2003" 2.10%
2.10%
"USA -NERC CIP 002-009 2006" 1.40%
"USA -NIST SP 800-34" 3.50%
19.58%
0.70%
USA - NFPA 232 : Standard on Protection of Records 4.20%
2.10%
"International - ITIL v.3 (international) – IT Infrastructure Library 2.80%
"International -ISO/IEM 22300" 2.10%
2.80%
"International -ISO PAS 22399" 0.70%
"International -ISO/IEC 27031" 0.70%
4.20%
5.59%
2.80%
2.10%
1.40%
"International -ISO 31000:2009 Risk Management Standard" 2.80%
QUESTION 14
Yes, included in current plans 16.36%
No, not included in current plans 60.00%
Plans are currently in development 23.64%
QUESTION 15
Yes 78.18%
No 12.73%
Committee under development 9.09%
Do not know 0.00%
QUESTION 16
Yes, full-time 63.64%
Yes, part-time 25.45%
No 10.91%
"International -ISO/IEC 24762 Management Systems Standards “ Information
Security"
"International -ISO/IEC 27035 Management Systems Standards “ Information
Security"
Has your organization incorporated capabilities to utilize social media in your current Business
Continuity Management Plans, Disaster Recovery Plans and/or Crisis Management Plans? (select
one)
Does your organization have a Senior Management Advisory or Steering Committee that provides
input and assistance to the lead BCM Program Coordinator and BCM Program Coordination
Team? (select one)
Does your organization have a designated full-time or part-time lead BCM Program Coordinator
authorized to administer and keep the BCM Program current? (select one)
"International -COBIT – Control Objectives for information & related technology 4.1
(May 2007)
"International -ISO DIS 22301 Continuity Management System Requirements
(Estimated Q2, 2012)"
"International -ISO 9000 series Management Systems Standards “ Quality"
"International -ISO/IEC 27001:2005 Management Systems Standards “ Information
Security"
"International -ISO/IEC 27002:2005 Management Systems Standards “ Information
Security"
"USA -CTIA Telecommunication Industry BCM Standard and certification"
USA - NFPA Standard 1600 on Disaster/Emergency Management and Business
Continuity Programs
USA - NFPA111: Standard on Stored Electrical Energy Emergency and Standby
Power Systems
$500 Million to $1 Billion ©2012 Continuity Insights/KPMG LLP 6
2011-2012 Global Business Continuity Management Program Benchmarking Study
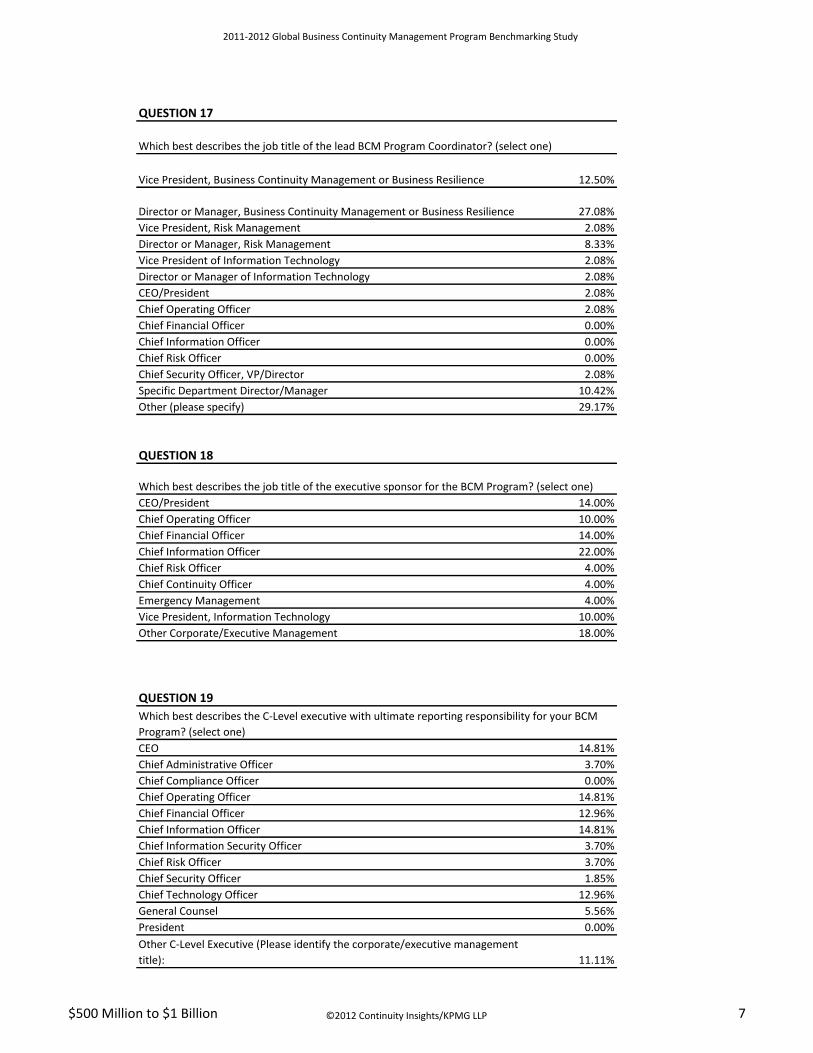
QUESTION 17
12.50%
27.08%
Vice President, Risk Management 2.08%
Director or Manager, Risk Management 8.33%
Vice President of Information Technology 2.08%
Director or Manager of Information Technology 2.08%
CEO/President 2.08%
Chief Operating Officer 2.08%
Chief Financial Officer 0.00%
Chief Information Officer 0.00%
Chief Risk Officer 0.00%
Chief Security Officer, VP/Director 2.08%
Specific Department Director/Manager 10.42%
Other (please specify) 29.17%
QUESTION 18
CEO/President 14.00%
Chief Operating Officer 10.00%
Chief Financial Officer 14.00%
Chief Information Officer 22.00%
Chief Risk Officer 4.00%
Chief Continuity Officer 4.00%
Emergency Management 4.00%
Vice President, Information Technology 10.00%
Other Corporate/Executive Management 18.00%
QUESTION 19
CEO 14.81%
Chief Administrative Officer 3.70%
Chief Compliance Officer 0.00%
Chief Operating Officer 14.81%
Chief Financial Officer 12.96%
Chief Information Officer 14.81%
Chief Information Security Officer 3.70%
Chief Risk Officer 3.70%
Chief Security Officer 1.85%
Chief Technology Officer 12.96%
General Counsel 5.56%
President 0.00%
11.11%
Vice President, Business Continuity Management or Business Resilience
Director or Manager, Business Continuity Management or Business Resilience
Which best describes the job title of the executive sponsor for the BCM Program? (select one)
Which best describes the C-Level executive with ultimate reporting responsibility for your BCM
Program? (select one)
Other C-Level Executive (Please identify the corporate/executive management
title):
Which best describes the job title of the lead BCM Program Coordinator? (select one)
$500 Million to $1 Billion ©2012 Continuity Insights/KPMG LLP 7
2011-2012 Global Business Continuity Management Program Benchmarking Study
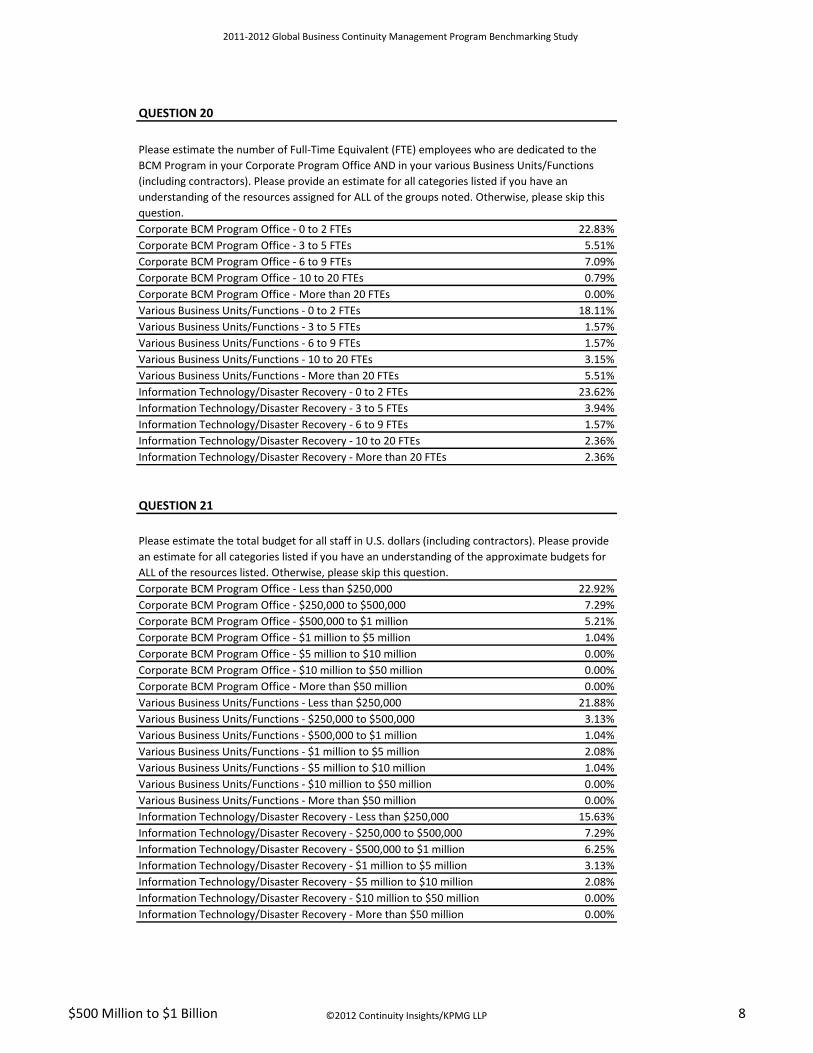
QUESTION 20
Corporate BCM Program Office - 0 to 2 FTEs 22.83%
Corporate BCM Program Office - 3 to 5 FTEs 5.51%
Corporate BCM Program Office - 6 to 9 FTEs 7.09%
Corporate BCM Program Office - 10 to 20 FTEs 0.79%
Corporate BCM Program Office - More than 20 FTEs 0.00%
Various Business Units/Functions - 0 to 2 FTEs 18.11%
Various Business Units/Functions - 3 to 5 FTEs 1.57%
Various Business Units/Functions - 6 to 9 FTEs 1.57%
Various Business Units/Functions - 10 to 20 FTEs 3.15%
Various Business Units/Functions - More than 20 FTEs 5.51%
Information Technology/Disaster Recovery - 0 to 2 FTEs 23.62%
Information Technology/Disaster Recovery - 3 to 5 FTEs 3.94%
Information Technology/Disaster Recovery - 6 to 9 FTEs 1.57%
Information Technology/Disaster Recovery - 10 to 20 FTEs 2.36%
Information Technology/Disaster Recovery - More than 20 FTEs 2.36%
QUESTION 21
Corporate BCM Program Office - Less than $250,000 22.92%
Corporate BCM Program Office - $250,000 to $500,000 7.29%
Corporate BCM Program Office - $500,000 to $1 million 5.21%
Corporate BCM Program Office - $1 million to $5 million 1.04%
Corporate BCM Program Office - $5 million to $10 million 0.00%
Corporate BCM Program Office - $10 million to $50 million 0.00%
Corporate BCM Program Office - More than $50 million 0.00%
Various Business Units/Functions - Less than $250,000 21.88%
Various Business Units/Functions - $250,000 to $500,000 3.13%
Various Business Units/Functions - $500,000 to $1 million 1.04%
Various Business Units/Functions - $1 million to $5 million 2.08%
Various Business Units/Functions - $5 million to $10 million 1.04%
Various Business Units/Functions - $10 million to $50 million 0.00%
Various Business Units/Functions - More than $50 million 0.00%
Information Technology/Disaster Recovery - Less than $250,000 15.63%
Information Technology/Disaster Recovery - $250,000 to $500,000 7.29%
Information Technology/Disaster Recovery - $500,000 to $1 million 6.25%
Information Technology/Disaster Recovery - $1 million to $5 million 3.13%
Information Technology/Disaster Recovery - $5 million to $10 million 2.08%
Information Technology/Disaster Recovery - $10 million to $50 million 0.00%
Information Technology/Disaster Recovery - More than $50 million 0.00%
Please estimate the number of Full-Time Equivalent (FTE) employees who are dedicated to the
BCM Program in your Corporate Program Office AND in your various Business Units/Functions
(including contractors). Please provide an estimate for all categories listed if you have an
understanding of the resources assigned for ALL of the groups noted. Otherwise, please skip this
question.
Please estimate the total budget for all staff in U.S. dollars (including contractors). Please provide
an estimate for all categories listed if you have an understanding of the approximate budgets for
ALL of the resources listed. Otherwise, please skip this question.
$500 Million to $1 Billion ©2012 Continuity Insights/KPMG LLP 8
2011-2012 Global Business Continuity Management Program Benchmarking Study
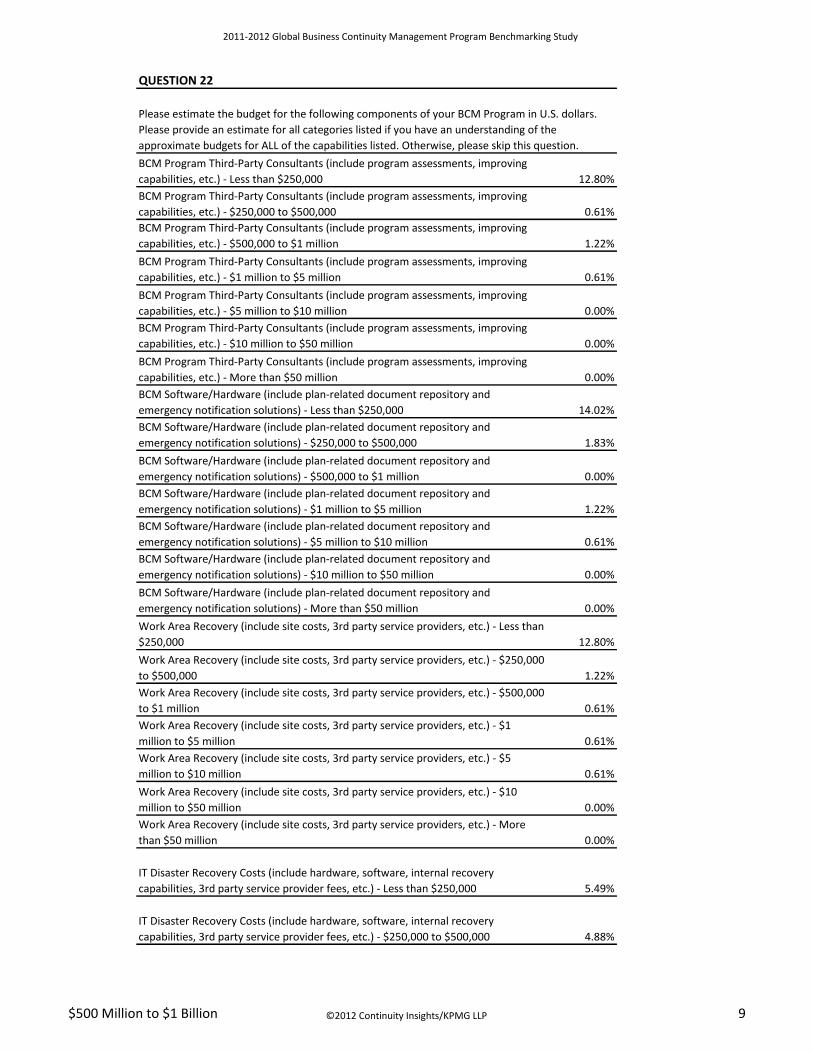
QUESTION 22
12.80%
0.61%
1.22%
0.61%
0.00%
0.00%
0.00%
14.02%
1.83%
0.00%
1.22%
0.61%
0.00%
0.00%
12.80%
1.22%
0.61%
0.61%
0.61%
0.00%
0.00%
5.49%
4.88%
IT Disaster Recovery Costs (include hardware, software, internal recovery
capabilities, 3rd party service provider fees, etc.) - $250,000 to $500,000
Work Area Recovery (include site costs, 3rd party service providers, etc.) - $1
million to $5 million
Work Area Recovery (include site costs, 3rd party service providers, etc.) - $5
million to $10 million
Work Area Recovery (include site costs, 3rd party service providers, etc.) - $10
million to $50 million
Work Area Recovery (include site costs, 3rd party service providers, etc.) - More
than $50 million
IT Disaster Recovery Costs (include hardware, software, internal recovery
capabilities, 3rd party service provider fees, etc.) - Less than $250,000
BCM Software/Hardware (include plan-related document repository and
emergency notification solutions) - $10 million to $50 million
BCM Software/Hardware (include plan-related document repository and
emergency notification solutions) - More than $50 million
Work Area Recovery (include site costs, 3rd party service providers, etc.) - Less than
$250,000
Work Area Recovery (include site costs, 3rd party service providers, etc.) - $250,000
to $500,000
Work Area Recovery (include site costs, 3rd party service providers, etc.) - $500,000
to $1 million
BCM Software/Hardware (include plan-related document repository and
emergency notification solutions) - Less than $250,000
BCM Software/Hardware (include plan-related document repository and
emergency notification solutions) - $250,000 to $500,000
BCM Software/Hardware (include plan-related document repository and
emergency notification solutions) - $500,000 to $1 million
BCM Software/Hardware (include plan-related document repository and
emergency notification solutions) - $1 million to $5 million
BCM Software/Hardware (include plan-related document repository and
emergency notification solutions) - $5 million to $10 million
BCM Program Third-Party Consultants (include program assessments, improving
capabilities, etc.) - $500,000 to $1 million
BCM Program Third-Party Consultants (include program assessments, improving
capabilities, etc.) - $1 million to $5 million
BCM Program Third-Party Consultants (include program assessments, improving
capabilities, etc.) - $5 million to $10 million
BCM Program Third-Party Consultants (include program assessments, improving
capabilities, etc.) - $10 million to $50 million
BCM Program Third-Party Consultants (include program assessments, improving
capabilities, etc.) - More than $50 million
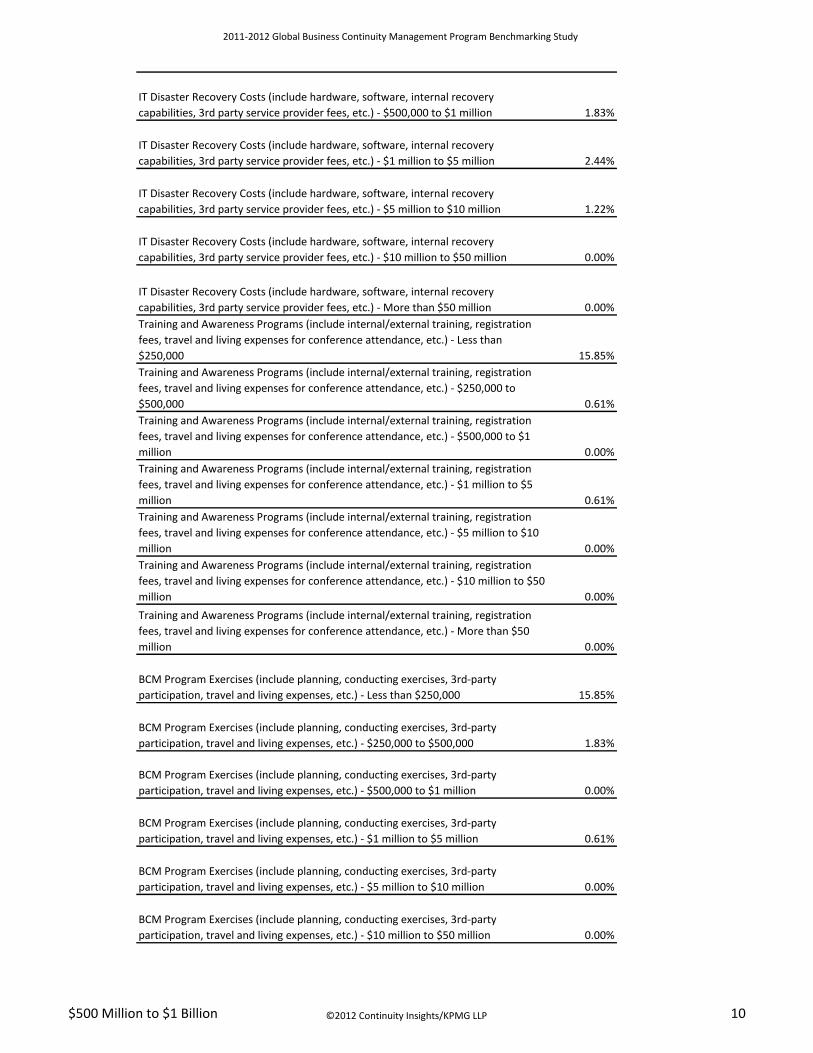
Please estimate the budget for the following components of your BCM Program in U.S. dollars.
Please provide an estimate for all categories listed if you have an understanding of the
approximate budgets for ALL of the capabilities listed. Otherwise, please skip this question.
BCM Program Third-Party Consultants (include program assessments, improving
capabilities, etc.) - Less than $250,000
BCM Program Third-Party Consultants (include program assessments, improving
capabilities, etc.) - $250,000 to $500,000
$500 Million to $1 Billion ©2012 Continuity Insights/KPMG LLP 9
2011-2012 Global Business Continuity Management Program Benchmarking Study
1.83%
2.44%
1.22%
0.00%
0.00%
15.85%
0.61%
0.00%
0.61%
0.00%
0.00%
0.00%
15.85%
1.83%
0.00%
0.61%
0.00%
0.00%
BCM Program Exercises (include planning, conducting exercises, 3rd-party
participation, travel and living expenses, etc.) - $500,000 to $1 million
BCM Program Exercises (include planning, conducting exercises, 3rd-party
participation, travel and living expenses, etc.) - $1 million to $5 million
BCM Program Exercises (include planning, conducting exercises, 3rd-party
participation, travel and living expenses, etc.) - $5 million to $10 million
BCM Program Exercises (include planning, conducting exercises, 3rd-party
participation, travel and living expenses, etc.) - $10 million to $50 million
Training and Awareness Programs (include internal/external training, registration
fees, travel and living expenses for conference attendance, etc.) - $5 million to $10
million
Training and Awareness Programs (include internal/external training, registration
fees, travel and living expenses for conference attendance, etc.) - $10 million to $50
million
Training and Awareness Programs (include internal/external training, registration
fees, travel and living expenses for conference attendance, etc.) - More than $50
million
BCM Program Exercises (include planning, conducting exercises, 3rd-party
participation, travel and living expenses, etc.) - Less than $250,000
BCM Program Exercises (include planning, conducting exercises, 3rd-party
participation, travel and living expenses, etc.) - $250,000 to $500,000
IT Disaster Recovery Costs (include hardware, software, internal recovery
capabilities, 3rd party service provider fees, etc.) - More than $50 million
Training and Awareness Programs (include internal/external training, registration
fees, travel and living expenses for conference attendance, etc.) - Less than
$250,000
Training and Awareness Programs (include internal/external training, registration
fees, travel and living expenses for conference attendance, etc.) - $250,000 to
$500,000
Training and Awareness Programs (include internal/external training, registration
fees, travel and living expenses for conference attendance, etc.) - $500,000 to $1
million
Training and Awareness Programs (include internal/external training, registration
fees, travel and living expenses for conference attendance, etc.) - $1 million to $5
million
IT Disaster Recovery Costs (include hardware, software, internal recovery
capabilities, 3rd party service provider fees, etc.) - $500,000 to $1 million
IT Disaster Recovery Costs (include hardware, software, internal recovery
capabilities, 3rd party service provider fees, etc.) - $1 million to $5 million
IT Disaster Recovery Costs (include hardware, software, internal recovery
capabilities, 3rd party service provider fees, etc.) - $5 million to $10 million
IT Disaster Recovery Costs (include hardware, software, internal recovery
capabilities, 3rd party service provider fees, etc.) - $10 million to $50 million
$500 Million to $1 Billion ©2012 Continuity Insights/KPMG LLP 10
2011-2012 Global Business Continuity Management Program Benchmarking Study
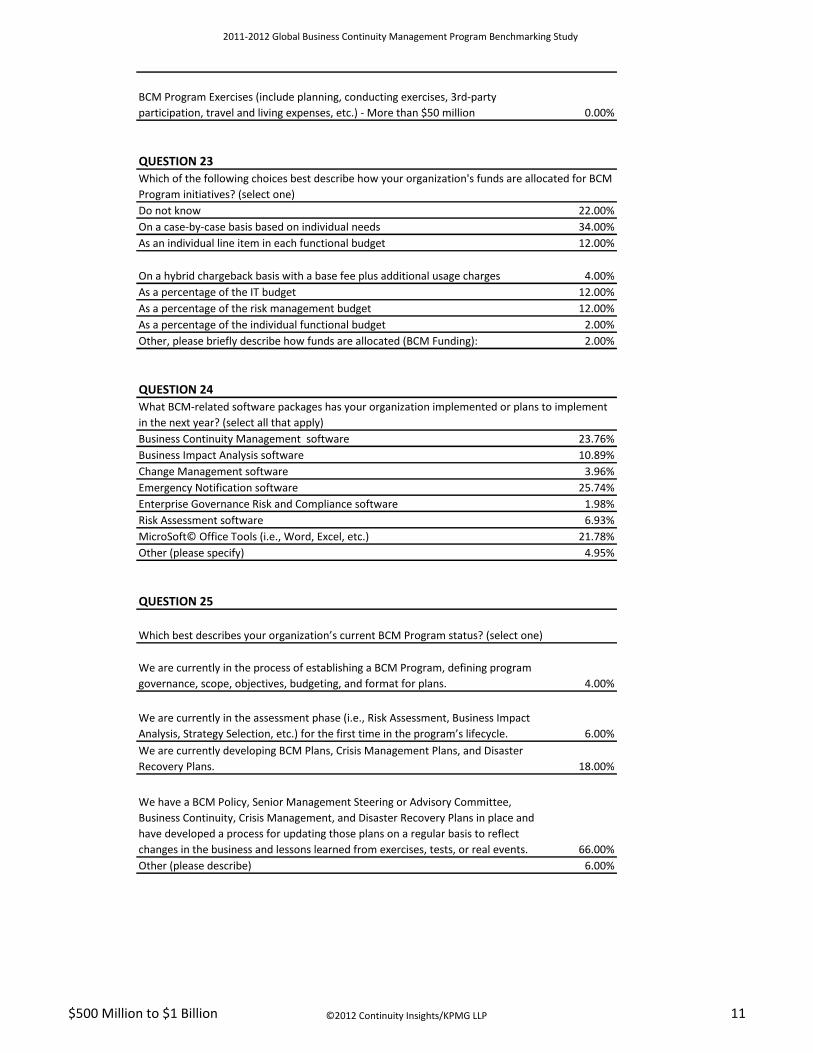
0.00%
QUESTION 23
Do not know 22.00%
On a case-by-case basis based on individual needs 34.00%
As an individual line item in each functional budget 12.00%
4.00%
As a percentage of the IT budget 12.00%
As a percentage of the risk management budget 12.00%
As a percentage of the individual functional budget 2.00%
Other, please briefly describe how funds are allocated (BCM Funding): 2.00%
QUESTION 24
Business Continuity Management software 23.76%
Business Impact Analysis software 10.89%
Change Management software 3.96%
Emergency Notification software 25.74%
Enterprise Governance Risk and Compliance software 1.98%
Risk Assessment software 6.93%
MicroSoft© Office Tools (i.e., Word, Excel, etc.) 21.78%
Other (please specify) 4.95%
QUESTION 25
4.00%
6.00%
18.00%
66.00%
Other (please describe) 6.00%
We are currently in the assessment phase (i.e., Risk Assessment, Business Impact
Analysis, Strategy Selection, etc.) for the first time in the program’s lifecycle.
We are currently developing BCM Plans, Crisis Management Plans, and Disaster
Recovery Plans.
We have a BCM Policy, Senior Management Steering or Advisory Committee,
Business Continuity, Crisis Management, and Disaster Recovery Plans in place and
have developed a process for updating those plans on a regular basis to reflect
changes in the business and lessons learned from exercises, tests, or real events.
Which of the following choices best describe how your organization's funds are allocated for BCM
Program initiatives? (select one)
On a hybrid chargeback basis with a base fee plus additional usage charges
What BCM-related software packages has your organization implemented or plans to implement
in the next year? (select all that apply)
Which best describes your organization’s current BCM Program status? (select one)
We are currently in the process of establishing a BCM Program, defining program
governance, scope, objectives, budgeting, and format for plans.
BCM Program Exercises (include planning, conducting exercises, 3rd-party
participation, travel and living expenses, etc.) - More than $50 million
$500 Million to $1 Billion ©2012 Continuity Insights/KPMG LLP 11
2011-2012 Global Business Continuity Management Program Benchmarking Study
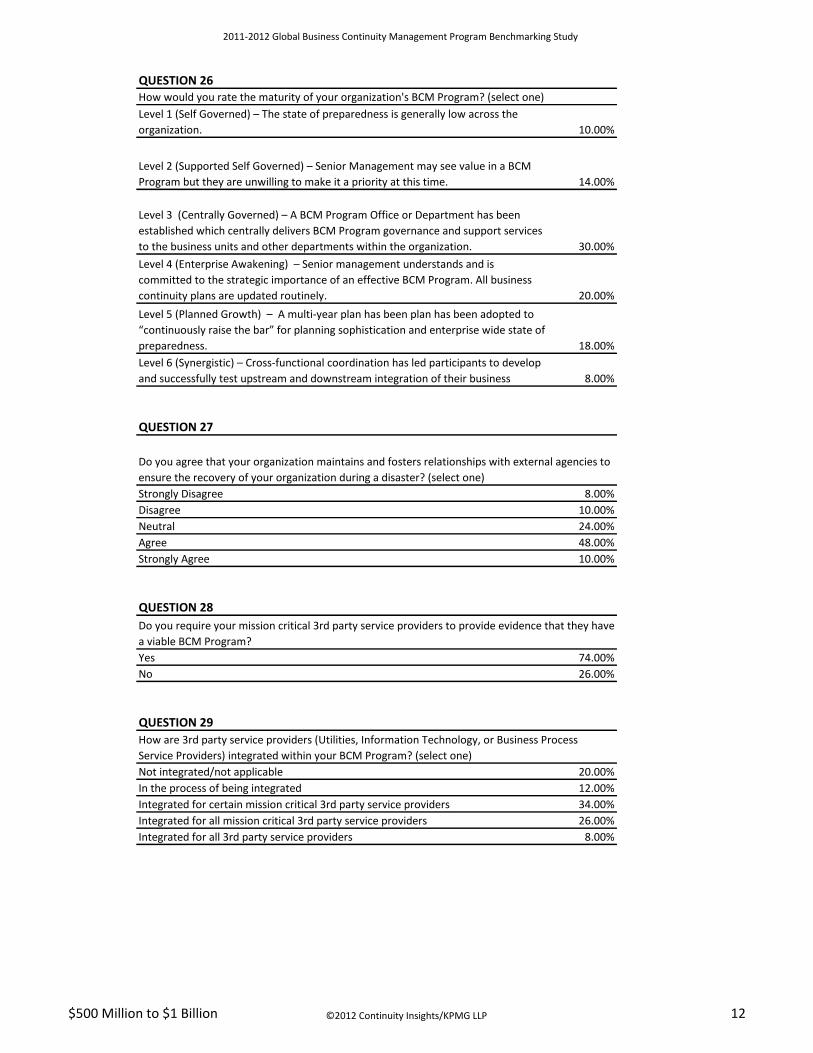
QUESTION 26How would you rate the maturity of your organization's BCM Program? (select one)
10.00%
14.00%
30.00%
20.00%
18.00%
8.00%
QUESTION 27
Strongly Disagree 8.00%
Disagree 10.00%
Neutral 24.00%
Agree 48.00%
Strongly Agree 10.00%
QUESTION 28
Yes 74.00%
No 26.00%
QUESTION 29
Not integrated/not applicable 20.00%
In the process of being integrated 12.00%
Integrated for certain mission critical 3rd party service providers 34.00%
Integrated for all mission critical 3rd party service providers 26.00%
Integrated for all 3rd party service providers 8.00%
Do you require your mission critical 3rd party service providers to provide evidence that they have
a viable BCM Program?
How are 3rd party service providers (Utilities, Information Technology, or Business Process
Service Providers) integrated within your BCM Program? (select one)
Level 3 (Centrally Governed) – A BCM Program Office or Department has been
established which centrally delivers BCM Program governance and support services
to the business units and other departments within the organization.
Level 4 (Enterprise Awakening) – Senior management understands and is
committed to the strategic importance of an effective BCM Program. All business
continuity plans are updated routinely.
Level 5 (Planned Growth) – A multi-year plan has been plan has been adopted to
“continuously raise the bar” for planning sophistication and enterprise wide state of
preparedness.
Level 6 (Synergistic) – Cross-functional coordination has led participants to develop
and successfully test upstream and downstream integration of their business
Do you agree that your organization maintains and fosters relationships with external agencies to
ensure the recovery of your organization during a disaster? (select one)
Level 1 (Self Governed) – The state of preparedness is generally low across the
organization.
Level 2 (Supported Self Governed) – Senior Management may see value in a BCM
Program but they are unwilling to make it a priority at this time.
$500 Million to $1 Billion ©2012 Continuity Insights/KPMG LLP 12
2011-2012 Global Business Continuity Management Program Benchmarking Study
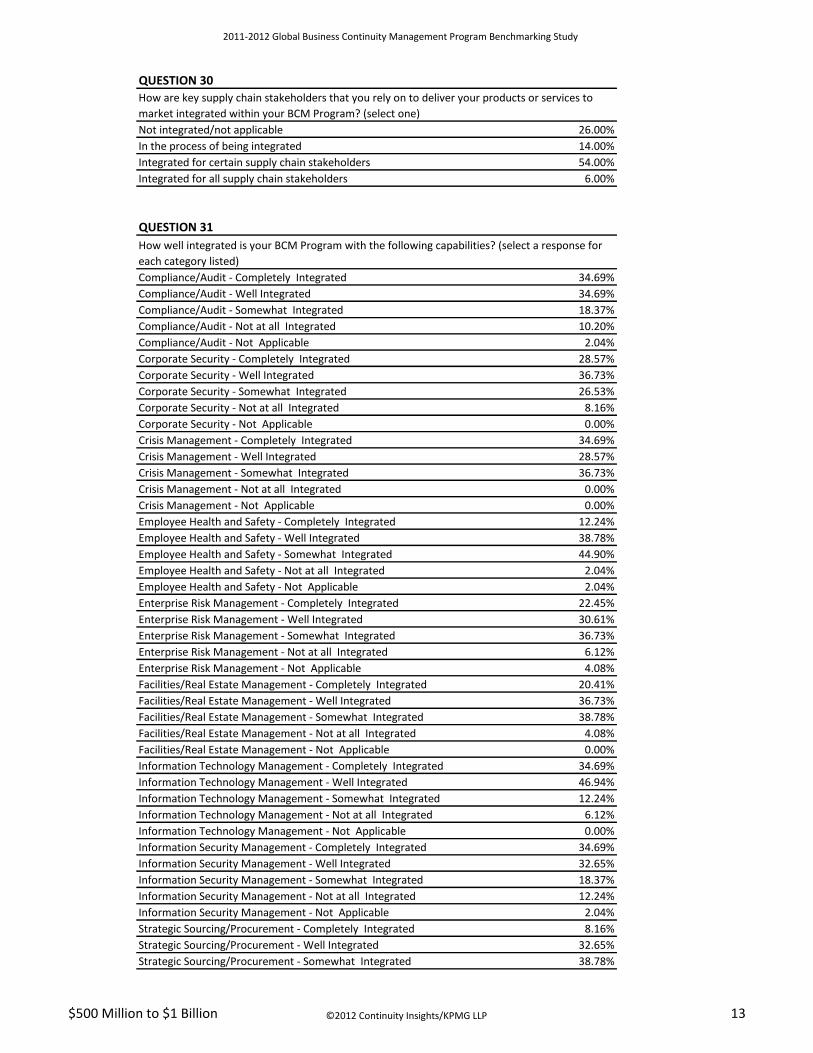
QUESTION 30
Not integrated/not applicable 26.00%
In the process of being integrated 14.00%
Integrated for certain supply chain stakeholders 54.00%
Integrated for all supply chain stakeholders 6.00%
QUESTION 31
Compliance/Audit - Completely Integrated 34.69%
Compliance/Audit - Well Integrated 34.69%
Compliance/Audit - Somewhat Integrated 18.37%
Compliance/Audit - Not at all Integrated 10.20%
Compliance/Audit - Not Applicable 2.04%
Corporate Security - Completely Integrated 28.57%
Corporate Security - Well Integrated 36.73%
Corporate Security - Somewhat Integrated 26.53%
Corporate Security - Not at all Integrated 8.16%
Corporate Security - Not Applicable 0.00%
Crisis Management - Completely Integrated 34.69%
Crisis Management - Well Integrated 28.57%
Crisis Management - Somewhat Integrated 36.73%
Crisis Management - Not at all Integrated 0.00%
Crisis Management - Not Applicable 0.00%
Employee Health and Safety - Completely Integrated 12.24%
Employee Health and Safety - Well Integrated 38.78%
Employee Health and Safety - Somewhat Integrated 44.90%
Employee Health and Safety - Not at all Integrated 2.04%
Employee Health and Safety - Not Applicable 2.04%
Enterprise Risk Management - Completely Integrated 22.45%
Enterprise Risk Management - Well Integrated 30.61%
Enterprise Risk Management - Somewhat Integrated 36.73%
Enterprise Risk Management - Not at all Integrated 6.12%
Enterprise Risk Management - Not Applicable 4.08%
Facilities/Real Estate Management - Completely Integrated 20.41%
Facilities/Real Estate Management - Well Integrated 36.73%
Facilities/Real Estate Management - Somewhat Integrated 38.78%
Facilities/Real Estate Management - Not at all Integrated 4.08%
Facilities/Real Estate Management - Not Applicable 0.00%
Information Technology Management - Completely Integrated 34.69%
Information Technology Management - Well Integrated 46.94%
Information Technology Management - Somewhat Integrated 12.24%
Information Technology Management - Not at all Integrated 6.12%
Information Technology Management - Not Applicable 0.00%
Information Security Management - Completely Integrated 34.69%
Information Security Management - Well Integrated 32.65%
Information Security Management - Somewhat Integrated 18.37%
Information Security Management - Not at all Integrated 12.24%
Information Security Management - Not Applicable 2.04%
Strategic Sourcing/Procurement - Completely Integrated 8.16%
Strategic Sourcing/Procurement - Well Integrated 32.65%
Strategic Sourcing/Procurement - Somewhat Integrated 38.78%
How are key supply chain stakeholders that you rely on to deliver your products or services to
market integrated within your BCM Program? (select one)
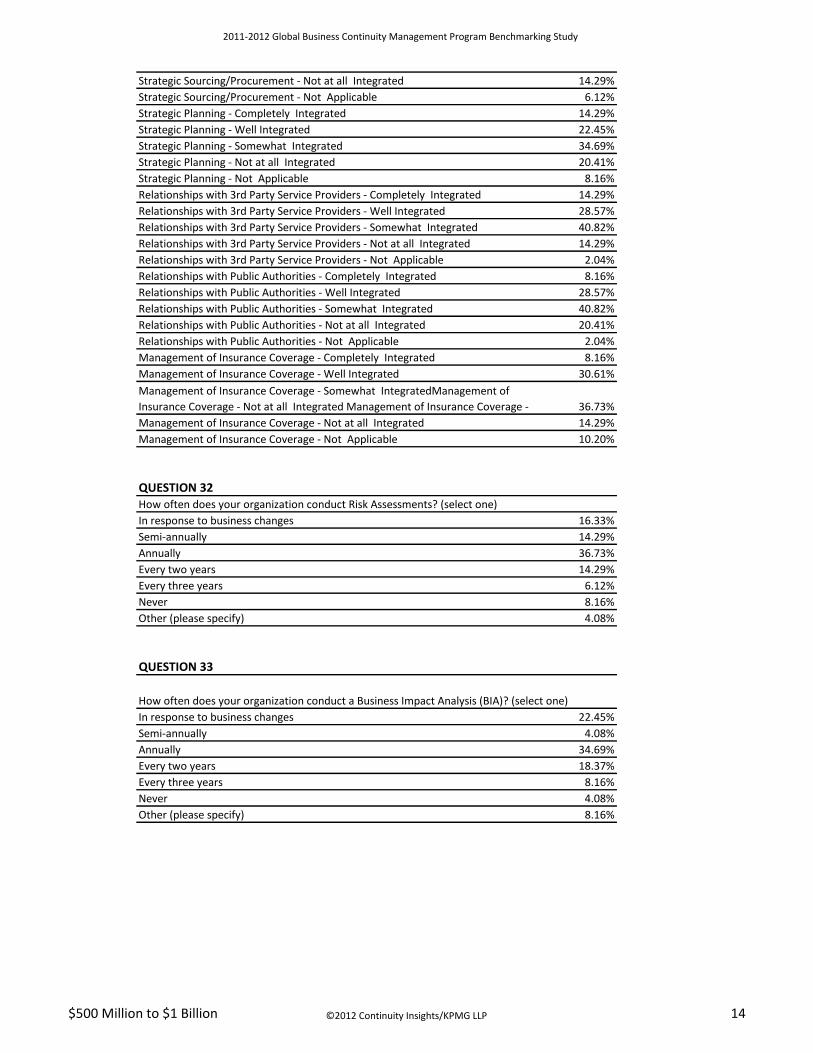
How well integrated is your BCM Program with the following capabilities? (select a response for
each category listed)
$500 Million to $1 Billion ©2012 Continuity Insights/KPMG LLP 13
2011-2012 Global Business Continuity Management Program Benchmarking Study
Strategic Sourcing/Procurement - Not at all Integrated 14.29%
Strategic Sourcing/Procurement - Not Applicable 6.12%
Strategic Planning - Completely Integrated 14.29%
Strategic Planning - Well Integrated 22.45%
Strategic Planning - Somewhat Integrated 34.69%
Strategic Planning - Not at all Integrated 20.41%
Strategic Planning - Not Applicable 8.16%
Relationships with 3rd Party Service Providers - Completely Integrated 14.29%
Relationships with 3rd Party Service Providers - Well Integrated 28.57%
Relationships with 3rd Party Service Providers - Somewhat Integrated 40.82%
Relationships with 3rd Party Service Providers - Not at all Integrated 14.29%
Relationships with 3rd Party Service Providers - Not Applicable 2.04%
Relationships with Public Authorities - Completely Integrated 8.16%
Relationships with Public Authorities - Well Integrated 28.57%
Relationships with Public Authorities - Somewhat Integrated 40.82%
Relationships with Public Authorities - Not at all Integrated 20.41%
Relationships with Public Authorities - Not Applicable 2.04%
Management of Insurance Coverage - Completely Integrated 8.16%
Management of Insurance Coverage - Well Integrated 30.61%
36.73%
Management of Insurance Coverage - Not at all Integrated 14.29%
Management of Insurance Coverage - Not Applicable 10.20%
QUESTION 32How often does your organization conduct Risk Assessments? (select one)
In response to business changes 16.33%
Semi-annually 14.29%
Annually 36.73%
Every two years 14.29%
Every three years 6.12%
Never 8.16%
Other (please specify) 4.08%
QUESTION 33
In response to business changes 22.45%
Semi-annually 4.08%
Annually 34.69%
Every two years 18.37%
Every three years 8.16%
Never 4.08%
Other (please specify) 8.16%
How often does your organization conduct a Business Impact Analysis (BIA)? (select one)
Management of Insurance Coverage - Somewhat IntegratedManagement of
Insurance Coverage - Not at all Integrated Management of Insurance Coverage -
$500 Million to $1 Billion ©2012 Continuity Insights/KPMG LLP 14
2011-2012 Global Business Continuity Management Program Benchmarking Study
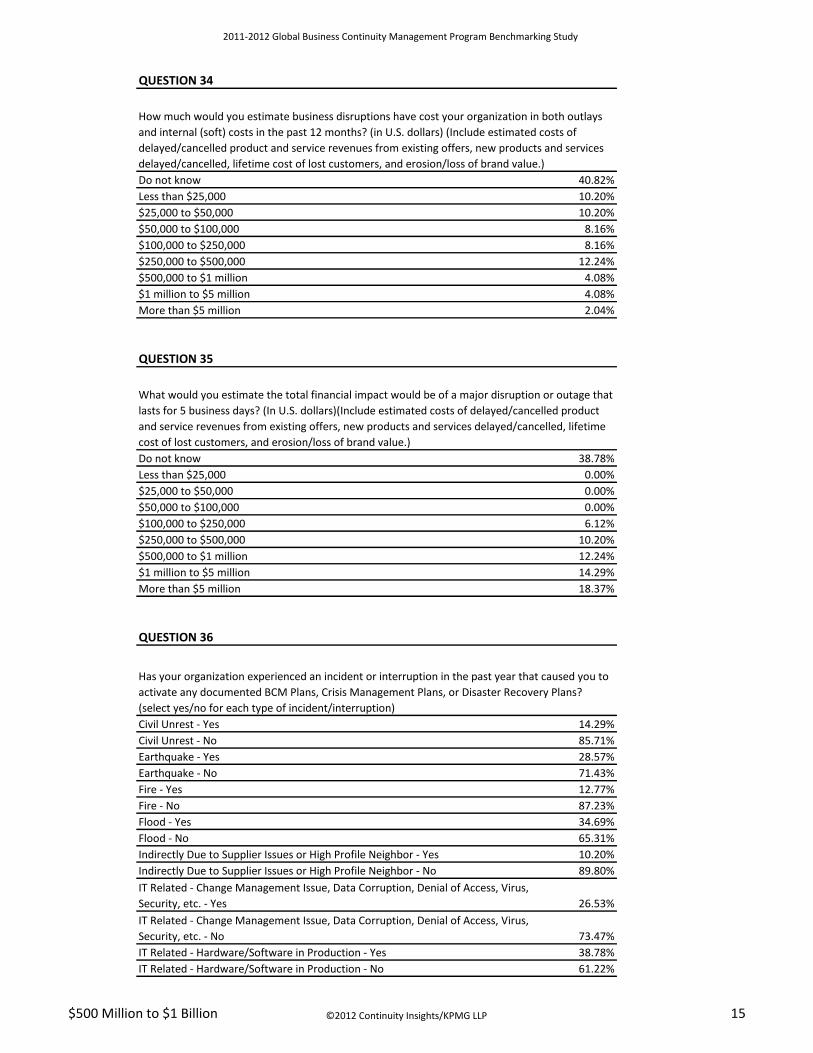
QUESTION 34
Do not know 40.82%
Less than $25,000 10.20%
$25,000 to $50,000 10.20%
$50,000 to $100,000 8.16%
$100,000 to $250,000 8.16%
$250,000 to $500,000 12.24%
$500,000 to $1 million 4.08%
$1 million to $5 million 4.08%
More than $5 million 2.04%
QUESTION 35
Do not know 38.78%
Less than $25,000 0.00%
$25,000 to $50,000 0.00%
$50,000 to $100,000 0.00%
$100,000 to $250,000 6.12%
$250,000 to $500,000 10.20%
$500,000 to $1 million 12.24%
$1 million to $5 million 14.29%
More than $5 million 18.37%
QUESTION 36
Civil Unrest - Yes 14.29%
Civil Unrest - No 85.71%
Earthquake - Yes 28.57%
Earthquake - No 71.43%
Fire - Yes 12.77%
Fire - No 87.23%
Flood - Yes 34.69%
Flood - No 65.31%
Indirectly Due to Supplier Issues or High Profile Neighbor - Yes 10.20%
Indirectly Due to Supplier Issues or High Profile Neighbor - No 89.80%
26.53%
73.47%
IT Related - Hardware/Software in Production - Yes 38.78%
IT Related - Hardware/Software in Production - No 61.22%
How much would you estimate business disruptions have cost your organization in both outlays
and internal (soft) costs in the past 12 months? (in U.S. dollars) (Include estimated costs of
delayed/cancelled product and service revenues from existing offers, new products and services
delayed/cancelled, lifetime cost of lost customers, and erosion/loss of brand value.)
What would you estimate the total financial impact would be of a major disruption or outage that
lasts for 5 business days? (In U.S. dollars)(Include estimated costs of delayed/cancelled product
and service revenues from existing offers, new products and services delayed/cancelled, lifetime
cost of lost customers, and erosion/loss of brand value.)
Has your organization experienced an incident or interruption in the past year that caused you to
activate any documented BCM Plans, Crisis Management Plans, or Disaster Recovery Plans?
(select yes/no for each type of incident/interruption)
IT Related - Change Management Issue, Data Corruption, Denial of Access, Virus,
Security, etc. - Yes
IT Related - Change Management Issue, Data Corruption, Denial of Access, Virus,
Security, etc. - No
$500 Million to $1 Billion ©2012 Continuity Insights/KPMG LLP 15
2011-2012 Global Business Continuity Management Program Benchmarking Study
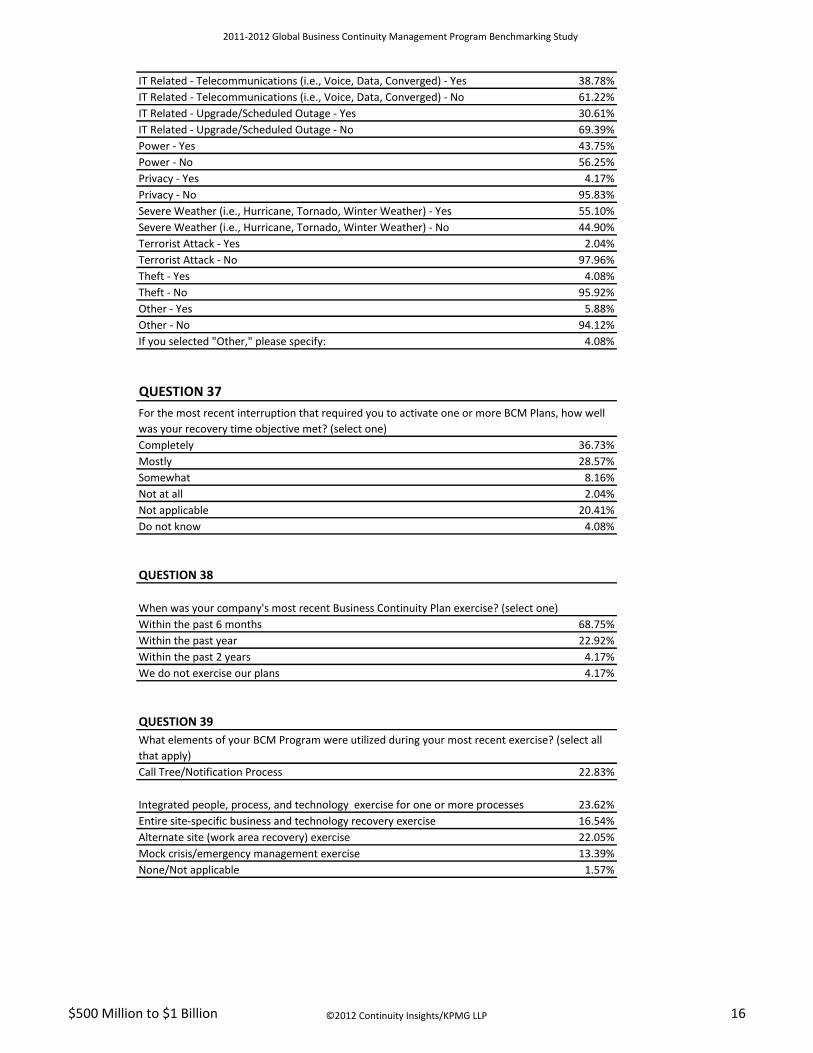
IT Related - Telecommunications (i.e., Voice, Data, Converged) - Yes 38.78%
IT Related - Telecommunications (i.e., Voice, Data, Converged) - No 61.22%
IT Related - Upgrade/Scheduled Outage - Yes 30.61%
IT Related - Upgrade/Scheduled Outage - No 69.39%
Power - Yes 43.75%
Power - No 56.25%
Privacy - Yes 4.17%
Privacy - No 95.83%
Severe Weather (i.e., Hurricane, Tornado, Winter Weather) - Yes 55.10%
Severe Weather (i.e., Hurricane, Tornado, Winter Weather) - No 44.90%
Terrorist Attack - Yes 2.04%
Terrorist Attack - No 97.96%
Theft - Yes 4.08%
Theft - No 95.92%
Other - Yes 5.88%
Other - No 94.12%
If you selected "Other," please specify: 4.08%
QUESTION 37
Completely 36.73%
Mostly 28.57%
Somewhat 8.16%
Not at all 2.04%
Not applicable 20.41%
Do not know 4.08%
QUESTION 38
Within the past 6 months 68.75%
Within the past year 22.92%
Within the past 2 years 4.17%
We do not exercise our plans 4.17%
QUESTION 39
Call Tree/Notification Process 22.83%
23.62%
Entire site-specific business and technology recovery exercise 16.54%
Alternate site (work area recovery) exercise 22.05%
Mock crisis/emergency management exercise 13.39%
None/Not applicable 1.57%
For the most recent interruption that required you to activate one or more BCM Plans, how well
was your recovery time objective met? (select one)
When was your company's most recent Business Continuity Plan exercise? (select one)
What elements of your BCM Program were utilized during your most recent exercise? (select all
that apply)
Integrated people, process, and technology exercise for one or more processes
$500 Million to $1 Billion ©2012 Continuity Insights/KPMG LLP 16
2011-2012 Global Business Continuity Management Program Benchmarking Study
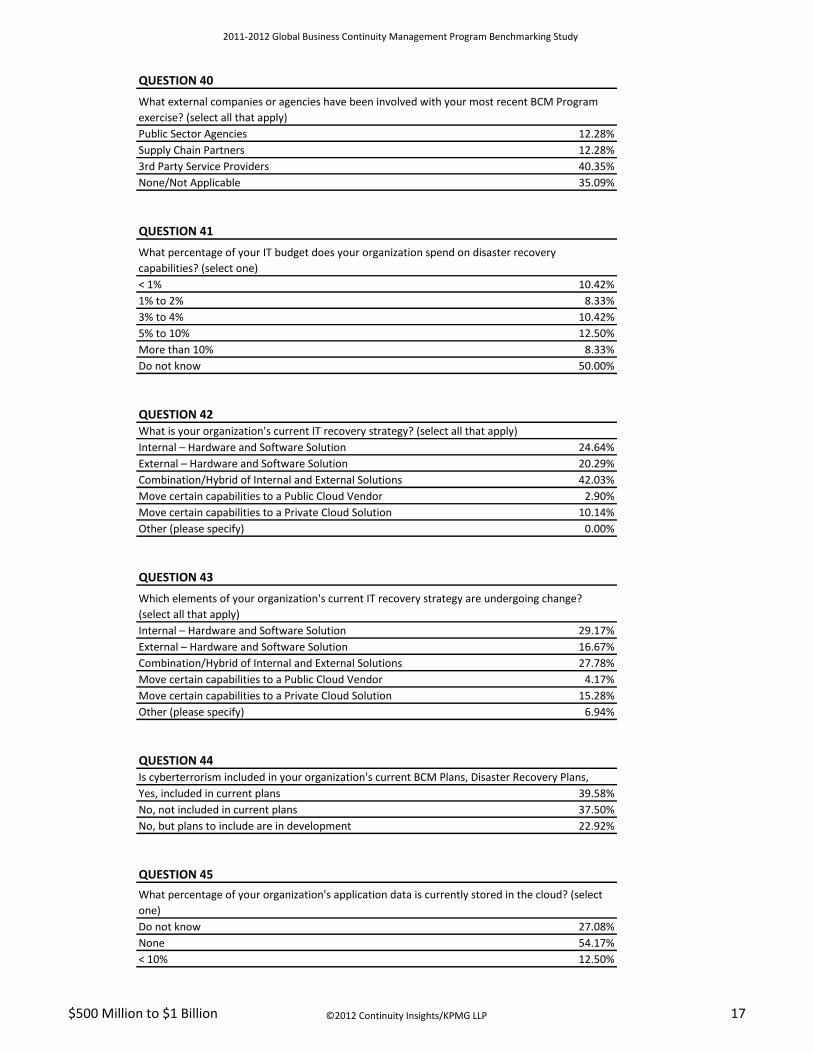
QUESTION 40
Public Sector Agencies 12.28%
Supply Chain Partners 12.28%
3rd Party Service Providers 40.35%
None/Not Applicable 35.09%
QUESTION 41
< 1% 10.42%
1% to 2% 8.33%
3% to 4% 10.42%
5% to 10% 12.50%
More than 10% 8.33%
Do not know 50.00%
QUESTION 42
Internal – Hardware and Software Solution 24.64%
External – Hardware and Software Solution 20.29%
Combination/Hybrid of Internal and External Solutions 42.03%
Move certain capabilities to a Public Cloud Vendor 2.90%
Move certain capabilities to a Private Cloud Solution 10.14%
Other (please specify) 0.00%
QUESTION 43
Internal – Hardware and Software Solution 29.17%
External – Hardware and Software Solution 16.67%
Combination/Hybrid of Internal and External Solutions 27.78%
Move certain capabilities to a Public Cloud Vendor 4.17%
Move certain capabilities to a Private Cloud Solution 15.28%
Other (please specify) 6.94%
QUESTION 44
Yes, included in current plans 39.58%
No, not included in current plans 37.50%
No, but plans to include are in development 22.92%
QUESTION 45
Do not know 27.08%
None 54.17%
< 10% 12.50%
What percentage of your organization's application data is currently stored in the cloud? (select
one)
What external companies or agencies have been involved with your most recent BCM Program
exercise? (select all that apply)
What percentage of your IT budget does your organization spend on disaster recovery
capabilities? (select one)
What is your organization's current IT recovery strategy? (select all that apply)
Which elements of your organization's current IT recovery strategy are undergoing change?
(select all that apply)
Is cyberterrorism included in your organization's current BCM Plans, Disaster Recovery Plans,
$500 Million to $1 Billion ©2012 Continuity Insights/KPMG LLP 17
2011-2012 Global Business Continuity Management Program Benchmarking Study
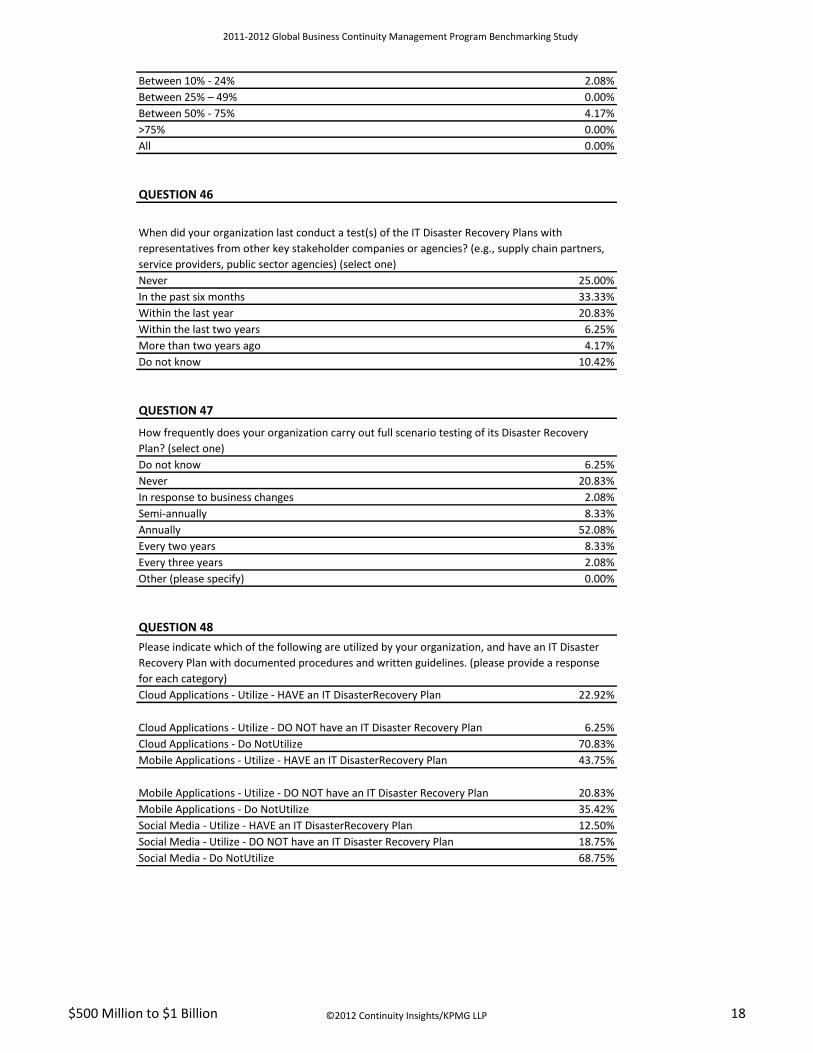
Between 10% - 24% 2.08%
Between 25% – 49% 0.00%
Between 50% - 75% 4.17%
>75% 0.00%
All 0.00%
QUESTION 46
Never 25.00%
In the past six months 33.33%
Within the last year 20.83%
Within the last two years 6.25%
More than two years ago 4.17%
Do not know 10.42%
QUESTION 47
Do not know 6.25%
Never 20.83%
In response to business changes 2.08%
Semi-annually 8.33%
Annually 52.08%
Every two years 8.33%
Every three years 2.08%
Other (please specify) 0.00%
QUESTION 48
Cloud Applications - Utilize - HAVE an IT DisasterRecovery Plan 22.92%
6.25%
Cloud Applications - Do NotUtilize 70.83%
Mobile Applications - Utilize - HAVE an IT DisasterRecovery Plan 43.75%
20.83%
Mobile Applications - Do NotUtilize 35.42%
Social Media - Utilize - HAVE an IT DisasterRecovery Plan 12.50%
Social Media - Utilize - DO NOT have an IT Disaster Recovery Plan 18.75%
Social Media - Do NotUtilize 68.75%
Mobile Applications - Utilize - DO NOT have an IT Disaster Recovery Plan
When did your organization last conduct a test(s) of the IT Disaster Recovery Plans with
representatives from other key stakeholder companies or agencies? (e.g., supply chain partners,
service providers, public sector agencies) (select one)
How frequently does your organization carry out full scenario testing of its Disaster Recovery
Plan? (select one)
Please indicate which of the following are utilized by your organization, and have an IT Disaster
Recovery Plan with documented procedures and written guidelines. (please provide a response
for each category)
Cloud Applications - Utilize - DO NOT have an IT Disaster Recovery Plan
$500 Million to $1 Billion ©2012 Continuity Insights/KPMG LLP 18
2011-2012 Global Business Continuity Management Program Benchmarking Study
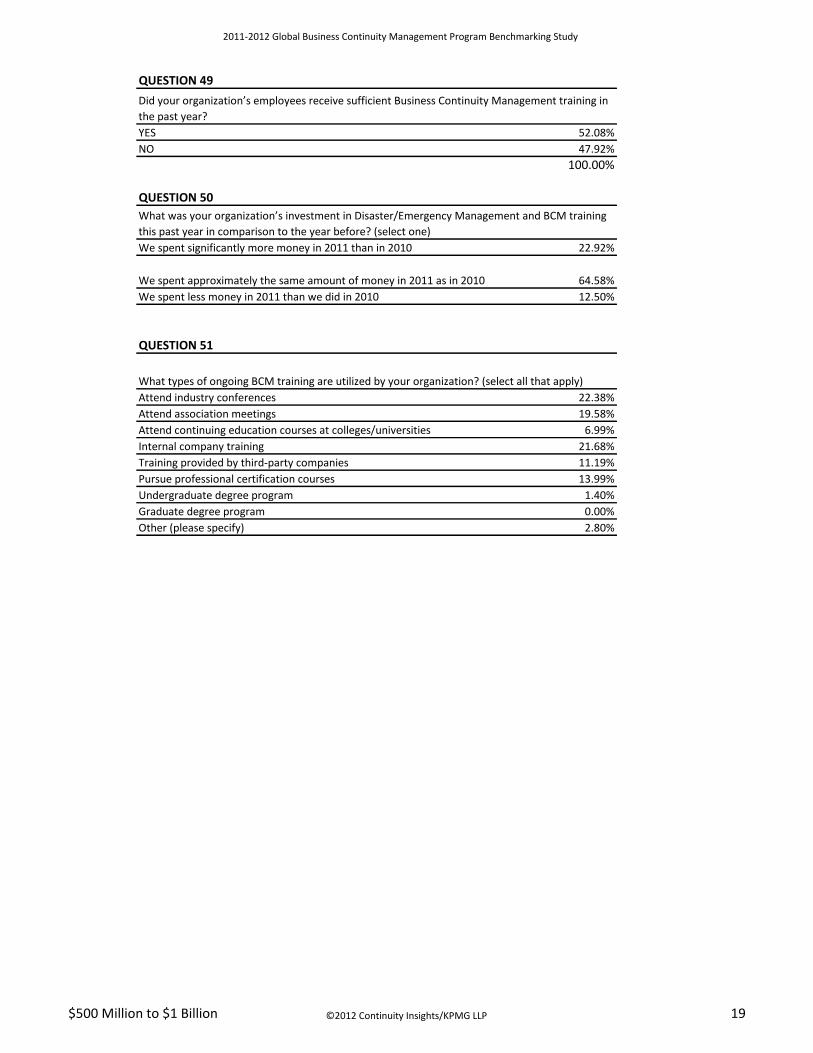
QUESTION 49
YES 52.08%
NO 47.92%
100.00%
QUESTION 50
We spent significantly more money in 2011 than in 2010 22.92%
64.58%
We spent less money in 2011 than we did in 2010 12.50%
QUESTION 51
Attend industry conferences 22.38%
Attend association meetings 19.58%
Attend continuing education courses at colleges/universities 6.99%
Internal company training 21.68%
Training provided by third-party companies 11.19%
Pursue professional certification courses 13.99%
Undergraduate degree program 1.40%
Graduate degree program 0.00%
Other (please specify) 2.80%
Did your organization’s employees receive sufficient Business Continuity Management training in
the past year?
What was your organization’s investment in Disaster/Emergency Management and BCM training
this past year in comparison to the year before? (select one)
What types of ongoing BCM training are utilized by your organization? (select all that apply)
We spent approximately the same amount of money in 2011 as in 2010
$500 Million to $1 Billion ©2012 Continuity Insights/KPMG LLP 19