continuous dynamic in retail service revenues fuelling
TRANSCRIPT

Press release
Embargo until February 6, 2020 at 7:00 am
Regulated information
Financial information for the fourth quarter and full year 2019
Continuous dynamic in retail service revenues fuelling solid EBITDAaL growth
Mobile postpaid customer base +4.5% yoy on quarterly net-adds of 31k
Convergence customer base +43.5% yoy on quarterly net-adds of 25k
Q4 Revenues1: +4.8% yoy / Retail service revenues1: +6.5% yoy
Q4 EBITDAaL1 +5.5% yoy
Results of 2019 within the upper range of guidance
Proposed dividend increase by €0.10 to €0.60 per share
Belgium Q4’19 operating highlights
Bold challenger positioning drives operating and financial performance. Orange Belgium has been delivering consistent
messages around improving value proposition, offering simple and generous tariffs, with no bad surprises and no price
increase (which will continue in 2020).
Mobile postpaid customer base continues its steady growth up to 2.6m (+4.5% yoy) with net-adds of 31k subscribers
during the quarter despite sustained competition.
Record convergent net-adds since the launch of Love (+25k). Gross adds increased thanks to Love Duo already
representing 10% of the customer base. At the end of the quarter, convergent mobile subscribers represented 15.9% of
mobile postpaid customers (Q4’18: 11.5%).
Mobile-only postpaid ARPO decreased slightly by 1.6% yoy as a result of lower out-of-bundle revenues due to regulation
on intra-EU calls. Increase in access revenues continues to mitigate remaining decrease in out-of-bundle revenues as a
result of migration towards simple abundant tariff plans.
B2C convergent ARPO increased slightly by 1.6% yoy, despite growing share of Love Duo with a lower retail price.
Orange Belgium: key operating figures Q4 2018 Q4 2019 change
Mobile postpaid customer base (in ‘000) 2,469 2,579 4.5%
Net adds (in ‘000) 61 31 -49.8%
Mobile only postpaid ARPO (€ per month) 20.8 20.4 -1.6%
Convergent customer base (in ‘000) 180 258 43.5%
Net adds (in ‘000) 25 25 1.6%
B2C convergent ARPO (€ per month) 75.5 76.7 1.6%
Convergent mobile customer as % mobile contract customer base 11.5% 15.9% 445 bp
Q4’19 consolidated financial highlights
Revenues reached €369.5m, +4.8% yoy1 mainly driven by higher retail service revenues (+6.5% yoy1) and equipment
sales (+32.9% yoy), despite lower MVNO revenues (-€6.0m). Retail service revenues increase is supported by growing
convergent service revenues (+47.7% yoy) and equipment sales growth as a result of successful end-of-year offers
driving customer loyalty.
EBITDAaL increased by 5.5% yoy1 to €79.6m despite -€14.0m yoy effects (MVNO revenues, EU regulation, and brand
fees). This strong performance was driven by higher retail service revenues, continuous improvements in the cable
operations and cost efficiencies. The full-year EBITDAaL reached the upper range of the 2019 guidance at €300.1m with
a margin improvement of 38bp. Orange Belgium started to benefit from its transformation plan, initiated in 2019 to
improve its operational model.
Orange Belgium continues to improve its cable financials. The business generated a positive EBITDAaL of €3.3m in
Q4’19. The FY 2019 cable operating cash flow improved by €28.4m yoy but remains negative at -€31.7m.
FY 2019 eCapex remained stable at €180.2m.
FY 2019 Operating cash flow increased by 13.2% yoy, reducing net financial debt by €36.4m reaching €234.3m at 0.8x
reported EBITDAaL.
Orange Belgium Group: key financial figures
reported comparable1 comparable reported reported comparable comparable reported
in €m Q4 2018 Q4 2018 Q4
2019 change change FY 2018 FY 2018
FY
2019 change change
Revenues 342.2 352.5 369.5 4.8% 8.0% 1,279.8 1,298.1 1,340.8 3.3% 4.8%
Retail service revenues 199.3 209.2 222.8 6.5% 11.8% 768.4 786.3 857.3 9.0% 11.6%
EBITDAaL
75.5 79.6 5.5%
285.6 300.1 5.1%
margin as % of
revenues 21.4% 21.5% 14 bp
22.0% 22.4% 38 bp
eCapex
-69.2 -61.1 -11.7%
-179.7 -180.2 0.3%
Operating cash flow2
6.3 18.6 194.2%
106.0 120.0 13.2%
Net financial debt 264.3 270.7 234.3 -13.5% -11.4% 264.3 270.7 234.3 -13.5% -11.4%
1. Comparable base includes the impact from IFRS 16 implementation and BKM consolidation
2. Operating cash flow defined as EBITDAaL – eCapex

Michaël Trabbia, Chief Executive Officer, commented:
In 2019 we further built upon our Bold challenger positioning initiated in 2018, based on simple, generous and worry-free
tariffs. We remained true to our promises towards our customers with no price increases, no bad surprises and no need to
pay for unneeded services.
In the second quarter, we extended our unlimited data tariff plans for use throughout the EU and made MMS free of
charge. In the third quarter we launched our Love Duo offer. Lastly, in the fourth quarter we boosted the data allowance of
our Cheetah offer from 8GB to 15GB for the same price, and we reached an exclusive partnership for the launch of Google
Nest in Belgium.
This positioning contributed to solid commercial results in 2019, despite more active competition in the second half of the
year. Our convergent customer base increased by 43% yoy and now exceeds 250,000. Love Duo proved to meet a real
customer expectation and was a key contributor to this success, as it already accounts for 10% of our convergent
customer base, a few months after launch.
2019 saw other major structural achievements. The mobile access network sharing agreement with Proximus will allow us
to improve customer experience, to decrease energy consumption and to be ready to accelerate 5G roll out, when the
spectrum is allocated. We expect the joint venture to be put in place in the course of 2020, after the decision from the
Belgian Competition Authority.
On the B2B market, the acquisition of BKM, a recognized UC&C Belgium player, will be a key asset to enable us to extend
our offers and better meet to enterprises demand.
With those achievements and no more major headwinds ahead, we are confident in our ability to further drive substantial
EBITDAaL growth in 2020.
Arnaud Castille, Chief Financial Officer, stated:
The realisations of the last quarter of 2019 have enabled us to achieve our ambitions both from a commercial and financial
perspective.
From a financial perspective, both revenues and EBITDAaL continued to grow during this quarter. Despite headwinds, we
were able to improve our EBITDAaL both in absolute and in relative terms in comparison to 2018 and to deliver an
EBITDAaL in the upper range of our guidance for 2019. This is a result of our efforts to continuously improve our internal
processes and increase efficiency. In addition to that, we have improved our cost generation in optimizing our working
capital with a significant growth of our free cash flow. A year ago, we launched ‚Bold Inside‛, our transformation plan, to
simplify our offers and the way we work, to digitalize our customer journey and processes and to empower our people. This
plan started to bear its fruits in 2019 and will continue in 2020.
In addition, our convergence activities have been EBITDAaL positive for the third consecutive quarter, with a positive result
for the whole year for the first time since the launch of Love. We will keep working internally to drive operating efficiency as
we strive to improve our cash flow for this business.
2019 dividend
The Board of Directors will propose an increase of the dividend to €0.60 per share for the 2019 financial year at the Annual
General Meeting.
2020 outlook
Orange Belgium expects low-single digit revenue growth in 2020. The Company targets EBITDAaL of between €310m and
€330m. Total eCapex is expected to remain stable excluding the RAN sharing agreement which will have a limited impact
in 2020.
Contents
1. Key highlights ................................................................................................................................................................................................................................. 4
1.1 Operational highlights ............................................................................................................................................................................................................ 4
1.2 Regulatory highlights .............................................................................................................................................................................................................. 4
2. Comments on the financial situation ............................................................................................................................................................................. 6
2.1 Consolidated figures for the Orange Belgium Group ...................................................................................................................................... 6
2.2 Consolidated statement of comprehensive income ......................................................................................................................................... 6
2.3 Liquidity and capital resources ........................................................................................................................................................................................ 8
2.4 Activities of the Orange Belgium Group by segment ....................................................................................................................................... 9
2.4.1. Orange Belgium ................................................................................................................................................................................................................. 9
2.4.2. Orange Communications Luxembourg ............................................................................................................................................................ 10
3. Financial risks and risk management ........................................................................................................................................................................ 11
4. Disputes ........................................................................................................................................................................................................................................... 11
5. Significant event after the end of the fourth quarter of 2019 .................................................................................................................... 12
6. Shareholder remuneration ................................................................................................................................................................................................. 12
7. Outlook ............................................................................................................................................................................................................................................. 12
8. 2020 Financial calendar ........................................................................................................................................................................................................ 13
9. Conference call details ......................................................................................................................................................................................................... 13
10. Shares .......................................................................................................................................................................................................................................... 13
11. Consolidated financial statements ......................................................................................................................................................................... 14
Consolidated statement of comprehensive income ............................................................................................................................................... 14
Consolidated statement of financial position ............................................................................................................................................................. 15
Consolidated cash flow statement ................................................................................................................................................................................... 16
Consolidated statement of changes in equity ............................................................................................................................................................ 17
Segment information ................................................................................................................................................................................................................. 18
12. Statutory auditor’s procedures .................................................................................................................................................................................. 19
13. Glossary ...................................................................................................................................................................................................................................... 20
About Orange Belgium ................................................................................................................................................................................................................... 22

1. Key highlights
1.1 Operational highlights
Orange Belgium increases its data consumption in Cheetah offer without any price increase
Orange Belgium continues to provide peace of mind to its customers through increasing data abundance. As of
November, the Cheetah offer increased from 8GB to 15GB for the same price of €30.
Orange Belgium announces a unique partnership with Google for the launch of the Google Nest Hub and Mini
Orange Belgium was Google’s exclusive telecom partner in Belgium for the launch of its new smart devices and
offered them to new and existing clients at a reduced price. For Orange Belgium, it is important to invest where it
matters to customers: in its network, its offers, but also in new-generation devices that make customers’ lives easier.
And thanks to an exclusive telco partnership, Orange customers can buy the brand new Google devices at an
exceptionally low price of €9 for the Mini and €49 for the Nest Hub.
Orange Belgium Wins Prestigious World Communication Awards for Best Customer Experience
For over two decades the World Communication Awards have recognised innovation and excellence in global
telecoms and continue to be the most revered mark of achievement in the telecom industry. The Customer Experience
award recognized Orange Belgium’s successful engagement with Evolving Systems - for the continued management,
enhancement and expansion of the ‚Orange Thank You‛ customer loyalty programme. With the ‚Orange Thank You‛
programme, the company can better understand its customer needs and preferences on an individual level, in line with
its commitment to deliver an unmatched customer experience.
Orange Belgium and Proximus signed the agreement to establish their mobile access network sharing collaboration
On November 22, 2019, Orange Belgium and Proximus signed the final agreement with the purpose of establishing a
joint venture on mobile access network sharing covering 2G, 3G, 4G and 5G technologies. The agreement is still
subject to a challenge lodged by Telenet with the Competition Authority, which communicated on its decision on
January 10, 2020. The decision provides for an additional 2-month period (until March 16) during which the BIPT can
assess the agreement further. Meanwhile, the parties are allowed to take further preparatory measures.
Orange Belgium is the first to launch a 5G testing hub for business in Belgium: the Orange Industry 4.0 Campus in the
port of Antwerp
Orange Belgium is the first in Belgium to activate a 5G testing hub for business. By creating an open innovation hub,
Orange Belgium will start using the full potential of 5G technology together with industrial partners on real-life
applications. The Port of Antwerp, the chemical company Borealis, the high-tech polymer manufacturer Covestro and
Deloitte Belgium are the first wave of industrial partners to the Orange Industry 4.0 Campus.
Thanks to the 5G testing network deployed on the campus, the partners will benefit from a dedicated connectivity and
guaranteed quality of services required for industrial use. Orange Belgium chose the region around the port of Antwerp
because of its industry and wide variety of testing options.
1.2 Regulatory highlights
Wholesale high quality access market review
On March 29, 2019, the BIPT published a draft analysis of the wholesale high-quality access (essentially leased lines).
On December 17, 2019, the BIPT published a decision confirming the significant market power of Proximus on the
wholesale high quality access market and maintaining its current obligations regarding access, transparency, non-
discrimination and price control. Moreover, BIPT imposed on Proximus the new obligation to provide access to ducts
containing its fibers. Reduced obligations apply in geographical areas where there is sufficient competition.
Revision of Broadband and TV distribution market analysis decisions
By its decision of September 4, 2019, the court of appeal rejected the cable operators’ appeals against the market
analysis decisions of June 2018. The cable operators may still appeal this decision at the Supreme Court.
The BIPT’s market analysis decision of 2018 set out a number of service and operational improvements, of which the
single-installer approach and the possibility to offer fixed broadband without TV services. These improvements were
implemented in July/August 2019.
On July 5, 2019, the BIPT and media regulators published their draft decision on wholesale tariffs for access to cable
networks. Concurrently, the regulators launched a national consultation that ended on September 6, 2019. Orange
Belgium expressed its view that an improved wholesale tariff is required to allow sustainable competition in the fixed
broadband market. The company is pleased that the regulators have confirmed their intention to establish true and fair
competition in the Broadband and TV markets. To establish the ‚fair tariffs‛, implied by the June 2018 market analysis
decision, the regulators have applied the ‚Cost +‛ methodology which should lead to wholesale prices more in line
with the real infrastructure costs.
The consultation closed on September 6th, 2019. Orange Belgium sent its comments, focusing on avoiding unjustified
wholesale price increases and ensuring that the cost base for some cable operators is not overestimated. A final price
decision is now expected in Q2 2020, according to the BIPT’s draft workplan for 2020.
New spectrum allocation, renewal of existing spectrum attributions The Royal Decrees regarding the allocation of the 700, 1400 and 3400-3800 MHz band and the renewal/reallocation
conditions of the 900, 1800 and 2100 MHz bands were not finalised by the previous government. While regional
governments were formed recently, an interim government remains in office until a federal government is formed.

End 2019, the BIPT launched a consultation regarding various spectrum related matters, such as the means for the
BIPT to prolong the 900 MHz, 1800 MHz and 2100 MHz licenses beyond the current expiry date of March 2021, the
proposal to increase the reserve price for the 3.6 GHz spectrum band, and the conditions for private 5G networks in
the 3.8-4.2 GHz band.
At the moment, it is unlikely that an auction for any of the before-mentioned spectrum will be organised before 2021.
Via a communication on January 31, 2020, the BIPT announced an exceptional procedure and call for candidates for
the attribution of temporary licenses in the 3.6-3.8 GHz band. The licenses would expire at the start of the usage
rights of the auctioned spectrum.
2. Comments on the financial situation
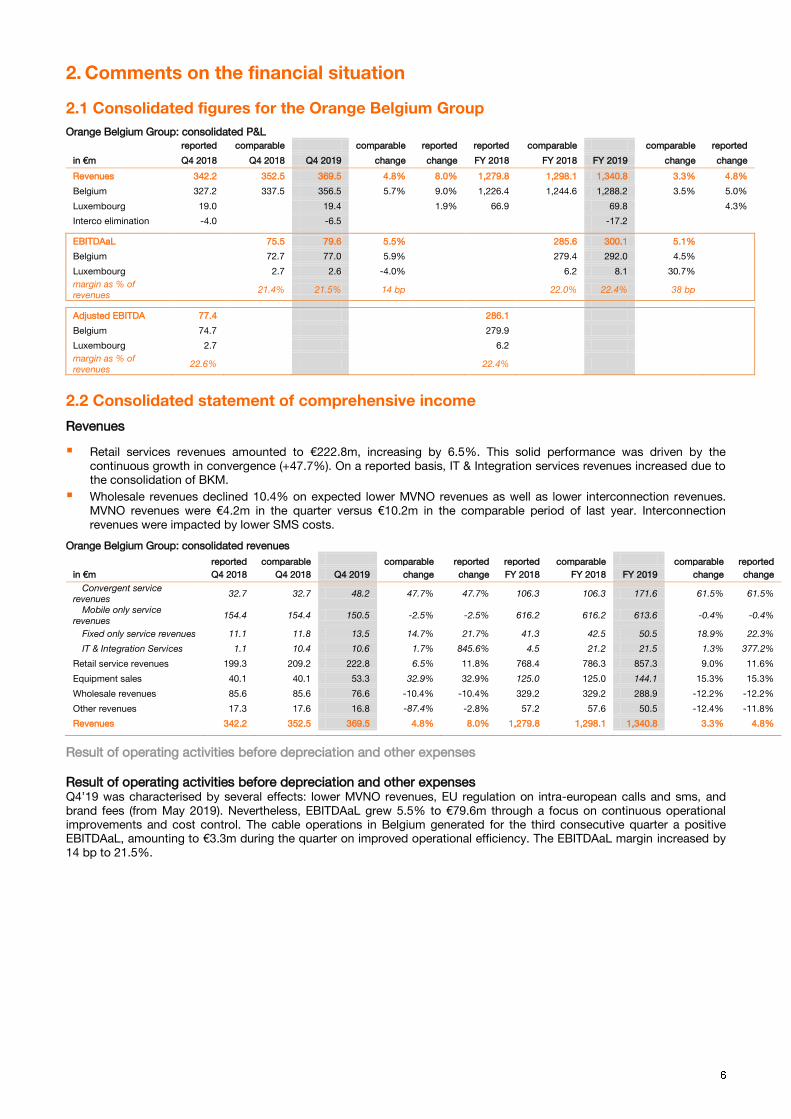
2.1 Consolidated figures for the Orange Belgium Group
Orange Belgium Group: consolidated P&L reported comparable comparable reported reported comparable comparable reported
in €m Q4 2018 Q4 2018 Q4 2019 change change FY 2018 FY 2018 FY 2019 change change
Revenues 342.2 352.5 369.5 4.8% 8.0% 1,279.8 1,298.1 1,340.8 3.3% 4.8%
Belgium 327.2 337.5 356.5 5.7% 9.0% 1,226.4 1,244.6 1,288.2 3.5% 5.0%
Luxembourg 19.0 19.4 1.9% 66.9 69.8 4.3%
Interco elimination -4.0 -6.5 -17.2
EBITDAaL 75.5 79.6 5.5% 285.6 300.1 5.1%
Belgium
72.7 77.0 5.9%
279.4 292.0 4.5%
Luxembourg
2.7 2.6 -4.0%
6.2 8.1 30.7%
margin as % of
revenues 21.4% 21.5% 14 bp 22.0% 22.4% 38 bp
Adjusted EBITDA 77.4 286.1
Belgium 74.7
279.9
Luxembourg 2.7
6.2
margin as % of
revenues 22.6% 22.4%
2.2 Consolidated statement of comprehensive income
Revenues
Retail services revenues amounted to €222.8m, increasing by 6.5%. This solid performance was driven by the
continuous growth in convergence (+47.7%). On a reported basis, IT & Integration services revenues increased due to
the consolidation of BKM.
Wholesale revenues declined 10.4% on expected lower MVNO revenues as well as lower interconnection revenues.
MVNO revenues were €4.2m in the quarter versus €10.2m in the comparable period of last year. Interconnection
revenues were impacted by lower SMS costs.
Orange Belgium Group: consolidated revenues
reported comparable comparable reported reported comparable comparable reported
in €m Q4 2018 Q4 2018 Q4 2019 change change FY 2018 FY 2018 FY 2019 change change
Convergent service
revenues 32.7 32.7 48.2 47.7% 47.7% 106.3 106.3 171.6 61.5% 61.5%
Mobile only service
revenues 154.4 154.4 150.5 -2.5% -2.5% 616.2 616.2 613.6 -0.4% -0.4%
Fixed only service revenues 11.1 11.8 13.5 14.7% 21.7% 41.3 42.5 50.5 18.9% 22.3%
IT & Integration Services 1.1 10.4 10.6 1.7% 845.6% 4.5 21.2 21.5 1.3% 377.2%
Retail service revenues 199.3 209.2 222.8 6.5% 11.8% 768.4 786.3 857.3 9.0% 11.6%
Equipment sales 40.1 40.1 53.3 32.9% 32.9% 125.0 125.0 144.1 15.3% 15.3%
Wholesale revenues 85.6 85.6 76.6 -10.4% -10.4% 329.2 329.2 288.9 -12.2% -12.2%
Other revenues 17.3 17.6 16.8 -87.4% -2.8% 57.2 57.6 50.5 -12.4% -11.8%
Revenues 342.2 352.5 369.5 4.8% 8.0% 1,279.8 1,298.1 1,340.8 3.3% 4.8%
Result of operating activities before depreciation and other expenses
Result of operating activities before depreciation and other expenses Q4’19 was characterised by several effects: lower MVNO revenues, EU regulation on intra-european calls and sms, and
brand fees (from May 2019). Nevertheless, EBITDAaL grew 5.5% to €79.6m through a focus on continuous operational
improvements and cost control. The cable operations in Belgium generated for the third consecutive quarter a positive
EBITDAaL, amounting to €3.3m during the quarter on improved operational efficiency. The EBITDAaL margin increased by
14 bp to 21.5%.
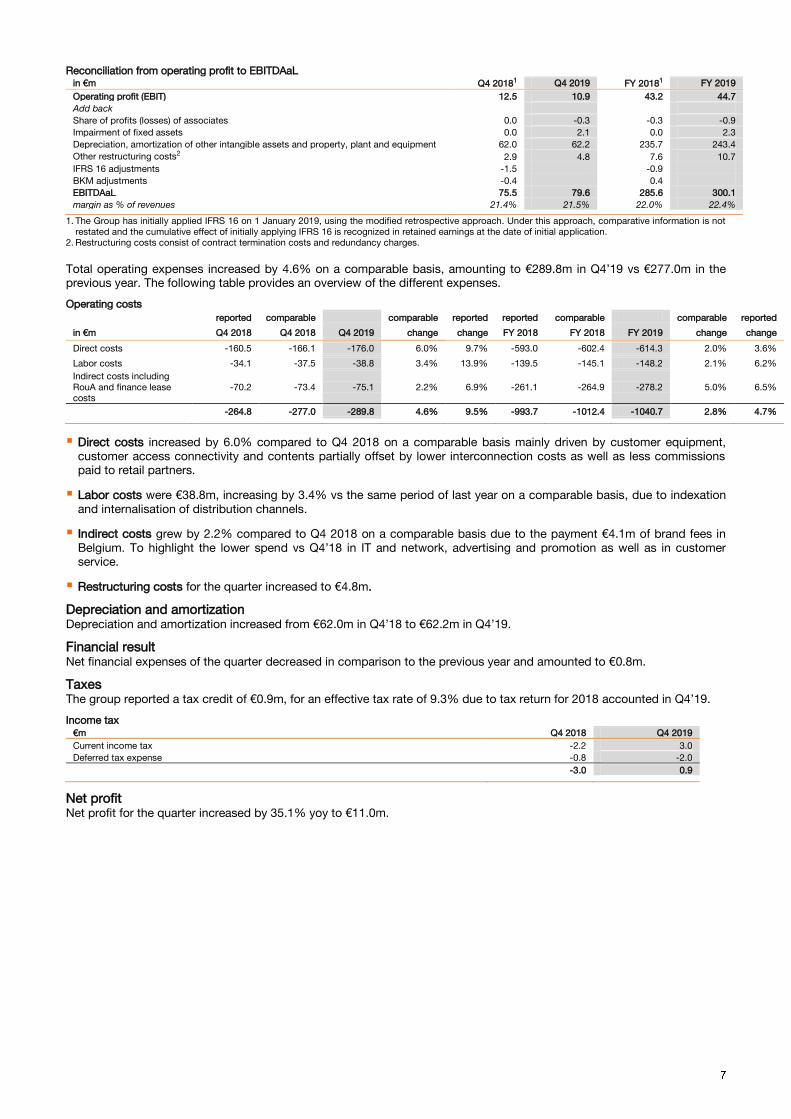
Reconciliation from operating profit to EBITDAaL in €m Q4 20181 Q4 2019 FY 20181 FY 2019
Operating profit (EBIT) 12.5 10.9 43.2 44.7
Add back
Share of profits (losses) of associates 0.0 -0.3 -0.3 -0.9
Impairment of fixed assets 0.0 2.1 0.0 2.3
Depreciation, amortization of other intangible assets and property, plant and equipment 62.0 62.2 235.7 243.4
Other restructuring costs2 2.9 4.8 7.6 10.7
IFRS 16 adjustments -1.5 -0.9
BKM adjustments -0.4 0.4
EBITDAaL 75.5 79.6 285.6 300.1
margin as % of revenues 21.4% 21.5% 22.0% 22.4%
1. The Group has initially applied IFRS 16 on 1 January 2019, using the modified retrospective approach. Under this approach, comparative information is not
restated and the cumulative effect of initially applying IFRS 16 is recognized in retained earnings at the date of initial application.
2. Restructuring costs consist of contract termination costs and redundancy charges.
Total operating expenses increased by 4.6% on a comparable basis, amounting to €289.8m in Q4’19 vs €277.0m in the
previous year. The following table provides an overview of the different expenses.
Operating costs
reported comparable comparable reported reported comparable comparable reported
in €m Q4 2018 Q4 2018 Q4 2019 change change FY 2018 FY 2018 FY 2019 change change
Direct costs -160.5 -166.1 -176.0 6.0% 9.7% -593.0 -602.4 -614.3 2.0% 3.6%
Labor costs -34.1 -37.5 -38.8 3.4% 13.9% -139.5 -145.1 -148.2 2.1% 6.2%
Indirect costs including
RouA and finance lease
costs
-70.2 -73.4 -75.1 2.2% 6.9% -261.1 -264.9 -278.2 5.0% 6.5%
-264.8 -277.0 -289.8 4.6% 9.5% -993.7 -1012.4 -1040.7 2.8% 4.7%
Direct costs increased by 6.0% compared to Q4 2018 on a comparable basis mainly driven by customer equipment,
customer access connectivity and contents partially offset by lower interconnection costs as well as less commissions
paid to retail partners.
Labor costs were €38.8m, increasing by 3.4% vs the same period of last year on a comparable basis, due to indexation
and internalisation of distribution channels.
Indirect costs grew by 2.2% compared to Q4 2018 on a comparable basis due to the payment €4.1m of brand fees in
Belgium. To highlight the lower spend vs Q4’18 in IT and network, advertising and promotion as well as in customer
service.
Restructuring costs for the quarter increased to €4.8m.
Depreciation and amortization Depreciation and amortization increased from €62.0m in Q4’18 to €62.2m in Q4’19.
Financial result Net financial expenses of the quarter decreased in comparison to the previous year and amounted to €0.8m.
Taxes The group reported a tax credit of €0.9m, for an effective tax rate of 9.3% due to tax return for 2018 accounted in Q4’19.
Income tax
€m Q4 2018 Q4 2019
Current income tax -2.2 3.0
Deferred tax expense -0.8 -2.0
-3.0 0.9
Net profit Net profit for the quarter increased by 35.1% yoy to €11.0m.

2.3 Liquidity and capital resources
The Group uses Operating cash flow and Organic cash flow as the main metrics for analysing cash generation. Operating
cash flow is defined as EBITDAaL less eCapex. Organic cash flow measures the net cash provided by operating activities
less eCapex.
Operating cash flow increased from €8.4m to €18.6m in comparison to Q4’18, due to lower eCapex.
Operating cash flow
in €m Q4 2018 Q4 2019 FY 2018 FY 2019
EBITDAaL 79.6 300.1
ECapex
-61.1
-180.2
Operating cash flow
18.6
120.0
Adjusted EBITDA 77.4 286.1
Capex -69.0 -179.4
Operating cash flow 8.4 106.7
Organic cash flow increased to €13.0m in Q4’19.
Reconciliation to organic cash flow in €m Q4 2018 Q4 2019 FY 2018 FY 2019
Net cash provided by operating activities 35.9 67.1 261.4 339.7
eCapex -69.0 -61.1 -179.4 -180.2
Increase (decrease) in fixed assets payables 19.1 19.7 -1.4 -0.4
Repayment of lease liabilities 0.0 -12.8 0.0 -46.7
Organic cash flow -14.1 13.0 80.6 112.4
Net debt was €234.3m at quarter-end. Gearing, as measured by the net debt/reported EBITDAaL ratio, resulted in 0.8x.
Net debt
€m, period ended 31.12.2018 31.12.2019
Cash & cash equivalents
Cash -6.7 -1.9
Cash equivalents -19.9 -18.3
-26.6 -20.2
Financial liabilities
Intra-group long term loan 269.9 245.0
Intra-group short term loan 20.8 9.4
Third-party short term loan -2.6 -1.7
Derivatives (net) 2.8 1.8
290.9 254.5
Net debt 264.3 234.3
Net debt/Reported EBITDAaL N/M 0.8
Net debt/Reported EBITDA 0.9 N/M

2.4 Activities of the Orange Belgium Group by segment
The following gives a breakdown of Orange Belgium Group’s activities in greater detail:
2.4.1. Orange Belgium
Operating review
During the last quarter of 2019, Orange Belgium’s convergent customer base continued to grow with net-adds of 25k,
resulting in 258k Love customers. B2C customers represent 90% of convergence subscriber base, totalling 231k
customers. B2B convergent customers increased to 27k. The billing of set-up fees has not stunted demand for Orange’s
convergence products. An increasing number of postpaid mobile subscribers are becoming convergent, the proportion
grew from 11.5% in Q4’18 to 15.9% at the end of 2019.
The B2C convergent ARPO increased by 1.6% to €76.7 due to set-up fees and additional options (mainly fixed line option).
Orange Belgium: convergent services operating figures (in ‘000s, unless otherwise indicated)
Convergent KPIs
Q4 2018 Q4 2019 change Q4 2018 Q4 2019
Convergent customer base
Net-adds
B2C convergent customer base 162 231 42.6% B2C convergent customer base 22 22
B2B convergent customer base 18 27 51.8% B2B convergent customer base 3 3
180 258 43.5%
25 25
ARPO (in € per month)
B2C convergent 75.5 76.7 1.6%
Orange Belgium ended the quarter with 2.6m mobile postpaid customers and net-adds of 31k.
Mobile-only Postpaid ARPO decreased by 1.6% yoy to €20.4 due to the regulation on intra-EU calls. The company
continued to benefit from the migration towards simple abundant tariff plans which shrink out-of-bundle revenues while
increasing access revenues.
Orange Belgium: mobile services operating figures (in ‘000s, unless otherwise indicated)
Mobile KPIs
Q4 2018 Q4 2019 change Q4 2018 Q4 2019
Mobile customers
Net-adds
B2C convergent 244 352 44.4% B2C convergent 34 33
B2B convergent 40 59 48.8% B2B convergent 7 6
Mobile only 2,185 2,168 -0.8% Mobile only 20 -9
Postpaid 2,469 2,579 4.5% Postpaid 61 31
Prepaid 567 532 -6.2% Prepaid -10 -21
M2M 1,114 1,381 24.0% M2M 58 75
4,149 4,491 8.2%
110 85
MVNO customers 12 323
0 2
Mobile only ARPO (€ per month)
Blended 18.0 17.8 -1.0%
Postpaid (mobile-only) 20.8 20.4 -1.6%
Prepaid 7.1 6.9 -3.4%
Financial review
Revenues grew by 5.7% yoy to €356.5m on sustained retail services revenue growth in (+7.4% yoy) and in particular
convergent service revenues. The latter increased by 47.7% yoy and highlights the attractiveness of the Love offer.
Wholesale revenues decreased by 11.7% yoy due to lower MVNO revenues and lower interconnection revenues. MVNO
revenues declined from €10.2m in Q4’18 to €4.2m in Q4’19. Equipment sales increased by 31.3% as a result of successful
end-of- year offers.

Orange Belgium: key financial figures reported comparable comparable reported reported comparable comparable reported
in €m Q4 2018 Q4 2018 Q4 2019 change change FY 2018 FY 2018 FY
2019 change change
Convergent service
revenues 32,7 32,7 48,2 47,7% 47,7% 106,3 106,3 171,6 61,5% 61,5%
Mobile only service
revenues 145,8 145,8 143,0 -1,9% -1,9% 583,3 583,3 579,6 -0,6% -0,6%
Fixed only service
revenues 8,9 9,5 11,2 17,6% 26,5% 33,6 34,7 41,6 19,7% 23,9%
IT & Integration services 1,1 10,4 10,6 1,7% 845,6% 4,5 21,2 21,5 1,3% 377,2%
Retail service revenues 188,4 198,4 213,1 7,4% 13,1% 727,6 745,5 814,3 9,2% 11,9%
Equipment sales 36,2 36,2 47,5 31,3% 31,3% 110,4 110,4 129,8 17,6% 17,6%
Wholesale revenues 83,0 83,0 73,3 -11,7% -11,7% 322,6 322,6 279,9 -13,2% -13,2%
Other revenues 19,6 20,0 22,7 13,6% 15,8% 65,7 66,1 64,2 -2,8% -2,3%
Revenues 327,2 337,5 356,5 5,7% 9,0% 1.226,4 1.244,6 1.288,2 3,5% 5,0%
EBITDAaL 72,7 77,0 5,9% 279,4 292,0 4,5%
margin as % of revenues 22,2% 21,6% -64 bp 22,5% 22,7% 22 bp
Adjusted EBITDA 74,7
279,9
margin as % of revenues 22,8%
22,8%
EBITDAaL grew by 5.9% to €77.0m despite lower MVNO revenues. The improvement was driven by higher retail service
revenues, sustained efficiencies as well as continuous improvements in the cable operations. The latter generated a
positive EBITDAaL of €3.3m during the quarter on improved operational efficiency and increased ARPO.
2.4.2. Orange Communications Luxembourg
Operating review
Orange Luxembourg delivered good EoY commercial results, especially on handsets, accessories and on its BeUnlimited
offer, despite communication efforts of other providers. In addition, operators continue to heavily discount broadband
plans.
At the end of the quarter, Orange Luxembourg’s mobile subscriber base grew 3.3% to 199k in comparison to Q4’18.
Orange Communications Luxembourg: mobile services operating figures (in ‘000s, unless otherwise indicated)
Mobile KPIs
Q4 2018 Q4 2019 change Q4 2018 Q4 2019
Mobile customers Net-adds
Postpaid 110 114 3.9% Postpaid -1 1
Prepaid 12 14 9.9% Prepaid 0 -1
M2M 71 71 1.1% M2M -1 1
Mobile customers 193 199 3.3% 1 0
MVNO customers 2 3 13.7% 0 0
Financial review
Q4 revenues increased by 1.9% yoy to €19.4m mainly because of higher equipment revenues, and with 4.3% FY 2019 to
reach €69.8m
EBITDAaL Q4 decreased by 4.0% yoy to €2.6m but increase by 30.7% FY 2019 to reach €8.1m.
Orange Communications Luxembourg: key financial figures
reported comparable comparable reported reported comparable comparable reported
in €m Q4 2018 Q4 2018 Q4 2019 change change FY 2018 FY 2018 FY 2019 change change
Mobile only
service revenues 8.6 7.5
-13.7% 33.0 34.0
3.1%
Fixed only service
revenues 2.2 2.3
2.3% 7.8 9.0
15.3%
Retail service
revenues 10.8 9.7
-10.5% 40.7 43.0
5.4%
Equipment sales 3.9 5.8
47.4% 14.6 14.3
-1.8%
Wholesale revenues 3.8 3.9
2.5% 10.7 12.3
15.1%
Other revenues 0.5 0.0
-99.8% 0.9 0.2
-75.7%
Revenues 19.0 19.4
1.9% 66.9 69.8
4.3%
EBITDAaL 2.7 2.6 -4.0% 6.2 8.1 30.7%
margin as % of
revenues 14.4% 13.6% -84 bp 9.3% 11.6% 235 bp
Adjusted EBITDA 2.7
6.2
margin as % of
revenues 14.4%
9.3%
3. Financial risks and risk management There were no changes to the information disclosed on p.73-74 and p.116-117 in the 2018 annual report.
4. Disputes
Telecom masts Since 1997, certain municipalities and four provinces have adopted local taxes, on an annual basis, on pylons, masts or
antennas erected within their boundaries. Orange Belgium continues to file fiscal objections against each tax assessment
notice received concerning these taxes. These taxes are currently being contested in Civil Courts (Courts of First Instance -
Tax Chamber and Courts of Appeal).
On 22 December 2016, the three mobile operators concluded an agreement in principle with the Walloon government on
the issue of taxing mobile infrastructure in the Walloon region for the period 2016-2019 and agreed to settle the dispute on
the Walloon regional taxes for 2014.
Over a 4 year period (2016-2019), Orange Belgium commits to pay €16.1m and to invest €20m on incremental telecom
infrastructure in the Walloon region. In return, the Walloon Region commits to: i) no longer levy taxes on telecom
infrastructure; ii) implement a legislative, regulatory and administrative framework designed to facilitate the deployment of
such infrastructure; and iii) discourage municipalities and provinces from taxing telecom infrastructure. In 2018 and 2019,
several Walloon municipalities and provinces levied taxes on telecom infrastructure.
The operators are entitled to deduct such local taxes levied in 2016-2019 by Walloon municipalities or provinces from the
2019 settlement and investment amounts.
Regulation of broadband and TV-distribution Mid-2011 the telecom and media regulators decided to impose access obligations on the cable operators, i.e. the resale of
analogue TV, the access to digital TV platform and the resale of broadband in combination with TV. The cable operators
attacked these decisions before the Court of appeal of Brussels (now: the Marketcourt) which dismissed these appeals. In
December 2015 Telenet and Coditel/AIESH launched a cassation appeal against these judgments. Coditel/AIESH’s appeal
was rejected in April 2017. On 26 April 2018 the Supreme Court rejected Telenet’s appeal and confirmed definitively the
2011 decision.
On 29 June 2018 the telecom and media regulators (CRC) adopted new decisions on the broadband and broadcast
markets which maintain the access obligations on the historical operators of fixed networks, among which the cable
operators, Telenet, Nethys and Brutélé. The decisions imply additional obligations compared to the ones imposed in the
2011 decision and foresee a reduction of the applicable wholesale charges. Telenet attacked the observations of the EC on
the draft decision before the General Court of the European Union. The cable operators also attacked the market analysis
decisions before the Marketcourt of Brussels. Orange Belgium intervenes in the national proceedings to support the CRC
decisions. On 3 October 2018 the Marketcourt delivered an intermediary judgment deciding to put the national proceedings
on hold until the judgment of the European Court while reserving its decision on maintaining or suspending the decisions in
the intermediate period. A few weeks later Telenet withdrew the appeal at EU level. On 30 January 2019 the Marketcourt
rejected the claim of Telenet, Nethys and Brutélé to suspend the decisions during the intermediate period. The appeal on
the merits was also rejected by the Marketcourt on September 4th 2019.
It cannot be excluded yet that one of the cable operators will introduce an appeal against the judgment of the Marketcourt
at the Supreme Court.
Access to Coditel Brabant (Telenet) ’s cable network After Orange Belgium paid the provision for the cable wholesale access set-up fees, Coditel Brabant (Telenet) failed to
provide such access within the regulatory 6-month period. This, in combination with the lack of progress on the
development of an effective wholesale service, prompted Orange Belgium to initiate legal action against Coditel/Telenet for
breach of its regulatory obligations end of December 2016. Taking the implementation of a technical solution was still
ongoing beginning 2018, the proceedings were put on hold. The case is reactivated and Telenet is to submit briefs by early
March 2020.
Access to Telenet’s cable network – own channel Based on the decisions on regulated access to the cable networks Orange Belgium is entitled to offer ‚own channels‛ to its
retail TV customers, i.e. channels that are not commercially offered by the cable operators. While VOO provided such own
channel (Eleven Sports 3) on its network, Telenet refused to offer such access at reasonable conditions. Beginning 2018,
Orange Belgium initiated proceedings against Telenet for breach of its regulatory obligations before the Commercial Court
of Antwerp. On 30 May 2018 the Commercial Court of Antwerp dismissed Orange Belgium’s claim.
Orange Belgium appealed this judgment. On April 11, 2019 the Court of appeal found Telenet in breach of its regulatory
obligations as well as guilty of abusing its dominant position. The Court ordered Telenet to provide reasonable conditions
within one month subject to penalty payment of 2500€/day afterwards. Telenet appealed the decision of the Court of
Appeal at the Supreme Court. Orange Belgium issued a claim of 250.000€ (total amount of the penalty) against Telenet for
non-compliance with the decision of the Court of Appeal. This claim is attacked by Telenet with the attachment judge. The
pleadings take place on April 9th, 2020.
Access to Telenet’s cable network – own internet profile Under the regulation of the access to the cable networks alternative operators have the right to commercialize internet
profiles that are not commercialized by the regulated cable operator (‚own internet profiles‛), i.e. an internet profile with
different upload/download speeds and/or volumes than the internet speeds and/or volumes offered by the cable operator
to its own retail clients. Despite several requests made by Orange Belgium to Telenet since 2015, Telenet refused to grant
such own profile until May 2018. In view of the damages incurred by Orange Belgium linked to the refusals, Orange
Belgium filed a formal complaint against Telenet with the regulator in February 2018. On 22 October 2018 the regulator
published its decision finding Telenet in breach with its regulatory obligation for not providing a own profile to Orange
Belgium. Orange Belgium sent a formal notice to Telenet in January 2019 requesting a compensation for the damages
incurred. Facing the refusal of Telenet to pay damages, Orange Belgium introduced a damage claim before the Enterprise
Court. The pleadings took place on January 17th 2020. The Enterprise Court’s judgment is expected by the middle of
February 2020.
Lycamobile On 19 February 2016, Lycamobile Belgium Limited and Lycamobile BVBA initiated legal proceedings against Orange
Belgium (previously Mobistar) before the Brussels Commercial Court claiming damages for the alleged belated commercial
launch of Lycamobile’s 4G services. The case was heard on 10 March 2017. By judgement on 12 May 2017, the Brussels
Commercial Court dismissed the claim and ordered Lycamobile to pay Orange Belgium €18,000 as compensation for
procedural costs. The judgement was served on 3 July 2017 and Lycamobile paid the full amount. On 11 August 2017,
Lycamobile filed an appeal before the Brussels Court of Appeal. An introductory hearing took place on 21 September 2017
and a calendar for the filing of trial briefs was set. Parties have exchanged trial briefs. No pleading date has been set.
Euphony Benelux NV in bankruptcy On 2 April 2015, Orange Belgium was summoned by the receivers of Euphony Benelux NV to a hearing on 17 April 2015 at
the Brussels Commercial Court. The bankruptcy receivers claim that Orange Belgium should pay a provisional amount of
one (1) euro for overdue commissions as well as an eviction fee. In this context, the bankruptcy receivers claim that Orange
Belgium should submit all relevant documents to allow the bankruptcy receivers to calculate the amounts claimed.
On 17 April 2018, the Court dismissed the claim relating to the eviction fee and appointed an expert for the claim relating to
the overdue commissions. Orange Belgium has filed an appeal at the Brussels Court of Appeals. An introductory hearing
took place and the Court of Appeals has set a calendar for the filing of trial briefs. Parties have exchanged trial briefs. No
pleading date has been set.
Fixed Termination Rates (FTR) – 3Starsnet On November 20, 2018, the BIPT adopted a new FTR decision. 3Starsnet attempted to get the decision annulled via the
Market Court but this was rejected. 3Starsnet has turned to the Supreme Court to get the decisions of the Market Court
annulled. Orange Belgium intervenes in the procedures to defend the BIPT position.
5. Significant event after the end of the fourth quarter of 2019 The Belgian Competition Authority has decided to suspend until 16 March 2020 the execution of the mobile network
sharing agreement in order to grant additional time to BIPT to assess the latest changes on the provisions of the
agreement and to ascertain that the commitments taken are adhered to. During this period of time, Orange Belgium and
Proximus are still authorized to initiate preparatory measures. The Belgium Competition Authority acknowledges the
benefits of the agreement and rejects the request from Telenet to suspend the cooperation until a final decision on the
merits. In parallel, the investigation on the merits of the case started.
6. Shareholder remuneration The Orange Belgium Group aims to balance the appropriate cash returns to equity holders with the requirement of
maintaining a balanced and sound financial position, while leaving sufficient leeway to continue to invest in its convergent
strategy and building out of its network and other growth opportunities.
Considering the financial and commercial performance of 2019 and the mid-term outlook, the Board of Directors will
propose the Annual General Meeting of Shareholders on 6 May 2020 to distribute a gross ordinary dividend for the financial
year 2019 of 0.60 euro per share. If approved, the payment of the gross ordinary dividend of 0.60 euro will be done on 14
May 2020 (ex-dividend date 12 May 2020; record date 13 May 2020).
7. Outlook Orange Belgium expects low-single digit revenue growth in 2020 taking into account further uptake on its postpaid and
convergent customer base.
For 2020, the Company expects EBITDAaL between €310m and €330m. This range takes into account:
a smaller amount of headwinds in comparison to last year,
first year during which the Company will pay the Orange branding fee throughout the year,
first complete year that Medialaan will be in the Company’s network,
new cable wholesale regulation put in place in Q3
savings with our Bold Inside program
In addition, total eCapex is expected to remain stable in comparison to last year, excluding the RAN sharing agreement.
8. 2020 Financial calendar 02 April Start of quiet period
23 April Financial results Q1 2020 (7:00 am CET) – Press release
23 April Financial results Q1 2020 (10:00 am CET) – Audio conference call
06 May Annual General Meeting of Shareholders
03 July Start of quiet period
24 July Financial results Q2 2020 (7:00 am CET) – Press release
24 July Financial results Q2 2020 (2:00 pm CET) – Audio conference call
02 October Start of quiet period
23 October Financial results Q3 2020 (7:00 am CET) – Press release
23 October Financial results Q3 2020 (10:00 am CET) – Audio conference call
This is a preliminary agenda and is subject to changes
9. Conference call details
Date: 6 February 2020
Time: 14:00 (CET), 13:00 (UK), 08:00 (US/NY)
Conference call: Orange Belgium FY 2019 results
Please aim to access the conference call ten minutes prior to the scheduled start time.
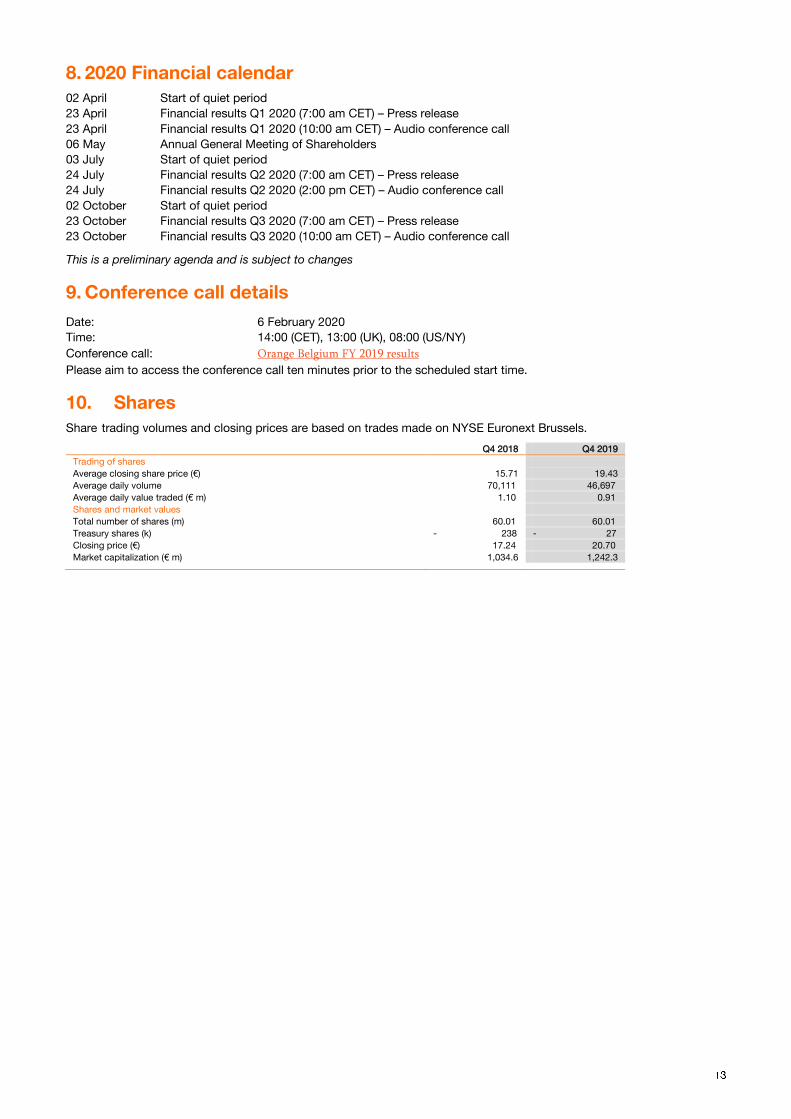
10. Shares Share trading volumes and closing prices are based on trades made on NYSE Euronext Brussels.
Q4 2018 Q4 2019
Trading of shares
Average closing share price (€) 15.71 19.43
Average daily volume 70,111 46,697
Average daily value traded (€ m) 1.10 0.91
Shares and market values
Total number of shares (m) 60.01 60.01
Treasury shares (k) - 238 - 27
Closing price (€) 17.24 20.70
Market capitalization (€ m) 1,034.6 1,242.3
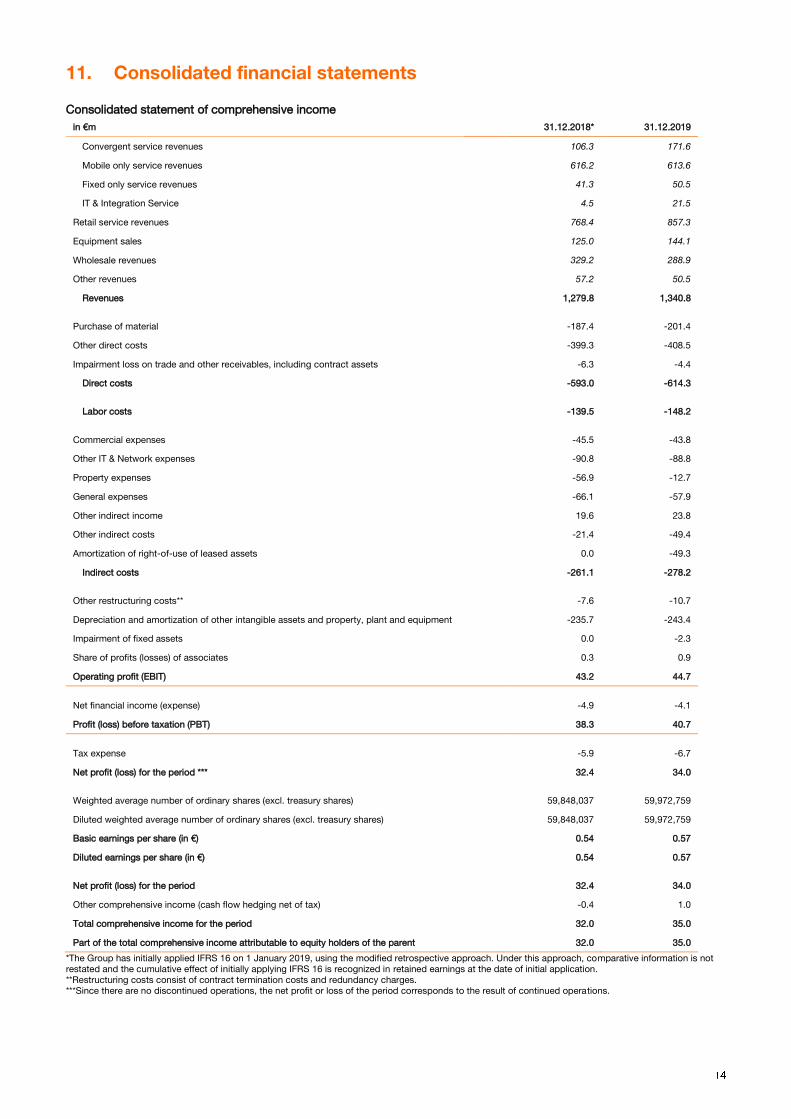
11. Consolidated financial statements
Consolidated statement of comprehensive income
in €m
31.12.2018* 31.12.2019
Convergent service revenues
106.3 171.6
Mobile only service revenues
616.2 613.6
Fixed only service revenues
41.3 50.5
IT & Integration Service
4.5 21.5
Retail service revenues
768.4 857.3
Equipment sales
125.0 144.1
Wholesale revenues
329.2 288.9
Other revenues
57.2 50.5
Revenues
1,279.8 1,340.8
Purchase of material
-187.4 -201.4
Other direct costs
-399.3 -408.5
Impairment loss on trade and other receivables, including contract assets
-6.3 -4.4
Direct costs
-593.0 -614.3
Labor costs
-139.5 -148.2
Commercial expenses
-45.5 -43.8
Other IT & Network expenses
-90.8 -88.8
Property expenses
-56.9 -12.7
General expenses
-66.1 -57.9
Other indirect income
19.6 23.8
Other indirect costs
-21.4 -49.4
Amortization of right-of-use of leased assets
0.0 -49.3
Indirect costs
-261.1 -278.2
Other restructuring costs**
-7.6 -10.7
Depreciation and amortization of other intangible assets and property, plant and equipment
-235.7 -243.4
Impairment of fixed assets
0.0 -2.3
Share of profits (losses) of associates
0.3 0.9
Operating profit (EBIT) 43.2 44.7
Net financial income (expense)
-4.9 -4.1
Profit (loss) before taxation (PBT) 38.3 40.7
Tax expense
-5.9 -6.7
Net profit (loss) for the period ***
32.4 34.0
Weighted average number of ordinary shares (excl. treasury shares)
59,848,037 59,972,759
Diluted weighted average number of ordinary shares (excl. treasury shares)
59,848,037 59,972,759
Basic earnings per share (in €)
0.54 0.57
Diluted earnings per share (in €)
0.54 0.57
Net profit (loss) for the period
32.4 34.0
Other comprehensive income (cash flow hedging net of tax)
-0.4 1.0
Total comprehensive income for the period
32.0 35.0
Part of the total comprehensive income attributable to equity holders of the parent 32.0 35.0
*The Group has initially applied IFRS 16 on 1 January 2019, using the modified retrospective approach. Under this approach, comparative information is not
restated and the cumulative effect of initially applying IFRS 16 is recognized in retained earnings at the date of initial application.
**Restructuring costs consist of contract termination costs and redundancy charges.
***Since there are no discontinued operations, the net profit or loss of the period corresponds to the result of continued operations.
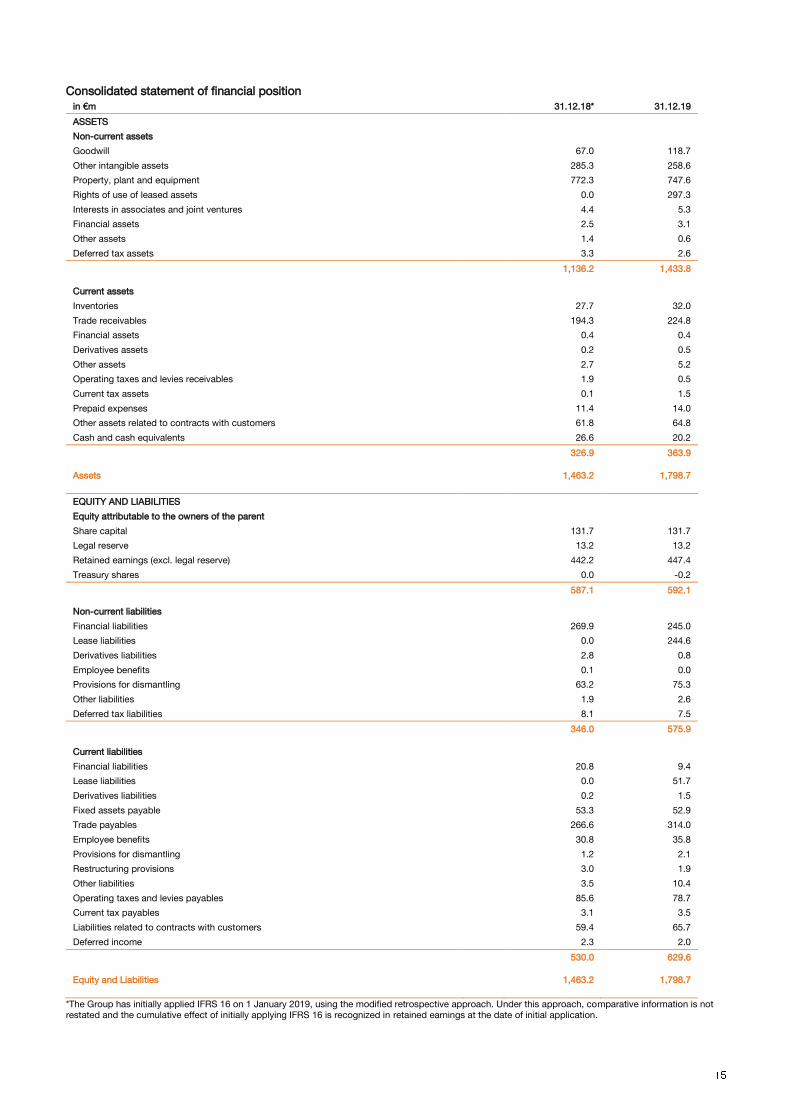
Consolidated statement of financial position
in €m 31.12.18* 31.12.19
ASSETS
Non-current assets
Goodwill
67.0 118.7
Other intangible assets
285.3 258.6
Property, plant and equipment
772.3 747.6
Rights of use of leased assets
0.0 297.3
Interests in associates and joint ventures
4.4 5.3
Financial assets
2.5 3.1
Other assets
1.4 0.6
Deferred tax assets
3.3 2.6
1,136.2 1,433.8
Current assets
Inventories
27.7 32.0
Trade receivables
194.3 224.8
Financial assets
0.4 0.4
Derivatives assets
0.2 0.5
Other assets
2.7 5.2
Operating taxes and levies receivables
1.9 0.5
Current tax assets
0.1 1.5
Prepaid expenses
11.4 14.0
Other assets related to contracts with customers
61.8 64.8
Cash and cash equivalents
26.6 20.2
326.9 363.9
Assets
1,463.2 1,798.7
EQUITY AND LIABILITIES
Equity attributable to the owners of the parent
Share capital
131.7 131.7
Legal reserve
13.2 13.2
Retained earnings (excl. legal reserve)
442.2 447.4
Treasury shares
0.0 -0.2
587.1 592.1
Non-current liabilities
Financial liabilities
269.9 245.0
Lease liabilities
0.0 244.6
Derivatives liabilities
2.8 0.8
Employee benefits
0.1 0.0
Provisions for dismantling
63.2 75.3
Other liabilities
1.9 2.6
Deferred tax liabilities
8.1 7.5
346.0 575.9
Current liabilities
Financial liabilities
20.8 9.4
Lease liabilities
0.0 51.7
Derivatives liabilities
0.2 1.5
Fixed assets payable
53.3 52.9
Trade payables
266.6 314.0
Employee benefits
30.8 35.8
Provisions for dismantling
1.2 2.1
Restructuring provisions
3.0 1.9
Other liabilities
3.5 10.4
Operating taxes and levies payables
85.6 78.7
Current tax payables
3.1 3.5
Liabilities related to contracts with customers
59.4 65.7
Deferred income
2.3 2.0
530.0 629.6
Equity and Liabilities
1,463.2 1,798.7
*The Group has initially applied IFRS 16 on 1 January 2019, using the modified retrospective approach. Under this approach, comparative information is not
restated and the cumulative effect of initially applying IFRS 16 is recognized in retained earnings at the date of initial application.

Consolidated cash flow statement
in €m 31.12.2018* 31.12.2019
Operating activities
Consolidated Net Profit
32.4 34.0
Adjustments to reconcile net profit (loss) to cash generated from operations
Income tax expense
5.9 6.7
Finance expenses, net
4.9 4.1
Share of profits (losses) of associates and joint ventures
-0.3 -0.9
Impairment of non-current assets
0.0 2.3
Depreciation, amortization and impairment of other intangible assets and property, plant and equipment 235.7 243.4
Amortization of right-of-use assets
0.0 49.3
Gains (losses) on disposal
0.0 -1.6
Operating taxes and levies
16.4 14.7
Changes in provisions
-1.0 -1.9
Operational net foreign exchange and derivatives
0.1 0.1
Share-based compensation
0.7 0.4
Impairment on trade and other receivables, including contract assets
6.3 4.4
268.7 321.0
Changes in working capital requirements
Decrease (increase) in inventories, gross
-3.0 0.0
Decrease (increase) in trade receivables, gross
-17.1 -27.5
Increase (decrease) in trade payables
42.3 42.3
Changes in other assets and liabilities
-9.8 2.1
Change in other assets related to contracts with customers
8.0 -3.0
Change in liabilities related to contracts with customers
-1.8 3.9
18.5 17.8
Other net cash out
Operating taxes and levies paid
-25.5 -20.4
Interest paid and interest rates effects on derivatives, net
-3.7 -3.6
Income tax paid
-29.0 -9.1
-58.2 -33.1
Net cash provided by operating activities 261.4 339.7
Investing activities
Purchase of property, plant and equipment and intangible assets
-179.4 -180.2
Increase (decrease) in fixed assets payables
-1.4 -0.4
Cash paid for investments securities and acquired businesses, net of cash acquired
-4.2 -35.1
Decrease (increase) in securities and other financial assets
0.1 0.0
Net cash used in investing activities -184.9 -215.7
Financing activities
Long-term debt redemptions and repayments
-50.1 -31.7
Increase (decrease) of bank overdrafts and short-term borrowings
14.8 -21.8
Repayment of lease liabilities
0.0 -46.7
Purchase of treasury shares
2.5 -0.2
Dividends paid to owners of the parent company
-30.0 -30.0
Net cash used in financing activities -62.8 -130.4
Net change in cash and cash equivalents
13.6 -6.4
Cash and cash equivalents
Opening balance
13.0 26.6
Closing balance
26.6 20.2
*The Group has initially applied IFRS 16 on 1 January 2019, using the modified retrospective approach. Under this approach, comparative information is not
restated and the cumulative effect of initially applying IFRS 16 is recognized in retained earnings at the date of initial application.

Consolidated statement of changes in equity
Share Legal Retained Treasury Total
in €m capital reserve earnings shares equity
Balance at 31 December 2018*, as previously reported 131.7 13.2 442.2
587.1
Adjustment on initial application of IFRS 16 (net of tax)
-0.2
-0.2
Adjusted balance at 1 January 2019 131.7 13.2 442.0
586.9
Net profit for the period
34.0
34.0
Other comprehensive income
1.0
1.0
Total comprehensive income for the period
35.0
35.0
Treasury shares
-0.2 -0.2
Share-based compensation
0.4
0.4
Declared dividends
-30.0
-30.0
Balance as at 31 December 2019 131.7 13.2 447.4 -0.2 592.1
Share Legal Retained Treasury Total
in €m capital reserve earnings shares equity
Balance at 31 December 2017**, as previously reported 131.7 13.2 399.6 -2.5 542.0
Adjustment due to application of IFRS 15 (net of tax)
40.6
40.6
Balance as at 31 December 2017 131.7 13.2 440.2 -2.5 582.6
Adjustment due to application of IFRS 9 (net of tax)
-0.7
-0.7
Adjusted balance at 1 January 2018 131.7 13.2 439.5 -2.5 581.9
Net profit for the period
32.4
32.4
Other comprehensive income
-0.4
-0.4
Total comprehensive income for the period
32.0
32.0
Treasury shares
2.5 2.5
Share-based compensation
0.7
0.7
Declared dividends
-30.0
-30.0
Balance as at 31 December 2018 131.7 13.2 442.2
587.1
*The Group has initially applied IFRS 16 on 1 January 2019, using the modified retrospective approach. Under this approach, comparative information is not
restated and the cumulative effect of initially applying IFRS 16 is recognized in retained earnings at the date of initial application.
**The Group has initially applied IFRS 15 and 9 at 1 January 2018. The Group applied IFRS 15 retrospectively on 1 January 2016 under which comparative
information is restated.

Segment information
Orange Orange Intra-group
in €m, twelve months ended 31 December 2019 Belgium Luxembourg elimination Group
Convergent service revenues 171.6 0.0 0.0 171.6
Mobile only service revenues 579.6 34.0 0.0 613.6
Fixed only service revenues 41.6 9.0 0.0 50.5
IT & Integration service revenues 21.5 0.0 0.0 21.5
Retail service revenues 814.3 43.0 0.0 857.3
Equipment sales 129.8 14.3 0.0 144.1
Wholesale revenues, of which 279.9 12.3 -3.3 288.9
Incoming & Roaming Visitor 251.4 11.1 -3.3 259.3
Other revenues 64.2 0.2 -14.0 50.5
Revenues 1,288.2 69.8 -17.2 1,340.8
Direct costs -594.9 -36.6 17.2 -614.3
Labor costs -139.2 -9.0 0.0 -148.2
Indirect costs, of which -262.1 -16.1 0.0 -278.2
Operational taxes and fees -12.4 -2.3 0.0 -14.7
Amortization of right-of-use of leased assets -45.1 -4.2 0.0 -49.3
Other restructuring costs -10.7 0.0 0.0 -10.7
Depreciation, amortization of other intangible assets and property, plant and equipment -235.6 -7.8 0.0 -243.4
Impairment of fixed assets -2.3 0.0 0.0 -2.3
Share of profits (losses) of associates 0.9 0.0 0.0 0.9
Operating profit (EBIT) 44.4 0.4 0.0 44.7
Net financial income (expense) -4.3 0.2 0.0 -4.1
Profit before taxation (PBT) 40.1 0.6 0.0 40.7
Tax expense -5.9 -0.8 0.0 -6.7
Net profit for the period 34.2 -0.2 0.0 34.0
Orange Orange Intra-group
in €m, twelve months ended 31 December 2018 Belgium Luxembourg elimination Group
Convergent service revenues 106.3 0.0 0.0 106.3
Mobile only service revenues 583.3 33.0 0.0 616.2
Fixed only service revenues 33.6 7.8 0.0 41.3
IT & Integration Service revenues 4.5 0.0 0.0 4.5
Retail service revenues 727.6 40.7 0.0 768.4
Equipment sales 110.4 14.6 0.0 125.0
Wholesale revenues, of which 322.6 10.7 -4.1 329.2
Incoming & Roaming Visitor 258.6 9.5 -4.1 264.0
Other revenues 65.7 0.9 -9.4 57.2
Revenues 1,226.4 66.9 -13.5 1,279.8
Direct costs -570.2 -36.3 13.5 -593.0
Labor costs -129.8 -9.8 0.0 -139.5
Indirect costs, of which -246.5 -14.6 0.0 -261.1
Operational taxes and fees -14.1 -2.3 0.0 -16.4
Other restructuring costs -7.6 0.0 0.0 -7.6
Depreciation, amortization of other intangible assets and property, plant and equipment -228.4 -7.3 0.0 -235.7
Share of profits (losses) of associates 0.3 0.0 0.0 0.3
Operating profit (EBIT) 44.2 -1.1 0.0 43.2
Net financial income (expense) -4.9 0.0 0.0 -4.9
Profit before taxation (PBT) 39.3 -1.1 0.0 38.3
Tax expense -5.8 0.0 0.0 -5.9
Net profit for the period 33.5 -1.1 0.0 32.4

12. Statutory auditor’s procedures The statutory auditor, KPMG Bedrijfsrevisoren - Réviseurs d’Entreprises, represented by Alexis Palm has confirmed that
the audit procedures, which have been substantially completed, have not revealed any material misstatement in the
accounting information included in the Company’s annual announcement.

13. Glossary
Financial KPIs
Revenues
revenues in line with the offer Provide Group revenues split in convergent services, mobile only services, fixed only services, IT &
integration services, wholesale, equipment sales and other revenues.
retail service revenues Revenue aggregation of revenues from convergent services, mobile only services, fixed only services,
IT & integration services.
convergent services
Revenues from B2C convergent offers (excluding equipment sales). A convergent offer is defined as
an offer combining at least a broadband access (xDSL, FTTx, cable or Fixed-4G (fLTE) with cell-lock)
and a mobile voice contract (excluding MVNOs: Mobile Virtual Network Operator). Convergent
services revenues do not include incoming and visitor roaming revenues.
mobile only services Revenues from mobile offers (excluding B2C convergent offers and equipment sales) and M2M
connectivity, excluding incoming and visitors roaming revenues.
fixed only services
Revenues from fixed offers (excluding B2C convergent offers and equipment sales) including (i) fixed
broadband, (ii) fixed narrowband, and (iii) data infrastructure, managed networks, and incoming phone
calls to customer relations call centers.
IT & integration services
Revenues from collaborative services (consulting, integration, messaging, project management),
application services (customer relationship management and infrastructure applications), hosting,
cloud computing services, security services, video-conferencing and M2M services. It also includes
equipment sales associated with the supply of these services.
Wholesale
Revenues with third-party telecom operators for (i) mobile: incoming, visitor roaming, domestic mobile
interconnection (i.e. network sharing and domestic roaming agreement) and MVNO, and for (ii) fixed
carriers services.
equipment sales Revenues from all mobile and fixed equipment sales, excluding (i) equipment sales associated with the
supply of IT & Integration services, and (ii) equipment sales to dealers and brokers.
other revenues Include (i) equipment sales to brokers and dealers, (ii) portal, on-line advertising revenues, (iii)
corporate transversal business line activities, and (iv) other miscellaneous revenues.
Profit & Loss
Data on a comparable basis
Data based on comparable accounting principles, scope of consolidation and exchange rates are
presented for previous periods. The transition from data on an historical basis to data on a comparable
basis consists of keeping the results for the period ended and then restating the results for the
corresponding period of the preceding year for the purpose of presenting, over comparable periods,
financial data with comparable accounting principles, scope of consolidation and exchange rate.
The method used is to apply to the data of the corresponding period of the preceding year, the
accounting principles and scope of consolidation for the period just ended as well as the average
exchange rate used for the income statement for the period ended.
Changes in data on a comparable basis reflect organic business changes. Data on a comparable basis
is not a financial aggregate as defined by IFRS and may not be comparable to similarly-named
indicators used by other companies.
EBITDAaL
(since 1 January 2019)
EBITDA after lease is not a financial measure as defined by IFRS. It corresponds to the net profit
before: taxes; net interest expense; share of profit/losses from associates; impairment of goodwill and
fixed assets; effects resulting from business combinations; reclassification of cumulative translation
adjustment from liquidated entities; depreciation and amortization; the effects of significant litigation,
specific labor expenses; review of the investments and business portfolio, restructuring costs.
reported EBITDA
(prior to 31 December 2018)
Reported EBITDA corresponds to the operating income before depreciation and amortization, before
effects resulting from business combinations, before reclassification of cumulative translation
adjustment from liquidated entities, before impairment of goodwill and fixed assets, and before share
of profits (losses) of associates.
adjusted EBITDA
(prior to 31 December 2018)
Adjusted EBITDA (previously Restated EBITDA) corresponds to the reported EBITDA adjusted before
the effects of significant litigation, specific labor expenses, review of the investments and business
portfolio, restructuring costs and, where appropriate, other specific items.
Cash flow statement
Operating cash flow EBITDAaL minus eCapex since 1 January 2019. Prior to 31 December 2018 it was defined as
Adjusted EBITDA minus Capex.
Organic cash flow
Organic cash flows correspond to net cash provided by operating activities decreased by
capex/eCapex and the repayment of lease liabilities, increased by proceeds from sale of property,
plant and equipment and intangible assets and adjusted for the payments for acquisition of
telecommunications licences.
eCapex
(since 1 January 2019)
Economic Capex is not a financial measure as defined by IFRS. It corresponds to capital expenditures
on tangible and intangible assets excluding telecommunication licenses and excluding investments
through financial leases less proceeds from the disposal of fixed and intangible assets.
Capex
(prior to 31 December 2018)
Capital expenditures on tangible and intangible assets excluding telecommunication licenses and
excluding investments through financial leases.
licences & spectrum Cash out related to acquisitions of licences and spectrum.
change in WCR Change in net inventories, plus change in gross trade receivables, plus change in trade payables, plus
change in other elements of WCR.
other operational items Mainly offset of non-cash items included in adjusted EBITDA, items not included in adjusted EBITDA
but included in net cash provided by operating activities, and change in fixed asset payables.
net debt variation Variation of net debt level.
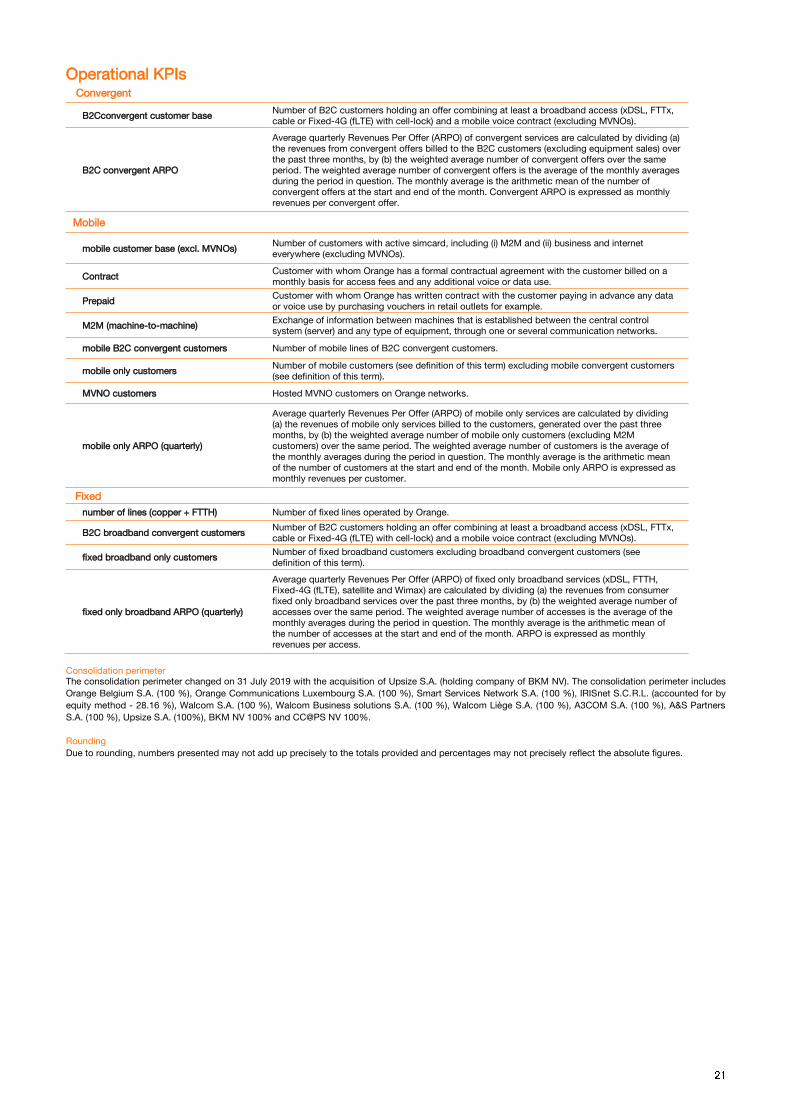
Operational KPIs Convergent
B2Cconvergent customer base Number of B2C customers holding an offer combining at least a broadband access (xDSL, FTTx,
cable or Fixed-4G (fLTE) with cell-lock) and a mobile voice contract (excluding MVNOs).
B2C convergent ARPO
Average quarterly Revenues Per Offer (ARPO) of convergent services are calculated by dividing (a)
the revenues from convergent offers billed to the B2C customers (excluding equipment sales) over
the past three months, by (b) the weighted average number of convergent offers over the same
period. The weighted average number of convergent offers is the average of the monthly averages
during the period in question. The monthly average is the arithmetic mean of the number of
convergent offers at the start and end of the month. Convergent ARPO is expressed as monthly
revenues per convergent offer.
Mobile
mobile customer base (excl. MVNOs) Number of customers with active simcard, including (i) M2M and (ii) business and internet
everywhere (excluding MVNOs).
Contract Customer with whom Orange has a formal contractual agreement with the customer billed on a
monthly basis for access fees and any additional voice or data use.
Prepaid Customer with whom Orange has written contract with the customer paying in advance any data
or voice use by purchasing vouchers in retail outlets for example.
M2M (machine-to-machine) Exchange of information between machines that is established between the central control
system (server) and any type of equipment, through one or several communication networks.
mobile B2C convergent customers Number of mobile lines of B2C convergent customers.
mobile only customers Number of mobile customers (see definition of this term) excluding mobile convergent customers
(see definition of this term).
MVNO customers Hosted MVNO customers on Orange networks.
mobile only ARPO (quarterly)
Average quarterly Revenues Per Offer (ARPO) of mobile only services are calculated by dividing
(a) the revenues of mobile only services billed to the customers, generated over the past three
months, by (b) the weighted average number of mobile only customers (excluding M2M
customers) over the same period. The weighted average number of customers is the average of
the monthly averages during the period in question. The monthly average is the arithmetic mean
of the number of customers at the start and end of the month. Mobile only ARPO is expressed as
monthly revenues per customer.
Fixed
number of lines (copper + FTTH) Number of fixed lines operated by Orange.
B2C broadband convergent customers Number of B2C customers holding an offer combining at least a broadband access (xDSL, FTTx,
cable or Fixed-4G (fLTE) with cell-lock) and a mobile voice contract (excluding MVNOs).
fixed broadband only customers Number of fixed broadband customers excluding broadband convergent customers (see
definition of this term).
fixed only broadband ARPO (quarterly)
Average quarterly Revenues Per Offer (ARPO) of fixed only broadband services (xDSL, FTTH,
Fixed-4G (fLTE), satellite and Wimax) are calculated by dividing (a) the revenues from consumer
fixed only broadband services over the past three months, by (b) the weighted average number of
accesses over the same period. The weighted average number of accesses is the average of the
monthly averages during the period in question. The monthly average is the arithmetic mean of
the number of accesses at the start and end of the month. ARPO is expressed as monthly
revenues per access.
Consolidation perimeter
The consolidation perimeter changed on 31 July 2019 with the acquisition of Upsize S.A. (holding company of BKM NV). The consolidation perimeter includes
Orange Belgium S.A. (100 %), Orange Communications Luxembourg S.A. (100 %), Smart Services Network S.A. (100 %), IRISnet S.C.R.L. (accounted for by
equity method - 28.16 %), Walcom S.A. (100 %), Walcom Business solutions S.A. (100 %), Walcom Liège S.A. (100 %), A3COM S.A. (100 %), A&S Partners
S.A. (100 %), Upsize S.A. (100%), BKM NV 100% and CC@PS NV 100%.
Rounding
Due to rounding, numbers presented may not add up precisely to the totals provided and percentages may not precisely reflect the absolute figures.

About Orange Belgium
Orange Belgium is one of the leading telecommunication operators in Belgium and in Luxembourg through its subsidiary Orange
Communications Luxembourg.
As a convergent player, we provide mobile telecommunication services, internet and TV to private clients, as well as innovative mobile and
fixed line services to businesses. Our high-performance mobile network supports 2G, 3G, 4G and 4G+ technology and is the subject of
ongoing investments.
Orange Belgium is a subsidiary of Orange Group, one of the world’s leading telecommunications operators with a presence in 27
countries. Orange is also a leading provider of global IT and telecommunication services to multinational companies, under the brand
Orange Business Services
Orange Belgium is listed on the Brussels Stock Exchange (OBEL).
More information on: corporate.orange.be, www.orange.be or follow us on Twitter: @pressOrangeBe.
Investors contact Ana Castaño Lopez +32 (0)468 46 95 31
Koen Van Mol +32 (0)495 55 14 99
Press contact Annelore Marynissen [email protected] / +32 (0)479 016 058
Younes Al Bouchouari [email protected] / +32 (0)477 69 87 73