continuous mode conversion of lamb waves in cfrp plates · continuous mode conversion of lamb waves...
TRANSCRIPT

IOP PUBLISHING SMART MATERIALS AND STRUCTURES
Smart Mater. Struct. 21 (2012) 075022 (9pp) doi:10.1088/0964-1726/21/7/075022
Continuous mode conversion of Lambwaves in CFRP plates
C Willberg1,2, S Koch1, G Mook2, J Pohl3 and U Gabbert1
1 Institute for Mechanics, Otto-von-Guericke-University Magdeburg, Magdeburg-39106, Germany2 Institute for Materials and Joining Technology, Otto-von-Guericke-University Magdeburg,Magdeburg-39106, Germany3 Anhalt University of Applied Science, Kothen-06366, Germany
E-mail: [email protected], [email protected], [email protected],[email protected] and [email protected]
Received 28 February 2012, in final form 10 May 2012Published 14 June 2012Online at stacks.iop.org/SMS/21/075022
AbstractOnline damage detection in thin walled light weight structures with Lamb waves is onecommon way to develop structural health monitoring (SHM) systems. Lamb waves occur inmultiple modes, which can convert into each other under special conditions. The effect ofmode conversion of Lamb waves is a well known phenomenon. Typically mode conversiontakes place at structural changes regarding the geometry and material, e.g. damage, cracks,delaminations, etc and can be used as a criterion to get information about the health of thestructure. However, experimentally we observed an unexpected continuous mode conversion(CMC) of Lamb waves in a multi-layer composite plate partially made of fabric material,which means, e.g., that the symmetric S0-mode continuously converts into the A0-modewithout passing a discontinuity. This effect causes a considerably more complex wavefield andmakes the detection and localization of failures more complicated. In this work, the newphenomenon of CMC is described and investigated experimentally as well as numerically.
(Some figures may appear in colour only in the online journal)
1. Introduction
In recent years, many research and application projectshave dealt with the development of structural healthmonitoring (SHM) systems. One promising approach usesLamb waves [1, 2]. Lamb waves are elastic ultrasonic waveswhich exist in thin plate-like structures. They have a lowmaterial and geometrical attenuation (1/
√r) [3] and due to
their small wavelength they interact even with low levelsof damage [4]. Therefore, Lamb waves are interesting formonitoring of light weight CFRP (carbon fiber reinforcedplastics) structures, e.g. airplanes, because it is possible tomonitor large surfaces with a low number of sensors andactuators. However, Lamb waves have complex propertiesparticularly in CFRP materials. They are dispersive andexist in at least two basic modes, a symmetric (S0) andsimultaneously an anti-symmetric (A0) mode, and for higherfrequencies higher order modes occur [5, 6]. Under specialconditions the modes can convert into each other. For a
conversion between the symmetric and anti-symmetric modethe wave has to travel through a discontinuity, which is notsymmetric to the center plane of the wave and vice versa [7,8]. Modes can only convert into other modes which exist atthe same frequencies [9]. An example of mode conversion isgiven in figure 1. The S0-mode interacts with a flat bottomhole and partially converts into an anti-symmetric A0-mode.
However, additionally, we observed experimentally acontinuous mode conversion (CMC) as Lamb waves travelthrough CFRP structures partially made of fabric material. Inthe following the effect of CMC is presented and some firstideas to explain this effect are given. The work is structured inthe following parts. At first, the experimental setup is shown.Then, the effect of CMC is shown and the properties areexplained. The proof of CMC is given and the identificationof the modes is done using B-scans. Next, experimental andnumerical models are used to derive a better explanationfor this effect. Finally, the results and an outlook to furtherinvestigations are given.
10964-1726/12/075022+09$33.00 c© 2012 IOP Publishing Ltd Printed in the UK & the USA

Smart Mater. Struct. 21 (2012) 075022 C Willberg et al
Figure 1. Example of mode conversion of a five-cycle sinus burst ata flat bottom hole (d = 10 mm, h = 1 mm) in a CFRP plate(1 m× 1 m× 2.02 mm) measured by a scanning laser vibrometer ina rectangular scanning surface (240 mm× 155 mm).
2. Experimental setup
The experimental investigations are performed with the helpof a 1D (PSV 300) as well as 3D (PSV 400 3D) scanninglaser vibrometer from Polytec. Laser scanning vibrometryis widely used for the experimental investigation of Lambwaves [10–15]. The scanning laser vibrometer has a highspatial resolution and needs no coupling media. The laservibrometry is based on the Doppler effect [16]. If an objectmoves at a velocity vobject toward the laser beam, thefrequency of the light is shifted by the Doppler shift. Thefrequency shift 1fD is measured. With equation (1) thevelocity of the measured point can be calculated.
1fD =2flaservobject
c= 2
vobject
λlaser. (1)
The parameters flaser, vobject and c are the frequency of theHe–Ne Laser, the velocity of the reflection point and the lightspeed, respectively.
Table 1. Stacking sequence of the CFRP plate(1 m× 1 m× 2.02 mm) [17].
LayerOrientation
(deg) TypeLayer thickness(mm)
1 0/90 Twillfabric
0.4
2 +45 UD layer 0.253 −45 UD layer 0.254 0/90 Plain
fabric0.22
5 −45 UD layer 0.256 +45 UD layer 0.257 0/90 Twill
fabric0.4
Using three lasers the velocity components in thedirection of a Cartesian coordinate system (x1, x2, x3) can bedetermined.
Figure 2 shows the experimental setup. The 3D laservibrometer scans the top surface of a CFRP plate (1 m×1 m×2.02 mm), which is positioned on foam. The average distancesbetween the lasers and the plate are 0.62 m or 0.94 m. Thestacking sequence of the CFRP plate is given in table 1. Thecenter layer is made of a plain fabric (see figure 10(a)) andthe top and bottom surfaces are made of a twill fabric (seefigure 10(b)), respectively.
The Lamb wave is excited using a piezoceramic actuatorof 20 mm diameter and a thickness of h = 1 mm made fromthe material Marco FPM202.4 The actuator is attached atthe center of the bottom surface of the plate with the aid ofparaffin. Paraffin allows a reversible coupling between theactuator and the plate. The edges are prepared with siliconto reduce the amplitude of reflected waves. The top surface iscoated by a retro-reflective layer to enhance the signal to noiseratio of the measurement signals.
A five-cycle sinus burst amplified by a NF-HSA-4011-amplifier is fed to the actuator. During the measurement the
4 Marco Systemanalyse und Entwicklung GmbH www.marco.de/E/index.html Oct. 13 2011.
Figure 2. Experimental setup.
2
Smart Mater. Struct. 21 (2012) 075022 C Willberg et al
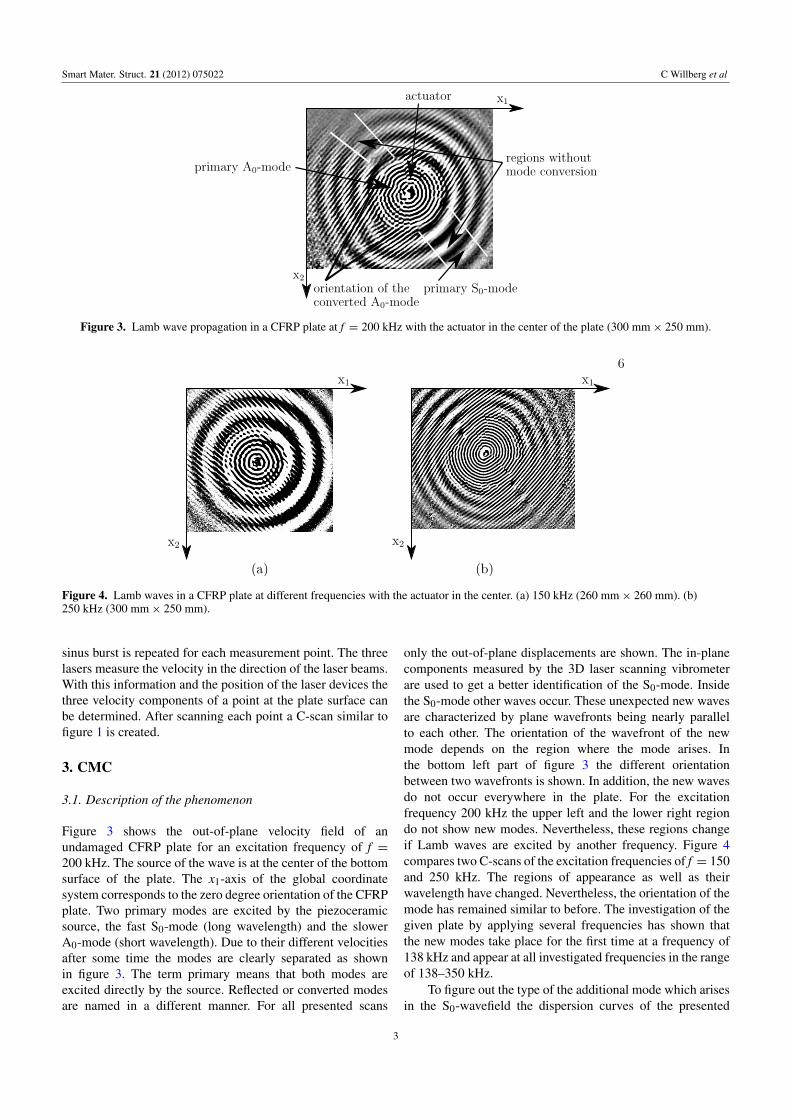
Figure 3. Lamb wave propagation in a CFRP plate at f = 200 kHz with the actuator in the center of the plate (300 mm× 250 mm).
Figure 4. Lamb waves in a CFRP plate at different frequencies with the actuator in the center. (a) 150 kHz (260 mm× 260 mm). (b)250 kHz (300 mm× 250 mm).
sinus burst is repeated for each measurement point. The threelasers measure the velocity in the direction of the laser beams.With this information and the position of the laser devices thethree velocity components of a point at the plate surface canbe determined. After scanning each point a C-scan similar tofigure 1 is created.
3. CMC
3.1. Description of the phenomenon
Figure 3 shows the out-of-plane velocity field of anundamaged CFRP plate for an excitation frequency of f =200 kHz. The source of the wave is at the center of the bottomsurface of the plate. The x1-axis of the global coordinatesystem corresponds to the zero degree orientation of the CFRPplate. Two primary modes are excited by the piezoceramicsource, the fast S0-mode (long wavelength) and the slowerA0-mode (short wavelength). Due to their different velocitiesafter some time the modes are clearly separated as shownin figure 3. The term primary means that both modes areexcited directly by the source. Reflected or converted modesare named in a different manner. For all presented scans
only the out-of-plane displacements are shown. The in-planecomponents measured by the 3D laser scanning vibrometerare used to get a better identification of the S0-mode. Insidethe S0-mode other waves occur. These unexpected new wavesare characterized by plane wavefronts being nearly parallelto each other. The orientation of the wavefront of the newmode depends on the region where the mode arises. Inthe bottom left part of figure 3 the different orientationbetween two wavefronts is shown. In addition, the new wavesdo not occur everywhere in the plate. For the excitationfrequency 200 kHz the upper left and the lower right regiondo not show new modes. Nevertheless, these regions changeif Lamb waves are excited by another frequency. Figure 4compares two C-scans of the excitation frequencies of f = 150and 250 kHz. The regions of appearance as well as theirwavelength have changed. Nevertheless, the orientation of themode has remained similar to before. The investigation of thegiven plate by applying several frequencies has shown thatthe new modes take place for the first time at a frequency of138 kHz and appear at all investigated frequencies in the rangeof 138–350 kHz.
To figure out the type of the additional mode which arisesin the S0-wavefield the dispersion curves of the presented
3

Smart Mater. Struct. 21 (2012) 075022 C Willberg et al
Figure 5. Dispersion curves for the quasi-isotropic CFRP plate inthe 0◦-direction. (a) Phase velocity. (b) Group velocity.
CFRP plate are shown in figure 5. Lamb waves exhibitvelocity dispersion and the dispersion curves illustrate thedependency between the frequency times thickness and thewave velocity. Furthermore, the existence of higher ordermodes and their cut off frequencies can be found. The curvesin figure 5 are calculated with the semi-analytical finiteelement (SAFE) method, which has been proven to be veryaccurate for such CFRP plates [7]. The dispersion curves forthe investigated plate show that for frequencies lower than205 kHz only three modes exist, the A0-, the SH0- and theS0-mode. Above this frequency a fourth mode appears, theA1-mode. At frequencies higher than 280 kHz the symmetricS1-mode occurs. In figures 3 and 4 the anti-symmetricA0-mode has a shorter wavelength. Its wavefield is nextto the source and the wavefront has a smaller diameterin comparison to the S0-wavefield. The waves inside theS0-mode have wavelengths similar to the A0-mode. The threeC-scan examples correlate to the values of the entries 0.3,0.4 and 0.5 MHz mm in the dispersion curves in figure 5.Therefore, at the lowest frequency f = 150 kHz no higherorder mode exists, which means that only a conversionfrom the symmetric mode into the anti-symmetric modeor the shear-horizontal mode can take place. However, theSH0-mode has a significantly greater wavelength
λ =cp
f(2)
in comparison to the A0-mode, because of its higher phasevelocities cp. For the lowest presented frequency f = 150 kHzit is assumed that the S0-mode converts into an A0-mode. Atthe two other presented frequencies two higher order modescould occur. Nevertheless, the phase velocity is drasticallyhigher in comparison to the A0-mode. As the wavelengthsof the new mode are close to the A0-mode we assume that adominant conversion between the S0-mode and the A0-modeoccurs. However, the mode conversion does not take place ata specific discontinuity, but continuously while the S0-modetravels through the plate.
Figure 6. Analysis of the new mode at f = 200 kHz. (a) C-scan ofa strip. (b) B-scan of a strip.
3.2. The identification of CMC
In the following section, further arguments are gathered toidentify the converted mode as A0-mode. As the A0-mode isslower than the S0-mode, the existence of the anti-symmetricmode inside the S0-wavefield gives strong evidence for CMC.Six identically produced CFRP plates have been investigated.All of them show an analog behavior. Therefore, random localdamage inside the plate can be excluded as the reason formode conversion.
As shown in figure 6(a), a strip of the Lamb wave C-scanis taken from a plate. The source is located at the left side.The primary modes are already separated from each other. Inthe space between both primary modes a number of obliquewaves can be seen. These waves travel at the same velocityas the A0-mode. Using the center line perpendicular to thewavefront of the primary modes the C-scan strip can betransformed into a B-scan. The time–amplitude data of eachpoint of the center line of figure 6(a) are plotted side by sideas illustrated in figure 6(b). The heights of the amplitudes ata specific time and position are visualized by the grayscalepicture. Dark gray illustrates negative and bright gray positiveamplitude values.
If a Lamb wave is excited by a burst signal, at leasttwo primary groups of waves travel through the plate whichmay separate from each other. The groups propagate withdifferent velocities. The B-scan displays the movement ofthese groups by oblique parallel lines. The inclinations ofthe lines correspond to the group velocities (see figure 5(b))of the excited modes. The dominant lines with the highestamplitudes correspond to the central frequency of theburst signal. Smaller angles α between the lines and thex1-axis indicate a higher velocity. Therefore, the upper lines
4
Smart Mater. Struct. 21 (2012) 075022 C Willberg et al
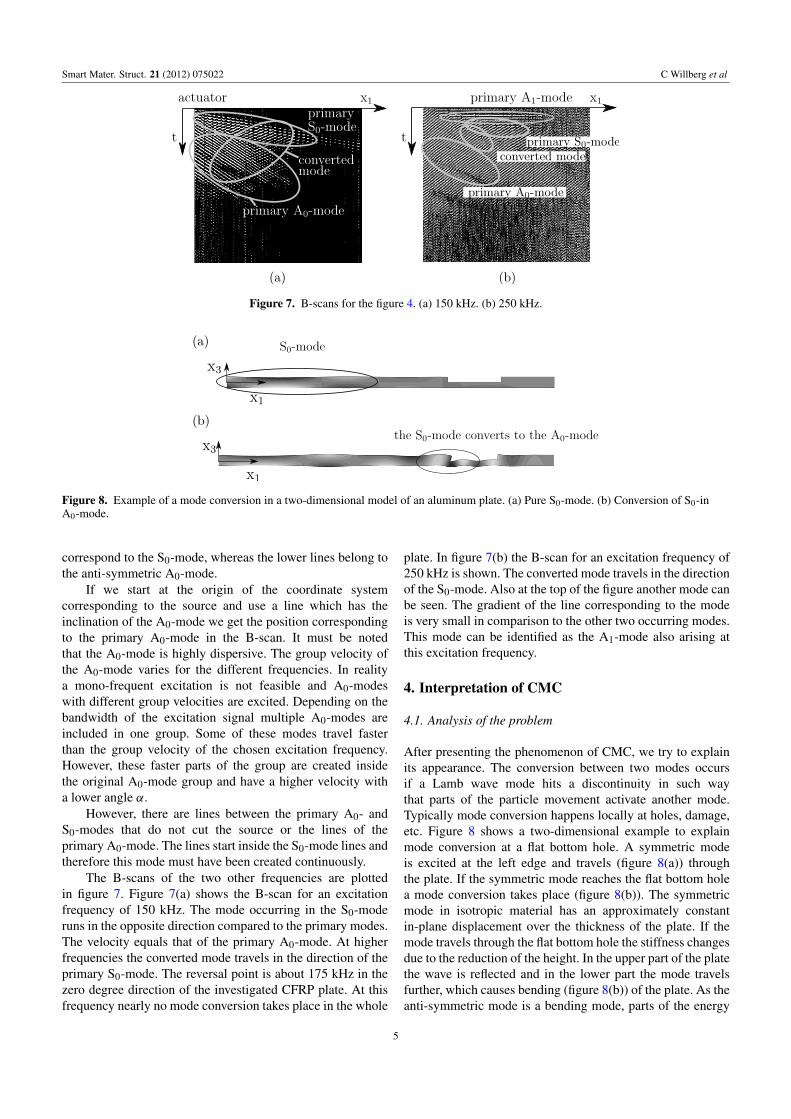
Figure 7. B-scans for the figure 4. (a) 150 kHz. (b) 250 kHz.
Figure 8. Example of a mode conversion in a two-dimensional model of an aluminum plate. (a) Pure S0-mode. (b) Conversion of S0-inA0-mode.
correspond to the S0-mode, whereas the lower lines belong tothe anti-symmetric A0-mode.
If we start at the origin of the coordinate systemcorresponding to the source and use a line which has theinclination of the A0-mode we get the position correspondingto the primary A0-mode in the B-scan. It must be notedthat the A0-mode is highly dispersive. The group velocity ofthe A0-mode varies for the different frequencies. In realitya mono-frequent excitation is not feasible and A0-modeswith different group velocities are excited. Depending on thebandwidth of the excitation signal multiple A0-modes areincluded in one group. Some of these modes travel fasterthan the group velocity of the chosen excitation frequency.However, these faster parts of the group are created insidethe original A0-mode group and have a higher velocity witha lower angle α.
However, there are lines between the primary A0- andS0-modes that do not cut the source or the lines of theprimary A0-mode. The lines start inside the S0-mode lines andtherefore this mode must have been created continuously.
The B-scans of the two other frequencies are plottedin figure 7. Figure 7(a) shows the B-scan for an excitationfrequency of 150 kHz. The mode occurring in the S0-moderuns in the opposite direction compared to the primary modes.The velocity equals that of the primary A0-mode. At higherfrequencies the converted mode travels in the direction of theprimary S0-mode. The reversal point is about 175 kHz in thezero degree direction of the investigated CFRP plate. At thisfrequency nearly no mode conversion takes place in the whole
plate. In figure 7(b) the B-scan for an excitation frequency of250 kHz is shown. The converted mode travels in the directionof the S0-mode. Also at the top of the figure another mode canbe seen. The gradient of the line corresponding to the modeis very small in comparison to the other two occurring modes.This mode can be identified as the A1-mode also arising atthis excitation frequency.
4. Interpretation of CMC
4.1. Analysis of the problem
After presenting the phenomenon of CMC, we try to explainits appearance. The conversion between two modes occursif a Lamb wave mode hits a discontinuity in such waythat parts of the particle movement activate another mode.Typically mode conversion happens locally at holes, damage,etc. Figure 8 shows a two-dimensional example to explainmode conversion at a flat bottom hole. A symmetric modeis excited at the left edge and travels (figure 8(a)) throughthe plate. If the symmetric mode reaches the flat bottom holea mode conversion takes place (figure 8(b)). The symmetricmode in isotropic material has an approximately constantin-plane displacement over the thickness of the plate. If themode travels through the flat bottom hole the stiffness changesdue to the reduction of the height. In the upper part of the platethe wave is reflected and in the lower part the mode travelsfurther, which causes bending (figure 8(b)) of the plate. As theanti-symmetric mode is a bending mode, parts of the energy
5

Smart Mater. Struct. 21 (2012) 075022 C Willberg et al
Figure 9. Influence of twill fabric on the S0-mode wavefront caused by CMC.
Figure 10. Fabric types in the CFRP plate [18]. (a) Plain fabric.(b) Twill fabric.
Table 2. Types of displacements for the three basic modes.
Mode u1 u2 u3
A0 Symmetric Zero Anti-symmetric
SH0 Zero Non zero ZeroS0 Anti-
symmetricZero Symmetric
of the symmetric mode are transferred to the anti-symmetricone and two modes exist.
Table 2 illustrates the primary displacements of the threebasic modes in different directions for an isotropic materialwith an infinite extension in the x2-direction (exemplarilyshown in figure 8). A mode conversion takes place if thesymmetric displacement of the S0-mode in the x3-directioncauses an anti-symmetric displacement in the x3-direction andvice versa.
In the following part we try to explain why CMC takesplace in the presented CFRP plate. Figure 9 shows a stripof the Lamb wave C-scan with a length of l = 64 mm.Behind the measured data a photograph of the plate surfaceis displayed. The texture of the twill fabric can be identified.The drawn lines are an extension of the fabric texture. Thedistance between two lines is 2 mm. It can be seen that thewavefront of the continuously converted mode corresponds tothis direction. The top layer is made of twill fabric displayedin figure 10(b).
We assume that this texture causes the mode conversion.A plain fabric layer is also a part of the CFRP plate. Theplain fabric has a texture like the twill fabric (figure 10(a)).
Table 3. Material properties of the numerical models.
Parameter Unit Fibers Matrix
E11 (109 N m−2) 127.5 7.9E22 (109 N m−2) 7.9 —G12 (109 N m−2) 5.58 —ν12 (—) 0.35 0.3ν23 (—) 0.273 —ρ (kg m−3) 1550 1550
Therefore, both fabrics are investigated. In the followingtwo sections the Lamb wave propagation in both fabrics isstudied. Experimental and numerical models are used forinterpretation.
4.2. Plain fabric
4.2.1. Experimental investigation. First, a square two layerplain fabric plate (0.3 m × 0.3 m × 1 mm) is studied.The piezoceramic actuator is applied at the center of therear surface of the plate. The top surface is measured bythe scanning laser vibrometer, similar to the previouslypresented measurements. A five-pulse burst is used atdifferent central frequencies between f = 100 · · · 300 kHz.Figure 11(a) shows the C-scan of the plain fabric platefor f = 200 kHz. No mode conversion can be observed.The primary S0-mode dominantly exists in the 0◦-, 90◦-,180◦- and 270◦-direction, whereas the A0-wavefield is nearlycircular. For lower or higher frequencies also no CMC occurs.The B-scan in the x1-direction, illustrated in figure 11(b),shows that no A0-mode forms inside the S0-mode lines. Alllines corresponding to the A0-mode start at the source. Theexperimental investigation of the two layer plain fabric platedoes not give any evidence for CMC.
4.2.2. Numerical investigation. Although there is noCMC in the experiments a numerical analysis is performed.The material properties of the fibers as well as the matrixare given in table 3. As common, we assume transversalisotropic material properties for the fiber material [19]. Boththe plain as well as the twill fabric model are calculatedwith the commercial finite element program ABAQUS. TheLamb waves are excited using a three-cycle Hann-windowmodulated sinusoidal point force in the x3-direction at thecenter of the plate. All edges are assumed to be free.
6

Smart Mater. Struct. 21 (2012) 075022 C Willberg et al
Figure 11. Experimental investigation of a one layer plain fabric for f = 200 kHz. (a) C-scan with actuator in the center(280 mm× 280 mm). (b) B-scan.
Figure 12. Numerical plain fabric model. (a) Numerical model of a single layer square plain fabric cell (l = 16 mm, d = 2 mm).(b) Numerical result for a one layer plain fabric plate (0.46 m× 0.46 m× 2 mm) for f = 200 kHz.
Figure 12(a) shows the model to approximate a singleplain fabric layer. In accordance with the previous definitionthe 0◦ direction of the fibers correlates with the x1-direction.The length and thickness are defined as lf = 16 mm andd = 2 mm. The cross section of the fiber is given with(2 mm× 2 mm). The square cell is copied and merged severaltimes to create a complete plate. The fiber curvature of themodel is neglected to reduce the computational cost.
The plain fabric plate is modeled by one layer with thesize (0.46 m×0.46 m×2 mm). Similar to the experiments theLamb waves are excited at several frequencies. In figure 12(b)a result of the calculations for the frequency f = 200 kHzis shown. A weak mode conversion in front of the primaryA0-mode can be seen. The converted mode is oriented inthe ±45◦-direction corresponding to the texture of the plainfabric. The S0-mode for the plate with matrix material is notdisplayed, because the amplitudes are low in comparison tothose of the anti-symmetric A0-mode.
Two additional models are applied to calculate a twolayer plain fabric plate. It should be mentioned that the twolayers can be arranged symmetrically or anti-symmetricallyto the center plane. An anti-symmetric assembly of the twolayers shows weak mode conversions, whereas the symmetric
assembly shows no evidence of mode conversion. However,the reality is between both models. Therefore, if CMCoccurs in a real two layer plain fabric plate the amplitudesof the converted A0-mode are quite small. Moreover, thematerial damping of the real structure is not considered in thenumerical model which in reality also leads to a reductionof the amplitude of the converted A0-mode. Therefore,no converted A0-mode can be seen in the experimentalinvestigation.
4.3. Twill fabric
4.3.1. Experimental investigation. The experiments areaccomplished at a single layer twill fabric plate (1 m ×1 m × 0.3 mm). As a result of the plate’s thickness themeasurements are done several times after rotating the plate.We get the same results for all measurements, which meansthat the influence of bending of the plate under its ownweight on the measurement results can be excluded. Infigure 13(a) the C-scan for a frequency f = 20 kHz isplotted. The mode conversion occurs primarily in the 0◦-,90◦-, 180◦- and 270◦-direction. Perpendicular and parallelto the texture of the twill fabric no mode conversion takes
7

Smart Mater. Struct. 21 (2012) 075022 C Willberg et al
Figure 13. Experimental investigation of a one layer twill fabric for f = 50 kHz. (a) C-scan with the actuator in the center(100 mm× 100 mm). (b) B-scan.
Figure 14. Numerical twill fabric model. (a) Numerical model of a single layer square twill fabric cell (l = 32 mm, d = 2 mm).(b) Numerical result for one layer twill fabric plate (0.48 m× 0.48 m× 2 mm) for f = 250 kHz.
place. The CMC arises at all measured frequencies f >20 kHz. In figure 13(b) the B-scan at 50 kHz in the0◦-direction is plotted. The symmetric mode cannot beseen by displaying the out-of-plane components of the laservibrometer measurements. The B-scan corresponding to theS0-mode is plotted. Besides the primary, a converted A0-modestarts inside the S0-mode.
4.3.2. Numerical investigation. Figure 14(a) shows thetwill fabric model. The lengths and the thicknesses of thesquare twill fabric cell model are defined as lf = 32 mmand d = 2 mm. The material properties of the fibers andmatrix are given in table 3. The complete twill fabric plate(0.48 m × 0.48 m × 2 mm) is modeled with a single layer.Similar to the numerical plain fabric model the fiber curvatureis neglected. The results of the numerical twill fabric modelshow the phenomenon of CMCs illustrated in figure 14(b).The main regions of occurrence of CMC are similar to theexperiments. The mode conversion mainly takes place in the0◦-, 90◦-, 180◦- and 270◦-direction. However, the orientationof the converted mode (between the black lines) differs fromthe experiments.
All numerical models, the plain fabric as well as the twillfabric models, illustrate the strong influence of the modelassumptions on the results. In order to ensure quite accuratesimulation results the applied linear finite elements shouldnot be distorted. Otherwise the shear locking phenomenontakes place, which may reduce the accuracy considerably.However, unfortunately, the simulation of the real thin platewould require an enormous amount of degrees of freedomwhich cannot be handled by our existing advanced computerhardware yet. Consequently, in our simulation we used agreater plate thickness in comparison with the real plate,which is used in the experiments. Moreover, the modeling ofthe matrix–fiber arrangement has to be studied in detail.
5. Conclusions
The paper presents the phenomenon of continuous Lamb wavemode conversion in a CFRP plate. The effect is observed firstin a multi-layer composite plate, where 50% of the whole plateis made of different types of fabrics. The investigated CFRPplate shows the effect of CMC first at around 138 kHz, which
8
Smart Mater. Struct. 21 (2012) 075022 C Willberg et al
is identified as a mode conversion from the S0-mode to theA0-mode. For this identification the dispersion curves as wellas B-scans are used. The dispersion curves show that onlythree modes occur in the observed frequency region. The bigdifferences of the phase velocity between the different modesallow the identification of the new mode as the A0-mode.The B-scans have shown that for frequencies between 138and 175 kHz the new A0-mode travels opposite to the parentS0-mode. Above 175 kHz both the parent and the convertedA0-mode travel in the same direction.
The experimental results of the scanning laser vibrometerhave shown that the wavefield becomes considerably morecomplex in comparison to results where mode conversion isnot present. Therefore, for SHM applications CMC has tobe taken into account because the evaluation and the signalprocessing of the received signals become more complicated.
The analysis of the experimental data suggested that thefabrics in the investigated CFRP plates are responsible forthe CMC. Therefore, experimental and numerical analysesof both types of fabrics (plain and twill) are performed.The developed finite element models are a first step fora better theoretical understanding of the phenomenon. Theexperimental investigation of the double layer plain fabricplate did not show a mode conversion. Nevertheless, in theone layer finite element models a weak mode conversionoccurs. In the twill fabric plate the conversion arises for allinvestigated frequencies f > 20 kHz. The orientation of theconverted A0-mode is parallel to the texture of the twill fabric.The applied numerical model shows comparable properties.The new mode occurs mainly in the 0◦-, 90◦-, 180◦- and270◦-direction.
The discrepancies between the experiments and thenumerical results have many causes. The numerical modelsare a simplification of the real structure. The real materialdata and the real matrix–fiber arrangement are not known.Moreover, due to requirements of linear finite elements thenumerical model uses a 2 mm thick plate, whereas thethickness of the experimentally investigated plate is 0.3 mm.The single layer twill fabric plate needs at least two milliondegrees of freedom for an accurate solution. When usinglinear finite elements one has to pay attention to the elementsaspect ratio, because otherwise the shear locking effect takesplace. To avoid critical aspect ratios highly refined meshesare needed, which result in several million finite elementsand many more degrees of freedom. These models have to besolved in the time domain by applying very small time steps.At present such simulations are beyond our existing hardwareresources. This is the reason why a thicker numericalplate model has been investigated numerically. However, thedevelopment of new higher order finite elements, which haveshown the ability to overcome the existing limitations [20], isin progress. Further investigations have to be considered in thenear future, where the modeling of the complete seven layerCFRP plate could be possible.
Acknowledgments
The authors thank the Deutsche Forschungsgemeinschaft(DFG) and all project partners for their support (GA 480/13-1,MO 553/9-1).
References
[1] Boller C, Chang F-K and Fijino Y 2009 Encyclopedia ofStructural Health Monitoring (New York: Wiley)ISBN 10:0470058226
[2] Giurgiutiu V 2008 Structural Health Monitoring withPiezoelectric Wafer Active Sensors (New York: Academic(Elsevier)) ISBN 13:978-0-12-088760-6
[3] Su Z and Ye L 2009 Identification of Damage Using LambWaves: From Fundamentals to Applications (Berlin:Springer) ISBN 978-1-84882-783-7
[4] Mook G, Pohl J and Michel F 2003 Non-destructivecharacterization of smart CFRP structures Smart Mater.Struct. 12 997–1004
[5] Viktorov A 1967 I. Rayleigh and Lamb Waves (New York:Plenum)
[6] Wilcox P D, Lowe M J S and Cawley P 2001 Mode andtransducer selection for long range Lamb wave inspectionJ. Intell. Mater. Syst. Struct. 12 553–65
[7] Ahmad Z A B 2011 Numerical simulations of Lamb waves inplates using a semi-analytical finite element method PhDThesis Otto-von-Guericke-University of Magdeburg,Fortschritt-Berichte VDI Reihe 20, Nr. 437, Dusseldorf:VDI Verlag
[8] Willberg C, Vivar-Perez J M and Gabbert U 2009 Lamb waveinteraction with defects in homogeneous plates ICEDyn:Int. Conf. on Structural Engineering Dynamics (Ericeira,June)
[9] Cho Y 2000 Estimation of ultrasonic guided wave modeconversion in a plate with thickness variation IEEE Trans.Ultrason. Ferroelectr. Freq. Control 47 591–603
[10] Mallet L, Lee B C, Staszewski W C and Scarpa F 2004Structural health monitoring using scanning laservibrometry: II. Lamb waves for damage detection SmartMater. Struct. 13 261–9
[11] Staszewski W J, Lee B C and Traynor R 2007 Fatigue crackdetection in metallic structures with Lamb waves and 3Dlaser vibrometry Meas. Sci. Technol. 18 727–39
[12] Swenson E D, Kapoor H and Soni S R 2010 Effects of Z-pinson Lamb waves in composite plates Proc. SPIE7649 76490E
[13] Swenson E D, Kapoor H and Soni S R 2010 Nondestructivecharacterization for composite materials Proc. SPIE7649 76490D
[14] Pohl J, Willberg C, Gabbert U and Mook G 2012 Theoreticalanalysis and experimental determination of the dynamicbehaviour of piezoceramic actuators for SHM Exp. Mech.51 429–38
[15] Sohn H, Dutta D, Yang J Y, DeSimio M, Olson S andSwenson E 2011 Automated detection of delamination anddisbond from wavefield images obtained using a scanninglaser vibrometer Smart Mater. Struct. 20 045017
[16] Rosenberger D 1975 Technische Anwendungen des Lasers(Berlin: Springer) ISBN 3-540-06533-4
[17] Schmidt D 2010 Dokumentation CFK-Testplatten, TechnicalReport, DLR Institute of Composite Structures andAdaptive Systems
[18] Schurmann H 2007 Konstruieren mitFaser–Kunstoff–Verbunden (Berlin: Springer)ISBN 978-3-540-72189-5
[19] Jones R M 1975 Mechanics of Composite Materials(New York: McGraw-Hill) ISBN 10:0070853479
[20] Willberg C and Gabbert U 2012 Development of athree-dimensional piezoelectric isogeometric finite elementfor smart structure applications Acta Mech. doi:10.1007/s00707-012-0644-x (online first)
9