contract daaj09-95-c-0546 infac - defense … 9 – doe 2 main effects plots 26 figure 10 – pareto...
TRANSCRIPT

Contract DAAJ09-95-C-0546Manufacturing MethodsReportCDRL A003Report Number 01-008
Notice
This report was prepared to documentwork sponsored by the United StatesGovernment. Neither the United Statesnor its agent, the United StatesDepartment of Defense, nor any of theircontractors, subcontractors or theiremployees, makes any warranty, expressor implied, or assumes legal liability orresponsibility for the accuracy,completeness, or usefulness of anyinformation, apparatus, product orprocess disclosed, or represents that itsuse would not infringe privately ownedrights.
INFAC
Management and OperationOf the DoD InstrumentedFactory for Gears
Quench Press Hardening with Low CopperPlating
March 28, 2001
U. S. Army Aviation and Missile CommandRedstone ArsenalAMSAM-RD-SE-MTHuntsville, Alabama 35898-5270
IIT Research Institute10 West 35th St.Chicago, Illinois 60616-3799

March 2001
INFAC-01-008
Quench Press Hardening with Low Copper Plating
IIT Research InstituteChicago, IL 60616-3799
March 28, 2001
Contract DAAJ09-95-C-0546
Prepared for:
U.S. Army Aviation and Missile CommandRedstone Arsenal, AL 35898-5270
Notice
This report was prepared to document work sponsored by the United States Government. Neither the United States nor its agent,the United States Department of Defense, nor any of their contractors, subcontractors or their employees, makes any warranty,

March 2001
express or implied, or assumes legal liability or responsibility for the accuracy, completeness, or usefulness of any information,apparatus, product or process disclosed, or represents that its use would not infringe privately owned rights.

March 2001 ii
REPORT DOCUMENTATION PAGE Form Approved
Public reporting burden for this collection of information is estimated to average 1 hour per response, including the time for reviewing instructions, searching, existing data sources,gathering and maintaining the data needed, and completing and reviewing the collection of information. Send comments regarding this burden estimate or any other aspect of thiscollection of information, including suggestions for reducing this burden, to Washington Headquarters Services, Directorate for Information Operations and Reports, 1215 JeffersonDavis Highway, Suite 1204, Arlington, VA 22202-4302, and to the Office of Management and Budget. Paperwork Reduction Project (0704-0188), Washington, DC 20503.
1. AGENCY USE ONLY (Leave Blank) 2. REPORT DATE
March 28, 2001
3. REPORT TYPE AND DATES COVERED
Manufacturing Methods Report4. TITLE AND SUBTITLE
Quench Press Hardening with Low Copper Plating
5. FUNDING NUMBERS
DAAJO9-95-C-05466. AUTHOR(S)
INFAC Program7. PERFORMING ORGANIZATION NAME(S) AND ADDRESS(ES)
IIT Research InstituteINFAC10 West 35th StreetChicago, IL 60616
8. PERFORMING ORGANIZATIONREPORT NUMBER
01-008
9. SPONSORING/MONITORING AGENCY NAME(S) AND ADDRESS(ES)U.S. Army Aviation and Missile CommandAttn: AMSAM-RD-SE-MTRedstone Arsenal, AL 35898-5270
10. SPONSORING/MONITORINGAGENCY REPORT NUMBER
11. SUPPLEMENTARY NOTES:
Compact Disc available from INFAC only. Reproduction not authorized except by permission12a. DISTRIBUTION/AVAILABILITY STATEMENTUnclassifiedApproved for public release, distribution is unlimited
12b. DISTRIBUTION CODE
13. ABSTRACT (Maximum 200 words) Copper plating is used as a carbon stop-off during the carburization andaustenitization operations associated with the manufacture of precision gears. The “Low Copper” project'sgoals were to optimize the thickness of copper needed during carburization, and to eliminate the need to re-platecopper prior to austenitizing, via atmosphere control in a rotary furnace. Traditionally, plating that is 0.001 to0.003 inch thick is used as a carbon stop-off. Experimentation was aimed at reducing this thickness to between0.0001 to 0.0005 inch, roughly an order of magnitude thinner. Three designed experiments were performed byIIT Research Institute. Honeywell Engines & Systems of Phoenix, AZ followed the experimentation at IITResearch Institute by performing preproduction tests and additional experiments. Honeywell also prepared acost benefit analysis to detail and document the projected process savings that could be gained byimplementation of the technique. An industry-wide cost-benefit analysis and implementation plan is included.Annual savings realized by pervasive implementation of the technique were estimated at over $1,000,000 peryear.
14. SUBJECT TERMS Selective Carburizing, Copper Plating, SAE/AISI 9310H,Precision Gears, Press Quenching
15. NUMBER OF PAGES92
16. PRICE CODE
17. SECURITYCLASSIFICATION
18. SECURITYCLASSIFICATION
19. SECURITYCLASSIFICATION
20. LIMITATION OF ABSTRACT

March 2001 iii
OF REPORTUnclassified
OF THIS PAGEUnclassified
OF ABSTRACTUnclassified
Same as report
NSN 7540-01-280-5500 Standard Form 298 (Rev. 2-89)Prescribed by ANSI Std. Z39-18298-102
ContentsPage
Abstract ............................................................................................................................................... v
Executive Summary vi
List of Figures vii
List of Tables viii
Technical/Manufacturing Methods Report 1
Introduction 1
Problem Statement 5
Purpose and Goal 7
Project Methodology 7
State of the Art Review 8
Experimentation 9
DOE 1 9
Overview 9
Experimental Procedure 12
Surface Roughness Analysis 13
Mass Analysis 13
Macroetch Analysis 13
Microstructural Analysis 14
DOE 1 Conclusions 14
DOE 2 17
Overview 17
Experimental Procedure 21
Data and Analyses 21
Macroetch Analysis 21

March 2001 iv
Microhardness Analysis 24
DOE 2 Conclusions 25
DOE 3 32
Overview 32
Experimental Procedure 37
Macroetch Analysis 38
Microhardness Analysis 38
DOE 3 Conclusions 39
Diffusion Model 46
Purpose and Goal 46
Introduction 46
Methodology 46
Conclusions 48
Cost-Benefit Analysis 49
Introduction 49
Industry-Wide Implementation Plan 52
Overall Conclusions .................................................................................................................55
Recommendations / Future Work 56
System Validation Report 57
Monograph 58
Period of Performance 59
Research Approach 60
Data and Deliverables 61
References 62
AppendicesA State of the Art Review 64
B DOE 1 Raw Surface Roughness Data 72
C DOE 1 Raw Mass Data 74
D DOE 2 Fully Nested ANOVA 75
E DOE 3 Fully Nested ANOVA for Plated Halves of Samples 1 - 48 80
F DOE 3 Fully Nested ANOVA for Plated Halves of Samples 49 - 96 82

March 2001 v
G DOE 3 Fully Nested ANOVA for Unplated Halves of Samples 1 - 96 85
H Honeywell Preproduction Experimentation Final Report 87
Abstract
Copper plating is used as a carbon stop-off during the carburization and austenitizationoperations associated with the manufacture of precision gears. The “Low Copper” project'sgoals were to optimize the thickness of copper needed during carburization, and toeliminate the need to re-plate copper prior to austenitizing, via atmosphere control in a rotaryfurnace. Traditionally, plating that is 0.001 to 0.003 inch thick is used as a carbon stop-off.Experimentation was aimed at reducing this thickness to between 0.0001 to 0.0005 inch,roughly an order of magnitude thinner. Three designed experiments were performed by IITResearch Institute. Honeywell Engines & Systems of Phoenix, AZ followed theexperimentation at IIT Research Institute by performing preproduction tests and additionalexperiments. Honeywell also prepared a cost benefit analysis to detail and document theprojected process savings that could be gained by implementation of the technique. Anindustry-wide cost-benefit analysis and implementation plan is included. Annual savingsrealized by pervasive implementation of the technique were estimated at over $1,000,000per year.

March 2001 vi
Executive Summary
Copper plating is used as a carbon stop-off during the carburization operation associatedwith the manufacture of precision gears. It is also used as a diffusion barrier during theaustenitization operation associated with the press quenching of precision gears. Thisproject’s goals were to optimize the thickness of copper needed during carburization, and toeliminate the need to re-plate copper prior to austenitizing, via atmosphere control in a rotaryfurnace. Traditionally, plating that is 0.001 inch to 0.003 inch thick is used as a carbon stop-off. Experimentation was aimed at reducing this thickness to between 0.0001 inch and0.0005 inch, roughly an order of magnitude thinner.
To accomplish this goal, three experiments were performed. The first experimentinvestigated the ability of thin copper plating to successfully stop-off carbon during a typicalcarburization cycle. The second experiment explored further and attempted to use thincopper during the entire heat treating cycle. The third experiment was used to verify theresults of the first two and to explore new variables of interest brought out by the initialexperimentation.
Honeywell Engines & Systems of Phoenix, AZ followed the experimentation at IIT ResearchInstitute by performing preproduction tests and additional experiments. Honeywell alsoprepared a cost benefit analysis to detail and document the projected process savings thatcould be gained by implementation of the technique.
The problem was modeled using Fick’s diffusion laws. Diffusion of carbon through thecopper matrix was identified as an unlikely failure point for the stop-off. However, porosity inthe plating was identified as the most likely route for carbon diffusion into the steelsubstrate.
A cost-benefit analysis was performed to gauge industrial savings through implementationof the technique. Manufacturers that use selective copper plating to produce componentswere contacted by telephone and interviewed. A savings matrix was produced from theseinterviews. Total savings were estimated at over $1,000,000 per year.
An implementation plan, detailing steps that a manufacturer would have to perform toimplement the technique, was developed. This technology has the benefit of reducing theamount of copper anode used, reducing time spent in copper plating baths, and eliminatingmid-process cleaning, stripping and re-plating operations and their associated cleaningoperations.
This processing technique has application to the manufacture of any selectively carburizedcomponent composed of SAE/AISI 9310H steel. U.S. Army weapon systems usingcomponents of these types include the Black Hawk and Apache Longbow rotorcraft, and theF-117A, F-22, B-1B, and F-15 fixed-wing aircraft, among many others.
The analyses performed indicated that copper plating that is 0.0005 inch thick cansuccessfully be used to stop-off carbon in a process cycle comprised of a 1700°Fcarburization operation and a 1525°F austenitization operation under an protectiveatmosphere.

March 2001 vii
List of Figures
Figure 1 – The general cycle for the heat treatment of SAE/AISI 9310H 2
Figure 2 – Copper plated gears 4
Figure 3 - Two methods of applying a selective copper plate to a steel substrate 4
Figure 4 – A generalized selective carburization process for SAE/AISI 9310H 5
Figure 5 - Geometry of DOE 1 samples 12
Figure 6 – Representative micrographs from the DOE 1 microstructural analysis 16
Figure 7 – Geometry of DOE 2 samples 20
Figure 8 – Representative macroetched DOE 2 samples 20
Figure 9 – DOE 2 main effects plots 26
Figure 10 – Pareto chart of the standardized effects in DOE 2 28
Figure 11 – Secondary effects plot for DOE 2 28
Figure 12 – Graphs of the DOE 2 microhardness data 29
Figure 13 – Geometry of DOE 3 samples 37
Figure 14 – Main effects plots for DOE 3 41
Figure 15 – Secondary effects plot for DOE 3 analysis A 42
Figure 16 – Pareto chart of the standardized effects in DOE 3 43
Figure 17 – Model of carbon diffusion through copper plating 47
Figure 18 – One- and three-dimensional diffusion into a substrate 48

March 2001 viii
List of Tables
Table 1 – Chemical composition of SAE/AISI 9310H steel 1
Table 2 – Breakdown of the conventional selective carburization process 6
Table 3 – DOE 1 experimental matrix 11
Table 4 – Statistics from the DOE 1 surface roughness analysis (I) 14
Table 5 – Statistics from the DOE 1 surface roughness analysis (II) 15
Table 6 – Mass gain of each of the DOE 1 samples after plating 15
Table 7 – Macroetch procedure to check for carbon leakage 15
Table 8 – DOE 2 experimental matrix 18
Table 9 – Results of the DOE 2 macroetch 22
Table 10 – Averaged hardness readings on DOE 2 samples 22
Table 11 – DOE 3 test matrix (I) 33
Table 12 – DOE 3 test matrix (II) 35
Table 13 – Results of the DOE 3 macroetch 40
Table 14 – Hardness readings from DOE 3 samples 44
Table 15 – The U.S. Army helicopter fleet and their respective gear sets 50
Table 16 – Cost benefit analysis 51
Table 17 – Manufacturers contacted in the cost-benefit analysis 53

Final Report
March 2001 1
Technical/Manufacturing Methods Report
IntroductionPrecision gears used in military helicopter powertrains are composed of steel that must beheat treated to impart necessary material properties for peak performance. Currently, themost widely used steel in these powertrains is SAE/AISI 9310H. The chemical compositionof SAE/AISI 9310H is listed in Table 1.
Properties that these gears must possess include a hard wear surface, high fracturetoughness in both the surface and the core, and high strength. A hard surface is needed toprevent wear of mating surfaces in a gear train. High surface fracture toughness is neededto prevent cracking of the surface and the associated lowered performance, accelerateddegradation of the part and mating parts, and promotion of through-cracking of the part.High core fracture toughness is necessary to prevent through-cracking of the part. Highstrength is needed to carry the tremendous loads demanded by the military application.
The aforementioned properties are usually imparted into a steel surface and core in thepresence of a controlled-composition gas or atmosphere via deliberate heating and coolingcycles. The generalized heat treatment cycle for SAE/AISI 9310H used in precision gearscan be found in Figure 1.
Each step in the process illustrated in Figure 1 can be broken down further. Additionally,there are intermediate steps that are not mentioned. The process described is a generaloverview of what needs to be done to a gear to impart beneficial properties into it. It does notdescribe the specific process for any particular component. To fill this gap and to narrowthe focus of this paper, a process is now described that applies to a specific class ofcomponents: selectively carburized, press-quenched precision gears.
Table 1 - Chemical composition of SAE/AISI 9310H steel [Tim96].
Element Weight % (low/high)C 0.07/0.13Mn 0.40/0.70Cr 1.00/1.45Ni 2.95/3.55Mo 0.08/0.15Si 0.15/0.35P 0.035 maxS 0.040 maxCu 0.350 maxFe BalanceOther …

Final Report
March 2001 2

Final Report
March 2001 3
Figure 1 – The general cycle for the Heat Treatment of SAE/AISI 9310H.
Selective carburization is the process by which specific areas of the surface of a componentare carburized, while others are not. The carburized surface is conventionally referred to asthe “case”. Carbon that would normally be diffusing into the substrate during carburization is“stopped-off”, or prevented from diffusing into chosen areas. There are two major reasonsfor performing selective carburization:
1) Minimization of distortion during the manufacturing process.
2) The alteration and control of surface toughness of selected areas of the gear forthe benefit of in-service properties.
Both reasons fall into the subjects of manufacturing and design-for-service.
Distortion during heat treatment can be defined as any change in geometry of the incomingcomponent. Distortion can occur during manufacturing due to the following fundamentalcauses [TH97]:
1) Relief of residual stresses
2) Thermal expansion/contraction
3) Phase transformations
Distortion due to phase transformations is what the process of selective carburizing tries toprevent. By driving carbon into a surface, the surface will expand due simply to the increasedcarbon content. It will also expand if the surface is allowed to cool quickly, as in quenching.
Normalize,Quench,Temper
(Pretreatment)
Carburize Slow CoolSubcritical
Anneal
Austenitize,Quench
(Hardening)
ColdTreatment
Temper Inspect

Final Report
March 2001 4
A volumetric increase is associated with the transformation from austenite, which is stableat and above about 1475°F (for an SAE/AISI 9310H surface with approximately 0.85%carbon), into martensite. Because this surface has boundary conditions that prevent it fromexpanding only outwards into free space, residual stresses (usually compressive in thevicinity of the surface) form in the case as well as any surrounding volume of non-carburizedsurface and core. These stresses, depending on the design geometry of the part, cancause a change in the final geometry. One can control the extent of the distortion by indirectlycontrolling the amount of expansion. This is accomplished by carefully selecting the surfacearea that it is necessary to carburize.
This process of carburizing only selected areas of the surface has the added benefit ofretaining the fracture toughness of the non-carburized surfaces. The retention of fracturetoughness is due the formation of low-carbon martensite rather than high-carbonmartensite in these areas during subsequent austenitizing and quenching.
Press quenching is a process in which an austenitized part is placed in a quenchingapparatus that constrains the part between 2 pulsating dies while at the same timeperforming an oil quench via specially designed channels within the die. The purpose ofthe die is to fix the position of the part when phase transformations occur so that distortionis minimized.
Together, the processes of selective carburizing and press quenching provide for a methodto minimize distortion and create both hard surfaces and surfaces with high fracturetoughness. The two processes can obviously also be used separately. For example, aselectively carburized part can be carburized, direct quenched (rather than slow cooled,austenitized and quenched) and tempered. Alternatively, a part can have all of its surfacearea carburized and be press quenched to minimize distortion.
There are two methods by which steel surfaces may be selectively carburized [INFAC95].One uses stop-off paint [Pre98], and the other uses copper plating. Stop-off paint consists ofrefractory substances and a binder of glass that can be brushed onto the surface of a partwhere carbon is to be stopped-off. Cyanide-based copper plating is used as a stop-offmaterial because of the low solubility and diffusivity of carbon in copper. Unfortunately,precise quantification of the diffusivity of carbon in copper is not readily available inpublished literature, which makes modeling and prediction of the system difficult [HKK88].Diffusion of carbon through copper is known however to be small for typical carburizationcycles. This modeling problem is further discussed in a subsequent section of this paper.
Copper plating via cyanide-based baths is generally a twofold process. First a copper strikeis applied. The copper strike applies quickly and adheres easily to the surface, but cannotapply thicknesses greater than about 0.0001 inch because layer growth drops as thethickness increases. Secondly, the part is placed in a copper bath that has the capability ofapplying thicker coats, usually up to a few thousandths of an inch. Pictures of gears platedto typical copper plating thickness are shown in Figure 2. A more detailed version of theprocess is broken down in Figure 3.

Final Report
March 2001 5
Figure 2 – Gears that have been copper plated to (a) 0.001-0.003 inch selectively and (b)0.0003-0.0005 inch non-selectively.
(a)
(b)
Figure 3 - Two methods of applying a cyanide-based selective copper plate to a steelsubstrate. (a) Mask and plate. (b) Plate, mask and strip.
Clean Part Mask Areasto be
Carburized
Plate inCopper Strike
Bath
Plate inCopper Bath
Rinse
Clean toRemove any
MaskantAdhesive
RemoveMaskant
Clean PartPlate in
Copper StrikeBath
Plate inCopper Bath
Mask Areas tobe Stopped Off
Strip Copper
Clean toRemove any
MaskantAdhesive
Rinse RemoveMaskant

Final Report
March 2001 6
Problem StatementTo reduce the cost of the manufacture of precision gears it would be beneficial to reduce oreliminate intermediate process steps. The carburization process for SAE/AISI 9310H steelwas summarized in Figure 1. By choosing to manufacture a gear using selectivecarburization, additional process steps must be added to the process. Figure 4 is an outlineof the selective carburization process for SAE/AISI 9310H.
The intermediate processing steps of washing, grit blasting, stripping and re-plating addconsiderable cost to the process. It is desirable to find a way to either eliminate or minimizethe cost associated with the additional processing steps. To examine the problem moreclosely, one must understand the reasons associated with the steps in the current process.Table 2 provides a concise breakdown of the selective carburization process and reasonsfor each step.
Figure 4 - A generalized selective carburization process for SAE/AISI 9310H.
SelectivelyCopper Plate Partto 0.001 − 0.003
in.
Carburize(1650 – 1750°F)
Slow Cool to1450°F
Equalize at1450°F for 1 hr
Slow Cool to450°F undera ProtectiveAtmosphere
Cool in Air toAmbient
Temperature
Strip CopperPlating
Copper PlatePart to
0.0005 in.
Austenitize(1525°F)
PressQuench
ColdTreatment(-120°F)
Temper(300°F)
Clean Strip CopperPlating
Clean

Final Report
March 2001 7
Final Report
March 2001 8
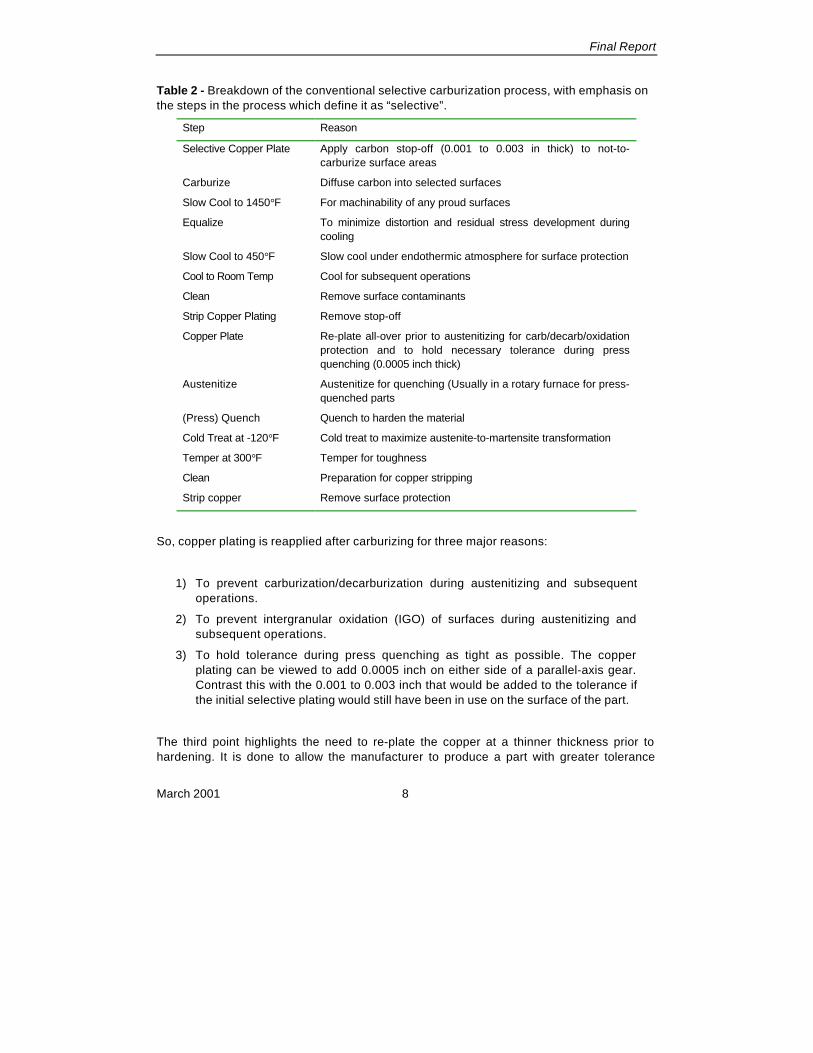
Table 2 - Breakdown of the conventional selective carburization process, with emphasis onthe steps in the process which define it as “selective”.
Step Reason
Selective Copper Plate Apply carbon stop-off (0.001 to 0.003 in thick) to not-to-carburize surface areas
Carburize Diffuse carbon into selected surfaces
Slow Cool to 1450°F For machinability of any proud surfaces
Equalize To minimize distortion and residual stress development duringcooling
Slow Cool to 450°F Slow cool under endothermic atmosphere for surface protection
Cool to Room Temp Cool for subsequent operations
Clean Remove surface contaminants
Strip Copper Plating Remove stop-off
Copper Plate Re-plate all-over prior to austenitizing for carb/decarb/oxidationprotection and to hold necessary tolerance during pressquenching (0.0005 inch thick)
Austenitize Austenitize for quenching (Usually in a rotary furnace for press-quenched parts
(Press) Quench Quench to harden the material
Cold Treat at -120°F Cold treat to maximize austenite-to-martensite transformation
Temper at 300°F Temper for toughness
Clean Preparation for copper stripping
Strip copper Remove surface protection
So, copper plating is reapplied after carburizing for three major reasons:
1) To prevent carburization/decarburization during austenitizing and subsequentoperations.
2) To prevent intergranular oxidation (IGO) of surfaces during austenitizing andsubsequent operations.
3) To hold tolerance during press quenching as tight as possible. The copperplating can be viewed to add 0.0005 inch on either side of a parallel-axis gear.Contrast this with the 0.001 to 0.003 inch that would be added to the tolerance ifthe initial selective plating would still have been in use on the surface of the part.
The third point highlights the need to re-plate the copper at a thinner thickness prior tohardening. It is done to allow the manufacturer to produce a part with greater tolerance

Final Report
March 2001 9
control; The copper plating, especially at thicknesses on the order of a few thousandths onan inch, is not necessarily of uniform thickness. These cleaning, stripping and re-platingoperations add additional cost to the product. It would be desirable if these steps did nothave to be performed at all. To accomplish this one must show that:
1) Thin copper plating (0.0005 inch) is capable of stopping-off carbon in thecarburizing process. (Reason 3)
2) The carbon level of exposed surfaces and copper plated surfaces are not affectedin the austenitizing and subsequent operations. The atmosphere in theaustenitizing furnace needs to be protective in order to accomplish this. (Reason1)
3) Oxidation of the exposed surfaces and copper plated surfaces can be adequatelycontrolled. The atmosphere in the austenitizing furnace needs to be protective inorder to accomplish this. (Reason 2)
Purpose and GoalThe purpose of this project was to examine the effectiveness of cyanide-based thin copperplating as a carbon stop-off during the selective carburizing process of AISI/SAE 9310Hsteel. Further, the purpose was to examine the factors affecting the level of surface carbon inthe austenitizing furnace, specifically, the effect of the carbon potential of the atmosphere inthe austenitizing furnace.
The goal of the project was to show that thin copper plating (between 0.0003 and 0.0005inch thick) could be used to selectively carburize a part, and that no further platingoperations would be needed to successfully complete the heat treatment of the part. [HT92]has stated that 0.0005 in plating is adequate to stop-off carbon as long as the copper is of afine grained form, demonstrating that a thin (or “low”) copper technique is feasible.
Project MethodologyThere were six major steps in the technology development:
1) State of the Art Review (SOAR)
2) Design of Experiment 1 (DOE 1)
3) Design of Experiment 2 (DOE 2)
4) Design of Experiment 3 (DOE 3)
Final Report
March 2001 10
5) Preproduction tests at Honeywell Engines & Systems1
6) Construction of a Diffusion Model
The purpose of the SOAR was to examine current industry practice in the field of selectivecarburizing. It was composed of three elements: a literature search, an industry benchmarkand a report.
DOEs 1, 2 and 3 each examined variables thought to affect the properties of the testedparts. DOE 1 was used as a screening experiment for an isolated carburization heattreatment. The purpose of a screening experiment is to “screen” out what the major factorsare in a process. DOE 2 was also used as a screening experiment, in this case, as ascreen for the whole heat treatment process. DOE 3 then was used to refine the factors andlevels in DOE 2 and to verify the findings of DOE 2.
The pre-production tests at Honeywell served the purpose of moving from a laboratory-scaleexperiment to a production-scale experiment. Honeywell provided a test bed for the thincopper technique. Honeywell also provided the copper plating used in IITRI'sexperimentation.
The diffusion system was modeled as part of the project to gain a better understanding ofthe mechanisms that may be playing a role in the copper plating's failure.
State of the Art ReviewThe SOAR report is included herein as Appendix A. A summary of the research leading tothe report follows.
The SOAR, comprised a literature search, an industry benchmark and a report. It wasconducted at the very beginning of the project before any experimentation began. The reportwas to serve as a benchmark for further technological development.
A literature search was conducted to see if there was any published literature on thefollowing topics:
1) Selective Carburizing
2) Heat Treatment Processes of SAE/AISI 9310H
3) Press Quenching
4) Copper Plating Processes
1 Honeywell Engines & Systems will simply be referred-to as “Honeywell” for the remainder of thisreport for brevity.

Final Report
March 2001 11
The industry benchmark involved visits to selected manufacturers and tours of their platingand heat treating operations. Visits were made to Bell Helicopter Textron in Fort Worth,Texas, Rolls-Royce Allison Engines in Indianapolis, Indiana and Honeywell Engines &Systems in Phoenix, Arizona
A report was then generated based on the results of the literature search and industrybenchmark.

Final Report
March 2001 12
Experimentation
DOE 1
Overview
The purpose of DOE 1 was to test whether thin copper plating could be used to effectivelystop-off carbon during a typical SAE/AISI 9310H steel carburization cycle. The goal was toshow that thin copper plating in the thickness range of 0.0001 to 0.0005 inch could be usedfor this purpose.
Discussion between IITRI and Honeywell personnel led to the following variables beingexamined in the experiment:
1) Copper Plating Thickness
2) Carburizing Temperature
3) Case Depth / Time in the Furnace
4) Surface Finish
5) Handling
These factors were deemed to have the most influential affects on the final output of theselective carburizing process. Copper plating thickness was an obvious choice as a factorto examine. The choices of the other factors revolved around what IITRI and Honeywellpersonnel thought may influence failure of the plating. Failure, in this sense, is thepenetration of carbon through the copper stop-off and into the steel substrate. Carburizingtemperature was chosen as a blocking factor. Blocking allows one to examine a range ofprocess levels that the proposed process will be exposed to in a real production situation,but are not believed to have different influences at different levels.
The factors “Case Depth” and “Time in the Furnace” were considered a single variable inthe experiment. The reason for this is because, in general, parts requiring shallower casedepths are processed at lower temperatures for greater control of the case depth.Processing them at the lower temperature requires carburizing them for a longer period oftime due to the lower mobility of carbon at lower temperatures.
Surface finish and handling are more properly referred to as noise variables because theyare not easily or cost-effectively controlled during the manufacturing process.
Once the factors were chosen, levels were set for each of them:
1) Copper Plating Thickness
a) 0.0001 in

Final Report
March 2001 13
b) 0.0003 in
c) 0.0005 in
2) Carburizing Temperature
a) 1650°F
b) 1750°F
3) Case Depth / Time in the Furnace
a) 1650F
i) 0.010 in Case Depth
ii) 0.030 in Case Depth
b) 1750F
i) 0.030 in Case Depth
ii) 0.050 in Case Depth
4) Surface Finish
a) Smooth (Incoming material surface)
b) Rough (Machined surface)
5) Handling
a) Careful
b) Rough
The resultant test matrix can be found in Table 3.
Again, examination of the factors/levels reveals that shallower-cased parts were processedat the lower carburizing temperature.

Final Report
March 2001 14
Table 3 - DOE 1 experimental matrix.
SampleNumber
PlatingThickness [in]
Case Depth [in] /Temperature [°F]
Careful / RoughHandling
01 0.0001 0.030/1650 R
02 0.0003 0.010/1650 C
03 0.0001 0.050/1750 R
04 0.0005 0.010/1650 R
05 0.0003 0.030/1650 R
06 0.0005 0.030/1650 R
07 0.0001 0.010/1650 C
08 0.0005 0.030/1750 C
09 0.0005 0.030/1750 R
10 0.0005 0.050/1750 C
11 0.0001 0.010/1650 R
12 0.0003 0.050/1750 R
13 0.0001 0.030/1750 R
14 0.0005 0.030/1650 C
15 0.0005 0.010/1650 C
16 0.0003 0.030/1650 C
17 0.0001 0.050/1750 C
18 0.0001 0.030/1650 C
19 0.0003 0.010/1650 R
20 0.0005 0.050/1750 R
21 0.0003 0.050/1750 C
22 0.0001 0.030/1750 C
23 0.0003 0.030/1750 C
24 0.0003 0.030/1750 R
Final Report
March 2001 15
Experimental Procedure
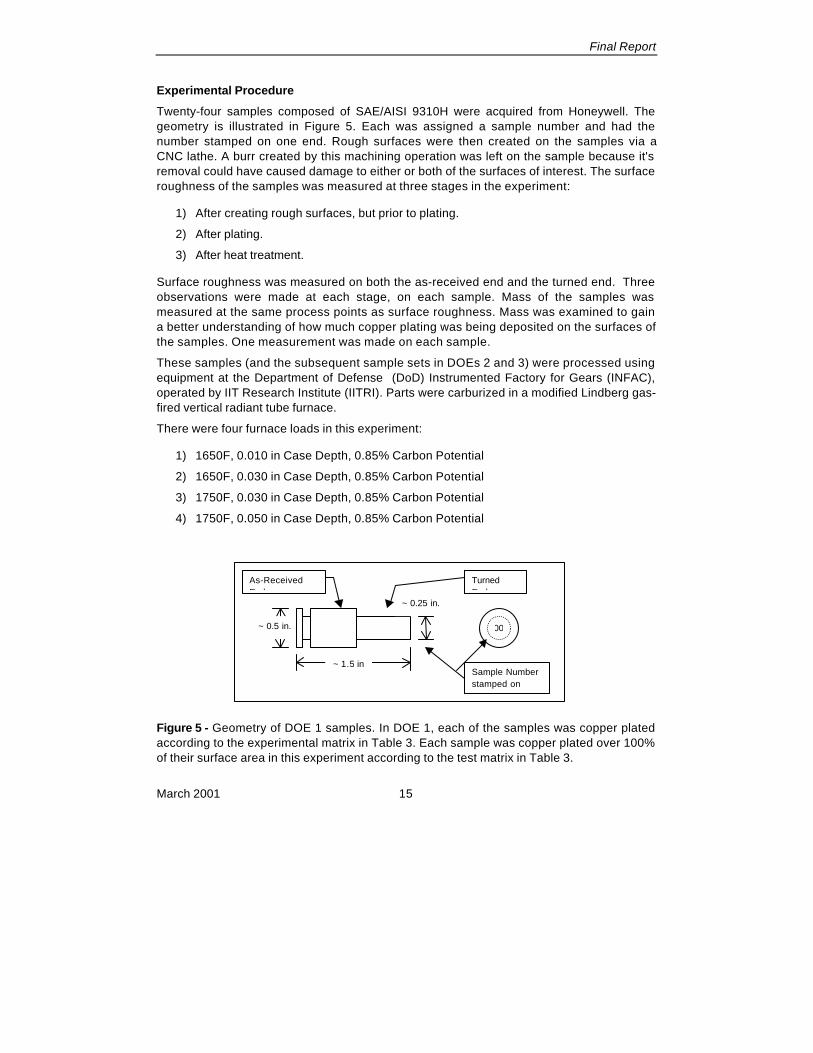
Twenty-four samples composed of SAE/AISI 9310H were acquired from Honeywell. Thegeometry is illustrated in Figure 5. Each was assigned a sample number and had thenumber stamped on one end. Rough surfaces were then created on the samples via aCNC lathe. A burr created by this machining operation was left on the sample because it'sremoval could have caused damage to either or both of the surfaces of interest. The surfaceroughness of the samples was measured at three stages in the experiment:
1) After creating rough surfaces, but prior to plating.
2) After plating.
3) After heat treatment.
Surface roughness was measured on both the as-received end and the turned end. Threeobservations were made at each stage, on each sample. Mass of the samples wasmeasured at the same process points as surface roughness. Mass was examined to gaina better understanding of how much copper plating was being deposited on the surfaces ofthe samples. One measurement was made on each sample.
These samples (and the subsequent sample sets in DOEs 2 and 3) were processed usingequipment at the Department of Defense (DoD) Instrumented Factory for Gears (INFAC),operated by IIT Research Institute (IITRI). Parts were carburized in a modified Lindberg gas-fired vertical radiant tube furnace.
There were four furnace loads in this experiment:
1) 1650F, 0.010 in Case Depth, 0.85% Carbon Potential
2) 1650F, 0.030 in Case Depth, 0.85% Carbon Potential
3) 1750F, 0.030 in Case Depth, 0.85% Carbon Potential
4) 1750F, 0.050 in Case Depth, 0.85% Carbon Potential
Figure 5 - Geometry of DOE 1 samples. In DOE 1, each of the samples was copper platedaccording to the experimental matrix in Table 3. Each sample was copper plated over 100%of their surface area in this experiment according to the test matrix in Table 3.
00~ 0.5 in.
~ 1.5 in
~ 0.25 in.
Sample Numberstamped on
TurnedEnd
As-ReceivedEnd

Final Report
March 2001 16
The parts were heat treated as follows:
1) The parts were racked according to a randomized design; the parts were hung usingcopper wire
2) The furnace was brought to temperature
3) The carbon potential was set and allowed to stabilize
4) The parts were introduced into the furnace heat zone
5) The parts were carburized for a prescribed amount of time
6) The parts were brought into the furnace vestibule and allowed to cool toapproximately 500°F
7) The parts were brought out of the vestibule and allowed to finish cooling
Surface Roughness Analysis
Rough surfaces were generated using a CNC lathe. The surface roughness of thesamples, on both the as-received and turned ends, was measured using a TSKprofilometer. Three readings were taken on each surface along the axial direction. Thestatistic of interest was R a. The profilometer was previously calibrated by factory technicians.Calibration was checked via a calibrated testing block. The raw data can be found in TableB1 (Appendix B). Statistics from these data are displayed in Table 4.
Data was also gathered on each of the samples after they had been copper plated. The rawdata for these measurements can be found in Table B2 (Appendix B). Statistics from thesedata are displayed in Table 5.
A slight increase in surface roughness was observed after copper plating.
Mass Analysis
The mass of each of the samples was measured at the three process points mentionedbefore. The raw data obtained can be found in Table C1 (Appendix C). The mass gain afterplating, i.e. the increase in sample mass due to copper plating, is displayed in Table 6. Themass gain after carburizing was analyzed and found to be below the measurementcapability of the system. The data obtained, however, did seem to indicate a positiverelationship with increasing time in the furnace.
Macroetch Analysis
After heat treatment, surface roughness analysis and mass analysis, a macroetch wasperformed to check for carbon on the surface of the parts. The procedure used can be foundin Table 7. No evidence was found for carbon penetration. Some spots that were found onthe surface were determined to be due to contact with the rack during carburizing. Thesamples were originally hung, but the copper wire holding them did creep during the cycle.
Final Report
March 2001 17
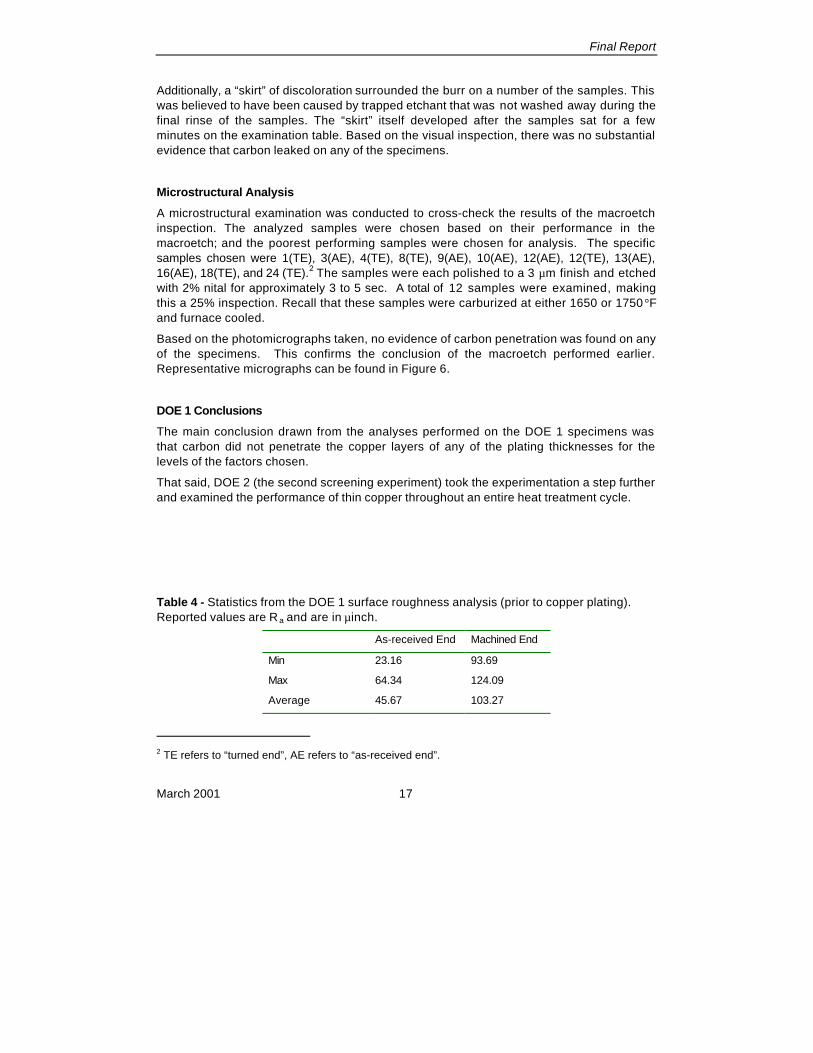
Additionally, a “skirt” of discoloration surrounded the burr on a number of the samples. Thiswas believed to have been caused by trapped etchant that was not washed away during thefinal rinse of the samples. The “skirt” itself developed after the samples sat for a fewminutes on the examination table. Based on the visual inspection, there was no substantialevidence that carbon leaked on any of the specimens.
Microstructural Analysis
A microstructural examination was conducted to cross-check the results of the macroetchinspection. The analyzed samples were chosen based on their performance in themacroetch; and the poorest performing samples were chosen for analysis. The specificsamples chosen were 1(TE), 3(AE), 4(TE), 8(TE), 9(AE), 10(AE), 12(AE), 12(TE), 13(AE),16(AE), 18(TE), and 24 (TE).2 The samples were each polished to a 3 µm finish and etchedwith 2% nital for approximately 3 to 5 sec. A total of 12 samples were examined, makingthis a 25% inspection. Recall that these samples were carburized at either 1650 or 1750 °Fand furnace cooled.
Based on the photomicrographs taken, no evidence of carbon penetration was found on anyof the specimens. This confirms the conclusion of the macroetch performed earlier.Representative micrographs can be found in Figure 6.
DOE 1 Conclusions
The main conclusion drawn from the analyses performed on the DOE 1 specimens wasthat carbon did not penetrate the copper layers of any of the plating thicknesses for thelevels of the factors chosen.
That said, DOE 2 (the second screening experiment) took the experimentation a step furtherand examined the performance of thin copper throughout an entire heat treatment cycle.
Table 4 - Statistics from the DOE 1 surface roughness analysis (prior to copper plating).Reported values are R a and are in µinch.
As-received End Machined End
Min 23.16 93.69
Max 64.34 124.09
Average 45.67 103.27
2 TE refers to “turned end”, AE refers to “as-received end”.

Final Report
March 2001 18
Standard Deviation 8.58 9.65
Final Report
March 2001 19
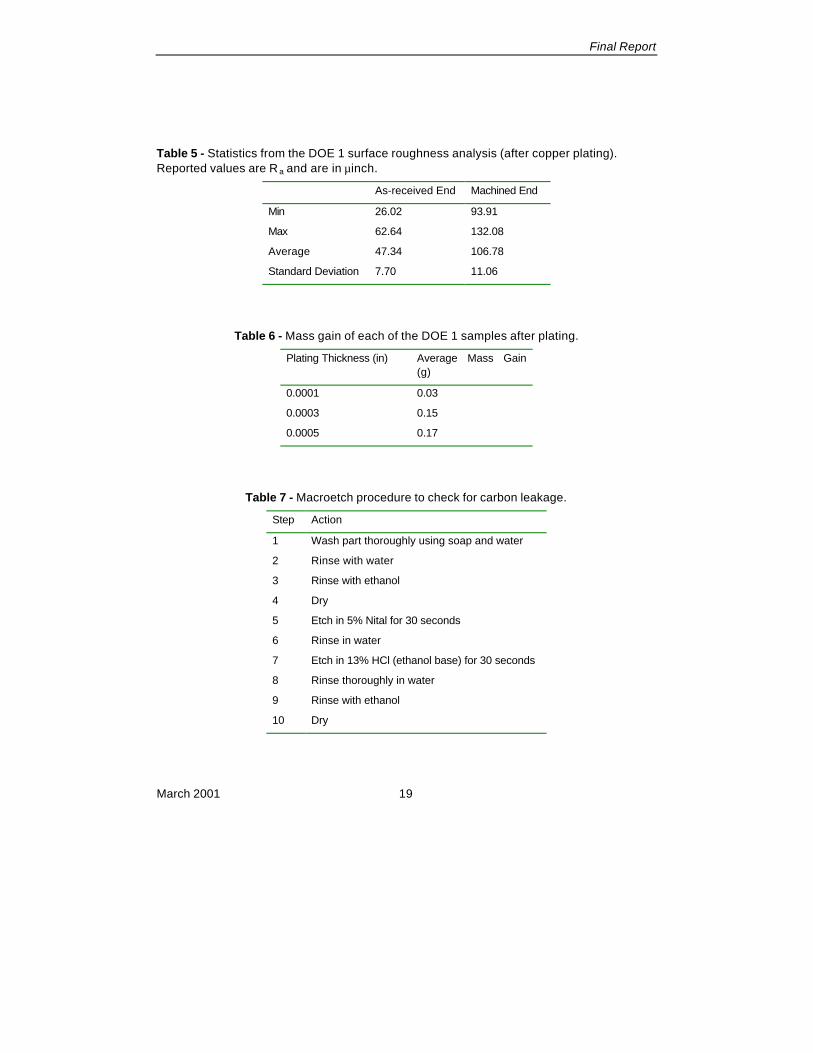
Table 5 - Statistics from the DOE 1 surface roughness analysis (after copper plating).Reported values are R a and are in µinch.
As-received End Machined End
Min 26.02 93.91
Max 62.64 132.08
Average 47.34 106.78
Standard Deviation 7.70 11.06
Table 6 - Mass gain of each of the DOE 1 samples after plating.
Plating Thickness (in) Average Mass Gain(g)
0.0001 0.03
0.0003 0.15
0.0005 0.17
Table 7 - Macroetch procedure to check for carbon leakage.
Step Action
1 Wash part thoroughly using soap and water
2 Rinse with water
3 Rinse with ethanol
4 Dry
5 Etch in 5% Nital for 30 seconds
6 Rinse in water
7 Etch in 13% HCl (ethanol base) for 30 seconds
8 Rinse thoroughly in water
9 Rinse with ethanol
10 Dry

Final Report
March 2001 20

Final Report
March 2001 21
(a) (b)
(c) (d)
Figure 6 - Representative micrographs from the DOE 1 microstructural analysis. (a) Surfacemicrostructure of sample number 4(TE). (b) Core microstructure of sample number 9(AE).(c) Surface microstructure of sample number 12(TE). (d) Core microstructure of samplenumber 24(TE). All micrographs were taken at 200x magnification.

Final Report
March 2001 22
DOE 2
Overview
The purpose of the second experiment was to examine the performance of thin copper thathad gone through an entire simulated heat treatment cycle.
The goal was to show that thin copper plating is capable of stopping off carbon during anentire heat treatment cycle. As before, discussion between IITRI and Honeywell personnelled to the choices of factors and levels examined in the experiment. The choices were:
1) Case Depth
a) 0.030 in, 1650°F, 0.85% Carbon Potential
b) 0.050 in, 1750°F, 0.85% Carbon Potential
2) Copper Plating Thickness
a) 0.0001 in
b) 0.0005 in
3) Rotary Furnace Carbon Potential (Austenitizing Operation)
a) 0.75%
b) 0.95%
4) Austenitizing Time (Time in the Rotary Furnace)
a) 30 min
b) 90 min
5) Quench Transfer Time
a) 10 sec
b) 30 sec
c) 50 sec
The last factor was considered a noise factor3. The corresponding experimental matrix canbe found in Table 8.
The sample geometry was similar to that of DOE 1 except that new surfaces were notmachined onto the samples. DOE 2 sample geometry can be found in Figure 7.
3 A noise factor is a factor that is either too difficult or too costly to control during normal production, butmay contribute to variation in a process.

Final Report
March 2001 23
Table 8 - DOE 2 experimental matrix. (continued on next page)
SampleNumber
Copper PlatingThickness (in)
Case Depth (in) /Temperature (°F)
Rotary FurnaceCarbon Potential (%)
Austenitizing Time (min)
QuenchTransfer Time
(sec)
1 0.0001 0.030/1650 0.75 90 30
2 0.0001 0.030/1650 0.95 30 10
3 0.0001 0.030/1650 0.75 90 50
4 0.0001 0.050/1750 0.75 30 50
5 0.0001 0.050/1750 0.95 90 10
6 0.0001 0.050/1750 0.95 30 10
7 0.0001 0.030/1650 0.75 30 30
8 0.0001 0.030/1650 0.95 90 50
9 0.0001 0.030/1650 0.75 30 10
10 0.0001 0.050/1750 0.95 30 30
11 0.0001 0.030/1650 0.95 30 30
12 0.0001 0.030/1650 0.95 90 10
13 0.0001 0.050/1750 0.95 30 50
14 0.0001 0.030/1650 0.75 30 50
15 0.0001 0.050/1750 0.75 30 30
16 0.0001 0.050/1750 0.95 90 30
17 0.0001 0.050/1750 0.75 90 10
18 0.0001 0.030/1650 0.75 90 10
19 0.0001 0.050/1750 0.75 90 50
20 0.0001 0.050/1750 0.75 90 30
21 0.0001 0.030/1650 0.95 30 50
22 0.0001 0.030/1650 0.95 90 30
23 0.0001 0.050/1750 0.95 90 50
24 0.0001 0.050/1750 0.75 30 10

Final Report
March 2001 24
Table 8 - DOE 2 experimental matrix. (concluded)
SampleNumber
Copper PlatingThickness (in)
Case Depth (in) /Temperature (°F)
Rotary FurnaceCarbon Potential (%)
Austenitizing Time (min)
QuenchTransfer Time
(sec)
25 0.0005 0.050/1750 0.95 30 30
26 0.0005 0.030/1650 0.75 30 10
27 0.0005 0.030/1650 0.95 90 10
28 0.0005 0.050/1750 0.75 90 30
29 0.0005 0.050/1750 0.75 90 10
30 0.0005 0.030/1650 0.75 90 30
31 0.0005 0.050/1750 0.75 30 50
32 0.0005 0.050/1750 0.95 30 10
33 0.0005 0.030/1650 0.95 30 30
34 0.0005 0.050/1750 0.95 90 50
35 0.0005 0.050/1750 0.95 30 50
36 0.0005 0.030/1650 0.95 90 30
37 0.0005 0.050/1750 0.95 90 10
38 0.0005 0.050/1750 0.75 30 10
39 0.0005 0.030/1650 0.75 90 10
40 0.0005 0.050/1750 0.95 90 30
41 0.0005 0.030/1650 0.75 30 50
42 0.0005 0.030/1650 0.95 90 50
43 0.0005 0.030/1650 0.95 30 10
44 0.0005 0.030/1650 0.75 90 50
45 0.0005 0.030/1650 0.95 30 50
46 0.0005 0.050/1750 0.75 90 50
47 0.0005 0.050/1750 0.75 30 30
48 0.0005 0.030/1650 0.75 30 30
Final Report
March 2001 25
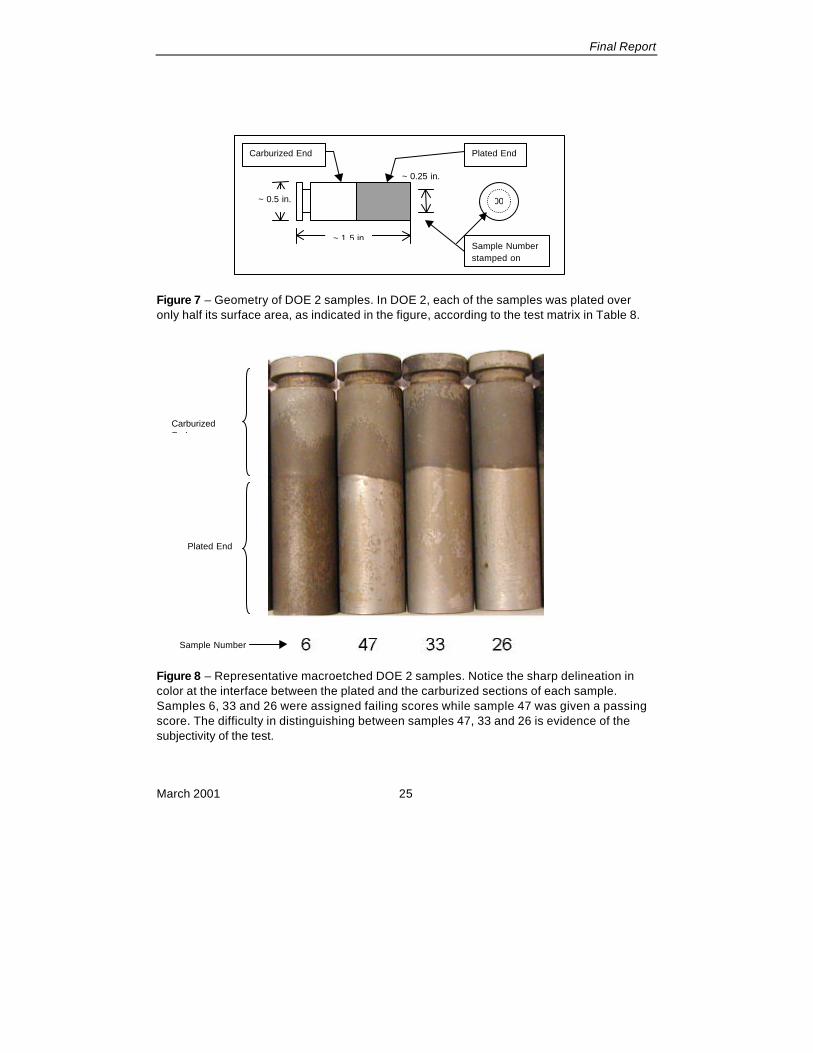
Figure 7 – Geometry of DOE 2 samples. In DOE 2, each of the samples was plated overonly half its surface area, as indicated in the figure, according to the test matrix in Table 8.
Figure 8 – Representative macroetched DOE 2 samples. Notice the sharp delineation incolor at the interface between the plated and the carburized sections of each sample.Samples 6, 33 and 26 were assigned failing scores while sample 47 was given a passingscore. The difficulty in distinguishing between samples 47, 33 and 26 is evidence of thesubjectivity of the test.
CarburizedEnd
Plated End
Sample Number
00~ 0.5 in.
~ 1.5 in
~ 0.25 in.
Sample Numberstamped on
Plated EndCarburized End

Final Report
March 2001 26
Experimental Procedure
The parts were heat treated according to the following schedule, with randomization atappropriate intervals:
1) Carburize (According to the test matrix in Table 8)
2) Slow Cool
3) Subcritical Anneal at 1175°F in Air
4) Austenitize at 1525°F
5) Quench in Oil heated to 120°F
6) Cold Treat at -120°F
7) Temper at 300°F
The press quenching operation usually performed on selectively carburized parts was notperformed in this experiment. A free-quench was determined as adequate.
Data and Analyses
A macroetch was performed, followed by microhardness analysis of the carburized case.The statistical examination used can be applied to almost any experiment. See [BHH78,Mon97] for a thorough review of the techniques used.
Macroetch Analysis
A macroetch was performed on the DOE 2 samples in a manner identical to that performedon the DOE 1 samples. Some samples were found to have evidence of carbon penetrationupon inspection. In this case, each of the samples was given a qualitative pass/fail score todescribe their condition. A score of “pass” was only given to specimens showing noevidence of penetration whatsoever. A failing score was given to samples showing theslightest sign of carbon penetration. In this sense, this test was very discriminative. But, onemust keep in mind that it was also very subjective. The results are tabulated in Table 9.Failing scores in this test correlated to the higher carburizing temperature and the thinnerplating thickness. The influence of carbon potential during austenitizing, austenitizing timeand quench transfer time was found to be minimal based on these data.
Figure 8 is a photograph of a representative set of the macroetched DOE 2 samples.
Final Report
March 2001 27
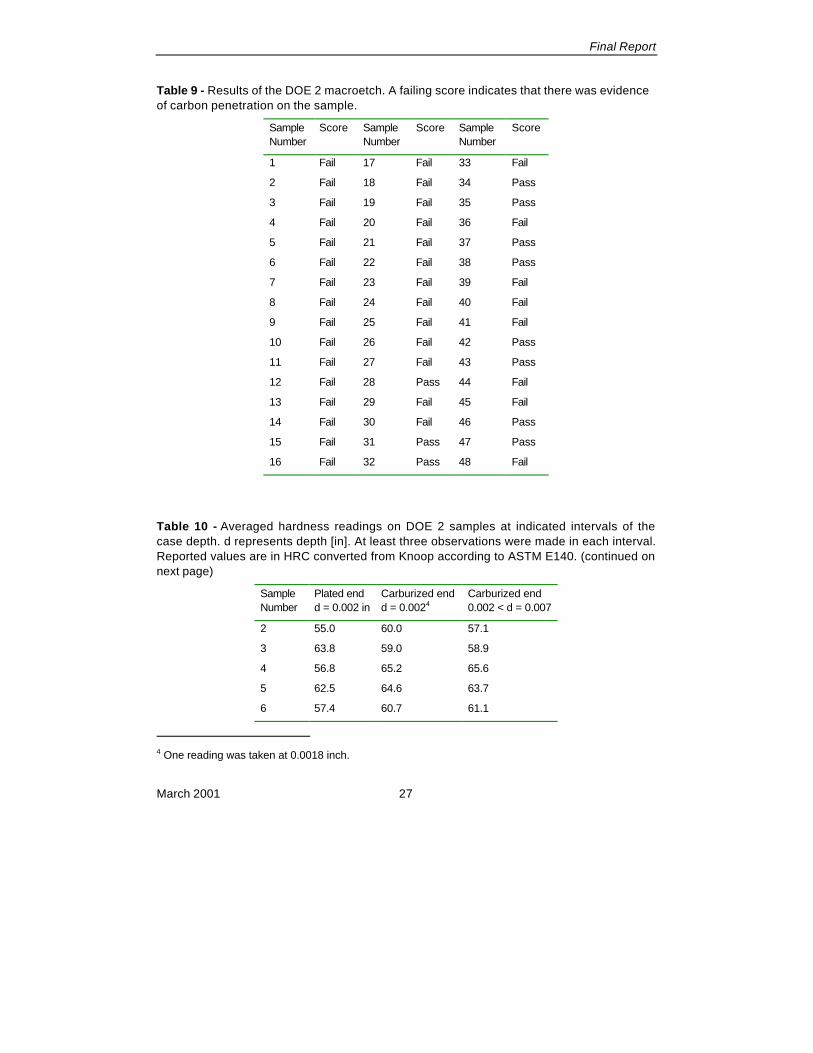
Table 9 - Results of the DOE 2 macroetch. A failing score indicates that there was evidenceof carbon penetration on the sample.
SampleNumber
Score SampleNumber
Score SampleNumber
Score
1 Fail 17 Fail 33 Fail
2 Fail 18 Fail 34 Pass
3 Fail 19 Fail 35 Pass
4 Fail 20 Fail 36 Fail
5 Fail 21 Fail 37 Pass
6 Fail 22 Fail 38 Pass
7 Fail 23 Fail 39 Fail
8 Fail 24 Fail 40 Fail
9 Fail 25 Fail 41 Fail
10 Fail 26 Fail 42 Pass
11 Fail 27 Fail 43 Pass
12 Fail 28 Pass 44 Fail
13 Fail 29 Fail 45 Fail
14 Fail 30 Fail 46 Pass
15 Fail 31 Pass 47 Pass
16 Fail 32 Pass 48 Fail
Table 10 - Averaged hardness readings on DOE 2 samples at indicated intervals of thecase depth. d represents depth [in]. At least three observations were made in each interval.Reported values are in HRC converted from Knoop according to ASTM E140. (continued onnext page)
SampleNumber
Plated endd = 0.002 in
Carburized endd = 0.0024
Carburized end0.002 < d = 0.007
2 55.0 60.0 57.1
3 63.8 59.0 58.9
4 56.8 65.2 65.6
5 62.5 64.6 63.7
6 57.4 60.7 61.1
4 One reading was taken at 0.0018 inch.

Final Report
March 2001 28
8 55.9 64.0 65.1
9 57.5 60.6 59.9
Table 10 - Averaged readings on DOE 2 samples at indicated intervals of the case depth. drepresents depth [in]. At least three observations were made in each interval. Reportedvalues are in HRC converted from Knoop according to ASTM E140. (concluded)
SampleNumber
Plated endd = 0.002 in
Carburized endd = 0.0025
Carburized end0.002 < d = 0.007
12 60.9 62.9 62.4
13 55.6 60.6 60.2
14 55.0 60.7 61.1
17 63.5 59.7 63.9
18 60.6 60.9 61.1
19 61.6 63.3 63.4
21 59.5 61.8 59.6
23 60.8 63.8 65.7
24 60.0 62.7 64.0
26 37.7 63.5 62.7
27 36.3 63.7 62.0
29 37.1 60.4 62.2
31 35.2 63.5 63.3
32 36.3 63.9 62.5
34 36.3 62.5 64.4
35 35.3 62.7 62.2
37 30.6 63.0 64.1
38 35.6 63.5 64.5
39 30.5 60.3 59.9
41 37.0 61.0 61.7
42 34.8 65.4 64.7
43 31.7 62.1 61.1
44 36.6 62.7 65.9
5 One reading was taken at 0.0018 inch.

Final Report
March 2001 29
45 39.1 61.3 63.0
46 36.0 63.0 64.2

Final Report
March 2001 30
Microhardness Analysis
Microhardness data was gathered on 100% of the specimens. The samples were eachpolished to a 3 µm finish and the Knoop Hardness readings were taken using a WilsonTukon Series 200 Microhardness Tester. A 500 g load, and 15 sec dwell time was used.Three microhardness traces were taken on each specimen for case analysis. Case depthwas taken to be the depth into the sample surface at which the hardness dropped to 50HRC. Note that the hardness was determined using the Knoop microhardness test (HK),but all values are reported in Rockwell C-scale hardness (HRC). All values reported in HRCare converted from Knoop microhardness using ASTM E140.
Average hardness values found in specified intervals of the case can be found in Table 10.Only the two extreme levels of the quench transfer time were used in this analysis.
The values in Table 10 were then run through MiniTab Release 12 [Min99]. MiniTab is astatistical package capable of producing factorial main-effects and interaction plots as wellas performing analysis of variance (ANOVA). The main effects determined at each of theintervals in Table 10 are displayed in Figure 9. The main effects indicate that the mostinfluential factor in the experiment was the copper plating thickness, with the 0.0001 inplating failing and the 0.0005 in plating performing well. The interaction plots also show thatthe factors examined in the experiment had little, if any effect on the carburized end of thespecimen. Plating thickness played no role in the performance of the carburized endbecause it had no copper plating on it.
Figure 10 displays a graph of the standardized effects from the plated end of the specimen.This graph shows the relative influence of each of the factors based on the measuredresponse, hardness at a depth of 0.002 inch This chart indicates that the most influentialfactor correlating to increasing hardness (failure) was the copper plating thickness.
ANOVA performed on the data yield a high significance for the copper plating thicknessplaying the most influential role in failure of the plating. The complete fully nested ANOVAgenerated by MiniTab is included in Appendix D. The next most influential effect was theinteraction of copper plating thickness and the time spent in the rotary furnace: Themeasured value of microhardness increased with thinner plating and longer time spent inthe rotary furnace. This effect was, however, negligible compared to the effect of copperplating thickness alone. Figure 11 displays this secondary interaction plot and shows thisrelationship.
The microhardness data collected was plotted to gain a qualitative understanding of theresponse of the material to the levels of the factors examined in the experiment. Figure 12displays the graphs generated. Figure 12(a) displays the data obtained in the DOE 2microhardness analysis, split across the copper plating levels in the test matrix. Curveswere fit to the data to gain a qualitative understanding of the results. The trendlines on eachgraph was subjectively fit using regression routines in Microsoft Excel. Trendlines for thedata obtained from the carburized ends (designated CE on the graphs) of the specimenswere fit using polynomials. Similarly, trendlines for the data obtained from the plated ends of

Final Report
March 2001 31
the specimens were fit using the power equation, bcxy = . The only exception to this wasthe data for the plated end (0.0001 inch) in Figure 12(a), which was fit using a polynomial.
Figure 12(a) shows that the plated end of the specimens plated to 0.0001 inch werecarburized to a case depth of 0.006 inch The trendline for the data obtained from the platedend of the specimens plated to 0.0005 inch shows a downward trend near the surface. Thiswas determined to be due to data that was taken too close to the surface (0.002 inch) of the“soft” end. Notice the wide spread in the data obtained near the surface and the subsequent“thinning” of the spread as depth increases.
Figure 12(b), a similar correlation graph for the effect of carburizing potential in theaustenitizing furnace (rotary furnace). This graph shows no substantial correlation betweeneither of the levels, 0.75% and 0.95%.
Figure 12(c) shows trendlines for the data split across the different carburizing levels. Thecase depths achieved in the experimentation were 0.026 inch and 0.039 inch, compared tothe 0.030 inch and 0.050 inch in the test matrix. The graph shows no correlation betweenthe carburizing temperature / case depth on the plated end.
Figure 12(d) shows the effect of time spent in the austenitizing furnace on the plated end ofthe specimens. It can be seen from the graph that longer time spent in the rotary furnaceleads to greater carburizing penetration, as one would expect from Fick's diffusion relations[Gli00, KY87].
In Figure 12(e), the data is split across the quench transfer times tested in the experiment.No differences are evident in the trendlines fit to the data, meaning that the time it takes forthe part to leave the protective atmosphere of the austenitizing furnace can vary between 10and 50 sec. (inclusive) with no detrimental affects to the hardness of the part surface.
DOE 2 Conclusions
The main conclusion from DOE 2 was that the 0.0001 inch copper plating failed in anSAE/AISI 9310H heat treatment cycle, while 0.0005 inch plating performed as required.Secondary conclusions were that the factors of rotary furnace carbon potential, time in therotary furnace, and quench transfer time did not play a significant role in the performance ofthe copper plating. Neither did these factors play a significant role in the responsemeasured on the carburized end of each specimen, as evidenced by the Pareto chart inFigure 10. From those conclusions, it can be stated that (assuming all the relationships arelinear, as assumed in the analysis) the variables examined could be set anywhere withinthe bounds of the levels examined and yield adequate performance.
The parts were visually inspected after each major operation during the experimentation. Ofnote is the inspection following the subcritical-anneal. Visual inspection following thesubcritical-anneal step revealed evidence of spalling of the copper plating. It wasconjectured that this may be due to the air atmosphere that the anneal is performed under.Because this particular operation is not always performed on parts , and because of theevidence of spalling at this process point, this was chosen as a factor to examine in DOE 3.

Final Report
March 2001 32
(a)
(b)
Figure 9 - Main effects plots for each of the intervals of values reported in Table 10. Factorsplotted (from left to right) are: copper plating thickness (CPT), rotary furnace carbon potential(RFCP), austenitizing time (TIRF), and quench transfer time (QTT). (a) Plated end at d ≤0.002. (b) Carburized end at d ≤ 0.002. (c) Carburized end at 0.002 < d ≤ 0.007. Notice thedifference in the ordinate scales between the three plots. (continued on next page)

Final Report
March 2001 33
(c)
Figure 9 - Main effects plots for each of the intervals of values reported in Table 10. Factorsplotted (from left to right) are: copper plating thickness (CPT), rotary furnace carbon potential(RFCP), austenitizing time (TIRF), and quench transfer time (QTT). (a) Plated end at d =0.002. (b) Carburized end at d = 0.002. (c) Carburized end at 0.002 < d = 0.007. Notice thedifference in the ordinate scales between the three plots. (concluded)

Final Report
March 2001 34
Figure 10 – Pareto chart of the standardized effects in DOE 2 based on microhardness datataken at a depth of 0.002 inch from the copper plated end of the specimen. This chartindicates that factor A, copper plating thickness, was the most influential in failure of theplating.
Figure 11 – Secondary Effects Plot highlighting the correlation between copper platingthickness and time spent in the rotary furnace. The measured value of microhardnessincreased with thinner plating and longer time spent in the rotary furnace, as evidenced bythe diverging gap between the two curves.
A = Copper Plating Thickness
B = Rotary Furnace CarbonPotential
C = Austenitizing Time
D = Quench Transfer Time

Final Report
March 2001 35
Case Hardness Profile, Plating Thickness Correlation
25
30
35
40
45
50
55
60
65
70
0
0.0
05
0.0
1
0.0
15
0.0
2
0.0
25
0.0
3
0.0
35
0.0
4
0.0
45
0.0
5
0.0
55
0.0
6
0.0
65
Depth (inches)
Har
dnes
s (H
RC
)
CE (0.0001")
CE (0.0005")
PE (0.0001")
PE (0.0005")
(a)
Case Hardness Profile, Rotary Furnace Carbon Potential Correlation
25
30
35
40
45
50
55
60
65
70
0
0.00
5
0.01
0.01
5
0.02
0.02
5
0.03
0.03
5
0.04
0.04
5
0.05
0.05
5
0.06
0.06
5
Depth (inches)
Har
dnes
s (H
RC
)
CE RFCP=0.75%
CE RFCP=0.95%
PE RFCP=0.75%PE RFCP=0.95%
(b)
Figure 12 – Graphs of the DOE 2 microhardness data. These plots illustrate a qualitativeanalysis of the main effects in the DOE. All values are in HRC, converted from HK usingASTM E140. CE refers to the carburized-end, PE to the plated-end. (continued on next page)
CE (0.0005")
CE (0.0001")PE (0.0001")PE (0.0005")
CE(0.75%)
CE(0.95%)
PE(0.75%)
PE(0.95%)

Final Report
March 2001 36
Case Hardness Profile, Carburizing Temperature / Case Depth Correlation
25
30
35
40
45
50
55
60
65
70
0
0.00
5
0.01
0.01
5
0.02
0.02
5
0.03
0.03
5
0.04
0.04
5
0.05
0.05
5
0.06
0.06
5
Depth (inches)
Har
dnes
s (H
RC
)
CE CT=1650
CE CT=1750
PE CT=1650PE CT=1750
(c)
Case Hardness Profile, Time in Rotary Furnace Correlation
25
30
35
40
45
50
55
60
65
70
0
0.00
5
0.01
0.01
5
0.02
0.02
5
0.03
0.03
5
0.04
0.04
5
0.05
0.05
5
0.06
0.06
5
Depth (inches)
Har
dnes
s (H
RC
)
CE TIRF=30CE TIRF=90
PE TIRF=30
PE TIRF=90
(d)
Figure 12 – Graphs of the DOE 2 microhardness data. These plots illustrate a qualitativeanalysis of the main effects in the DOE. All values are in HRC, converted from HK usingASTM E140. CE refers to the carburized-end, PE to the plated-end. (continued on next page)
CE (1750°F)
CE (1650°F)PE (1650°F)PE (1750°F)
CE (90 min)
CE (30 min)PE (90 min)PE (30 min)

Final Report
March 2001 37
Case Hardness Profile, Quench Transfer Time Correlation
25
30
35
40
45
50
55
60
65
700
0.00
5
0.01
0.01
5
0.02
0.02
5
0.03
0.03
5
0.04
0.04
5
0.05
0.05
5
0.06
0.06
5
Depth (inches)
Har
dnes
s (H
RC
)
CE QTT=10
CE QTT=30
CE QTT=50
PE QTT=10PE QTT=30
PE QTT=50
(e)
Figure 12 – Graphs of the DOE 2 microhardness data. These plots illustrate a qualitativeanalysis of the main effects in the DOE. All values are in HRC, converted from HK usingASTM E140. CE refers to the carburized-end, PE to the plated-end. (concluded)
CE (10, 30, 50sec)
PE (10, 30, 50sec)
Final Report
March 2001 38
DOE 3
Overview
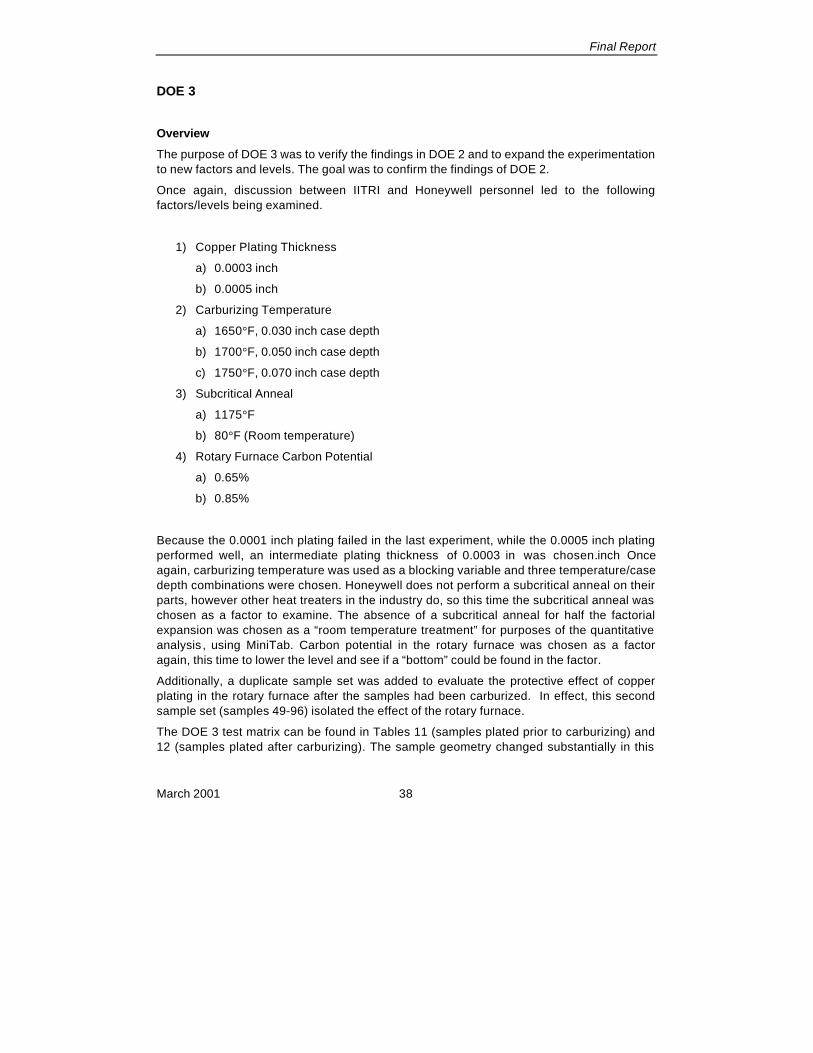
The purpose of DOE 3 was to verify the findings in DOE 2 and to expand the experimentationto new factors and levels. The goal was to confirm the findings of DOE 2.
Once again, discussion between IITRI and Honeywell personnel led to the followingfactors/levels being examined.
1) Copper Plating Thickness
a) 0.0003 inch
b) 0.0005 inch
2) Carburizing Temperature
a) 1650°F, 0.030 inch case depth
b) 1700°F, 0.050 inch case depth
c) 1750°F, 0.070 inch case depth
3) Subcritical Anneal
a) 1175°F
b) 80°F (Room temperature)
4) Rotary Furnace Carbon Potential
a) 0.65%
b) 0.85%
Because the 0.0001 inch plating failed in the last experiment, while the 0.0005 inch platingperformed well, an intermediate plating thickness of 0.0003 in was chosen.inch Onceagain, carburizing temperature was used as a blocking variable and three temperature/casedepth combinations were chosen. Honeywell does not perform a subcritical anneal on theirparts, however other heat treaters in the industry do, so this time the subcritical anneal waschosen as a factor to examine. The absence of a subcritical anneal for half the factorialexpansion was chosen as a “room temperature treatment” for purposes of the quantitativeanalysis , using MiniTab. Carbon potential in the rotary furnace was chosen as a factoragain, this time to lower the level and see if a “bottom” could be found in the factor.
Additionally, a duplicate sample set was added to evaluate the protective effect of copperplating in the rotary furnace after the samples had been carburized. In effect, this secondsample set (samples 49-96) isolated the effect of the rotary furnace.
The DOE 3 test matrix can be found in Tables 11 (samples plated prior to carburizing) and12 (samples plated after carburizing). The sample geometry changed substantially in this

Final Report
March 2001 39
experiment, going from the bars in DOEs 1 and 2 to a small gear. This new samplegeometry can be found in Figure 13.

Final Report
March 2001 40
Table 11 – DOE 3 test matrix. Samples plated prior to carburizing. (continued on next page)
Sample Number Copper PlatingThickness (in)
Case Depth (in) /Temperature (°F)
SubcriticalAnnealing
Temperature (°F)
Rotary FurnaceCarbon Potential
(%)
1 0.0003 0.030 / 1650 1175 0.85
2 0.0003 0.070 / 1750 1175 0.85
3 0.0003 0.030 / 1650 80 0.65
4 0.0003 0.050 / 1700 1175 0.65
5 0.0003 0.070 / 1750 80 0.65
6 0.0003 0.050 / 1700 80 0.85
7 0.0003 0.030 / 1650 1175 0.65
8 0.0003 0.070 / 1750 1175 0.65
9 0.0003 0.050 / 1700 80 0.65
10 0.0003 0.070 / 1750 80 0.85
11 0.0003 0.030 / 1650 80 0.85
12 0.0003 0.050 / 1700 1175 0.85
13 0.0003 0.030 / 1650 1175 0.85
14 0.0003 0.050 / 1700 1175 0.65
15 0.0003 0.070 / 1750 80 0.85
16 0.0003 0.030 / 1650 80 0.65
17 0.0003 0.050 / 1700 80 0.65
18 0.0003 0.050 / 1700 80 0.85
19 0.0003 0.030 / 1650 80 0.85
20 0.0003 0.070 / 1750 1175 0.65
21 0.0003 0.070 / 1750 80 0.65
22 0.0003 0.030 / 1650 1175 0.65
23 0.0003 0.070 / 1750 1175 0.85
24 0.0003 0.050 / 1700 1175 0.85

Final Report
March 2001 41
Table 11 – DOE 3 test matrix. Samples plated prior to carburizing. (concluded)
Sample Number Copper PlatingThickness (in)
Case Depth (in) /Temperature (°F)
SubcriticalAnnealing
Temperature (°F)
Rotary FurnaceCarbon Potential
(%)
25 0.0005 0.030 / 1650 80 0.65
26 0.0005 0.070 / 1750 80 0.85
27 0.0005 0.050 / 1700 80 0.65
28 0.0005 0.030 / 1650 1175 0.85
29 0.0005 0.070 / 1750 1175 0.65
30 0.0005 0.070 / 1750 1175 0.85
31 0.0005 0.030 / 1650 80 0.85
32 0.0005 0.050 / 1700 1175 0.85
33 0.0005 0.050 / 1700 1175 0.65
34 0.0005 0.030 / 1650 1175 0.65
35 0.0005 0.070 / 1750 80 0.65
36 0.0005 0.050 / 1700 80 0.85
37 0.0005 0.050 / 1700 1175 0.65
38 0.0005 0.050 / 1700 80 0.65
39 0.0005 0.030 / 1650 80 0.85
40 0.0005 0.070 / 1750 80 0.65
41 0.0005 0.070 / 1750 1175 0.85
42 0.0005 0.030 / 1650 1175 0.65
43 0.0005 0.070 / 1750 80 0.85
44 0.0005 0.050 / 1700 80 0.85
45 0.0005 0.030 / 1650 1175 0.85
46 0.0005 0.050 / 1700 1175 0.85
47 0.0005 0.030 / 1650 80 0.65
48 0.0005 0.070 / 1750 1175 0.65
Final Report
March 2001 42
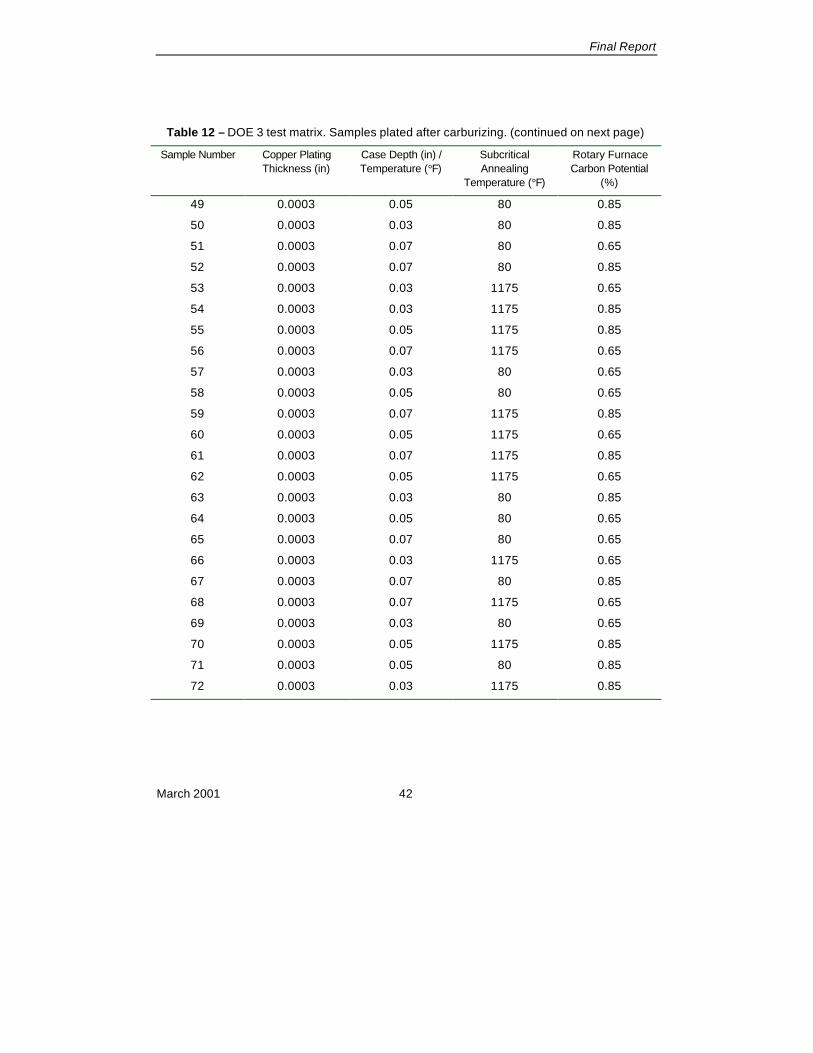
Table 12 – DOE 3 test matrix. Samples plated after carburizing. (continued on next page)
Sample Number Copper PlatingThickness (in)
Case Depth (in) /Temperature (°F)
SubcriticalAnnealing
Temperature (°F)
Rotary FurnaceCarbon Potential
(%)
49 0.0003 0.05 80 0.85
50 0.0003 0.03 80 0.85
51 0.0003 0.07 80 0.65
52 0.0003 0.07 80 0.85
53 0.0003 0.03 1175 0.65
54 0.0003 0.03 1175 0.85
55 0.0003 0.05 1175 0.85
56 0.0003 0.07 1175 0.65
57 0.0003 0.03 80 0.65
58 0.0003 0.05 80 0.65
59 0.0003 0.07 1175 0.85
60 0.0003 0.05 1175 0.65
61 0.0003 0.07 1175 0.85
62 0.0003 0.05 1175 0.65
63 0.0003 0.03 80 0.85
64 0.0003 0.05 80 0.65
65 0.0003 0.07 80 0.65
66 0.0003 0.03 1175 0.65
67 0.0003 0.07 80 0.85
68 0.0003 0.07 1175 0.65
69 0.0003 0.03 80 0.65
70 0.0003 0.05 1175 0.85
71 0.0003 0.05 80 0.85
72 0.0003 0.03 1175 0.85

Final Report
March 2001 43
Table 12 – DOE 3 test matrix. Samples plated after carburizing. (continued on next page)
Sample Number Copper PlatingThickness (in)
Case Depth (in) /Temperature (°F)
SubcriticalAnnealing
Temperature (°F)
Rotary FurnaceCarbon Potential
(%)
73 0.0005 0.05 80 0.65
74 0.0005 0.07 80 0.85
75 0.0005 0.03 80 0.65
76 0.0005 0.05 80 0.85
77 0.0005 0.03 1175 0.65
78 0.0005 0.07 1175 0.85
79 0.0005 0.05 1175 0.65
80 0.0005 0.03 1175 0.85
81 0.0005 0.07 80 0.65
82 0.0005 0.07 1175 0.65
83 0.0005 0.03 80 0.85
84 0.0005 0.05 1175 0.85
85 0.0005 0.07 80 0.85
86 0.0005 0.03 80 0.65
87 0.0005 0.05 1175 0.65
88 0.0005 0.05 80 0.65
89 0.0005 0.03 80 0.85
90 0.0005 0.07 80 0.65
91 0.0005 0.05 1175 0.85
92 0.0005 0.03 1175 0.65
93 0.0005 0.05 80 0.85
94 0.0005 0.07 1175 0.65
95 0.0005 0.03 1175 0.85
96 0.0005 0.07 1175 0.85

Final Report
March 2001 44
Figure 13 – Geometry of DOE 3 samples. The samples processed in DOE 3 were of asubstantially different geometry than DOEs 1 and 2 (see Figure 5 or 7 to compare). In DOE3, each sample was plated over only half its surface area, as indicated in the figure,according to the test matrix in Tables 11 and 12. This particular picture of sample 23 wastaken after carburization.
Experimental Procedure
DOE 3 experimentation was almost identical to that of DOE 2. Quench transfer time was nota factor in this experiment, but was controlled between 10 and 50 sec.
The parts were heat treated according to the following schedule, with randomization atappropriate intervals:
1) Carburize (According to the test matrix in Tables 11 and 12)
2) Slow Cool
3) Subcritical Anneal at 1175°F in Air (According to the test matrix in Tables 11 and 12)
4) Austenitize at 1525°F
5) Quench in Oil heated to 120°F
6) Cold Treat at -120°F
7) Temper at 300°F
As with the previous experiment, a free-quench rather than press quench was performed onthe samples.
Two surfaces were available for examination on each specimen, similar to the specimensin DOE 2.
Plated NotPlated
facewidth ~ 0.5 in.
~ 1 in
Final Report
March 2001 45
Macroetch Analysis
A macroetch was performed on the DOE 3 samples in a manner identical to that performedon the DOE 1 and 2 samples. Again, this was a very discriminatory inspection; any samplewith signs of possible leakage was given a failing score. The results are presented in Table13. The macroetch indicated that samples that were subjected to a subcritical anneal werethe most negatively affected, confirming the suspicions from DOE 2.
Microhardness Analysis
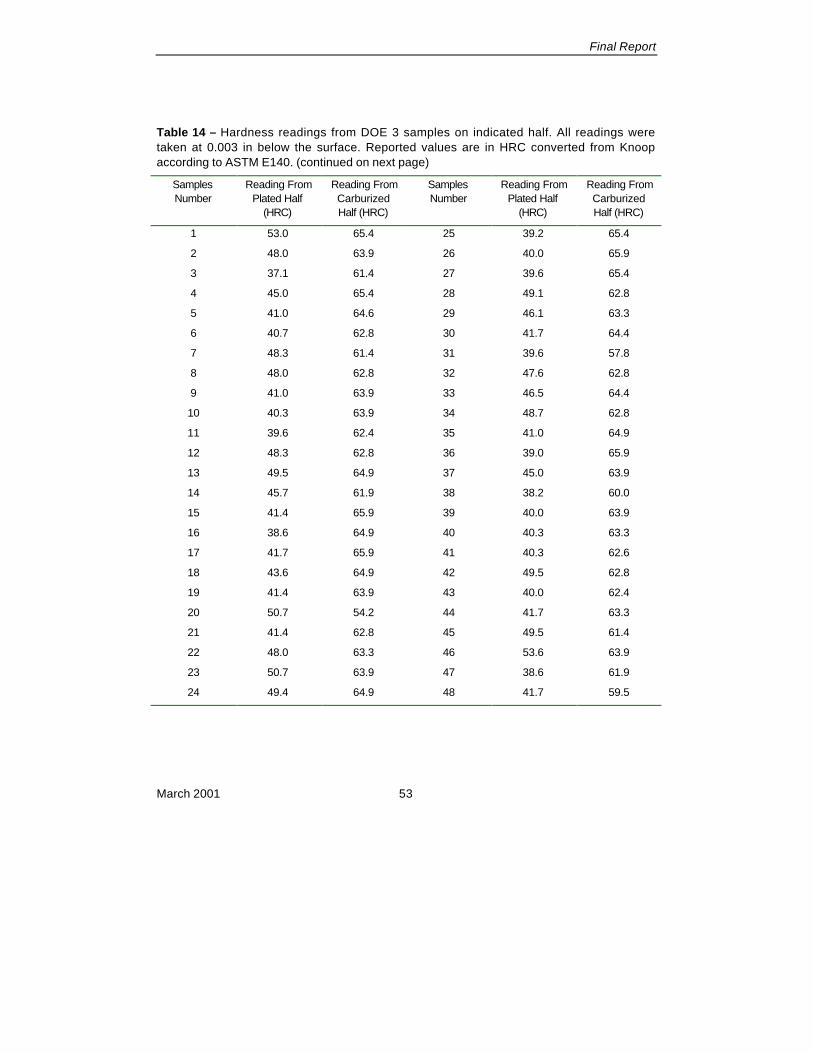
As with DOE 2, microhardness data was gathered on 100% of the specimens. Again, thesamples were each polished to a 3 µm finish and the Knoop Hardness readings weretaken using a Wilson Tukon Series 200 Microhardness Tester. And again, a 500 g load, and15 sec dwell time was used. This time, measurements were only taken at a depth of 0.003inch Three measurements were made on each surface. The measurements were taken onthe inside diameter of the gear specimens to avoid 2-dimensional effects that would havebeen encountered on the outer diameter of the specimens, due to the 2-dimensional toothgeometry. Individual measurements can be found in Table 14.
Three major analyses were performed on this response using MiniTab:
A) ANOVA of the plated halves of sample numbers 1 through 48
B) ANOVA of the plated halves of sample numbers 49 through 96
C) ANOVA of the unplated halves of sample numbers 1 through 96
Appendix E contains a fully nested ANOVA for the analysis performed on the plated halves ofthe samples plated prior to carburizing. Based on the ANOVA, the subcritical anneal and theinteraction of the case depth and subcritical anneal were the only significant effectsobserved. Figure 14(a) contains the main effects for this ANOVA. Figure 15 displays thesecondary effects plot for the interaction of the case depth and subcritical anneal. The
Appendix F contains a fully nested ANOVA for the analysis performed on the plated halves ofthe samples plated after carburizing. Figure 14(b) contains the main effects for this ANOVA.All effects in this analysis were hidden by error.
Appendix G contains a fully nested ANOVA for the analysis performed on the unplatedhalves of all the samples in DOE 3. Figure 14(c) contains the main effects for this ANOVA.The major difference separating this analysis from the others in this DOE was that all thesamples were investigated. The major difference between the two samples sets was thatone set (samples 1 through 48) was treated to a plating process before carburization. Theother set (samples 49 through 96) was treated to a plating process after carburization. This
Final Report
March 2001 46
was treated as a factor in the analysis and levels of –1 and 1 were assigned. Similar to theANOVA in Appendix F, all effects in this analysis were hidden by error.
DOE 3 Conclusions
Based on analysis A, the ANOVA of the plated halves of the sample numbers 1 through 48and its accompanying main effects, secondary effects and pareto plots, it can be said thatthe subcritical anneal at 1175°F was the most detrimental factor influencing failure of theplating. The macroetch performed on the samples supports this conclusion.
Based on this data, the macroetch, a much simpler analysis to perform than themicrohardness analysis, can be used as a simple qualitative and quick tool to gauge failureof the plating. However, the subjectivity of the test will probably disallow its use inproduction.
The analysis performed on the plated-after-carburization specimens indicated that anyeffects present were hidden by error. All main effects were within 1.5 HRC of each other,well within the error expected when examining hardness using the Knoop method (seeAppendix X1 and X2 of ASTM E384).
The analysis performed on the non-plated halves of the specimens indicated that all maineffects were within 0.5 HRC, again hidden by error in the measurements.

Final Report
March 2001 47
Table 13 - Results of the DOE 3 macroetch. A failing score indicates that there wasevidence of carbon penetration on the sample.
SampleNumber
Score SampleNumber
Score SampleNumber
Score
1 Fail 33 Fail 65 Fail
2 Pass 34 Fail 66 Fail
3 Pass 35 Pass 67 Fail
4 Fail 36 Pass 68 Fail
5 Pass 37 Fail 69 Fail
6 Pass 38 Pass 70 Fail
7 Fail 39 Pass 71 Fail
8 Fail 40 Fail 72 Fail
9 Pass 41 Fail 73 Fail
10 Pass 42 Fail 74 Fail
11 Pass 43 Pass 75 Fail
12 Fail 44 Pass 76 Fail
13 Fail 45 Fail 77 Fail
14 Fail 46 Fail 78 Fail
15 Pass 47 Pass 79 Fail
16 Pass 48 Pass 80 Fail
17 Pass 49 Fail 81 Fail
18 Pass 50 Fail 82 Fail
19 Pass 51 Fail 83 Fail
20 Fail 52 Fail 84 Fail
21 Pass 53 Fail 85 Fail
22 Fail 54 Fail 86 Fail
23 Fail 55 Fail 87 Fail
24 Fail 56 Fail 88 Fail
25 Fail 57 Fail 89 Fail
26 Pass 58 Fail 90 Fail
27 Pass 59 Fail 91 Fail
28 Fail 60 Fail 92 Fail
29 Fail 61 Fail 93 Fail
30 Fail 62 Fail 94 Fail

Final Report
March 2001 48
31 Pass 63 Fail 95 Fail
32 Fail 64 Fail 96 Fail

Final Report
March 2001 49
(a)
(b)
Figure 14 – Main effects plots for DOE 3. Factors plotted (from left to right) are: copperplating thickness, case depth, subcritical annealing temperature, and rotary furnace carbonpotential. (a) Main effects for the plated halves of the samples plated prior to carburizing. (b)Main effects for the plated halves of the samples plated after carburizing. (c) Main effects forthe unplated halves of all the samples in DOE 3. In (c), the two sample sets used for theprevious two analyses were combined and treated as a factor with two levels (-1, 1); onesample set treated to a plating operation prior to carburization, the other after. Notice thedifferences in the ordinate scales between the three plots. (continued on next page)

Final Report
March 2001 50
(c)
Figure 14 – Main effects plots for DOE 3. Factors plotted (from left to right) are: copperplating thickness, case depth, subcritical annealing temperature, and rotary furnace carbonpotential. (a) Main effects for the plated halves of the samples plated prior to carburizing. (b)Main effects for the plated halves of the samples plated after carburizing. (c) Main effects forthe unplated halves of all the samples in DOE 3. In (c), the two sample sets used for theprevious two analyses were combined and treated as a factor with two levels (-1, 1); onesample set treated to a plating operation prior to carburization, the other after. Notice thedifferences in the ordinate scales between the three plots. (continued on next page)

Final Report
March 2001 51
Figure 15 – Secondary effects plot for DOE 3 analysis A, the interaction of the case depthand subcritical anneal. This effects was minimal compared to the main effect, see Figure16.
Final Report
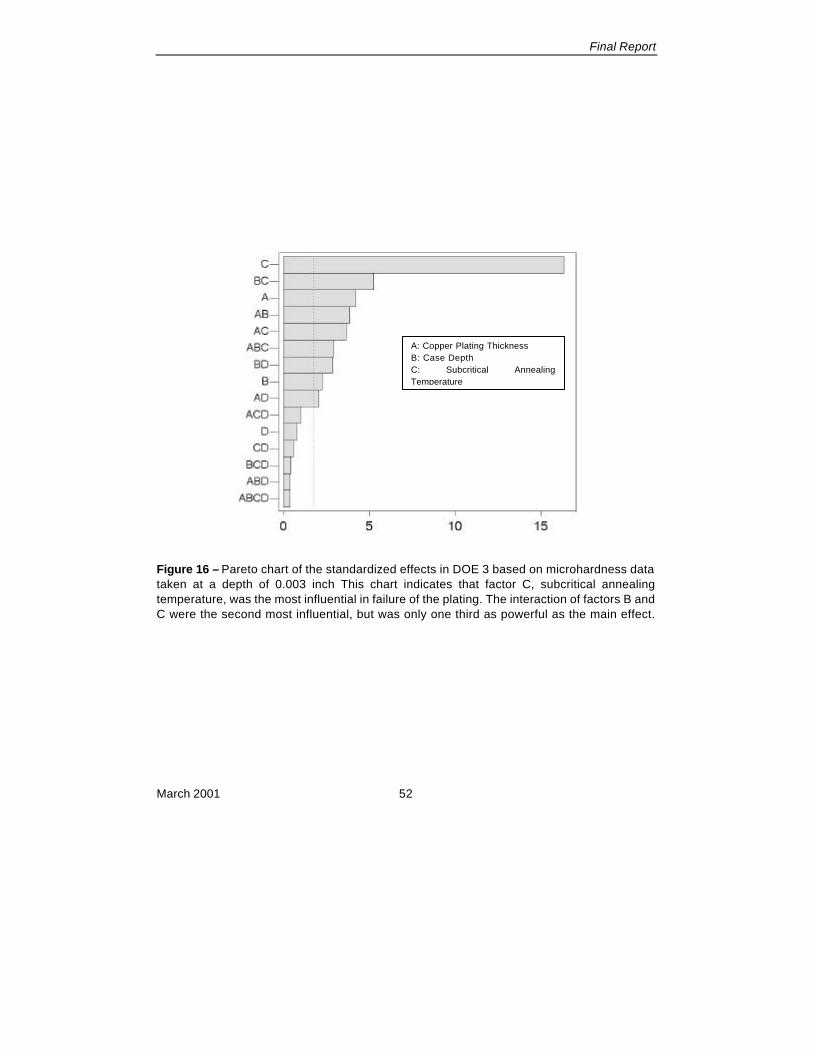
March 2001 52
Figure 16 – Pareto chart of the standardized effects in DOE 3 based on microhardness datataken at a depth of 0.003 inch This chart indicates that factor C, subcritical annealingtemperature, was the most influential in failure of the plating. The interaction of factors B andC were the second most influential, but was only one third as powerful as the main effect.
A: Copper Plating ThicknessB: Case DepthC: Subcritical AnnealingTemperature
Final Report
March 2001 53
Table 14 – Hardness readings from DOE 3 samples on indicated half. All readings weretaken at 0.003 in below the surface. Reported values are in HRC converted from Knoopaccording to ASTM E140. (continued on next page)
SamplesNumber
Reading FromPlated Half
(HRC)
Reading FromCarburizedHalf (HRC)
SamplesNumber
Reading FromPlated Half
(HRC)
Reading FromCarburizedHalf (HRC)
1 53.0 65.4 25 39.2 65.4
2 48.0 63.9 26 40.0 65.9
3 37.1 61.4 27 39.6 65.4
4 45.0 65.4 28 49.1 62.8
5 41.0 64.6 29 46.1 63.3
6 40.7 62.8 30 41.7 64.4
7 48.3 61.4 31 39.6 57.8
8 48.0 62.8 32 47.6 62.8
9 41.0 63.9 33 46.5 64.4
10 40.3 63.9 34 48.7 62.8
11 39.6 62.4 35 41.0 64.9
12 48.3 62.8 36 39.0 65.9
13 49.5 64.9 37 45.0 63.9
14 45.7 61.9 38 38.2 60.0
15 41.4 65.9 39 40.0 63.9
16 38.6 64.9 40 40.3 63.3
17 41.7 65.9 41 40.3 62.6
18 43.6 64.9 42 49.5 62.8
19 41.4 63.9 43 40.0 62.4
20 50.7 54.2 44 41.7 63.3
21 41.4 62.8 45 49.5 61.4
22 48.0 63.3 46 53.6 63.9
23 50.7 63.9 47 38.6 61.9
24 49.4 64.9 48 41.7 59.5

Final Report
March 2001 54
Table 14 – Readings from DOE 3 samples on indicated half. All readings were taken at0.003 in below the surface. Reported values are in HRC converted from Knoop according toASTM E140. (concluded)
SamplesNumber
Reading FromPlated Half
(HRC)
Reading FromCarburizedHalf (HRC)
SamplesNumber
Reading FromPlated Half
(HRC)
Reading FromCarburizedHalf (HRC)
49 63.3 63.9 73 62.4 62.4
50 64.9 63.3 74 64.4 61.4
51 64.9 62.8 75 63.3 61.9
52 62.4 62.9 76 57.7 60.0
53 64.4 63.9 77 61.4 61.9
54 64.9 62.8 78 57.7 63.3
55 63.3 62.8 79 61.9 60.9
56 65.9 66.4 80 61.4 61.9
57 63.3 65.4 81 63.9 61.9
58 64.4 64.4 82 64.4 61.3
59 63.9 64.9 83 60.5 61.9
60 64.9 63.9 84 61.4 60.0
61 65.4 64.3 85 63.3 63.9
62 60.0 62.4 86 62.8 61.9
63 65.4 63.9 87 61.4 60.9
64 65.5 64.4 88 60.0 59.5
65 65.4 64.9 89 63.9 62.4
66 64.9 63.9 90 62.4 62.4
67 65.5 65.9 91 60.9 61.4
68 62.4 63.3 92 62.4 61.9
69 64.4 64.9 93 63.3 61.9
70 64.4 62.3 94 65.5 66.5
71 63.3 64.9 95 64.9 65.4
72 63.9 60.5 96 65.9 64.9

Final Report
March 2001 55
Diffusion Model
Purpose and Goal
The purpose of modeling the behavior of the copper/carbon system was to try to gain anunderstanding of the mechanisms at work that would likely cause the copper diffusionbarrier to fail. Much work has been done on the diffusion of carbon in copper for itsapplication in composite systems [DF95, DF96, DF97, DF98. DFS99], but not with respect toapplication in selective carburizing.
Introduction
Carbon is almost completely insoluble in copper (Tm = 1982.34°F) up to very hightemperatures. Solubility does not exceed 0.04 at.% [BAPD90]. Solubility at carburizingtemperatures (1650 – 1750°F is approximately 0.02 at.% [BAPD90]. The copper lattice isFCC and carbon is most likely to occupy octahedral sites, rather than tetrahedral sitesbecause the octahedral sites are approximately twice as large [DF95]. For comparison,ionic radii of the atoms are R Cu ≈ 0.75 Å and RC ≈ 0.15 Å [Lid00]. Octahedral sites possess aradius of ROS = 0.31 Å based on R Cu. The crystal structure of C (graphite) is HCP.
Solubility is modified by the addition of alloying elements in copper, but in general thesolubility decreases [DF95].
Based on this, diffusion of carbon through copper and into the SAE/AISI 9310H substrate isunlikely. However, the copper diffusion barrier can still fail, as demonstrated in thepreceding experimentation. Failure could be due to the following detrimental conditions:
1) Porosity
2) Local reduction in layer thickness (possibly due to current density effects)
3) Mechanical damage such as nicks or scratches
4) Adherence problems
5) Chemical attack during adhesive removal operation
6) Oxidation of the layer at high temperature
Once carbon has entered the substrate through one of these defects, diffusion into the steelcan proceed easily.
Methodology
The diffusion system was first modeled using an error function solution to Fick's secondlaw. The first step was to model the system assuming infinite solubility of carbon in copper.The resulting curves can be found in Figure 17(a). Figure 17(b) shows what this system

Final Report
March 2001 56
looks like with the more realistic, limited, solubility mentioned earlier. Notice the differentordinate scales between Figures 17(a) and 17(b).
Diffusion of Carbon Atoms through Copper Plating
D = 1x10-12
in2/s, T=1700°F
0.0
0.1
0.2
0.3
0.4
0.5
0.6
0.7
0.8
0.9
1.0
0.0000 0.0001 0.0002 0.0003 0.0004 0.0005
Depth into Surface, in.
Car
bon
Con
cent
ratio
n, P
erce
nt
t = 0.25 hr
t = 0.50 hrt = 1.00 hr
t = 2.00 hrt = 4.00 hr
Increasing t
(a)
Diffusion of Carbon Atoms through Copper Plating
D = 1x10-12
in2/s, T=1700°F
0.000
0.005
0.010
0.015
0.020
0.025
0.0000 0.0001 0.0002 0.0003 0.0004 0.0005
Depth into Surface, in.
Car
bo
n C
on
cen
trat
ion
, Per
cen
t
t = 0.25 hr
t = 0.50 hrt = 1.00 hr
t = 2.00 hr
t = 4.00 hrIncreasing t
(b)
Figure 17 – Model of carbon diffusion through copper plating (0.0005 inch). Similar curvescould be generated using different values of D (estimated) and t. (a) Assuming infinite

Final Report
March 2001 57
solubility. (b) Assuming limited solubility. Both (a) and (b) use the same values of D and t.Notice the different ordinate scales
The model in Figure 17 is a superposition of an error function solution to Fick's second law.It should be noted that this solution breaks down as soon as the left and right solutionsbegin to interact, however, the model serves to give the reader a qualitative understanding ofthe phenomena. This model breaks down at large values of Dt because the fields beginto interact at their boundaries. This model assumes ideal conditions such as: uniformity ofplating thickness, no porosity, and no current density effects . A more rigorous approachwould be to attempt to describe the system from the standpoint of all these flaws.
Conclusions
Because, as stated earlier, the system cannot easily diffuse carbon through the coppermatrix, the diffusion must be entering the substrate via flaws. Voids (pores) are regularlypresent in copper plating. Diffusion in the region of these voids is three-dimensional,compared to the one-dimensional diffusion that occurs at exposed surfaces. This differenceis illustrated in Figure 18. Two dimensional diffusion occurs in the volumes near edges onparts, but is of no concern here. Three dimensional diffusion of copper from a point source,such as a void, occurs slower than diffusion from a wall source, such as a surface.
Porosity in copper plating is commonly measured using the “ferroxyl" method (See the Stateof the Art Review in Appendix A). Manufacturers, as of this writing, monitor porosity on an as-needed basis for the conventional plating thicknesses of 0.001 inch to 0.003 inch. They didmention, during the industry survey (Again, Appendix A) that they would like to implementSPC techniques in there monitoring processes if possible. Thinner plating may need to bechecked more often. Statistical analysis of porosity was not examined in this project.
(a) (b)
Figure 18 – Diffusion into a substrate. Bold arrows indicate carbon. (a) One-dimensional.(b) Three-dimensional.
Surface Pore
SAE/AISI 9310HSubstrate
Copper Plating
Carburizing Atmosphere
CarbonCarbon

Final Report
March 2001 58

Final Report
March 2001 59
Cost-Benefit Analysis
IntroductionThe experiments conducted at IITRI prove that copper plating of thicknesses on the order of0.0001 to 0.0005 inch are capable of stopping off carbon for the carburizing-only cyclestested. Manufacturers can take advantage of this data and use thinner plating thicknessesin their selective carburizing processes. This will result in a significantly shorter amount oftime spent in plating baths, resulting in shorter cycle times, reduced labor and consequentlyreduced cost. Additionally, reduced cyanide usage and reduced copper anode usage canbe expected from the reductions.
The experiments run by IITRI also prove that thinner-than-conventional copper thicknessescan be used throughout an entire heat treatment cycle. Plating thicknesses as low as0.0001 and 0.0003 inch cannot be used, as is evident in the data from DOEs 2 and 3,however 0.0005 inch plating did not show signs of leakage on the specimens tested. Thereader must keep in mind that the conclusions reached for this are only valid for the range oflevels in the experiments performed. As such, performing a subcritical anneal in air has ahigh potential for failure of the thinner plating, and consequently the thinner plating cannotbe used if production cycles similar to the ones tested require an unprotected subcriticalannealing operation.
The Low Copper Project results have demonstrated that the present process ofmanufacturing precision gears can be changed to reduce the cost of the gear. This costreduction is sufficient to offset the cost of the project in less than one year. The projectedsavings is based on the following assumptions:
1) The helicopter fleet consists of 4,250 rotary winged craft
2) Ten percent of the fleet will require spare sets of gears each year
3) Thirty percent of each helicopter gear set will benefit from the modified manufacturingprocess
The number of gears in each set is identified in Table 15.
The conventional process for the manufacture of precision gears is to clean the gearsurface and selectively copper plate the gears to a thickness of 0.001 - 0.003 inch. Afterplating, the gears are carburized, slow cooled, and subcritical annealed. The copper platingis chemically stripped from the steel and then re-plated to a thickness of 0.0005 inch. Theparts are then reheated in a furnace, austenitized, and press quenched. After the pressquenching operation, the parts are cold treated, tempered, and then cleaned. When thecleaning is completed, the copper plating is chemically stripped and the part is inspected.

Final Report
March 2001 60
Table 15 – The U.S. Army helicopter fleet and their respective gear sets (year 2000numbers). Gear-set numbers were calculated from tear-down manuals.
Helicopter Type Year 2000 qty. Gear Set Qty.
AH-1 Cobra 250 68
UH-1 Iroquois 685 60
OH-58C/D Kiowa Warrior 495 60
CH-47D Chinook 445 39
UH-60 A/6 Blackhawk 1500 34
AH-64 A/D Apache Longbow 750 68
Miscellaneous Helicopters 125 34
Total 4250 52 (Average)
The process of copper plating to a thickness of 0.001 inch to 0.003 inch to mask areaswhere carburization is not desired can be modified. The process modification would be thereduction of copper plating to a thickness of 0.0005 inch, which would provide satisfactorymasking against carburization. The benefit of this process change is that less time is spentin the plating tank, and a cost reduction is achieved.
Subsequently, the gear would be heated in an austenitizing furnace, press quenched, coldtreated, tempered, stripped and cleaned. Lastly, the copper would be removed by chemicallystripping the 0.0005 inch copper off the surface.
The new process eliminates the 0.001 inch to 0.003 inch copper plating operation.Additionally, the resulting reduced copper plating thickness used eliminates the need tostrip the thicker copper plating from the steel prior to the press quench operation. Thiselimination of the thicker copper plating operation and the stripping operation results in adirect cost avoidance and eliminates the waste disposal environmental charge associatedwith that stripping operation.
In order to determine the cost of copper plating and stripping, manufacturers of gears andcopper plating facilities were contacted. They were asked to determine the plating andstripping cost for a one inch thick, six-inch diameter gear with a one-inch diameter throughhole. It was determined that the cost of stripping copper plating from a plated gear is equalto the cost of plating. Additionally, an environmental charge for the disposal of the wastecreated in the copper stripping process is also incurred.
The estimated cost reduction and avoidance is identified in Table 16. The project requiredan expenditure of $505,000 to complete. The projected savings (see Table 16) offset theproject cost within a period of six months of pervasive implementation.

Final Report
March 2001 61
Table 16 – Cost benefit analysis (CBA). All dollar values are per year.
Cost Benefit Analysis
Total Number of Gears in Current Helicopter Fleet(4250 helicopters x 52 gears/helicopter)
221,000Military HelicopterSpares andReplacements(See Table 15)
Total Number of Spare and Replacement Gears perYear (10% of above)-
22,100
Gears Using Selective Copper Plating (80% of above)* 17,680
Reduced Plating Thickness Savings ($10.50/gear)** $185,640
Copper Stripping Process Elimination ($8/gear)+ $141,440
Re-plating Process Elimination ($8/gear)+ $141,440
Elimination of One Grit Blast Operation ($2/gear)+ $35,360
Waste Disposal Savings (Copper Related) 3.5%+ $16,398
Subtotal Savings $520,278 per year
Carburized Parts Per Year (Honeywell 1997Numbers)
38,000
Reduced Plating Thickness Savings ($10.50/gear)** $399,000
Parts using Selective Copper Plating (30% of 38,000)** 11,400
Copper Stripping Process Elimination ($8/gear)+ $91,200
Re-plating Process Elimination ($8/gear)+ $91,200
Elimination of One Grit Blast Operation ($2/gear)+ $22,800
Waste Disposal Charge Avoidance 3.5%+ $20,349
Estimate for GearProduction FacilitySimilar in Size toHoneywell (Phoenix),Accessory Gear Output
Subtotal Savings $624,549 per year
Total Savings $1,144,827 per year
- Conservative estimate based on [FC92].* Engineering estimate.** Original Honeywell estimate.+ Estimate based on industry survey.

Final Report
March 2001 62
Industry-Wide Implementation PlanIn order to implement the copper reduction process change and maximize the benefits thatcan be achieved, 102 gear manufacturers and heat treat facilities that process gears werecontacted. Of the number contacted, 21 companies requested that the findings of theproject be sent to them. These manufacturers are identified in Table 17.
In the discussions with the gear manufacturers, the minimum effective plating thicknessrequirement was noted and its application to each particular gear design. In order toensure that the minimum thickness is applied in all the required areas of the gear design,individual gear design reviews would have to be made. Each review would address theresult of the plating operation on areas such as holes and recesses that generally achieveless-thick plating than more exposed areas. The required plating thickness must bedetermined for exposed gear areas while ensuring the minimum effective plating isachieved in “hard to plate” areas of the gear. The cost of the finished ground aerospacegear makes the design review prior to implementation a cost-effective approach to avoidingunnecessary costly scrap while maximizing the cost savings achieved.
After the design review of the selected gear to be copper plated, several gear sets would beprocessed and evaluated to ensure that the process control can be maintained. Uponobtaining acceptable results, the process could be incorporated into the manufacturingprocedure.
So, implementation of the low copper technique would require the following:
1) Individual gear design reviews to determine if thin copper was adequate to stop-offcarbon would need to be conducted. This would mostly be a function of geargeometry and making sure that adequate copper would be plated in areas such asholes and recesses. Also, these parts must not be required to be subjected to asubcritical annealing operation.
2) Austenitizing furnaces would need to be qualified for the process to make sure thatan adequate endothermic atmosphere could be maintained and no excess oxygenwas present. Control of carbon potential between the levels of 0.65% and 0.95% at1525°F should be sufficient to achieve this. To maintain optimum carbon in thesurface, a carbon potential of 0.85% would be preferred.
3) Testing of candidate gears in a production environment would need to be performedto verify the ability of the process.
4) Once verification was complete, modifications of existing manufacturing processesfor the copper plating operation prior to carburization, would need to be made. Also,the overall manufacturing process would need modified to eliminate grit blasting(cleaning), stripping and re-plating after carburization.
Implementation may also require mechanical tests such as rolling/sliding contact fatigue(R/SCF) testing before implementation is feasible. This would depend on individual

Final Report
March 2001 63
manufacturer's requirements (See the section “Recommendations/Future Work” on page65).

Final Report
March 2001 64
Table 17 – Manufacturers that responded positively to receiving information regarding theLow Copper project. (continued on next page)
Company Internet URL Physical Address Phone Numbers
Aero Gear www.aerogear.com 1050 Day Hill Road Voice: (860)688-0888Windsor, CT 06095 Fax: (860)285-8514
Arrow Gear www.arrowgear.com 2301 Curtiss Street Voice: (630)969-7640Downers Grove, IL 60515 Fax: (630)969-0253
Bell helicopter www.bellhelicopter.textron.com
P.O. Box 482 Voice: (817)280-3601
Fort Worth, TX 76101 Fax: (817)280-3291
Boeing www.boeing.com 5000 E. McDowell Rd. Voice: (480)891-3000Mesa, AZ 85215 Fax: N/A
Boeing www.boeing.com Ridley Township, PA 19033 Voice: (610)591-2121Fax: N/A
Boeing www.boeing.com Seattle, WA 98101 Voice: (206)544-1264Fax: N/A
Boeing www.boeing.com 4200 Southeast Blvd., Voice: (316)526-2121Wichita, KS 67210 Fax: N/A
Chicago Gear www.chicagogearworks.com 1805 S. 55th Street Voice: (800)343-3652Works, Inc. Cicero, IL 60650 Fax: (800)432-7957
Derlan Precision www.derlan.com 6006 W. 73rd St. Voice: (708)728-2000Gear Bedford Park, IL 60638-6106 Fax: (708)728-2009
Foote-Jones/ www.footejones.com 2102 N. Natchez Ave. Voice: (773)622-8000Illinois Gear Chicago, IL 60707-3493 Fax: (773)622-8176
Forest City www.fcgear.com 11715 Main St. Voice: (815)623-2168Gear Co. Roscoe, IL 61073 Fax: (815)623-6620

Final Report
March 2001 65
Table 17 – Manufacturers that responded positively to receiving information regarding theLow Copper project. (concluded)
Company Internet URL Physical Address Phone Numbers
Ingersoll Rand www.ingersoll-rand.com 100 Main Street Voice: (570)888-7777Company Athens, PA 18810 Fax: N/A
ITW Spiroid www.itwspiroid.com 3700 West Lake Ave. Voice: (800)253-7940Glenview, IL 60025 Fax: (847)657-5098
Productigear, Inc. www.productigear.com 1900 W. 34th St. Voice: (773)847-4505Chicago, IL 60608 Fax: (773)847-6348
Progressive 922 Lawn Drive Voice: (815)877-2571Steell Treating
www.geartechnology.com/copage/progress.htm Loves Park, IL 61111 Fax: (815)877-7922
The Purdy Corp.www.purdytransmissions.com
586 Hilliard St. Voice: (860)649-0000
Manchester, CT 06040 Fax: (860)645-6293
Reliance Gear www.reliancegear.com 205 Factory Rd. Voice: (630)543-6640Corp. Addison, IL 60101 Fax: (630)543-0520
Riley Gear Co. www..rileygear.com One Precision Drive Voice: (904)829-5652St. Augustine, FL 32092 Fax: (904)829-5838
Rockford Heat N/A 2510 20th St. Voice: (815)398-6533Treaters, Inc. Rockford, IL 61104 Fax: N/A
Rolls-Royce www.rolls-royce.com P.O. Box 420 Voice: (317)230-2000Corp. Indianapolis, IN 46206 Fax: (317)230-4020
Southwest United www.swunited.com 422 S. St.Louis Ave. Voice: (918)587-4161Tulsa, OK 74120 Fax: (918)582-6158
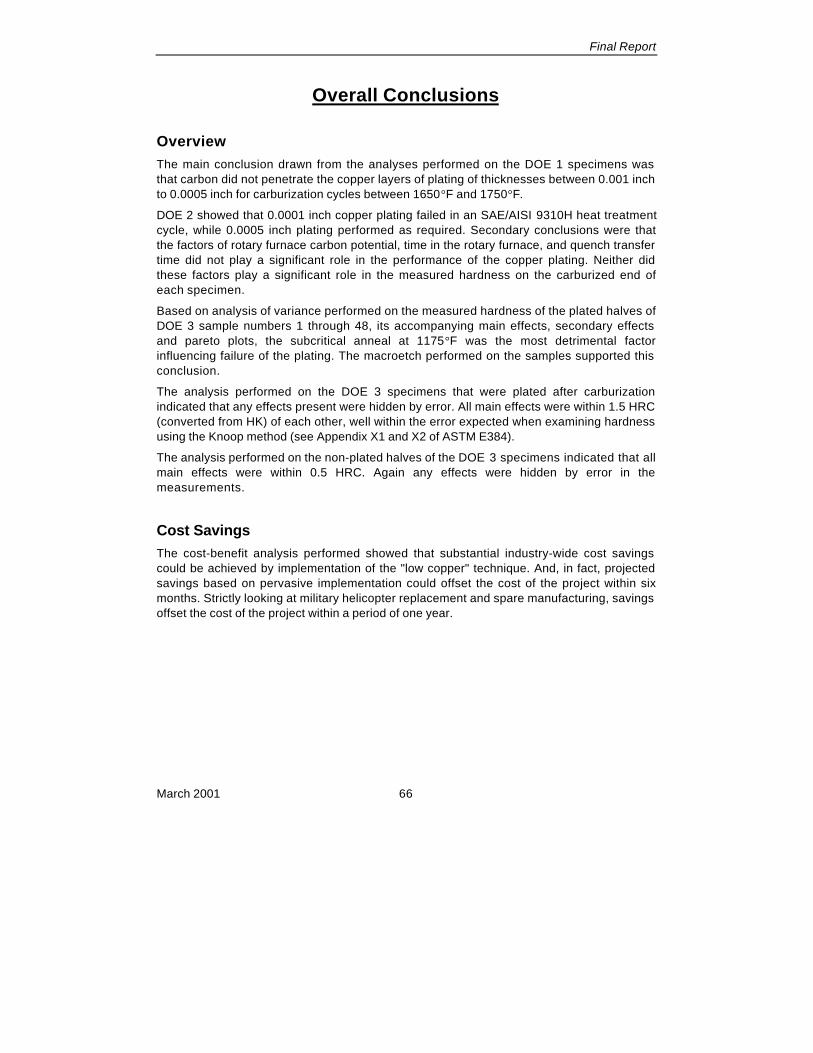
Final Report
March 2001 66
Overall Conclusions
OverviewThe main conclusion drawn from the analyses performed on the DOE 1 specimens wasthat carbon did not penetrate the copper layers of plating of thicknesses between 0.001 inchto 0.0005 inch for carburization cycles between 1650°F and 1750°F.
DOE 2 showed that 0.0001 inch copper plating failed in an SAE/AISI 9310H heat treatmentcycle, while 0.0005 inch plating performed as required. Secondary conclusions were thatthe factors of rotary furnace carbon potential, time in the rotary furnace, and quench transfertime did not play a significant role in the performance of the copper plating. Neither didthese factors play a significant role in the measured hardness on the carburized end ofeach specimen.
Based on analysis of variance performed on the measured hardness of the plated halves ofDOE 3 sample numbers 1 through 48, its accompanying main effects, secondary effectsand pareto plots, the subcritical anneal at 1175°F was the most detrimental factorinfluencing failure of the plating. The macroetch performed on the samples supported thisconclusion.
The analysis performed on the DOE 3 specimens that were plated after carburizationindicated that any effects present were hidden by error. All main effects were within 1.5 HRC(converted from HK) of each other, well within the error expected when examining hardnessusing the Knoop method (see Appendix X1 and X2 of ASTM E384).
The analysis performed on the non-plated halves of the DOE 3 specimens indicated that allmain effects were within 0.5 HRC. Again any effects were hidden by error in themeasurements.
Cost SavingsThe cost-benefit analysis performed showed that substantial industry-wide cost savingscould be achieved by implementation of the "low copper" technique. And, in fact, projectedsavings based on pervasive implementation could offset the cost of the project within sixmonths. Strictly looking at military helicopter replacement and spare manufacturing, savingsoffset the cost of the project within a period of one year.
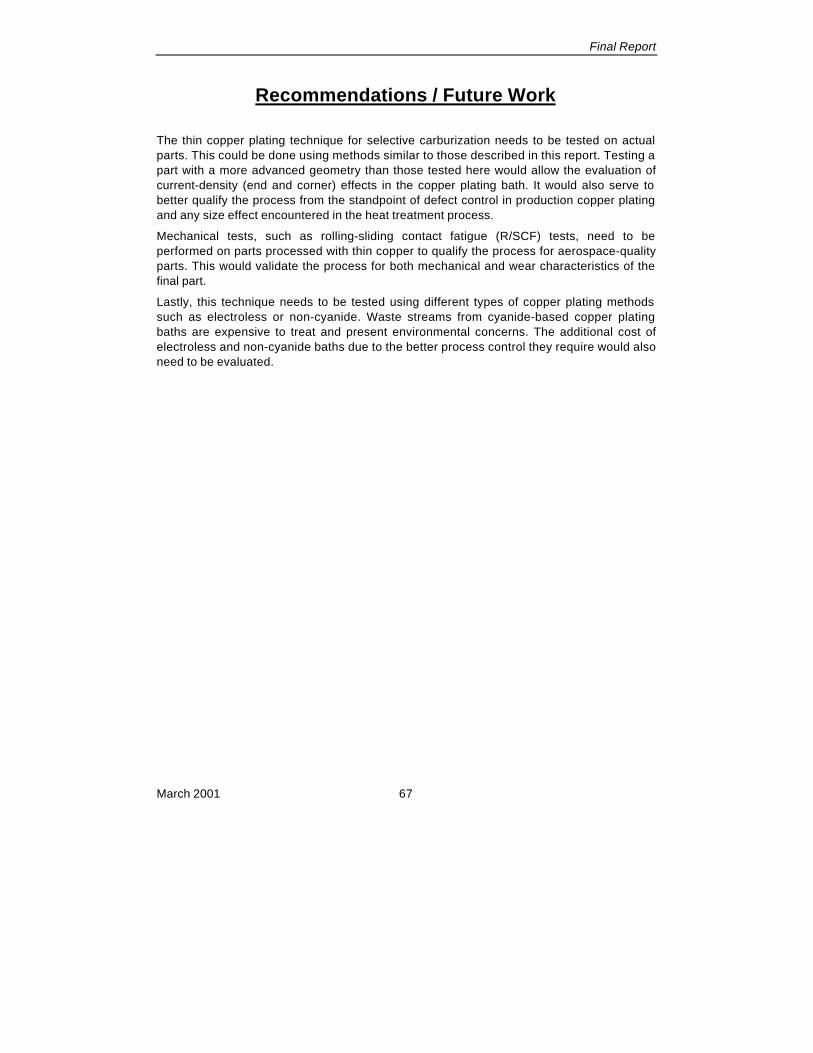
Final Report
March 2001 67
Recommendations / Future Work
The thin copper plating technique for selective carburization needs to be tested on actualparts. This could be done using methods similar to those described in this report. Testing apart with a more advanced geometry than those tested here would allow the evaluation ofcurrent-density (end and corner) effects in the copper plating bath. It would also serve tobetter qualify the process from the standpoint of defect control in production copper platingand any size effect encountered in the heat treatment process.
Mechanical tests, such as rolling-sliding contact fatigue (R/SCF) tests, need to beperformed on parts processed with thin copper to qualify the process for aerospace-qualityparts. This would validate the process for both mechanical and wear characteristics of thefinal part.
Lastly, this technique needs to be tested using different types of copper plating methodssuch as electroless or non-cyanide. Waste streams from cyanide-based copper platingbaths are expensive to treat and present environmental concerns. The additional cost ofelectroless and non-cyanide baths due to the better process control they require would alsoneed to be evaluated.

Final Report
March 2001 68
System Validation Report
The system validation report for this project is contained in the Honeywell preproductionexperimentation report (Appendix H).

Final Report
March 2001 69
Monograph
No monograph was formally required or prepared for this project.

Final Report
March 2001 70
Period of Performance
The period of performance for this project was from June 14, 1999 to March 28, 2001. Afinalized task plan was sent to the sponsor on July 8, 1999.

Final Report
March 2001 71
Research Approach
The following tasks were performed:
1. Project Management: IITRI executed project management encompassing projectplanning, scheduling, resource management, purchasing, reporting, technologytransfer, project review presentations, and technical training. IITRI prepared andsubmitted to AMCOM the required data and deliverables. IITRI provided the requireddetailed accounts of the schedule, cost, and technical performance of the project duringthe INFAC Quarterly Reviews. The purpose of these reviews was to provide a detailedaccount of the schedule, cost, and technical performance of the project. These reviewswere also used to present issues, technical alternatives, accomplishments, anddetailed plans for the remaining effort.
2. Literature Search: A literature search was conducted as part of this project. Keywordswere developed and then searched for in various databases to find material that may aiddevelopment of the project. A “References” section has been included near the end ofthis report.
3. Experimentation was performed in three sub-experiments, referred to as DOE 1, DOE 2,and DOE 3. DOE, here, is an acronym for Design of Experiment. Designed experimentsare experiments that are run for a minimum of cost, but have the ability to provide theanalyst with the maximum amount of information available.
4. Analysis: Analysis was performed using DOE techniques. Results include ANOVA(Analysis of Variance), main effects plots, secondary effects plots (interaction plots), andtertiary effects plots (cube plots).
5. End of Project Briefing: An End of Project briefing will be conducted after this contract hasexpired, as agreed to by the sponsor and IITRI management.
6. Business Analysis: A cost/benefit analysis of this project was performed after theexperimentation had concluded. Honeywell has also performed a cost benefit analysisof implementation of the thin copper technique for their facility, see Appendix I.
7. Final Report: This final report was prepared to present the review procedure, the results,and the business analysis. This final report details the advantages and limitations of thetechnique developed. Implementation issues at IITRI's subcontractor are discussed.

Final Report
March 2001 72
Data and Deliverables
1. Data: With this final report IITRI has delivered all data in accordance with the ContractData Requirement List (CDRL) DD Form 1423 that is part of the INFAC contract.
2. Project Plan: Within 30 days after the contract award, IITRI prepared a task planaccording to DI-MGMT-80909, to provide technical, schedule, cost, and other relatedproject data. The plan included a detailed project milestone chart covering all the majoractivities of the project, major subcontracts, and equipment/material purchases and alabor loading/estimated-cost-to-be-incurred for each major task
3. Status Report: IITRI has prepared, in IITRI's format, a periodic written Status Report asrequired by the INFAC contract, according to DI-MGMT-80368. These reports containedthe project’s objectives and procedures, status of technical progress against projectplan, technical issues, data, results obtained to date, and the effort planned for the nextreporting period. These reports were included in the INFAC Project Status Report everyfour weeks. In addition, IITRI provided to the Government, cost/schedule status, billing,and payment status.
4. Preliminary Cost/Benefit Analysis: IITRI submitted a preliminary cost/benefit analysiswithin 60 days after the kick off meeting.
5. End of Project Briefing and Demonstration: At the conclusion of the technical effort, IITRIprepared viewgraphs for a presentation that will be performed after the close of thecontract.
6. Final Report: IITRI prepared and submitted this final report. IITRI shall distribute this finalreport in accordance with a distribution list prepared by the Government.
With this final report all required data and deliverables required by the INFAC contracthave been prepared and submitted.

Final Report
March 2001 73
References
[BAPD90] Binary Alloy Phase Diagrams, Vol I, ASM Intl., 1990.
[BHH78] G. E. P. Box, W. J. Hunter, and J. S. Hunter, Statistics for Experimenters: AnIntroduction to Design, Data Analysis and Model Building. Wiley, New York,1978.
[DF95] S. Dorfman and D. Fuks, "Carbon Diffusion in Copper-Based Metal MatrixComposites", Sensors and Actuators A, Vol. 51, pp. 13-16, 1995.
[DF96] S. Dorfman and D. Fuks, "Diffusivity of Carbon in the Copper Matrix: Influence ofAlloying", Composites Part A, Vol. 27A, pp. 697-701, 1996.
[DF97] S. Dorfman and D. Fuks, "Formation and Relative Stability of Interstitial SolidSolutions at Interfaces in Metal Matrix Composites", Materials & Design, 18(4/6),pp. 333-337, 1997.
[DF98] S. Dorfman and D. Fuks, "Influence of Nonuniform Displacements on Diffusionin Dilute Copper-Carbon Systems", Journal of Materials Science Letters, Vol. 17,pp. 837-839, 1998.
[DFS99] S. Dorfman, D. Fuks and M. Suery, "Diffusivity of Carbon in Copper- and Silver-Based Composites", Journal of Materials Science, Vol. 34, pp. 77-81, 1999.
[FC92] T. L. Fehl and J. Cesarone, “Improved Manufacturing Technology to Modernizethe U.S. Precision Gear Industry”, Technical Report Number IITRI-P06105, IITResearch Institute, 1992.
[Gli00] M. E. Glicksman, “Diffusion in Solids: Field Theory, Solid-State Principles, andApplications", Wiley, New York, 2000.
[HKK88] L. M. Heijnen, T. W. Kuijpers, and J. A. Klostermann, ‘‘Model Description andExperiments on Carbon Diffusion Through Protective Layers’’, HighTemperatures – High Pressures, 20(3):305-313, 1988.
[HT92] “Surface Treatments: Part 3”, Heat Treating, p. 3, Dec 1992.
[INFAC95] INFAC Program, Distortion of Aerospace Precision Gears, Part II: AlternativeCarbon Stop-Off Methods, Technical Report, IIT Research Institute, 1995.
[KY87] J. S. Kirkaldy and D. J. Young, “Diffusion in the Condensed State”, The Instituteof Metals, 1987.
[Lid00] Handbook of Chemistry and Physics, D. R. Lide, Ed., 81st Ed., 2000.
[Min99] MiniTab for Windows Release 12.23, MiniTab Inc., 1999.
[Mon97] D. C. Montgomery, Design and Analysis of Experiments. Wiley, New York, 4 th Ed.,1997.
[Pre98] J. Preskey, ‘‘Stopping Off Paints for the Heat Treatment Industry’’. Metallurgia,October 1998.

Final Report
March 2001 74
[TH97] G. E. Totten and M. A. H. Howes, ‘‘Distortion of Heat-Treated Components’’,Chapter 5 in Steel Heat Treatment Handbook , pp. 251-292, Marcel Dekker NY,1997.
[Tim96] The Timken Company, Practical Data for Metallurgists, 1996.

Final Report
March 2001 75
Appendix A State of the Art Review
Selective Case Hardening in the Aerospace Industry: A State of the Art Review
Kenneth LitkoProject EngineerINFACIIT Research Institute10 W. 35th St.Chicago, IL 60616
Introduction
The manufacture of precision gears is an expensive task. Raw stock must be machined intoa gear blank. Teeth are cut, turning the blank into what one would generally regard as agear. The gear must then be heat treated to impart hardness and other necessary physicalproperties to it. Finally, the gear must be finished to ensure that proper geometric tolerancesare met. These tasks are tedious and lengthy. It can take anywhere from a few days to a fewweeks to turn raw stock into a gear.
Heat treatment alone is an expensive and lengthy process, involving many subtasks.Precision gears are made of steel, principally SAE/AISI 9310H6,7. The heat treatment taskcould be broken down briefly as NQT8,9, carburizing, slow cooling, austenitizing, quenching,deep freezing, and tempering. This paper will examine a detail of the carburization andreaustenitizing processes, viz. copper plating used as a carbon diffusion barrier. Costassociated with this facet of heat treatment is significant and worthy of study.
Copper plating is applied to the surface of a precision gear to selectively carburize it.Selective carburization is the process by which certain areas of a surface are carburized,while others are not. This may be done because additional machining may be needed onnon-carburized areas after carburizing [GM89]. It is also possible that a tough, fracture-
6 SAE/AISI 9310H has been the primary material used to produce precision gears for years. A newermaterial of interest is Pyrowear Alloy 53 ™. Pyrowear Alloy 53 is a much more expensive alloy, but hasbeen gaining wider acceptance in the aerospace industry due to better properties at elevatedtemperature.7 SAE/AISI 9310H has also been known by the names AISI 9310, AMS 6260, or AMS 6265. These alloyshave essentially the same composition, but are produced in different fashions.8 NQT, normalizing quenching and tempering, is a process by which different heats of steel can bemade to have the same initial properties [Heberling 1990]. Properties resulting from heat treatment arenot path independent. NQT is most easily described as a method by which to start a new path.9 The use of NQT is not ubiquitous among manufacturers, and debate continues on the value of its use.

Final Report
March 2001 76
resistant surface may be required in some areas of the finished part when in service. Ineither instance, copper plating is applied to areas that are not to be carburized.
This State of the Art Review (SOAR) is a result of both a literature search and an industryreview in which we visited three U.S. precision gear manufacturers and interviewedengineers and other personnel involved in heat treatment and copper plating operations.
Relationship of Carburizing to Precision Gears
The primary use of selectively carburized precision gears 10 is in helicopter transmissions.The environment that a gear needs to withstand inside a transmission of this type is one ofheat, friction and stress. The material used to accomplish this task is chosen on the basisof these factors. The material must withstand high temperature11 without significant loss ofproperties. This is in conflict with the fact that most materials lose strength when theirtemperature is raised. The materials must also have a wear resistant surface that does notexperience a significant lowering of properties at elevated temperature. This surface musthave good surface fatigue12 resistance if it is expected to have a long service life. On top ofall these requirements, these gears must be able to handle extremely high loads.Fortunately, certain alloys of steel exhibit these desired properties when properlymanufactured.
The process of carburizing adds a wear-resistant and surface fatigue-resistant surface tosteel. Carbon can be diffused, at a high enough temperature, into a steel surface. Thesurface can then be quenched in oil and tempered in a furnace. The existence of carbonalone in a steel surface such as by the diffusion described, but subsequently cooled slowlyrather than quenched, will result in a relatively fragile structure of ferrite and cementite, notnearly what is required of a transmission component. Quenching the part in oil afteraustenitizing will result in a structure composed mostly of martensite. Martensite is veryhard, which translates to good wear resistance. It is, however, far too brittle to haveadequate fatigue resistance. The act of tempering the martensitic structure lowers thehardness slightly13, but increases fatigue resistance.
Austenitizing for Hardening
Austenitizing is the process of bringing steel to a temperature14 that causes its structure totransform to that of austenite 15. The steel is austenitized in a controlled atmosphere furnace, 10 A precision gear is most easily defined as a gear of exceptional quality, quantitatively meeting therequirements of an AGMA quality number 12 gear or higher.11 A good estimate of the operating temperature of a helicopter transmission is between 225ºF and275ºF.12 Surface fatigue is caused by the repeated application and removal of load [Drago 1988].13 The word 'slightly' is used, but the actual loss of hardness can be negligible in practice.14 The austenitizing temperature of pure carbon steel (i.e., no alloying elements) with 0.1% carbon isapproximately 1425ºF. For comparison, the austenitizing temperature of SAE/AISI 9310H is 1500°F.

Final Report
March 2001 77
usually a rotary hearth furnace, and is then either free quenched or die quenched. One mayask why the step of austenitizing is performed in the first place rather than quenchingdirectly after carburizing. There are at least two reasons for this.
Quenching directly after carburizing has been explored as an alternative to carburizing, slowcooling, reaustenitizing, and quenching [Ker88]. The major advantage of this process islabor and energy savings due to the reduced number of steps needed to attain a carburizedand quenched surface. An additional advantage observed is less distortion due to theabsence of a second heating operation. A major disadvantage is the coarser microstructuredeveloped as a result of directly quenching the part. Direct quenching also tends to causethe formation of microcracks in the structure. These microcracks can lead to early failure ofthe part. Retained austenite can also be a problem in direct quenching. Large amounts ofretained austenite can reduce rolling contact fatigue performance significantly; Kern hasstated that the decrease in performance can be as much as 40%.
Direct quenching of precision gears would be difficult to perform on parts that require pressquenching16. Carburizing is typically performed as a batch process in a large furnace. Thefurnace is generally of the pit or integral-quench type. Transfer of parts to a press quenchingfixture is painstaking at best. One must also consider the effect of exposing a carburizedsurface, at austenitizing temperatures, to an air atmosphere for an extended period of time.Case loss can be a problem. Free quenching parts in an integral-quench furnace is aneasier task, but still faces the difficulties mentioned above.
Because of the reasons given above and partly because of precedence, reheat quenchinghas been the predominant process performed on precision gears in the aerospaceindustry. Kern's paper [Ker88] documents the performance of SAE/AISI 9310H as a result ofdirect quenching, but no full-scale experiment is cited to substantiate the reportedperformance.
Copper Deposition
Copper deposition onto steel has traditionally been accomplished by the method of cyanidebath electrodeposition. The actual steps followed vary from manufacturer to manufacturer,but the basic process can be broken down as follows [Sri83]:
• Mask component where plating is not desired.
• Degrease in an alkali solution for approximately 15 minutes at roughly 90°C.
• Rinse in water. 15 Austenite is a phase of steel that is stable at high temperature. Its crystal structure is that of face-centered cubic (FCC). It is also referred to as gamma iron (γ-iron).16 Press quenching is a process in which a component is rapidly taken from a furnace where itstemperature was above the austenitizing temperature, placed in a mechanically operated fixture, andsimultaneously quenched with oil and held in place by applied pressure. This process is also variouslyreferred to as 'fixture quenching', and 'die quenching' for obvious reasons.

Final Report
March 2001 78
• Rinse in 25 to 30% hydrochloric acid for 5 to 8 minutes at room temperature.
• Rinse in water.
• Rinse in 1% sodium cyanide for 2 to 9 minutes.
• Cyanide copper electrodeposit17.
• Rinse in water.
• De-mask components.
• Rinse in water.
• Degrease in alkali solution.
• Dry components.
Though electrodeposition in and of itself is a simple process, settings of voltage,amperage, bath pH, and bath composition will have an effect on the plating quality,adhesion, and speed. Preparation and cleaning of components are accomplished byvarious methods, but do not differ greatly from the sequence stated. Cleaning operationsperformed after electrodeposition is a function of mask geometry and visual inspection.
Plating is occasionally performed in two steps. First, a 'strike' solution is employed thatdeposits copper very quickly. Only a thin coating can be applied by this method. A longer,slower, electrodeposit18 is then used for depositing a thicker coating. At least onemanufacturer reported that they strike19 steel surfaces in an iterative fashion to promotefaster deposit in the thicker-plating bath.
Inspections performed on the coating include an appearance inspection, an adhesion test,porosity measurement, and thickness inspection. The appearance of the coating should befree from visual defects such as blisters, pits, and stains (ASTM B734). The adhesion testcan be performed on a shim. The shim is bent and inspected visually for cracking and/orflaking of the copper plating. Porosity measurement is performed by microscopicallyinspecting the surface of the copper or by macroscopically applying a ferroxl 20 solution andinspecting for blue spots 21. Thickness22 inspection is performed using an eddy current
17 Bath variables include voltage, amperage, time, and temperature.18 This copper electrodeposit occurs in a bath with composition, voltage, and amperage different fromthat in the strike solution.19 In this sense, 'strike' refers to the act of depositing a thin coating of copper. The usual thickness ofthe strike coating is between 0.0001 and 0.0003 inches.20 See [ASTM B734], Appendix X1 for an explanation of this test.21 Blue spots would indicate exposed iron at the surface.22 Thickness is inspected on flat or critical surfaces only. The electrodeposition process will depositthicker coatings at locations with high current density, such as corners, and thinner coatings atnotches, where a drop in current density can occur. Part of the reason that thick (0.001 to 0.003 inch)

Final Report
March 2001 79
device (ASTM E376), a magnetic thickness gauge (ASTM B499), or by metallographicinspection. These tests are usually performed on an as needed basis 23 and do not rely onSPC techniques 24. Close control of plating bath parameters has produced consistentresults at many manufacturers.
Stripping of the copper plating is done, generally, in the following manner:
• Grit blasting.
• Degreasing.
• Water rinse.
• Immersion in a stripping solution such as chromic acid or an alkaline solution.
• Water rinse.
• Blow or still air dry.
Copper can be recovered from the stripping bath and the solution can be reused, but thetask is usually outsourced.
Aerospace manufacturers have experimented with non-cyanide based plating baths withmixed results. The consensus seems to be that it can be applied successfully with platingthicknesses up to about 0.001 inches. Thicknesses greater than 0.001 inches tend toproduce unacceptable amounts of porosity. Though most manufacturers interviewed for thispaper stated that they have tried applying non-cyanide copper, it was unclear if they have runparts through their furnaces to examine diffusion barrier performance. They also said thatbath composition and maintenance were major factors in determining successful copperdeposition.
Diffusion Barriers for Carburizing and Austenitizing
In the process of selective carburizing, copper plating is used as a barrier to prevent carbonfrom diffusing into the steel substrate. Gears going into a carburizing cycle will typically becopper plated to 0.001 to 0.003 inches. The carburizing atmosphere will protect the integrityof the plated surface but any exposure to an air atmosphere at carburizing temperatures canquickly strip the surface of at least 0.0001 to 0.0002 inches of plating, due to oxidation.
coatings have traditionally been applied to parts going into a selective carburizing operation is to ensurethat a minimum thickness is present on plated surfaces. Two of the inspection methods mentioned in thetext, viz. eddy current and magnetic thickness measurement devices, are difficult to apply to notchesand corners, and consequently are primarily utilized on flat surfaces.23 Generally, a visual inspection is performed 100% of the time. If a component fails this test, additionaltests are performed and plating baths are inspected.24 Manufacturers did express a concern over the fact that most of them do not have a SPC system fortheir copper plating inspection operations.

Final Report
March 2001 80
Copper plated surfaces 25 can be divided into two groups based on surface location inrelation to free steel surface and copper plating mask. The junction of free steel surface andcopper mask is illustrated in Figure 1(a). When the area of interest is far from a free surface/ copper mask junction (FCJ), carbon will diffuse one-dimensionally into the steel substrate.When the area of interest is at the FCJ, carbon diffuses two-dimensionally, and will diffuseto approximately the carburizing depth under the mask in a radial fashion with the center atthe FCJ [GM89], this is illustrated in Figure 1(b). Obviously, three dimensions are involved inmore complicated geometries.
Another common method of masking26 components for selective carburization involves theuse of stop-off paint. Paint, consisting of refractory substances and a binder of glass, can beapplied to the surface of the component where carbon is to be stopped off27 [Nov74].Manufacturers of commonly used paints generally advise the consumer to apply the paintliberally, to approximately a certain thickness28. Those manufacturers do warn, however, thateven a small amount applied to areas not to be stopped off will almost certainly be so. Evena finger print or glance of an application brush can have serious ramifications on final partquality if such actions deposit paint on the wrong area of a component. The paint is alsodifficult to apply consistently to a large number of parts. Geometric tolerances on areas to becarburized are difficult enough to maintain on an individual part, let alone many.
CopperPlating
SteelSurface
Substrate
Depth ofCarbonPenetration
FCJ
(a) (b)
Figure 1 – (a) The surface of a steel component that has been copper plated. The geometry shownillustrates the area where the copper plating meets the steel surface. This geometry is idealized; the
25 The following sentences would apply to other diffusion barriers in this geometry, not just copperplating.26 Be careful with the use of the term "masking". It is used liberally in this paper to refer to either thecoating of copper (or stop-off paint) on the steel surface, or the "masking" that is done to apply thecopper or stop-off coating itself.27 Carbon is prevented from diffusing into the substrate.28 Manufacturer specific.

Final Report
March 2001 81
actual junction is much more complex. (b) Carbon penetration into a steel surface at the FCJ is twodimensional.
An additional problem with stop-off paints is the fact that they cannot be used with pressquenching. Recall that copper plating is used in conjunction with press quenching in theaustenitization procedure to prevent escape of carbon from the case. In order for pressquenching to be successfully implemented, a consistently thick layer of paint would need tobe applied, which, as was stated in the preceding paragraph, is highly improbable.
A painted-on diffusion barrier is thicker than a copper plated one. However, tolerances in apress quench need to be preserved or improved, neither of which can be accomplished witha thicker layer. Thinner layers allow for greater dimensional accuracy in the pressquenching process and provide more consistent gears.
Stop-off paint liquefies at just below carburizing temperatures. This produces a fairlyuniform surface on the areas to which it was applied, however, as a consequence of beingliquid, the paint has a tendency to drip and spread over areas that were to be carburized.
Removal of copper plating after carburizing or quenching is routine and of little trepidation.Removal of stop-off paint is generally messy, prone to producing part damage, and is laborconsuming. It is commonly done with glass bead.
Manufacturers expressed the concern that certain stop-off paints contain free metals, suchas tin, that may diffuse into the steel substrate at high temperatures and promote embrittlingof the steel. As mentioned, however, components of stop-off paint are typically refractoriesand are therefore in such a state as to be chemically stable. Be that as it may, it was still aconcern to manufacturers. No study that the author knows of examines surface reactionsbetween steel and stop-off paint to prove or disprove the argument.
Given the variables and consequences stated in the preceding paragraphs, the preferenceamong aerospace manufacturers is to use copper plating rather than a stop-off paint forselective carburizing or austenitizing. It is not uncommon practice, however, to use stop-offpaint to make minor repairs to damaged or poor quality copper plating. Highly damaged orvery poor copper plating will usually be re-plated.
Conclusions
The current state of the art in selective carburizing has not changed much, if at all, in recentyears. The following points summarize the current practices at major U.S. aerospacemanufacturers.
• Copper cyanide bath plating is the application method of choice for copperplating. Non-cyanide plating baths have been examined in house at aerospacemanufacturers with success only at plating thicknesses below 0.001 inches.
• Current practice is to apply copper used as a diffusion barrier during carburizingto thicknesses between 0.001 and 0.003 inches. The reasons for the thickness

Final Report
March 2001 82
range chosen are partly due to specification and partly due to in-houseprecedent.
• There is a greater variety of thicknesses of copper used as diffusion barriersduring austenitizing than there is used during carburizing, viz. on the lowertolerance. Most manufacturers would rather plate to the high end of the tolerancerather than the low end due to the high cost of scrap should the plating fail. Thispractice does reduce dimensional accuracy in the press quench. However, itshould be noted that of the aerospace manufacturers visited, the thinner coatingswere generally applied to shallower cased parts.
• Stop-off paint is not a viable alternative to copper plating when press quenchingof parts is needed. Additionally, part damage as a result of poor application orremoval practices is common.
References
[GM89] E. Gutierrez-Miravete, J. H. Mutchler, "A Study of the Selective CarburizationProcess", Proceedings of Carburizing Processing and Performance, Krauss, G,Ed., 1989, pp. 121-131.
[Heb90] J. M. Heberling, S. M. Shah, "Improved Carburizing of Aerospace PartsEconomically", Industrial Heating, Jul. 1990, pp. 26-31.
[Ker88] R. F. Kern, "Carburize Hardening, Direct Quench vs. Reheat and Quench", HeatTreating, Mar. 1988, pp. 17-21.
[Nov74] M. Novak, "Coatings for protecting steel against carburizing", Metallovedenie iTermicheskaya Obrabotka Metallov, No. 8, Aug. 1974, pp. 67-68.
[Sri83] V. Srinivasan, S. Gourishankar, "Copper Plating for Selective Case Hardening", J.Electrochem Soc. India, 1983, pp. 239-240.

Final Report
March 2001 83
Appendix BDOE 1 Raw Surface Roughness Data
This section contains the raw data from the surface roughness measurements of DOE 1.These data were generated using a TSK profilometer. All reported values are Ra and are inµinch.
Table B1 - Raw surface roughness data from DOE 1 samples after creating rough surfacesand prior to copper plating. (Obs. = Observation)}
Ra on As-received End (µin) Ra on Machined End (µin)
Sample Obs. 1 Obs. 2 Obs. 3 Average Obs. 1 Obs. 2 Obs. 3 Average
1 42.88 45.93 45.80 44.87 118.02 116.07 115.94 116.68
2 56.77 53.10 52.89 54.25 120.61 119.29 120.52 120.14
3 49.58 45.96 58.84 51.46 124.09 118.61 120.67 121.12
4 64.34 52.49 33.16 50.00 120.84 120.02 117.47 119.44
5 50.08 36.36 41.65 42.70 118.33 119.21 120.37 119.30
6 47.14 37.85 44.22 43.07 118.70 119.04 120.98 119.57
7 55.62 52.72 52.62 53.65 103.10 97.90 95.04 98.68
8 27.42 37.34 27.42 30.73 95.27 96.09 96.76 96.04
9 43.37 48.09 37.32 42.93 98.17 95.37 96.78 96.77
10 40.07 51.83 56.84 49.58 104.23 97.90 95.63 99.25
11 25.13 23.16 25.68 24.66 98.87 100.00 103.66 100.84
12 44.47 48.43 43.35 45.42 98.51 96.81 97.06 97.46
13 52.12 47.70 48.76 49.53 95.14 97.75 95.18 96.02
14 41.28 44.02 57.71 47.67 95.33 97.33 99.40 97.35
15 45.25 51.61 45.81 47.56 93.69 94.91 94.77 94.46
16 39.64 53.32 43.36 45.44 94.67 97.16 97.38 96.40
17 32.56 48.23 45.70 42.16 96.15 98.61 98.51 97.76
18 58.59 46.17 54.67 53.14 97.84 97.94 96.23 97.34
19 46.33 40.31 45.52 44.05 95.93 96.41 98.90 97.08
20 39.02 43.00 39.57 40.53 97.19 101.28 97.88 98.78
21 41.11 45.98 51.37 46.15 102.06 99.62 100.40 100.69
22 46.59 41.79 44.45 44.28 104.51 98.81 98.64 100.65
23 42.72 46.97 61.11 50.27 97.12 97.88 100.32 98.44

Final Report
March 2001 84
24 56.15 58.42 41.70 52.09 99.46 98.47 96.67 98.20

Final Report
March 2001 85
Table B2 - Raw surface roughness data from DOE 1 samples after copper plating. (Obs. =Observation)
Ra on As-received End (µin) Ra on Machined End (µin)
Sample Obs. 1 Obs. 2 Obs. 3 Average Obs. 1 Obs. 2 Obs. 3 Average
1 52.38 53.41 38.92 48.24 120.10 118.27 116.51 118.29
2 50.99 44.67 56.77 50.81 124.64 123.28 124.22 124.05
3 54.65 52.07 57.81 54.84 123.99 122.31 122.65 122.98
4 52.74 52.83 60.93 55.50 127.60 131.37 127.58 128.85
5 47.97 44.05 46.48 46.17 122.35 125.99 122.62 123.65
6 44.28 37.75 50.81 44.28 132.08 129.40 128.41 129.96
7 50.83 50.01 50.17 50.34 97.23 94.69 105.93 99.28
8 41.92 35.86 34.38 37.39 100.71 101.97 102.34 101.67
9 50.54 43.01 48.04 47.20 108.22 106.61 107.82 107.55
10 47.60 51.80 51.14 50.18 101.99 104.01 104.00 103.33
11 26.78 27.28 26.02 26.69 101.04 98.24 97.85 99.04
12 49.22 53.31 48.05 50.19 96.67 99.65 101.65 99.32
13 48.74 56.41 59.49 54.88 95.55 96.14 99.44 97.04
14 48.87 52.79 42.76 48.14 102.24 106.85 102.67 103.92
15 45.97 52.93 56.99 51.96 101.72 101.91 100.08 101.24
16 45.83 40.92 42.89 43.21 100.38 97.61 95.80 97.93
17 46.97 50.59 38.62 45.39 99.31 99.11 100.93 99.78
18 50.38 50.81 41.16 47.45 99.14 99.66 98.12 98.97
19 39.30 48.08 46.62 44.67 100.78 105.65 99.13 101.85
20 43.33 49.03 50.24 47.53 108.65 102.66 109.14 106.82
21 50.60 51.33 46.80 49.58 102.19 102.57 100.64 101.80
22 44.74 57.44 56.22 52.80 98.20 99.54 94.68 97.47
23 40.95 31.33 33.13 35.14 103.95 95.37 93.91 97.74
24 50.70 62.64 47.57 53.64 100.97 99.32 99.87 100.05

Final Report
March 2001 86
Appendix C
DOE 1 Raw Mass Data
This section contains the raw data from the mass measurements of DOE 1.
Table C1 - Raw mass data from the DOE 1 samples. The mass of each sample wasmeasured at each of the three process points indicated. All values are in grams.
SampleNumber
BeforePlating
AfterPlating
Difference (Massgain after plating)
AfterCarburizing
Difference (Massgain after
carburizing)
1 42.63 42.66 0.03 42.67 0.01
2 42.68 42.83 0.15 42.83 0.00
3 42.67 42.70 0.03 42.72 0.02
4 42.61 42.77 0.16 42.77 0.00
5 42.63 42.77 0.14 42.77 0.00
6 42.61 42.77 0.16 42.78 0.01
7 42.64 42.67 0.03 42.67 0.00
8 42.61 42.78 0.17 42.78 0.00
9 42.61 42.78 0.17 42.78 0.00
10 42.50 42.66 0.16 42.66 0.00
11 42.44 42.48 0.04 42.48 0.00
12 42.47 42.62 0.15 42.62 0.00
13 42.57 42.60 0.03 42.61 0.01
14 42.48 42.66 0.18 42.66 0.00
15 42.56 42.73 0.17 42.73 0.00
16 42.63 42.78 0.15 42.78 0.00
17 42.55 42.58 0.03 42.60 0.02
18 42.60 42.63 0.03 42.64 0.01
19 42.68 42.82 0.14 42.82 0.00
20 42.51 42.68 0.17 42.68 0.00
21 42.47 42.62 0.15 42.62 0.00
22 39.13 39.16 0.03 39.17 0.01
23 39.10 39.24 0.14 39.25 0.01

Final Report
March 2001 87
24 39.16 39.31 0.15 39.31 0.00

Final Report
March 2001 88
Appendix D DOE 2 Fully Nested ANOVA
This was generated using MiniTab version 12.23
Fractional Factorial Fit
Estimated Effects and Coefficients for PE@D<=0. (coded units)Term Effect Coef StDev Coef T PConstant 47.27 0.4419 106.96 0.000Block -0.27 0.4419 -0.62 0.548CPT -23.77 -11.88 0.4419 -26.89 0.000RFCP -1.03 -0.52 0.4419 -1.17 0.261TIRF 1.44 0.72 0.4419 1.63 0.123QTT 0.38 0.19 0.4419 0.43 0.672CPT*RFCP 0.37 0.18 0.4419 0.42 0.682CPT*TIRF -2.66 -1.33 0.4419 -3.01 0.009CPT*QTT 1.43 0.72 0.4419 1.62 0.126RFCP*TIRF -0.42 -0.21 0.4419 -0.47 0.642RFCP*QTT 0.44 0.22 0.4419 0.50 0.623TIRF*QTT 0.09 0.05 0.4419 0.11 0.917CPT*RFCP*TIRF 0.53 0.27 0.4419 0.60 0.557CPT*RFCP*QTT 0.39 0.20 0.4419 0.45 0.662CPT*TIRF*QTT 0.39 0.20 0.4419 0.45 0.662RFCP*TIRF*QTT -1.54 -0.77 0.4419 -1.75 0.101CPT*RFCP*TIRF*QTT 0.51 0.25 0.4419 0.57 0.575
Analysis of Variance for PE@D<=0. (coded units)
Source DF Seq SS Adj SS Adj MS F PBlocks 1 2.37 2.37 2.37 0.38 0.548Main Effects 4 4545.97 4545.97 1136.49 181.88 0.0002-Way Interactions 6 76.97 76.97 12.83 2.05 0.1213-Way Interactions 4 23.80 23.80 5.95 0.95 0.4614-Way Interactions 1 2.05 2.05 2.05 0.33 0.575Residual Error 15 93.73 93.73 6.25Total 31 4744.89
Estimated Coefficients for PE@D<=0. using data in uncoded units
Term CoefConstant 85Block -0CPT -53535RFCP -29TIRF -0QTT -1CPT*RFCP 5859CPT*TIRF -109CPT*QTT 738RFCP*TIRF 0RFCP*QTT 1TIRF*QTT 0

Final Report
March 2001 89
CPT*RFCP*TIRF -190CPT*RFCP*QTT -773CPT*TIRF*QTT -16RFCP*TIRF*QTT -0CPT*RFCP*TIRF*QTT 21

Final Report
March 2001 90
Estimated Effects and Coefficients for CE@D<=0. (coded units)
Term Effect Coef StDev Coef T PConstant 62.2812 0.2479 251.21 0.000Block -0.4125 0.2479 -1.66 0.117CPT 0.7500 0.3750 0.2479 1.51 0.151RFCP 0.8125 0.4062 0.2479 1.64 0.122TIRF 0.3375 0.1687 0.2479 0.68 0.506QTT 0.5000 0.2500 0.2479 1.01 0.329CPT*RFCP 0.0250 0.0125 0.2479 0.05 0.960CPT*TIRF -0.4000 -0.2000 0.2479 -0.81 0.432CPT*QTT -0.2875 -0.1437 0.2479 -0.58 0.571RFCP*TIRF 1.7625 0.8813 0.2479 3.55 0.003RFCP*QTT -0.3500 -0.1750 0.2479 -0.71 0.491TIRF*QTT 0.5250 0.2625 0.2479 1.06 0.306CPT*RFCP*TIRF -0.5500 -0.2750 0.2479 -1.11 0.285CPT*RFCP*QTT -0.0625 -0.0313 0.2479 -0.13 0.901CPT*TIRF*QTT 0.8125 0.4063 0.2479 1.64 0.122RFCP*TIRF*QTT -0.3000 -0.1500 0.2479 -0.61 0.554CPT*RFCP*TIRF*QTT -0.2375 -0.1188 0.2479 -0.48 0.639
Analysis of Variance for CE@D<=0. (coded units)
Source DF Seq SS Adj SS Adj MS F PBlocks 1 5.4450 5.4450 5.4450 2.77 0.117Main Effects 4 12.6925 12.6925 3.1731 1.61 0.2222-Way Interactions 6 29.9825 29.9825 4.9971 2.54 0.0673-Way Interactions 4 8.4525 8.4525 2.1131 1.07 0.4044-Way Interactions 1 0.4513 0.4513 0.4513 0.23 0.639Residual Error 15 29.5050 29.5050 1.9670Total 31 86.5288
Estimated Coefficients for CE@D<=0. using data in uncoded units
Term CoefConstant 75.4Block -0.4CPT 289.1RFCP -19.2TIRF -0.3QTT 0.1CPT*RFCP 12656.2CPT*TIRF 2.3CPT*QTT -677.3RFCP*TIRF 0.4RFCP*QTT -0.1TIRF*QTT -0.0CPT*RFCP*TIRF -161.5CPT*RFCP*QTT 515.6CPT*TIRF*QTT 11.8RFCP*TIRF*QTT 0.0CPT*RFCP*TIRF*QTT -9.9
Estimated Effects and Coefficients for CE@D>0.0 (coded units)
Term Effect Coef StDev Coef T PConstant 62.5375 0.2345 266.66 0.000

Final Report
March 2001 91
Block -0.9000 0.2345 -3.84 0.002CPT 0.9750 0.4875 0.2345 2.08 0.055RFCP -0.2125 -0.1062 0.2345 -0.45 0.657TIRF 1.3750 0.6875 0.2345 2.93 0.010QTT 1.0500 0.5250 0.2345 2.24 0.041CPT*RFCP 0.1625 0.0812 0.2345 0.35 0.734CPT*TIRF -0.5750 -0.2875 0.2345 -1.23 0.239CPT*QTT 0.2500 0.1250 0.2345 0.53 0.602RFCP*TIRF 1.7875 0.8938 0.2345 3.81 0.002RFCP*QTT 0.3125 0.1563 0.2345 0.67 0.515TIRF*QTT 0.5750 0.2875 0.2345 1.23 0.239CPT*RFCP*TIRF -0.9875 -0.4938 0.2345 -2.11 0.053CPT*RFCP*QTT -0.4625 -0.2312 0.2345 -0.99 0.340CPT*TIRF*QTT 0.8750 0.4375 0.2345 1.87 0.082RFCP*TIRF*QTT -0.0125 -0.0063 0.2345 -0.03 0.979CPT*RFCP*TIRF*QTT -1.0875 -0.5437 0.2345 -2.32 0.035
Analysis of Variance for CE@D>0.0 (coded units)
Source DF Seq SS Adj SS Adj MS F PBlocks 1 25.920 25.920 25.920 14.73 0.002Main Effects 4 31.911 31.911 7.978 4.53 0.0132-Way Interactions 6 32.344 32.344 5.391 3.06 0.0373-Way Interactions 4 15.639 15.639 3.910 2.22 0.1164-Way Interactions 1 9.461 9.461 9.461 5.38 0.035Residual Error 15 26.400 26.400 1.760Total 31 141.675
Estimated Coefficients for CE@D>0.0 using data in uncoded units
Term CoefConstant 73Block -1CPT 20102RFCP -18TIRF -0QTT 1CPT*RFCP -10781CPT*TIRF -613CPT*QTT -2007RFCP*TIRF 0RFCP*QTT -1TIRF*QTT -0CPT*RFCP*TIRF 536CPT*RFCP*QTT 2141CPT*TIRF*QTT 42RFCP*TIRF*QTT 0CPT*RFCP*TIRF*QTT -45
* NOTE * There is partial confounding, no alias table was printed.
Fully Nested Analysis of Variance
Analysis of Variance for PE@D<=0.

Final Report
March 2001 92
Source DF SS MS F PCPT 1 4519.6278 4519.6278 942.018 0.001RFCP 2 9.5956 4.7978 0.250 0.790TIRF 4 76.7812 19.1953 3.589 0.059QTT 8 42.7925 5.3491 0.891 0.546Error 16 96.0950 6.0059Total 31 4744.8922
Variance Components
Source Var Comp. % of Total StDevCPT 282.177 96.75 16.798RFCP -1.800* 0.00 0.000TIRF 3.462 1.19 1.861QTT -0.328* 0.00 0.000Error 6.006 2.06 2.451Total 291.644 17.078
* Value is negative, and is estimated by zero.
Expected Mean Squares
1 CPT 1.00(5) + 2.00(4) + 4.00(3) + 8.00(2) + 16.00(1) 2 RFCP 1.00(5) + 2.00(4) + 4.00(3) + 8.00(2) 3 TIRF 1.00(5) + 2.00(4) + 4.00(3) 4 QTT 1.00(5) + 2.00(4) 5 Error 1.00(5)
Analysis of Variance for CE@D<=0.
Source DF SS MS F PCPT 1 4.5000 4.5000 1.703 0.322RFCP 2 5.2863 2.6431 0.359 0.719TIRF 4 29.4625 7.3656 4.779 0.029QTT 8 12.3300 1.5413 0.706 0.683Error 16 34.9500 2.1844Total 31 86.5287
Variance Components
Source Var Comp. % of Total StDevCPT 0.116 3.09 0.341RFCP -0.590* 0.00 0.000TIRF 1.456 38.76 1.207QTT -0.322* 0.00 0.000Error 2.184 58.15 1.478Total 3.757 1.938
* Value is negative, and is estimated by zero.
Expected Mean Squares
1 CPT 1.00(5) + 2.00(4) + 4.00(3) + 8.00(2) + 16.00(1) 2 RFCP 1.00(5) + 2.00(4) + 4.00(3) + 8.00(2)

Final Report
March 2001 93
3 TIRF 1.00(5) + 2.00(4) + 4.00(3) 4 QTT 1.00(5) + 2.00(4) 5 Error 1.00(5)
Analysis of Variance for CE@D>0.0
Source DF SS MS F PCPT 1 7.6050 7.6050 26.568 0.036RFCP 2 0.5725 0.2862 0.022 0.978TIRF 4 51.1325 12.7831 3.404 0.066QTT 8 30.0450 3.7556 1.149 0.385Error 16 52.3200 3.2700Total 31 141.6750
Variance Components
Source Var Comp. % of Total StDevCPT 0.457 7.35 0.676RFCP -1.562* 0.00 0.000TIRF 2.257 36.24 1.502QTT 0.243 3.90 0.493Error 3.270 52.51 1.808Total 6.227 2.495
* Value is negative, and is estimated by zero.

Final Report
March 2001 94
Expected Mean Squares
1 CPT 1.00(5) + 2.00(4) + 4.00(3) + 8.00(2) + 16.00(1) 2 RFCP 1.00(5) + 2.00(4) + 4.00(3) + 8.00(2) 3 TIRF 1.00(5) + 2.00(4) + 4.00(3) 4 QTT 1.00(5) + 2.00(4) 5 Error 1.00(5)

Final Report
March 2001 95
Appendix E DOE 3 Fully Nested ANOVA for Plated Halves of Samples 1 – 48 (Plated
Prior to Carburizing)
This was generated using MiniTab version 12.23
Fractional Factorial Fit
Estimated Effects and Coefficients for HRC (coded units)
Term Effect Coef StDev Coef T PConstant 43.822 0.2357 185.89 0.000Copper P -1.981 -0.991 0.2357 -4.20 0.001Case Dep -1.069 -0.534 0.2357 -2.27 0.038Subcriti 7.706 3.853 0.2357 16.34 0.000Rotary F 0.369 0.184 0.2357 0.78 0.446Copper P*Case Dep -1.819 -0.909 0.2357 -3.86 0.001Copper P*Subcriti -1.719 -0.859 0.2357 -3.65 0.002Copper P*Rotary F -0.981 -0.491 0.2357 -2.08 0.054Case Dep*Subcriti -2.481 -1.241 0.2357 -5.26 0.000Case Dep*Rotary F -1.344 -0.672 0.2357 -2.85 0.012Subcriti*Rotary F -0.269 -0.134 0.2357 -0.57 0.577Copper P*Case Dep*Subcriti -1.381 -0.691 0.2357 -2.93 0.010Copper P*Case Dep*Rotary F 0.181 0.091 0.2357 0.38 0.706Copper P*Subcriti*Rotary F -0.469 -0.234 0.2357 -0.99 0.335Case Dep*Subcriti*Rotary F -0.206 -0.103 0.2357 -0.44 0.668Copper P*Case Dep*Subcriti*Rotary F -0.181 -0.091 0.2357 -0.38 0.706
Analysis of Variance for HRC (coded units)
Source DF Seq SS Adj SS Adj MS F PMain Effects 4 516.719 516.719 129.180 72.64 0.0002-Way Interactions 6 122.074 122.074 20.346 11.44 0.0003-Way Interactions 4 17.624 17.624 4.406 2.48 0.0864-Way Interactions 1 0.263 0.263 0.263 0.15 0.706Residual Error 16 28.455 28.455 1.778 Pure Error 16 28.455 28.455 1.778Total 31 685.135
Unusual Observations for HRC at 0
Obs HRC at 0 Fit StDev Fit Residual St Resid 8 46.1000 43.9000 0.9430 2.2000 2.33R 24 41.7000 43.9000 0.9430 -2.2000 -2.33R
R denotes an observation with a large standardized residual
Estimated Coefficients for HRC using data in uncoded units
Term CoefConstant 2Copper P 56007Case Dep 567

Final Report
March 2001 96
Subcriti 0Rotary F 46Copper P*Case Dep -788263Copper P*Subcriti 17Copper P*Rotary F -70823Case Dep*Subcriti -0Case Dep*Rotary F -666Subcriti*Rotary F 0Copper P*Case Dep*Subcriti -10Copper P*Case Dep*Rotary F 972460Copper P*Subcriti*Rotary F -1Case Dep*Subcriti*Rotary F 0Copper P*Case Dep*Subcriti*Rotary F -828
Alias Structure
ICopperCaseSubcritiRotaryCopper*CaseCopper*SubcritiCopper*RotaryCase*SubcritiCase*RotarySubcriti*RotaryCopper*Case*SubcritiCopper*Case*RotaryCopper*Subcriti*RotaryCase*Subcriti*RotaryCopper*Case*Subcriti*Rotary
Fully Nested Analysis of Variance
Analysis of Variance for HRC at 0
Source DF SS MS F PCopper P 1 31.4028 31.4028 1.764 0.315Case Dep 2 35.6006 17.8003 0.126 0.885Subcriti 4 563.2388 140.8097 42.609 0.000Rotary F 8 26.4375 3.3047 1.858 0.139Error 16 28.4550 1.7784Total 31 685.1347
Variance Components
Source Var Comp. % of Total StDevCopper P 0.850 2.25 0.922Case Dep -15.376* 0.00 0.000Subcriti 34.376 91.02 5.863Rotary F 0.763 2.02 0.874Error 1.778 4.71 1.334

Final Report
March 2001 97
Total 37.768 6.146
* Value is negative, and is estimated by zero.
Expected Mean Squares
1 Copper P 1.00(5) + 2.00(4) + 4.00(3) + 8.00(2) + 16.00(1) 2 Case Dep 1.00(5) + 2.00(4) + 4.00(3) + 8.00(2) 3 Subcriti 1.00(5) + 2.00(4) + 4.00(3) 4 Rotary F 1.00(5) + 2.00(4) 5 Error 1.00(5)

Final Report
March 2001 98
Appendix F DOE 3 Fully Nested ANOVA for Plated Halves of Samples 49 – 96
(Plated After Carburizing)
This was generated using MiniTab version 12.23
Fractional Factorial Fit
Estimated Effects and Coefficients for HRC (coded units)
Term Effect Coef StDev Coef T PConstant 63.7500 0.3480 183.17 0.000Copper P -1.4875 -0.7438 0.3480 -2.14 0.048Case Dep 0.4125 0.2063 0.3480 0.59 0.562Subcriti -0.0875 -0.0437 0.3480 -0.13 0.902Rotary F -0.2125 -0.1062 0.3480 -0.31 0.764Copper P*Case Dep 0.4500 0.2250 0.3480 0.65 0.527Copper P*Subcriti -0.0250 -0.0125 0.3480 -0.04 0.972Copper P*Rotary F -0.3000 -0.1500 0.3480 -0.43 0.672Case Dep*Subcriti -0.0500 -0.0250 0.3480 -0.07 0.944Case Dep*Rotary F -0.5750 -0.2875 0.3480 -0.83 0.421Subcriti*Rotary F -0.2000 -0.1000 0.3480 -0.29 0.778Copper P*Case Dep*Subcriti 0.0375 0.0188 0.3480 0.05 0.958Copper P*Case Dep*Rotary F -0.1375 -0.0687 0.3480 -0.20 0.846Copper P*Subcriti*Rotary F -0.2375 -0.1187 0.3480 -0.34 0.737Case Dep*Subcriti*Rotary F -0.3375 -0.1687 0.3480 -0.48 0.634Copper P*Case Dep*Subcriti*Rotary F -1.1500 -0.5750 0.3480 -1.65 0.118
Analysis of Variance for HRC (coded units)
Source DF Seq SS Adj SS Adj MS F PMain Effects 4 19.485 19.485 4.8713 1.26 0.3272-Way Interactions 6 5.330 5.330 0.8883 0.23 0.9613-Way Interactions 4 1.525 1.525 0.3812 0.10 0.9814-Way Interactions 1 10.580 10.580 10.5800 2.73 0.118Residual Error 16 62.020 62.020 3.8763 Pure Error 16 62.020 62.020 3.8763Total 31 98.940
Observations for HRC at 0
Obs HRC at 0 Fit StDev Fit Residual St Resid 1 63.3000 63.8500 1.3922 -0.5500 -0.40 2 63.3000 63.0500 1.3922 0.2500 0.18 3 64.9000 65.1500 1.3922 -0.2500 -0.18 4 63.9000 63.1500 1.3922 0.7500 0.54 5 64.4000 64.6500 1.3922 -0.2500 -0.18 6 61.4000 61.9000 1.3922 -0.5000 -0.36 7 65.9000 64.1500 1.3922 1.7500 1.26 8 64.4000 64.9500 1.3922 -0.5500 -0.40 9 64.9000 65.1500 1.3922 -0.2500 -0.18 10 60.5000 62.2000 1.3922 -1.7000 -1.22 11 62.4000 63.9500 1.3922 -1.5500 -1.11

Final Report
March 2001 99
12 64.4000 63.8500 1.3922 0.5500 0.40 13 64.9000 64.4000 1.3922 0.5000 0.36 14 61.4000 63.1500 1.3922 -1.7500 -1.26 15 63.9000 64.6500 1.3922 -0.7500 -0.54 16 57.7000 61.8000 1.3922 -4.1000 -2.95R 17 64.4000 63.8500 1.3922 0.5500 0.40 18 62.8000 63.0500 1.3922 -0.2500 -0.18 19 65.4000 65.1500 1.3922 0.2500 0.18 20 62.4000 63.1500 1.3922 -0.7500 -0.54 21 64.9000 64.6500 1.3922 0.2500 0.18 22 62.4000 61.9000 1.3922 0.5000 0.36 23 62.4000 64.1500 1.3922 -1.7500 -1.26 24 65.5000 64.9500 1.3922 0.5500 0.40 25 65.4000 65.1500 1.3922 0.2500 0.18 26 63.9000 62.2000 1.3922 1.7000 1.22 27 65.5000 63.9500 1.3922 1.5500 1.11 28 63.3000 63.8500 1.3922 -0.5500 -0.40 29 63.9000 64.4000 1.3922 -0.5000 -0.36 30 64.9000 63.1500 1.3922 1.7500 1.26 31 65.4000 64.6500 1.3922 0.7500 0.54 32 65.9000 61.8000 1.3922 4.1000 2.95R
R denotes an observation with a large standardized residual
Estimated Coefficients for HRC using data in uncoded units
Term CoefConstant 22Copper P 99336Case Dep 892Subcriti 0Rotary F 62Copper P*Case Dep -2111751Copper P*Subcriti -182Copper P*Rotary F -148957Case Dep*Subcriti -1Case Dep*Rotary F -1228Subcriti*Rotary F -0Copper P*Case Dep*Subcriti 3955Copper P*Case Dep*Rotary F 2951341Copper P*Subcriti*Rotary F 241Case Dep*Subcriti*Rotary F 2Copper P*Case Dep*Subcriti*Rotary F -5251
Alias Structure
ICopperCaseSubcritiRotaryCopper*CaseCopper*SubcritiCopper*RotaryCase*SubcritiCase*Rotary

Final Report
March 2001 100
Subcriti*RotaryCopper*Case*SubcritiCopper*Case*RotaryCopper*Subcriti*RotaryCase*Subcriti*RotaryCopper*Case*Subcriti*Rotary
Fully Nested Analysis of Variance
Analysis of Variance for HRC at 0
Source DF SS MS F PCopper P 1 17.7013 17.7013 11.875 0.075Case Dep 2 2.9812 1.4906 61.154 0.001Subcriti 4 0.0975 0.0244 0.012 1.000Rotary F 8 16.1400 2.0175 0.520 0.824Error 16 62.0200 3.8763Total 31 98.9400
Variance Components
Source Var Comp. % of Total StDevCopper P 1.013 19.97 1.007Case Dep 0.183 3.61 0.428Subcriti -0.498* 0.00 0.000Rotary F -0.929* 0.00 0.000Error 3.876 76.41 1.969Total 5.073 2.252
* Value is negative, and is estimated by zero.
Expected Mean Squares
1 Copper P 1.00(5) + 2.00(4) + 4.00(3) + 8.00(2) + 16.00(1) 2 Case Dep 1.00(5) + 2.00(4) + 4.00(3) + 8.00(2) 3 Subcriti 1.00(5) + 2.00(4) + 4.00(3) 4 Rotary F 1.00(5) + 2.00(4) 5 Error 1.00(5)
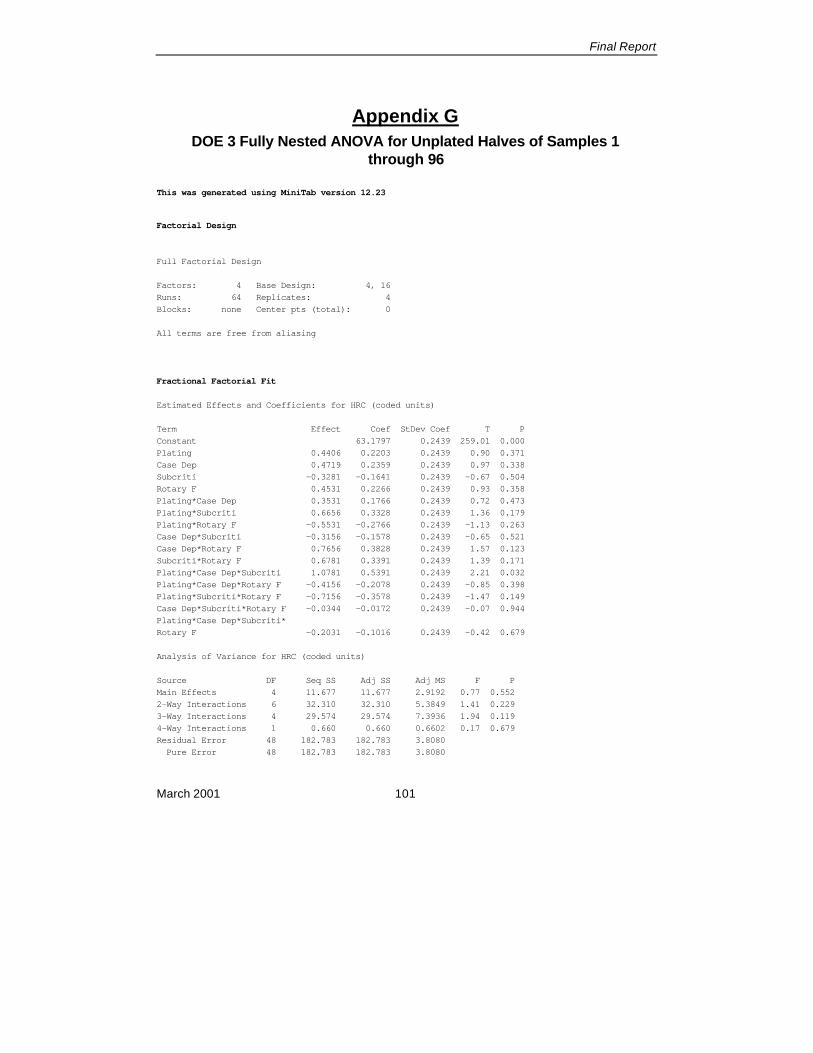
Final Report
March 2001 101
Appendix G DOE 3 Fully Nested ANOVA for Unplated Halves of Samples 1
through 96
This was generated using MiniTab version 12.23
Factorial Design
Full Factorial Design
Factors: 4 Base Design: 4, 16Runs: 64 Replicates: 4Blocks: none Center pts (total): 0
All terms are free from aliasing
Fractional Factorial Fit
Estimated Effects and Coefficients for HRC (coded units)
Term Effect Coef StDev Coef T PConstant 63.1797 0.2439 259.01 0.000Plating 0.4406 0.2203 0.2439 0.90 0.371Case Dep 0.4719 0.2359 0.2439 0.97 0.338Subcriti -0.3281 -0.1641 0.2439 -0.67 0.504Rotary F 0.4531 0.2266 0.2439 0.93 0.358Plating*Case Dep 0.3531 0.1766 0.2439 0.72 0.473Plating*Subcriti 0.6656 0.3328 0.2439 1.36 0.179Plating*Rotary F -0.5531 -0.2766 0.2439 -1.13 0.263Case Dep*Subcriti -0.3156 -0.1578 0.2439 -0.65 0.521Case Dep*Rotary F 0.7656 0.3828 0.2439 1.57 0.123Subcriti*Rotary F 0.6781 0.3391 0.2439 1.39 0.171Plating*Case Dep*Subcriti 1.0781 0.5391 0.2439 2.21 0.032Plating*Case Dep*Rotary F -0.4156 -0.2078 0.2439 -0.85 0.398Plating*Subcriti*Rotary F -0.7156 -0.3578 0.2439 -1.47 0.149Case Dep*Subcriti*Rotary F -0.0344 -0.0172 0.2439 -0.07 0.944Plating*Case Dep*Subcriti*Rotary F -0.2031 -0.1016 0.2439 -0.42 0.679
Analysis of Variance for HRC (coded units)
Source DF Seq SS Adj SS Adj MS F PMain Effects 4 11.677 11.677 2.9192 0.77 0.5522-Way Interactions 6 32.310 32.310 5.3849 1.41 0.2293-Way Interactions 4 29.574 29.574 7.3936 1.94 0.1194-Way Interactions 1 0.660 0.660 0.6602 0.17 0.679Residual Error 48 182.783 182.783 3.8080 Pure Error 48 182.783 182.783 3.8080

Final Report
March 2001 102
Total 63 257.004
Unusual Observations for HRC at 0
Obs HRC at 0 Fit StDev Fit Residual St Resid 13 54.2000 59.9500 0.9757 -5.7500 -3.40R 22 57.8000 62.0000 0.9757 -4.2000 -2.49R
R denotes an observation with a large standardized residual
Estimated Coefficients for HRC using data in uncoded units
Term CoefConstant 71.1Plating -1.8Case Dep -130.1Subcriti -0.0Rotary F -11.7Plating*Case Dep 12.2Plating*Subcriti -0.0Plating*Rotary F 3.6Case Dep*Subcriti -0.0Case Dep*Rotary F 201.3Subcriti*Rotary F 0.0Plating*Case Dep*Subcriti 0.1Plating*Case Dep*Rotary F -45.7Plating*Subcriti*Rotary F -0.0Case Dep*Subcriti*Rotary F -0.0Plating*Case Dep*Subcriti*Rotary F -0.1
* NOTE * There is partial confounding, no alias table was printed.
Fully Nested Analysis of Variance
Analysis of Variance for HRC at 0
Source DF SS MS F PPlating 1 3.1064 3.1064 1.118 0.401Case Dep 2 5.5578 2.7789 0.383 0.704Subcriti 4 29.0031 7.2508 1.587 0.268Rotary F 8 36.5537 4.5692 1.200 0.319Error 48 182.7825 3.8080Total 63 257.0036
Variance Components
Source Var Comp. % of Total StDevPlating 0.010 0.24 0.101Case Dep -0.279* 0.00 0.000Subcriti 0.335 7.72 0.579Rotary F 0.190 4.38 0.436Error 3.808 87.67 1.951Total 4.344 2.084

Final Report
March 2001 103
* Value is negative, and is estimated by zero.
Expected Mean Squares
1 Plating 1.00(5) + 4.00(4) + 8.00(3) + 16.00(2) + 32.00(1) 2 Case Dep 1.00(5) + 4.00(4) + 8.00(3) + 16.00(2) 3 Subcriti 1.00(5) + 4.00(4) + 8.00(3) 4 Rotary F 1.00(5) + 4.00(4) 5 Error 1.00(5)

Final Report
March 2001 104
Appendix H Honeywell Preproduction Experimentation Final Report