contract report 942-02 (addendum 3): fuel consumption and ... · according to the tmc fuel...
TRANSCRIPT
Contract Report CR 942-02 (Addendum 3)
Phone: 1-514-782-4520 Toll-free: 1-855-472-1159
thepitgroup.com
Follow us:
Contract report 942-02 (Addendum 3):
Fuel Consumption and Emissions Tests of the
HydraGen™ Technology from Dynacert
CONFIDENTIAL
Reserved for FPInnovations – PIT Group contract cooperators and staff

Contract Report CR 942-02 (Addendum 3)
THIS PAGE INTENTIONALLY LEFT BLANK
Contract Report CR 942-02 (Addendum 3)
REPORT APPROVAL FORM
REPORT TYPE : Contract report 942-02 (Addendum 3)
# PROJET: 301012126
TITLE :
Fuel Consumption and Emissions Tests of the HydraGen™ Technology from Dynacert
COMPANY
Dynacert, 101-501 Alliance Ave., Toronto, Ontario, Canada, M6N 2J1
DATE : November 8, 2017 REVIEWER :
Jan Michaelsen, F.E., Research Leader Transport and Energy, Interim Research Leader PIT Group
SIGNATURES
Date : November 8, 2017
Jan Michaelsen, F.E., Research Leader Transport and Energy, Interim Research Leader PIT Group

Contract Report CR 942-02 (Addendum 3)
THIS PAGE INTENTIONALLY LEFT BLANK

Contract Report CR 942-02 (Addendum 3)
Contract report 942-02 (Addendum 3):
Fuel Consumption and Emissions Tests of the HydraGen™ Technology from Dynacert
Marius-Dorin Surcel,
Eng., M.A.Sc. (135765)
November 8, 2017
© Copyright 2017, FPInnovations
Reserved for FPInnovations - PIT Group contract cooperators and staff
CONFIDENTIAL

Contract Report CR 942-02 (Addendum 3)
Discover the PIT Group
PIT Group is one of eleven research groups of FPInnovations, which has over 400 employees at six main offices all across Canada and in the United States, as well as in regional offices located in each Canadian province.
PIT Group’s team of researchers has been active in the field of transportation for over 35 years. This team's mission is to improve each phase of the transportation system, cut costs and emissions, and increase the safety of operations.
By working together and by using the most recent technological and operational innovations, our world-class professionals specialize in delivering concrete solutions at reasonable costs, as we are a non-profit research and development institute.
As part of services offered to clients, PIT Group supports fleets and suppliers, implements solutions for specific problems, and develops combined integrated solutions for more complex problems depending on clients’ needs.
ISO 17025 certified tests
The Standards Council of Canada (SCC) granted the ISO/IEC 17025:2005 (CAN-P-4E) accreditation for tests conducted by PIT Group. This standard is the international reference for testing laboratories, and it is rarely granted to tests conducted outside of laboratories.
PIT Group testing activities under the ISO 17025 certification include fuel consumption testing for heavy-duty vehicles, such as testing according to SAE J1321 and TMC Fuel Consumption Test Procedure - Type II, SAE J1526 Fuel Consumption Test Procedure (Engineering Method), and TMC Fuel Consumption Test Procedure – Type III, EPA SmartWay Test Methods, fuel consumption testing for light-duty vehicles, and emissions testing using portable emission measurement system (PEMS) according to EPA regulations.
Our mission
Innovative, world-class engineering group contributing toward the development and accelerated implementation of safe, sustainable, and efficient technologies that support excellence in North America’s transportation industry.
Strategy
To be the information hub among technology suppliers and carriers:
1. The most efficient, productive fleets rely on our indisputable findings to select the technologies that will give them a substantial competitive edge.
2. The most innovative technology suppliers bank on our expertise and our in-depth knowledge of the needs of fleets to develop better products.
3. We create alliances with the best organizations in the world to push the limits of technological innovation in sustainable and smart mobility.

7 / 38 Contract Report CR 942-02 (Addendum 3)
Table of contents
Context...................................................................................................................................................................... 9
Technology ............................................................................................................................................................... 9
Methodology ............................................................................................................................................................ 9
Test site ................................................................................................................................................................. 9
Test vehicles ....................................................................................................................................................... 10
Fuel consumption test procedure ..................................................................................................................... 12
Driving procedure............................................................................................................................................... 13
Emissions measurement procedure .................................................................................................................. 14
Test equipment .................................................................................................................................................. 15
Installation of HydraGen™ on test vehicle ............................................................................................................ 15
Test results .............................................................................................................................................................. 17
Fuel consumption test results ........................................................................................................................... 17
Emissions measurement results ........................................................................................................................ 19
Discussion ............................................................................................................................................................... 21
Summary ................................................................................................................................................................. 27
Disclaimer ............................................................................................................................................................... 27
References .............................................................................................................................................................. 28
Appendix A. Fuel consumption test segment data collection .............................................................................. 29
Baseline segment ............................................................................................................................................... 29
Test segment 1 ................................................................................................................................................... 31
Test segment 2 ................................................................................................................................................... 33
Appendix B. Fuel consumption test data analysis ................................................................................................. 35
Test 1 .................................................................................................................................................................. 35
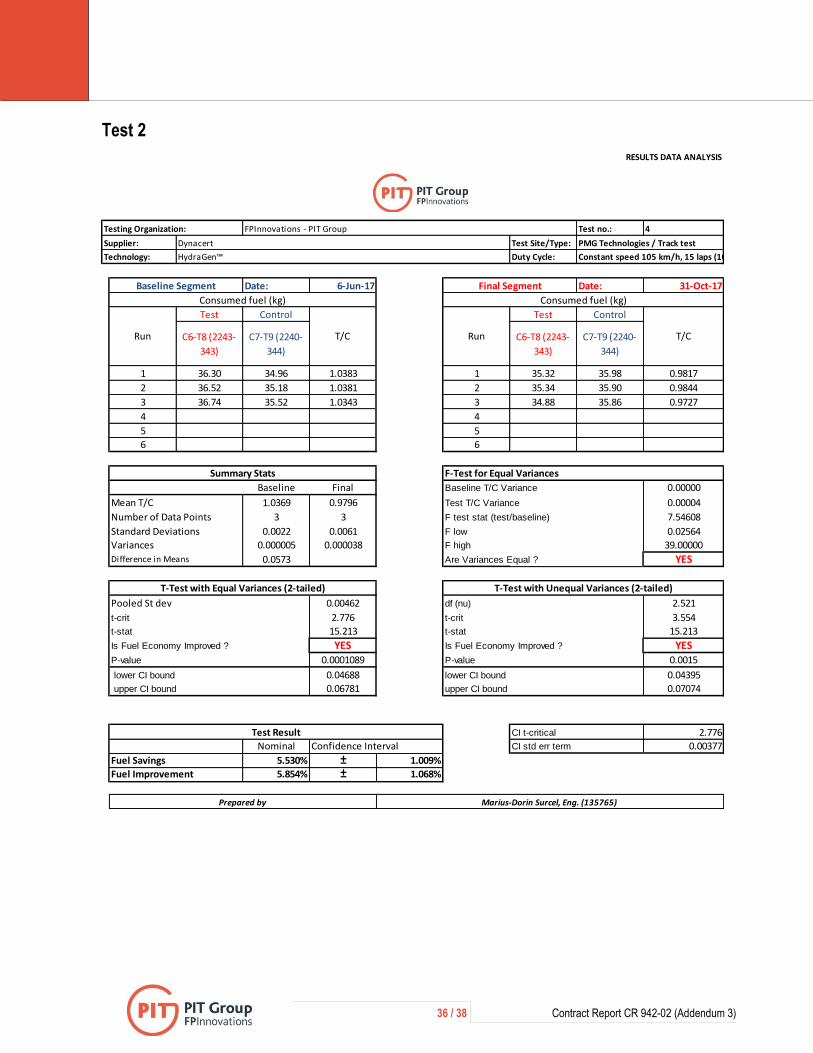
Test 2 .................................................................................................................................................................. 36

8 / 38 Contract Report CR 942-02 (Addendum 3)
List of figures
Figure 1. Test site with radar checkpoints and weather station positions. ........................................................... 9 Figure 2. Test vehicle C6-T8. .................................................................................................................................. 11 Figure 3. Control vehicle C7-T9. ............................................................................................................................. 11 Figure 4. Installation of the portable fuel tanks. ................................................................................................... 12 Figure 5. Test vehicle during track emissions measurement ................................................................................ 14 Figure 6. Installation of HydraGen™ on test vehicle C6 (2243). ........................................................................... 16 Figure 7. Gas injection port on air intake manifold on test vehicle C6 (2243). .................................................... 16 Figure 8. Measurement of environmental conditions at the test site. ................................................................ 21 Figure 9. Air density variation during the tests. .................................................................................................... 22 Figure 10. Wind speed variation during baseline segment. ................................................................................. 22 Figure 11. Wind speed variation during the first test segment. ........................................................................... 23 Figure 12. Wind speed variation during the second test segment. ...................................................................... 23 Figure 13. Scale checking using a calibration weight set. ..................................................................................... 24
List of tables
Table 1. Vehicle data .............................................................................................................................................. 10 Table 2. Summary of test results: first test ........................................................................................................... 18 Table 3. Summary of test results: second test ...................................................................................................... 18 Table 4. Summary of emissions measurement results for test vehicle C6 (2243) ............................................... 19 Table 5. Summary of test results ........................................................................................................................... 27

9 / 38 Contract Report CR 942-02 (Addendum 3)
Context
Dynacert, based at 101-501 Alliance Ave., Toronto, Ontario, Canada, M6N 2J1 , mandated FPInnovations PIT Group to conduct testing to evaluate the impact on fuel consumption and emissions of the HydraGen™ technology. This testing program was based respectively on the TMC Fuel Consumption Test Procedure – Type II, RP 1102A (TMC 2016a), and CFR (Code of Federal Regulation), Title 40 Part 1065, Engine Testing Procedures, Part 1065 - Subpart J PEMS Testing (CFR 2008).
This report presents the tests of contract 942 -02 - Addendum 3, as well as the first phase of the testing for contract 942-02, which was originally presented in Contract Report 942-02 (Surcel 2017).
Technology
HydraGen™ technology is designed for on-road applications with Class 6 - 8 vehicles. According to the manufacturer, HydraGen™ is a portable, safe and reliable aftermarket unit that produces hydrogen and oxygen on demand, from the electrolysis of distilled water. The addition of hydrogen and oxygen gases through the air intake would improve the combustion resulting in a more complete fuel burn which would deliver increased fuel economy, increased torque, lower emissions, and extend engine oil life. The system runs directly from the vehicles power system providing for high electrical efficiency and shuts off when the truck key is off.
Methodology
Test site
The tests were performed at the Transport Canada Motor Vehicle Test Centre located at 100 rue du Landais, Blainville (QC), Canada, J7C 5C9, which is presently operated by PMG Technologies (Figure 1).
Figure 1. Test site with radar checkpoints and weather station positions.
10 / 38 Contract Report CR 942-02 (Addendum 3)
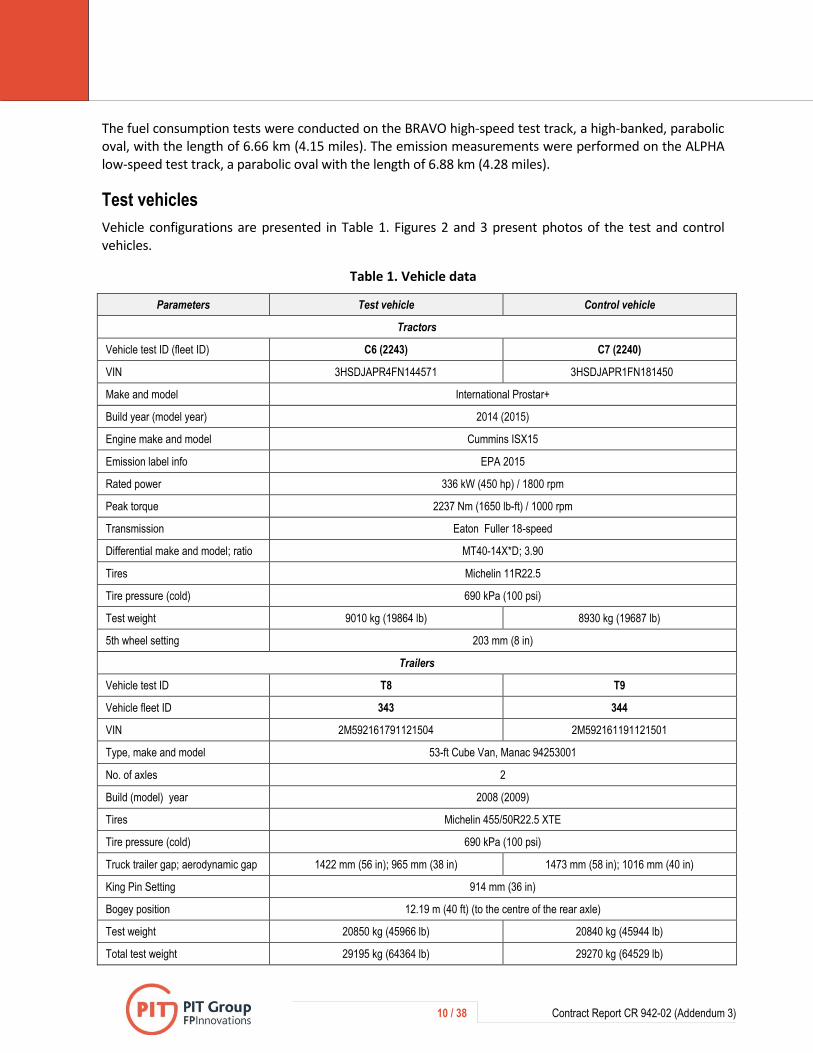
The fuel consumption tests were conducted on the BRAVO high-speed test track, a high-banked, parabolic oval, with the length of 6.66 km (4.15 miles). The emission measurements were performed on the ALPHA low-speed test track, a parabolic oval with the length of 6.88 km (4.28 miles).
Test vehicles
Vehicle configurations are presented in Table 1. Figures 2 and 3 present photos of the test and control vehicles.
Table 1. Vehicle data
Parameters Test vehicle Control vehicle
Tractors
Vehicle test ID (fleet ID) C6 (2243) C7 (2240)
VIN 3HSDJAPR4FN144571 3HSDJAPR1FN181450
Make and model International Prostar+
Build year (model year) 2014 (2015)
Engine make and model Cummins ISX15
Emission label info EPA 2015
Rated power 336 kW (450 hp) / 1800 rpm
Peak torque 2237 Nm (1650 lb-ft) / 1000 rpm
Transmission Eaton Fuller 18-speed
Differential make and model; ratio MT40-14X*D; 3.90
Tires Michelin 11R22.5
Tire pressure (cold) 690 kPa (100 psi)
Test weight 9010 kg (19864 lb) 8930 kg (19687 lb)
5th wheel setting 203 mm (8 in)
Trailers
Vehicle test ID T8 T9
Vehicle fleet ID 343 344
VIN 2M592161791121504 2M592161191121501
Type, make and model 53-ft Cube Van, Manac 94253001
No. of axles 2
Build (model) year 2008 (2009)
Tires Michelin 455/50R22.5 XTE
Tire pressure (cold) 690 kPa (100 psi)
Truck trailer gap; aerodynamic gap 1422 mm (56 in); 965 mm (38 in) 1473 mm (58 in); 1016 mm (40 in)
King Pin Setting 914 mm (36 in)
Bogey position 12.19 m (40 ft) (to the centre of the rear axle)
Test weight 20850 kg (45966 lb) 20840 kg (45944 lb)
Total test weight 29195 kg (64364 lb) 29270 kg (64529 lb)

11 / 38 Contract Report CR 942-02 (Addendum 3)
Figure 2. Test vehicle C6-T8.
Figure 3. Control vehicle C7-T9.

12 / 38 Contract Report CR 942-02 (Addendum 3)
Fuel consumption test procedure
The test procedure was based on TMC Fuel Consumption Test Procedure – Type II, RP 1102A (TMC 2016). The tests were conducted in test conditions according to this recommended practice, which aims to obtain results that can be considered representative of actual service conditions: this applies to load, weather, wind, etc.
The fuel consumption tests were conducted on the BRAVO high-speed test track. The length of a test run was 15 laps (100 km), with departure and arrival at the same position along the track.
According to the TMC Fuel Consumption Test Procedure – Type II, RP 1102A (TMC 2016), the test compared the fuel consumption of a test vehicle operating under two conditions versus an unmodified control vehicle. Fuel consumption was accurately measured by weighing portable tanks before and after each run. The repeatability of the scale measurements was periodically checked during the tests using a set calibration weight. Figure 4 shows the installation of the portable tanks.
Figure 4. Installation of the portable fuel tanks.
Control and test vehicles had the same general configuration and were coupled to the same semi-trailers for the baseline and test segments. The vehicle weights remained the same throughout the entire test segment. The vehicles were in good working condition, with all settings adjusted to the manufacturer's specifications.
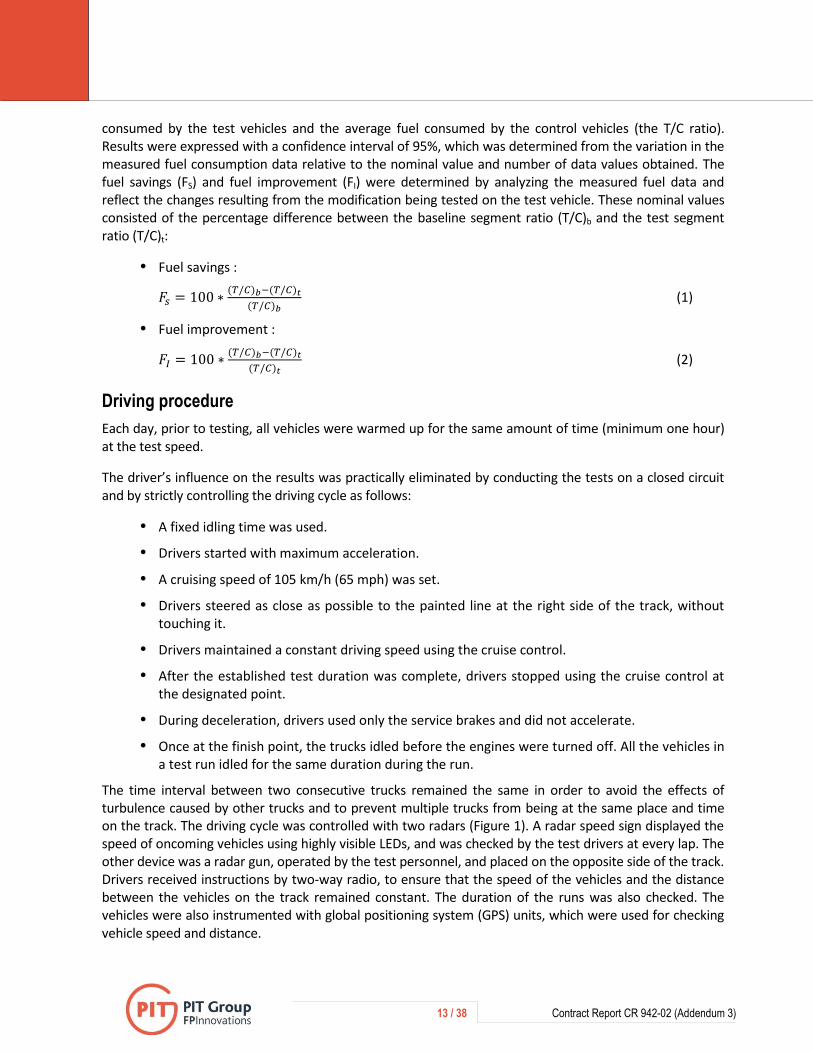
The test consisted of a baseline segment (using non-modified vehicles) followed by two test segments (the technology being tested, the HydraGen™, was used on the test vehicles while the control vehicle stayed in its original state). For all segments, the representative results were the ratio between the average fuel
13 / 38 Contract Report CR 942-02 (Addendum 3)
consumed by the test vehicles and the average fuel consumed by the control vehicles (the T/C ratio). Results were expressed with a confidence interval of 95%, which was determined from the variation in the measured fuel consumption data relative to the nominal value and number of data values obtained. The fuel savings (FS) and fuel improvement (FI) were determined by analyzing the measured fuel data and reflect the changes resulting from the modification being tested on the test vehicle. These nominal values consisted of the percentage difference between the baseline segment ratio (T/C)b and the test segment ratio (T/C)t:
Fuel savings :
𝐹𝑠 = 100 ∗(𝑇/𝐶)𝑏−(𝑇/𝐶)𝑡
(𝑇/𝐶)𝑏 (1)
Fuel improvement :
𝐹𝐼 = 100 ∗(𝑇/𝐶)𝑏−(𝑇/𝐶)𝑡
(𝑇/𝐶)𝑡 (2)
Driving procedure
Each day, prior to testing, all vehicles were warmed up for the same amount of time (minimum one hour) at the test speed.
The driver’s influence on the results was practically eliminated by conducting the tests on a closed circuit and by strictly controlling the driving cycle as follows:
A fixed idling time was used.
Drivers started with maximum acceleration.
A cruising speed of 105 km/h (65 mph) was set.
Drivers steered as close as possible to the painted line at the right side of the track, without touching it.
Drivers maintained a constant driving speed using the cruise control.
After the established test duration was complete, drivers stopped using the cruise control at the designated point.
During deceleration, drivers used only the service brakes and did not accelerate.
Once at the finish point, the trucks idled before the engines were turned off. All the vehicles in a test run idled for the same duration during the run.
The time interval between two consecutive trucks remained the same in order to avoid the effects of turbulence caused by other trucks and to prevent multiple trucks from being at the same place and time on the track. The driving cycle was controlled with two radars (Figure 1). A radar speed sign displayed the speed of oncoming vehicles using highly visible LEDs, and was checked by the test drivers at every lap. The other device was a radar gun, operated by the test personnel, and placed on the opposite side of the track. Drivers received instructions by two-way radio, to ensure that the speed of the vehicles and the distance between the vehicles on the track remained constant. The duration of the runs was also checked. The vehicles were also instrumented with global positioning system (GPS) units, which were used for checking vehicle speed and distance.
14 / 38 Contract Report CR 942-02 (Addendum 3)
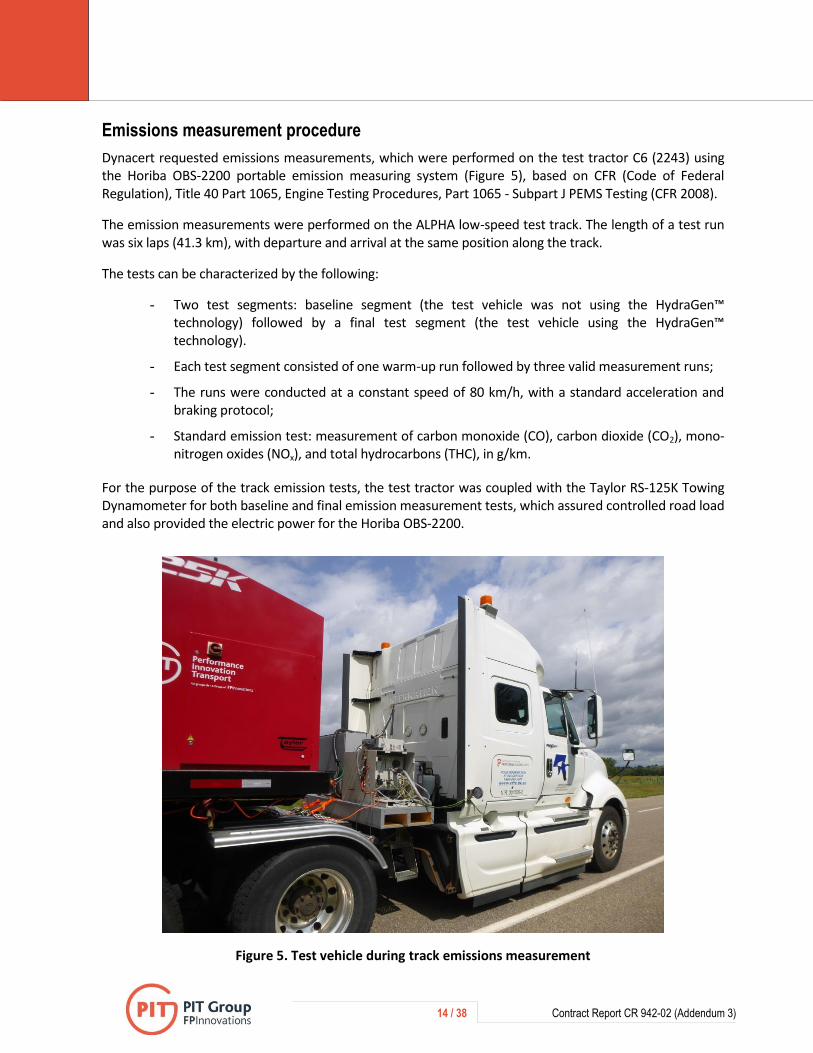
Emissions measurement procedure
Dynacert requested emissions measurements, which were performed on the test tractor C6 (2243) using the Horiba OBS-2200 portable emission measuring system (Figure 5), based on CFR (Code of Federal Regulation), Title 40 Part 1065, Engine Testing Procedures, Part 1065 - Subpart J PEMS Testing (CFR 2008).
The emission measurements were performed on the ALPHA low-speed test track. The length of a test run was six laps (41.3 km), with departure and arrival at the same position along the track.
The tests can be characterized by the following:
- Two test segments: baseline segment (the test vehicle was not using the HydraGen™ technology) followed by a final test segment (the test vehicle using the HydraGen™ technology).
- Each test segment consisted of one warm-up run followed by three valid measurement runs;
- The runs were conducted at a constant speed of 80 km/h, with a standard acceleration and braking protocol;
- Standard emission test: measurement of carbon monoxide (CO), carbon dioxide (CO2), mono-nitrogen oxides (NOx), and total hydrocarbons (THC), in g/km.
For the purpose of the track emission tests, the test tractor was coupled with the Taylor RS-125K Towing Dynamometer for both baseline and final emission measurement tests, which assured controlled road load and also provided the electric power for the Horiba OBS-2200.
Figure 5. Test vehicle during track emissions measurement

15 / 38 Contract Report CR 942-02 (Addendum 3)
Test equipment
The following equipment was used during the tests:
Portable tanks with a capacity of 144 L (38 gallons): Norcan Aluminum 103461;
Calibrated scale with a capacity of 226.80 kg and a resolution of 0.02 kg: Weigh-Tronix DS 2424 A - 005, serial no. 76096; Calibration certificate NA6729-003-032817 from March 28, 2017.
Calibrated scale with a capacity of 150 kg and a resolution of 0.02 kg: Ohaus 3000 serial no. 0015208-635; Calibration certificate NA6729-005-032817 from March 28, 2017.
Vehicle scale: Moducam Bamd1117-5801L, serial no. 261102; Indicator: Rice-Lake; Calibration from April, 2017.
Calibration weights TROEMNER 20 kg, serial no. FP-01, FP-02, FP-03, FP-04, FP-05, FP-06: Calibration certificate W-042658-24187 from March 20, 2017.
Thermometer and hygrometer: Vaisala, model HMP-233, serial no. X0550005, range 0 - 100% RH; -40° to 60 °C; accuracy +/- 1%; +/- 0.1 °C; Calibration certificate 209692 from April 10, 2017.
Wind monitor: Young model SE 09101, serial no. 118857, range 0-100 m/s; 0°-360°; accuracy ±0.3 m/s; ± 2°; Calibration certificate 209694 from April 20, 2017;
Wind speed sensor: Campbell Scientific, model 014A, serial no. N5094, range 0-100 mph, accuracy 0.25 mph (0.40 km/h); Calibration certificate 209693 from April 20, 2017;
Barometric pressure transducer: Omega, model PX2760-600A5V, serial no. 4892413, accuracy ± 0.25%; Calibration certificate 209691 from April 10, 2017;
Data acquisition system: Fluke, model Hydra (2635A) Data Bucket, serial no. 5796307, accuracy ± 0.018%; Calibration certificate 209690 from April 10, 2017;
Onboard computers: ISAAC DRU900, with GPS, speed precision 0.03 m/s.
Horiba OBS-2200 portable emission measurement system: serial no. S2000594944000010, calibration before every measurement according to the On Board Emission Measurement System OBS-2200 Instruction Manual (Horiba 2011).
Taylor RS-125K Towing Dynamometer, serial no.1P9CP4221EB343609, calibration before every measurement according to the RS-90K - 200K Towing Dynamometer Operation & Maintenance Manual (Taylor Dynamometer Inc. 2013).
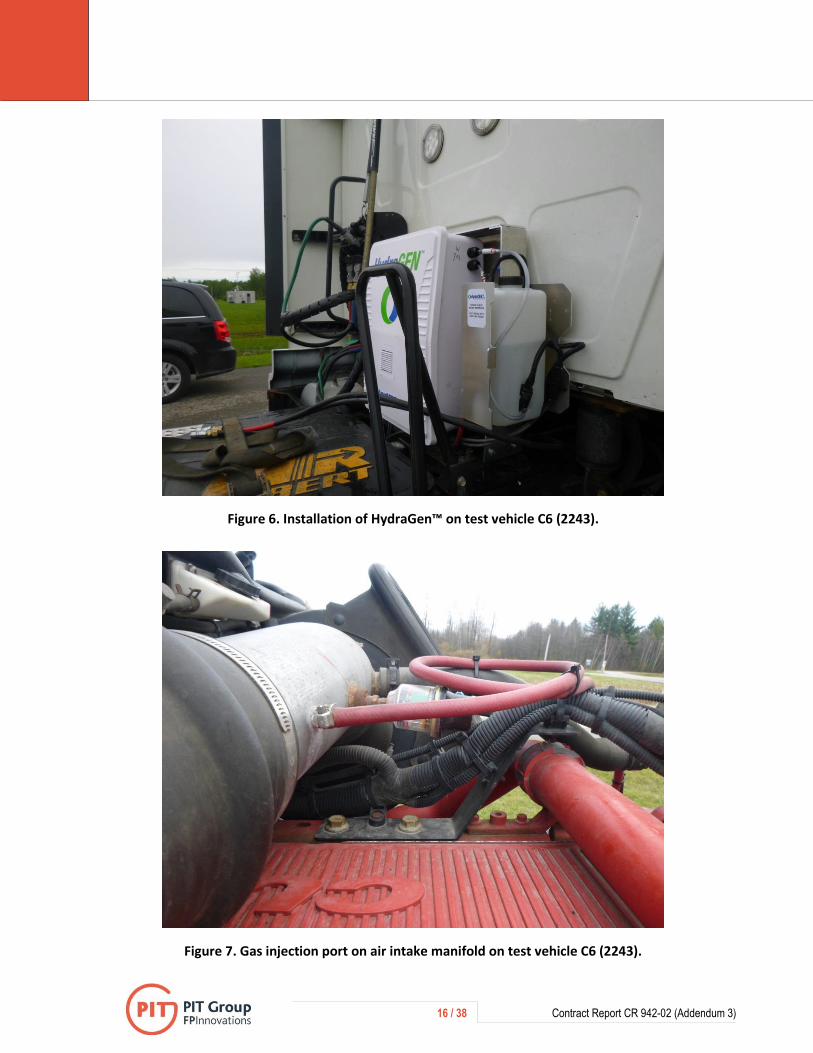
Installation of HydraGen™ on test vehicle
The installation of HydraGen™ on the test vehicle C6 (2243) was done after the baseline test segment completed in the morning of June 6, 2017. The HydraGen™ device was installed on the test vehicle by, and under the supervision of Mr. Ruston Hoffman and Mr. Larry Amoh, the representatives of Dynacert.
Vehicle mileage at installation of the HydraGen™ was 154 277 km. After the installation of the device, the test vehicle accumulated break-in distance of 11 495 km, between June 7 and August 22, 2017, when the first test segment was completed, and of 24 181 km between June 7 and October 31, 2017, when the second test segment was completed. Figure 6 and Figure 7 present photos of the devices installed on the test vehicle.
16 / 38 Contract Report CR 942-02 (Addendum 3)
Figure 6. Installation of HydraGen™ on test vehicle C6 (2243).
Figure 7. Gas injection port on air intake manifold on test vehicle C6 (2243).
17 / 38 Contract Report CR 942-02 (Addendum 3)
Test results
Fuel consumption test results
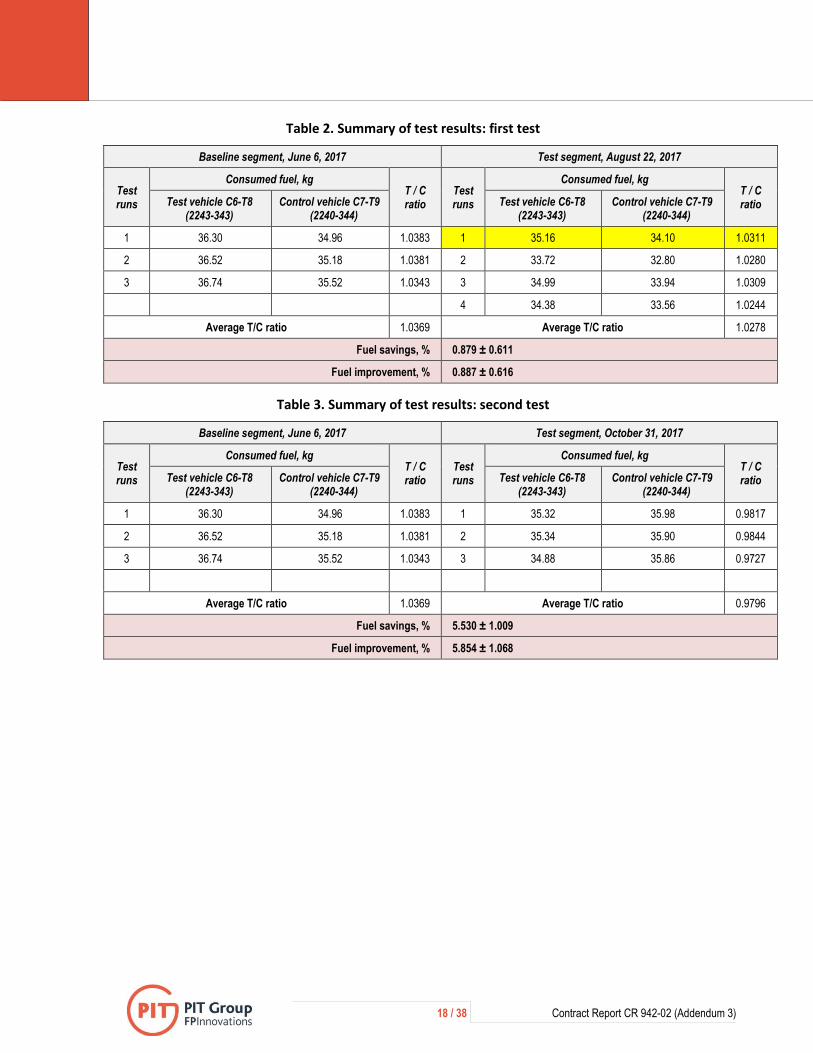
The following results were obtained for HydraGen™from Dynacert:
First test (see Table 2):
o Fuel savings: 0.879 % ± 0.611 %
o Fuel improvement: 0.887 % ± 0.616 %
Second test (see Table 3):
o Fuel savings: 5.530 % ± 1.009 %
o Fuel improvement: 5.854 % ± 1.068 %
These results were obtained at:
o Trailer weight 20850 kg (45966 lb.), tractor weight 9010 kg (19864 lb.); Tractor-trailer gap1: 1422 mm (56 in.); aerodynamic gap2: 965 mm (38 in.);
o Mean vehicle speed: 105 km/h (65 mph);
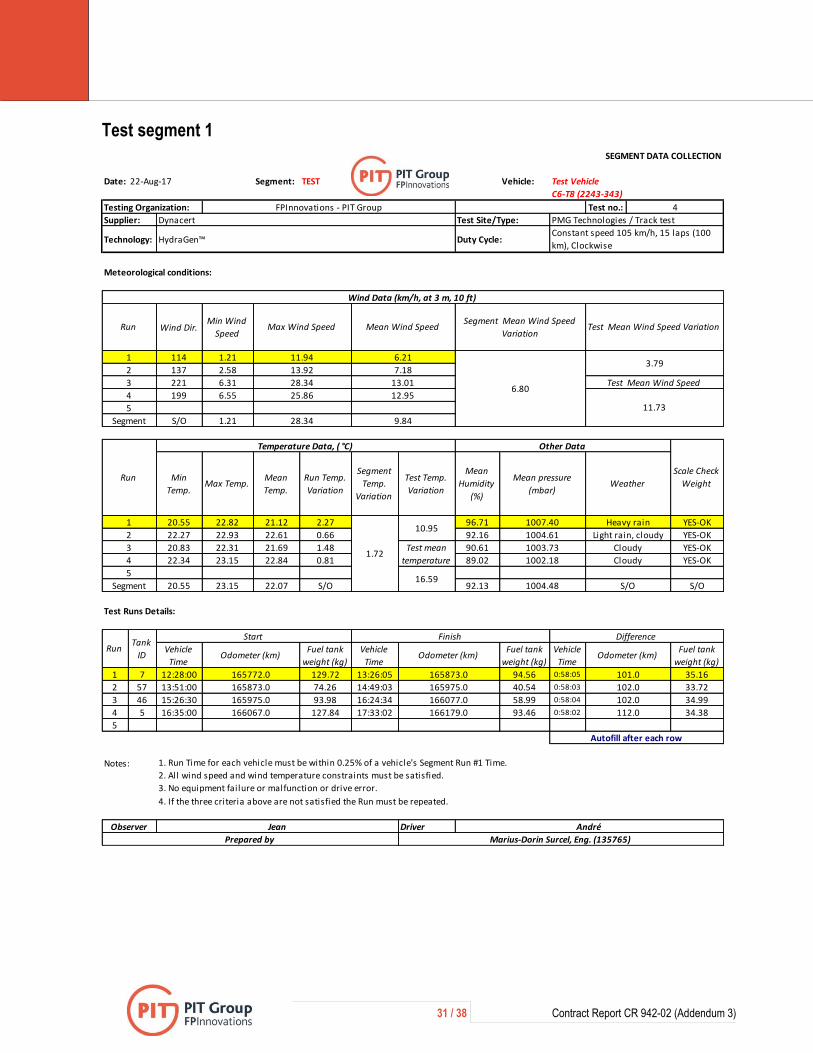
o Mean air temperature:
First test 16.59 ± 5.48 °C (61.86 ± 9.86 °F);
Second test 9.78 ± 1.34 °C (49.6 ± 2.41 °F);
o Mean wind speed:
First test 11.73 ± 1.90 km/h (7.29 ± 1.18 mph);
Second test 18.5 ± 4.88 km/h (11.5 ± 3.03 mph).
Tables 2 and 3 summarize the results and details of the baseline and test segments are presented in Appendix A. Appendix B presents data analysis.
The first test run of the first test segment (Table 2) was determined to be invalid because of heavy rain and pounding water on the test track. This test run is highlighted in yellow.
1 Longitudinal distance between the vertical flat surface of the back of the cab/sleeper to the vertical flat surface on the front of the
trailer (SAE International 2012). 2 Longitudinal distance between the aft most point of the cab external surface, including aerodynamic side fairings, and the
forward most point of the cargo-carrying portion of the vehicle (SAE International 2012).
18 / 38 Contract Report CR 942-02 (Addendum 3)
Table 2. Summary of test results: first test
Baseline segment, June 6, 2017 Test segment, August 22, 2017
Test runs
Consumed fuel, kg T / C ratio
Test runs
Consumed fuel, kg T / C ratio Test vehicle C6-T8
(2243-343) Control vehicle C7-T9
(2240-344) Test vehicle C6-T8
(2243-343) Control vehicle C7-T9
(2240-344)
1 36.30 34.96 1.0383 1 35.16 34.10 1.0311
2 36.52 35.18 1.0381 2 33.72 32.80 1.0280
3 36.74 35.52 1.0343 3 34.99 33.94 1.0309
4 34.38 33.56 1.0244
Average T/C ratio 1.0369 Average T/C ratio 1.0278
Fuel savings, % 0.879 ± 0.611
Fuel improvement, % 0.887 ± 0.616
Table 3. Summary of test results: second test
Baseline segment, June 6, 2017 Test segment, October 31, 2017
Test runs
Consumed fuel, kg T / C ratio
Test runs
Consumed fuel, kg T / C ratio Test vehicle C6-T8
(2243-343) Control vehicle C7-T9
(2240-344) Test vehicle C6-T8
(2243-343) Control vehicle C7-T9
(2240-344)
1 36.30 34.96 1.0383 1 35.32 35.98 0.9817
2 36.52 35.18 1.0381 2 35.34 35.90 0.9844
3 36.74 35.52 1.0343 3 34.88 35.86 0.9727
Average T/C ratio 1.0369 Average T/C ratio 0.9796
Fuel savings, % 5.530 ± 1.009
Fuel improvement, % 5.854 ± 1.068

19 / 38 Contract Report CR 942-02 (Addendum 3)
Emissions measurement results
Table 4 presents the results of emissions measurement.
The results are showing significant decreases in emission levels between baseline and final measurements, of almost half for carbon monoxide (CO), total hydrocarbons (THC), and for mono-nitrogen oxides (NOx).
There is not a noticeable difference between baseline and final measurement results for carbon dioxide (CO2).
Table 4. Summary of emissions measurement results for test vehicle C6 (2243)
Test stage Baseline Final
Date June 7, 2017 August 23, 2017
Test 1 2 3 Average 1 2 3 Average
Time 12:48:17 13:30:11 14:14:41 - 12:02:00 12:47:00 1:28:00 -
Emissions
CO, g/km 1.200 0.461 0.643 0.768 0.123 0.482 0.623 0.409
CO2, g/km 676.342 661.805 680.709 672.952 682.247 673.642 672.883 676.257
THC, g/km 0.009 0.012 0.014 0.012 0.009 0.003 0.007 0.006
NOx, g/km 0.287 0.200 0.195 0.227 0.183 0.094 0.100 0.126
NOx corr.,g/km 0.290 0.202 0.198 0.230 0.180 0.093 0.098 0.124
Average test conditions
Distance (km) 41.36 41.36 41.37 41.36 41.44 41.35 41.36 41.38
Temperature, °C 23.22 23.91 24.42 23.85 19.04 19.55 20.06 19.55
Humidity, % 45.99 44.24 44.67 44.97 60.52 58.76 56.46 58.58
Pressure, mbar 1016.00 1016.00 1015.28 1015.80 1007.94 1007.96 1007.97 1007.96

Contract Report CR 942-02 (Addendum 3)
THIS PAGE INTENTIONALLY LEFT BLANK
21 / 38 Contract Report CR 942-02 (Addendum 3)
Discussion
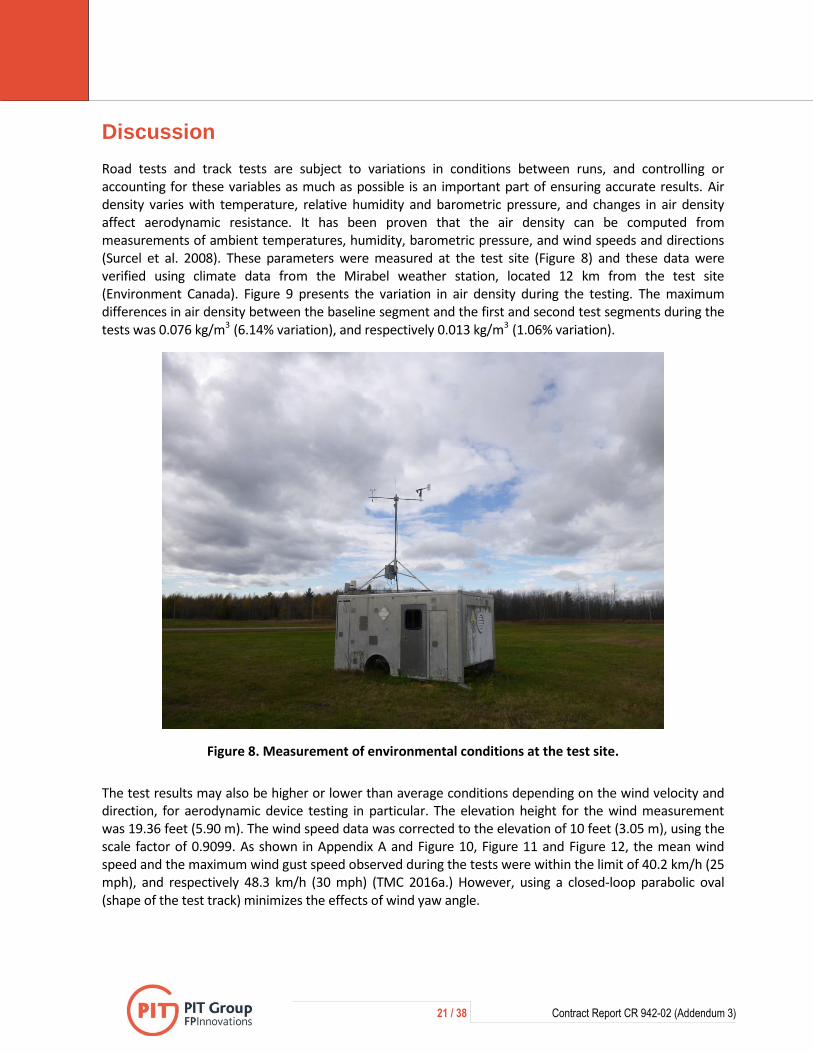
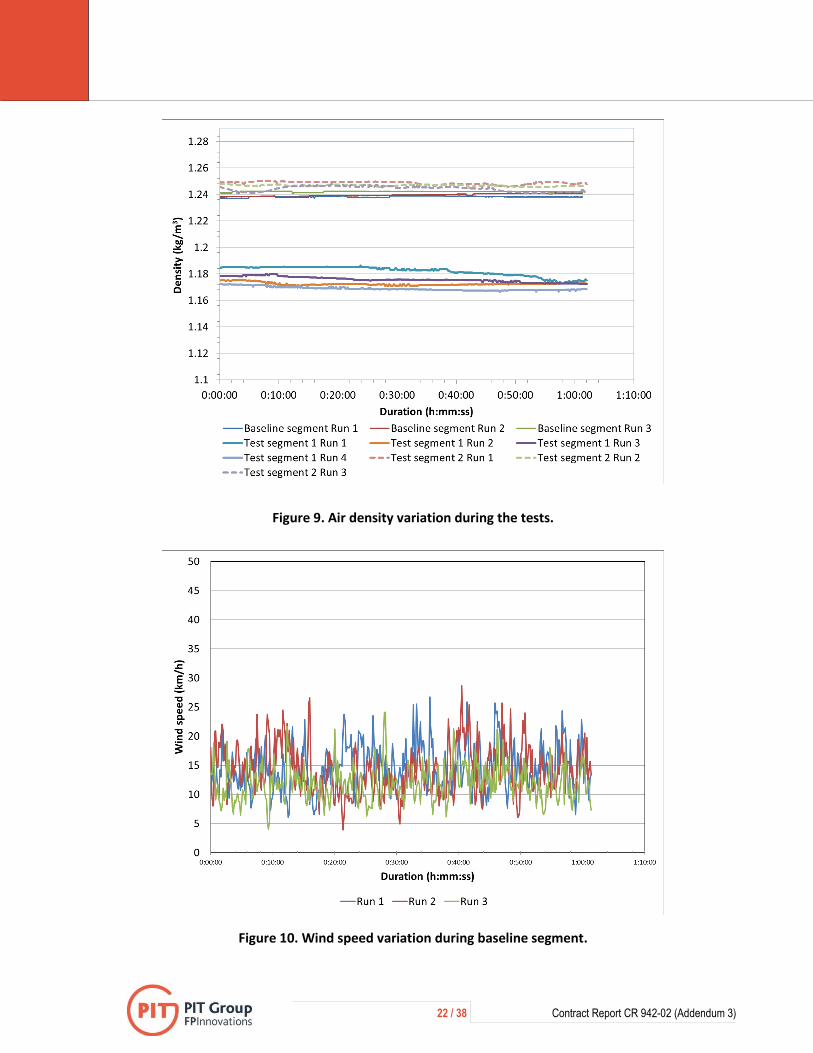
Road tests and track tests are subject to variations in conditions between runs, and controlling or accounting for these variables as much as possible is an important part of ensuring accurate results. Air density varies with temperature, relative humidity and barometric pressure, and changes in air density affect aerodynamic resistance. It has been proven that the air density can be computed from measurements of ambient temperatures, humidity, barometric pressure, and wind speeds and directions (Surcel et al. 2008). These parameters were measured at the test site (Figure 8) and these data were verified using climate data from the Mirabel weather station, located 12 km from the test site (Environment Canada). Figure 9 presents the variation in air density during the testing. The maximum differences in air density between the baseline segment and the first and second test segments during the tests was 0.076 kg/m3 (6.14% variation), and respectively 0.013 kg/m3 (1.06% variation).
Figure 8. Measurement of environmental conditions at the test site.
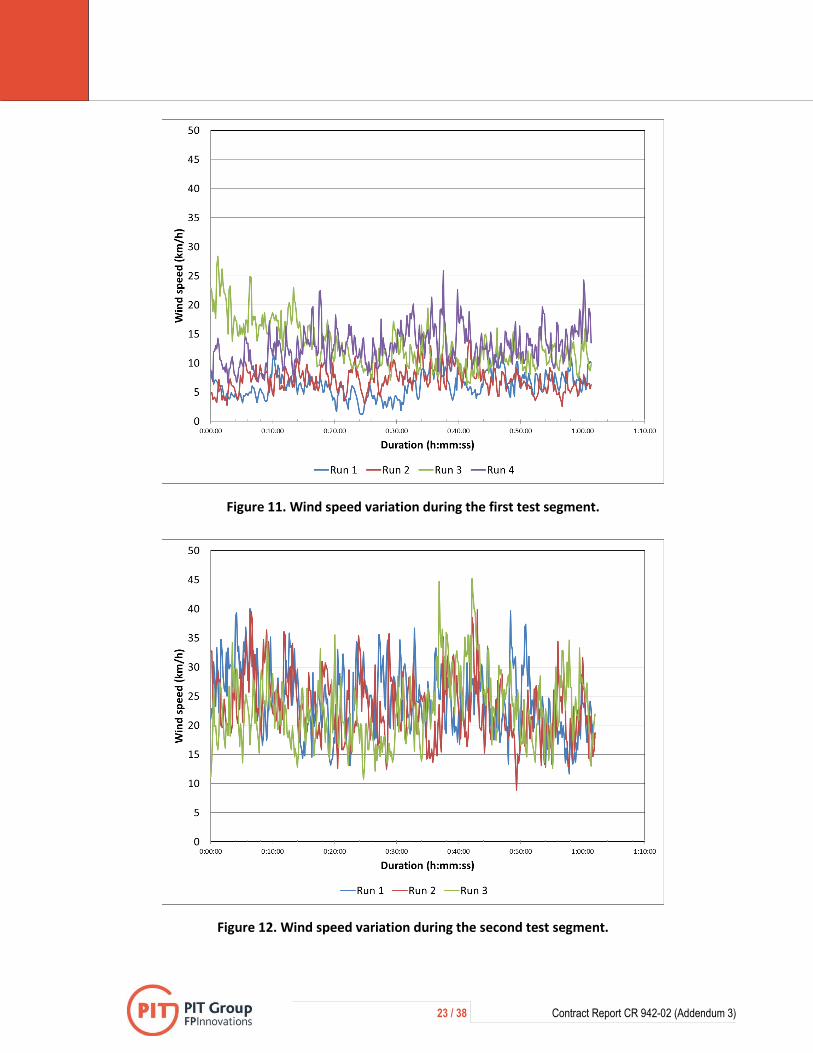
The test results may also be higher or lower than average conditions depending on the wind velocity and direction, for aerodynamic device testing in particular. The elevation height for the wind measurement was 19.36 feet (5.90 m). The wind speed data was corrected to the elevation of 10 feet (3.05 m), using the scale factor of 0.9099. As shown in Appendix A and Figure 10, Figure 11 and Figure 12, the mean wind speed and the maximum wind gust speed observed during the tests were within the limit of 40.2 km/h (25 mph), and respectively 48.3 km/h (30 mph) (TMC 2016a.) However, using a closed-loop parabolic oval (shape of the test track) minimizes the effects of wind yaw angle.
22 / 38 Contract Report CR 942-02 (Addendum 3)
Figure 9. Air density variation during the tests.
Figure 10. Wind speed variation during baseline segment.
23 / 38 Contract Report CR 942-02 (Addendum 3)
Figure 11. Wind speed variation during the first test segment.
Figure 12. Wind speed variation during the second test segment.
24 / 38 Contract Report CR 942-02 (Addendum 3)
The only possibility for minimizing the influence of varying ambient conditions on test results is to use unchanged control and test vehicles (with the exception of the modification being tested on the test vehicle), with the assumption that both vehicles will be equally affected by these variations. For this purpose, the test and control vehicles were of the same general configuration and confirmed to be in proper operating condition prior to and during the tests. The trailers were matched to each test and the control vehicles remained matched with their respective tractors throughout the entire series of tests. The vehicles in a pair had similar odometer readings (i.e. at the beginning of test segment 153 973 km for the test tractor and 151 349 km for the control tractor).
The temperature of the fuel in the tank was randomly checked during the tests and never exceeded 48°C (118 °F); the maximum temperature value suggested by the practice is 71 °C (160 °F) (TMC 2016a). Fuel temperature was controlled given that the portable tanks used for fuel consumption measurements have a large capacity (144 liters, 38 US gallons), the test run duration was short (1 hour) and the return of the fuel into the tank is made by splashing.
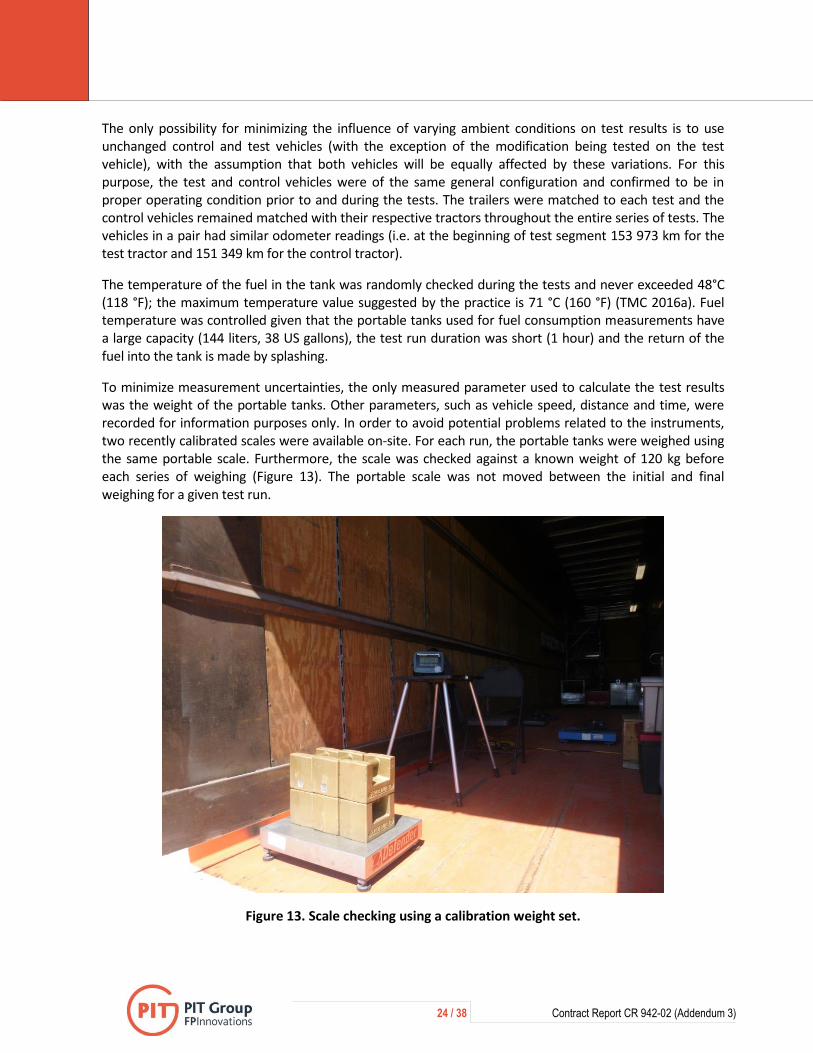
To minimize measurement uncertainties, the only measured parameter used to calculate the test results was the weight of the portable tanks. Other parameters, such as vehicle speed, distance and time, were recorded for information purposes only. In order to avoid potential problems related to the instruments, two recently calibrated scales were available on-site. For each run, the portable tanks were weighed using the same portable scale. Furthermore, the scale was checked against a known weight of 120 kg before each series of weighing (Figure 13). The portable scale was not moved between the initial and final weighing for a given test run.
Figure 13. Scale checking using a calibration weight set.
25 / 38 Contract Report CR 942-02 (Addendum 3)
In order to eliminate the influences of traffic and variations in driver response, testing took place on a closed-loop test track at a fixed speed of 105 km/h (65 mph), with a standard acceleration and braking protocol for all drivers. In addition, travel speeds were monitored throughout the tests using radars, and drivers were instructed by radio if it became necessary to adjust their travel speed. Moreover, the vehicles were instrumented with GPS, and GPS data was used to confirm vehicle speed. The drivers’ influence on the results was thus eliminated by strictly controlling the driving cycle.
Vehicle spacing was 0.8 km (0.5 mi.), which is within the limits stipulated by the practice (0.4 1.2 km, ¼ 3/4 mi.)) (TMC 2016a).
Distance measurement was not a factor because for each run, all vehicles departed and arrived at the same point after travelling the same number of laps and following the same path along the track.

Contract Report CR 942-02 (Addendum 3)
THIS PAGE INTENTIONALLY LEFT BLANK
27 / 38 Contract Report CR 942-02 (Addendum 3)
Summary
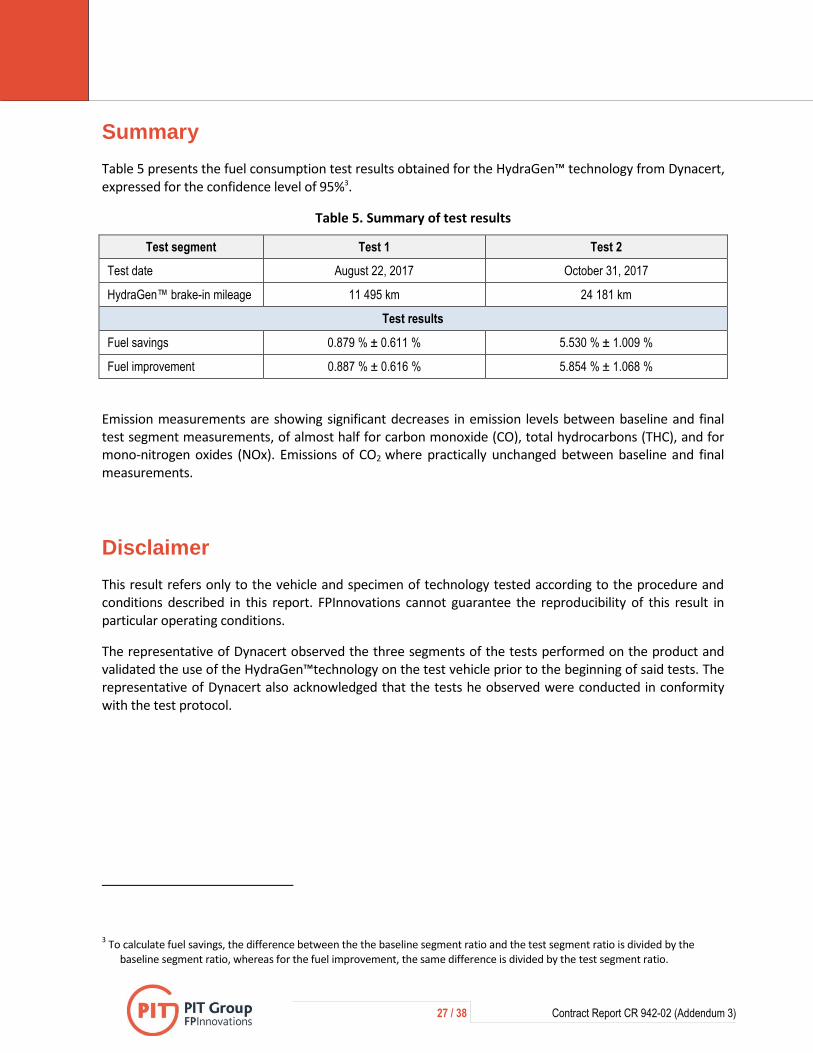
Table 5 presents the fuel consumption test results obtained for the HydraGen™ technology from Dynacert, expressed for the confidence level of 95%3.
Table 5. Summary of test results
Test segment Test 1 Test 2
Test date August 22, 2017 October 31, 2017
HydraGen™ brake-in mileage 11 495 km 24 181 km
Test results
Fuel savings 0.879 % ± 0.611 % 5.530 % ± 1.009 %
Fuel improvement 0.887 % ± 0.616 % 5.854 % ± 1.068 %
Emission measurements are showing significant decreases in emission levels between baseline and final test segment measurements, of almost half for carbon monoxide (CO), total hydrocarbons (THC), and for mono-nitrogen oxides (NOx). Emissions of CO2 where practically unchanged between baseline and final measurements.
Disclaimer
This result refers only to the vehicle and specimen of technology tested according to the procedure and conditions described in this report. FPInnovations cannot guarantee the reproducibility of this result in particular operating conditions.
The representative of Dynacert observed the three segments of the tests performed on the product and validated the use of the HydraGen™technology on the test vehicle prior to the beginning of said tests. The representative of Dynacert also acknowledged that the tests he observed were conducted in conformity with the test protocol.
3 To calculate fuel savings, the difference between the the baseline segment ratio and the test segment ratio is divided by the
baseline segment ratio, whereas for the fuel improvement, the same difference is divided by the test segment ratio.

28 / 38 Contract Report CR 942-02 (Addendum 3)
References
CFR (Code of Federal Regulation) (2008). Title 40 Part 1065 Engine Testing Procedures. Part 1065 – Subpart J PEMS testing, §1065.901.
Environment Canada (2017). Climate data online. Retrieved from: http://climate.weather.gc.ca/
Horiba (2011). On Board Emission Measurement System OBS-2200 Instruction Manual. Horiba Ltd., Kyoto, Japan.
Surcel, M.-D. (2017). Fuel Consumption and Emissions Tests of the HydraGen™ Technology from Dynacert. Contract Report 942-02. FPInnovations, Pointe-Claire, QC.
Surcel, M.-D., Michaelsen, J, Provencher, Y. (2008). Track-test evaluation of aerodynamic drag reducing measures for Class 8 Tractor-Trailers. Paper no. 2008-01-2600. SAE 2008 Commercial Vehicle Engineering Congress and Exhibition, October 7 –9, 2008, Rosemont – Chicago, IL.
Taylor Dynamometer Inc. (2013). RS-90K - 200K Towing Dynamometer Operation & Maintenance Manual. Taylor Dynamometer Inc., Milwaukee, WI.
Technology and Maintenance Council (TMC) (2016). TMC Fuel Consumption Test Procedure Type II, RP1102A. Technology and MaintenanceCouncil – American Trucking Association Inc. Arlington, VA.
29 / 38 Contract Report CR 942-02 (Addendum 3)
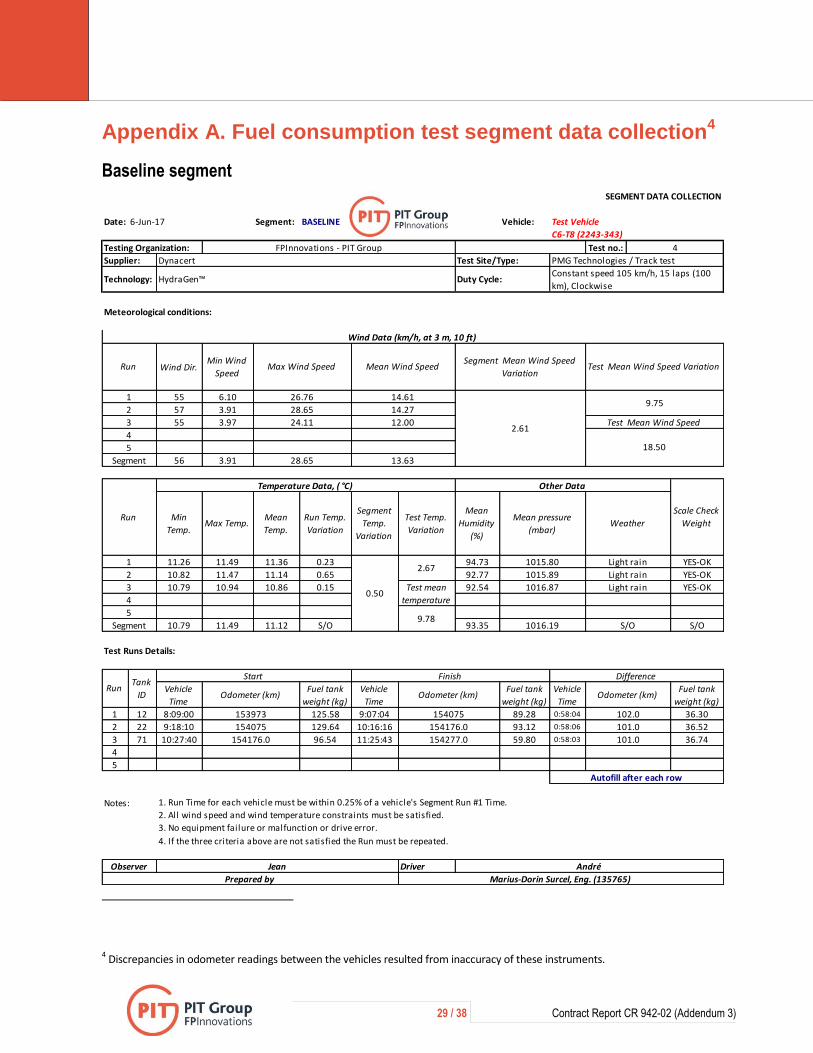
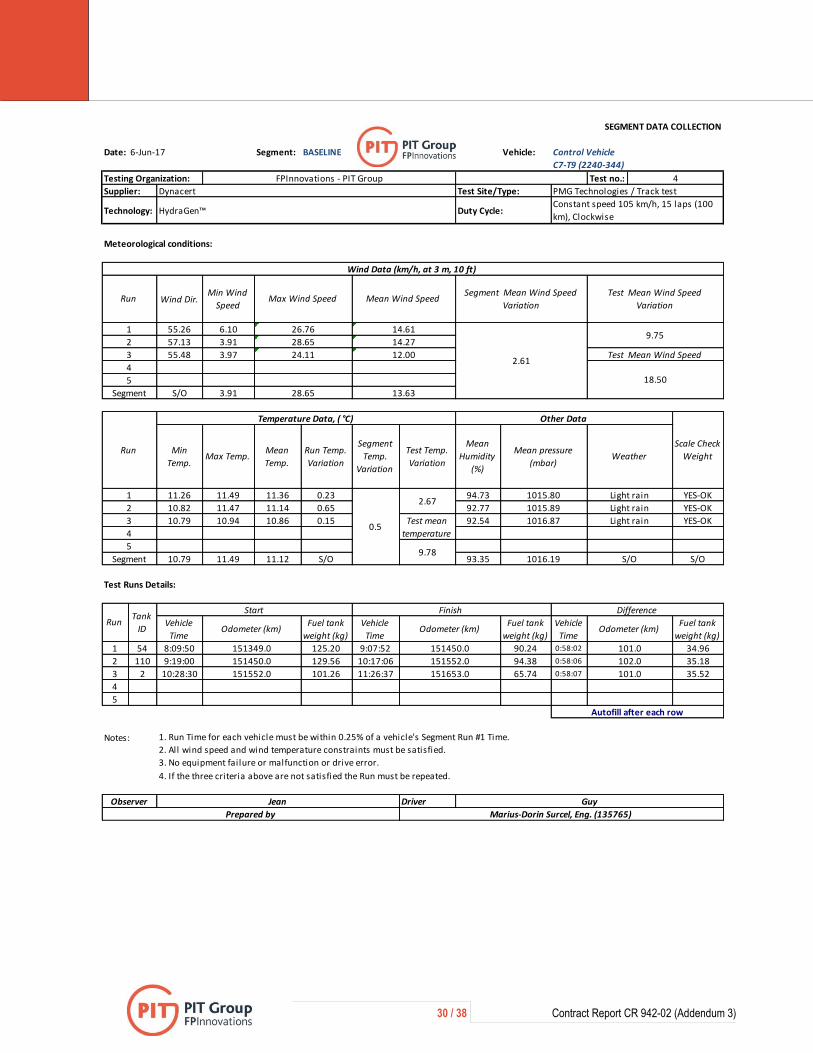
Appendix A. Fuel consumption test segment data collection4
Baseline segment
4 Discrepancies in odometer readings between the vehicles resulted from inaccuracy of these instruments.
Date: Segment: BASELINE Vehicle:
Test no.:
Supplier:
Meteorological conditions:
Wind Dir.Min Wind
Speed
55 6.10
57 3.91
55 3.97
56 3.91
11.26 11.49 11.36 0.23 94.73 YES-OK
10.82 11.47 11.14 0.65 92.77 YES-OK
10.79 10.94 10.86 0.15 92.54 YES-OK
10.79 11.49 11.12 S/O 93.35 S/O
1 12 8:09:00 125.58 9:07:04 89.28 0:58:04 36.30
2 22 9:18:10 129.64 10:16:16 93.12 0:58:06 36.52
3 71 10:27:40 96.54 11:25:43 59.80 0:58:03 36.74
4
5
Notes:
Driver
2. All wind speed and wind temperature constraints must be satisfied.
3. No equipment failure or malfunction or drive error.
4. If the three criteria above are not satisfied the Run must be repeated.
1016.19
Autofill after each row
Fuel tank
weight (kg)
Start
154075 154176.0
Mean
Temp.
Run Temp.
VariationMax Temp.
S/O
26.76
Light rain
Test Temp.
Variation
Segment
Temp.
Variation
Weather
2.67
Test mean
temperature
9.78
Light rain
Min
Temp.
Light rain
Difference
0.50
Odometer (km)
Test Runs Details:
Test Mean Wind Speed
PMG Technologies / Track test
Constant speed 105 km/h, 15 laps (100
km), Clockwise
Scale Check
Weight
Wind Data (km/h, at 3 m, 10 ft)
Segment
Temperature Data, ( °C)
Mean
Humidity
(%)
Mean pressure
(mbar)
Other Data
1
2
3
4
5
1015.80
1015.89
1016.87
5
HydraGen™
18.50
9.75
Duty Cycle:
13.63
Segment Mean Wind Speed
Variation Test Mean Wind Speed Variation
2.61
28.65
SEGMENT DATA COLLECTION
Test Vehicle
Test Site/Type:
14.61
14.27
12.00
C6-T8 (2243-343)
Testing Organization: FPInnovations - PIT Group 4
Dynacert
1
2
3
4
6-Jun-17
Technology:
Prepared by
Fuel tank
weight (kg)
RunTank
IDVehicle
Time
Vehicle
Time
1. Run Time for each vehicle must be within 0.25% of a vehicle's Segment Run #1 Time.
Max Wind Speed Mean Wind Speed
28.65
24.11
Run
Observer Jean André
Run
Vehicle
Time
Marius-Dorin Surcel, Eng. (135765)
Fuel tank
weight (kg)
Finish
Segment
102.0
101.0
101.0
Odometer (km)
153973
154176.0
154075
154277.0
Odometer (km)
30 / 38 Contract Report CR 942-02 (Addendum 3)
Date: Segment: BASELINE Vehicle:
Test no.:
Supplier:
Meteorological conditions:
Wind Dir.Min Wind
Speed
55.26 6.10
57.13 3.91
55.48 3.97
S/O 3.91
11.26 11.49 11.36 0.23 94.73 YES-OK
10.82 11.47 11.14 0.65 92.77 YES-OK
10.79 10.94 10.86 0.15 92.54 YES-OK
10.79 11.49 11.12 S/O 93.35 S/O
1 54 8:09:50 125.20 9:07:52 90.24 0:58:02 34.96
2 110 9:19:00 129.56 10:17:06 94.38 0:58:06 35.18
3 2 10:28:30 101.26 11:26:37 65.74 0:58:07 35.52
4
5
Notes:
Driver
4. If the three criteria above are not satisfied the Run must be repeated.
5
Segment
Test Mean Wind Speed
18.50
9.75
2.67
Test mean
temperature
9.78
Odometer (km)
Run
1
Vehicle
Time
Fuel tank
weight (kg)
1. Run Time for each vehicle must be within 0.25% of a vehicle's Segment Run #1 Time.
Fuel tank
weight (kg)
Vehicle
Time
1016.19 S/O
Test Runs Details:
Prepared by Marius-Dorin Surcel, Eng. (135765)
Wind Data (km/h, at 3 m, 10 ft)
Run
1
2
Segment
Autofill after each row
Observer Jean Guy
Vehicle
Time
4
5
2
Fuel tank
weight (kg)
3
4
2. All wind speed and wind temperature constraints must be satisfied.
3. No equipment failure or malfunction or drive error.
Run Temp.
Variation
Segment
Temp.
Variation
Test Temp.
Variation
0.5
RunTank
ID
3
Odometer (km)
151450.0
SEGMENT DATA COLLECTION
6-Jun-17 Control Vehicle
C7-T9 (2240-344)
Testing Organization: FPInnovations - PIT Group 4
Max Wind Speed Mean Wind Speed
Dynacert Test Site/Type: PMG Technologies / Track test
HydraGen™ Duty Cycle:Constant speed 105 km/h, 15 laps (100
km), Clockwise
Segment Mean Wind Speed
Variation
Test Mean Wind Speed
Variation
Mean
Humidity
(%)
Mean pressure
(mbar)Weather
26.76 14.61
28.65 14.27
24.11 12.002.61
28.65 13.63
Temperature Data, ( °C) Other Data
Scale Check
WeightMin
Temp. Max Temp.
Technology:
Mean
Temp.
101.0
102.0
101.0
Odometer (km)
151349.0
151552.0
1015.80 Light rain
Start Finish Difference
1015.89 Light rain
1016.87 Light rain
151653.0
151450.0 151552.0
31 / 38 Contract Report CR 942-02 (Addendum 3)
Test segment 1
Date: Segment: TEST Vehicle:
Test no.:
Supplier:
Meteorological conditions:
Wind Dir.Min Wind
Speed
114 1.21
137 2.58
221 6.31
199 6.55
S/O 1.21
20.55 22.82 21.12 2.27 96.71 YES-OK
22.27 22.93 22.61 0.66 92.16 YES-OK
20.83 22.31 21.69 1.48 90.61 YES-OK
22.34 23.15 22.84 0.81 89.02 YES-OK
20.55 23.15 22.07 S/O 92.13 S/O
1 7 12:28:00 129.72 13:26:05 94.56 0:58:05 35.16
2 57 13:51:00 74.26 14:49:03 40.54 0:58:03 33.72
3 46 15:26:30 93.98 16:24:34 58.99 0:58:04 34.99
4 5 16:35:00 127.84 17:33:02 93.46 0:58:02 34.38
5
Notes:
Driver
Cloudy
1002.18 Cloudy1.72
166179.0
102.0
102.0
Odometer (km)
165873.0 101.0
3.79
11.73
10.95
165975.0
166077.0
25.86 12.956.80
28.34 9.84
Temperature Data, ( °C) Other Data
Test Mean Wind Speed
11.94 6.21
13.92 7.18
28.34 13.01
Odometer (km)Odometer (km)
165772.0
SEGMENT DATA COLLECTION
22-Aug-17 Test Vehicle
C6-T8 (2243-343)
Testing Organization: FPInnovations - PIT Group 4
Max Wind Speed Mean Wind Speed
Dynacert Test Site/Type: PMG Technologies / Track test
HydraGen™ Duty Cycle:Constant speed 105 km/h, 15 laps (100
km), Clockwise
Segment Mean Wind Speed
Variation Test Mean Wind Speed Variation
Technology:
Mean
Humidity
(%)
Mean pressure
(mbar)Weather
Test mean
temperature
16.59
Run
1
Vehicle
Time
Fuel tank
weight (kg)
3
Segment
Temp.
Variation
Test Temp.
Variation
Scale Check
WeightMin
Temp. Max Temp.
Mean
Temp.
1007.40 Heavy rain
Start Finish Difference
1004.61 Light rain, cloudy
1003.73
1. Run Time for each vehicle must be within 0.25% of a vehicle's Segment Run #1 Time.
Fuel tank
weight (kg)
Vehicle
Time
1004.48 S/O
Test Runs Details:
RunTank
ID
166067.0 112.0
165873.0
165975.0
Prepared by Marius-Dorin Surcel, Eng. (135765)
Wind Data (km/h, at 3 m, 10 ft)
Run
1
2
Segment
Autofill after each row
Observer Jean André
Vehicle
Time
4
5
2
Fuel tank
weight (kg)
3
4
Run Temp.
Variation
2. All wind speed and wind temperature constraints must be satisfied.
3. No equipment failure or malfunction or drive error.
4. If the three criteria above are not satisfied the Run must be repeated.
5
Segment

32 / 38 Contract Report CR 942-02 (Addendum 3)
Date: Segment: TEST Vehicle:
Test no.:
Supplier:
Meteorological conditions:
Wind Dir.Min Wind
Speed
114 1.21
137 2.58
221 6.31
199 6.55
S/O 1.21
20.55 22.82 21.12 2.27 96.71 YES-OK
22.27 22.93 22.61 0.66 92.16 YES-OK
20.83 22.31 21.69 1.48 90.61 YES-OK
22.34 23.15 22.84 0.81 89.02 YES-OK
20.55 23.15 22.07 S/O 92.13 S/O
1 46 12:30:00 128.08 13:28:03 93.98 0:58:03 34.10
2 14 13:53:00 77.92 14:51:05 45.12 0:58:05 32.80
3 7 15:28:30 94.56 16:26:35 60.62 0:58:05 33.94
4 6 16:37:00 126.64 17:35:06 93.08 0:58:06 33.56
5
Notes:
Driver
Odometer (km)
158242.0
158344.0
158446.0
1007.40 Heavy rain
Start Finish Difference
1004.61 Light rain, cloudy
1003.73 Cloudy
1002.18 Cloudy1.72
158650.0
102.0
102.0
102.0
102.0
158344.0
158446.0
158548.0
SEGMENT DATA COLLECTION
22-Aug-17 Control Vehicle
C7-T9 (2240-344)
Testing Organization: FPInnovations - PIT Group 4
Max Wind Speed Mean Wind Speed
Dynacert Test Site/Type: PMG Technologies / Track test
HydraGen™ Duty Cycle:Constant speed 105 km/h, 15 laps (100
km), Clockwise
Segment Mean Wind Speed
Variation
Test Mean Wind Speed
Variation
Min
Temp.
Technology:
Max Temp.
3.7911.94 6.21
13.92 7.18
Odometer (km)
Test Mean Wind Speed
11.73
28.346.80
28.34 9.84
Run Temp.
Variation
Segment
Temp.
Variation
Weather
Temperature Data, ( °C) Other Data
Test mean
temperature
16.59
Odometer (km)
10.95
2. All wind speed and wind temperature constraints must be satisfied.
3. No equipment failure or malfunction or drive error.
13.01
25.86 12.95
Run
1
Vehicle
Time
Fuel tank
weight (kg)
1. Run Time for each vehicle must be within 0.25% of a vehicle's Segment Run #1 Time.
Fuel tank
weight (kg)
Vehicle
Time
1004.48 S/O
Test Runs Details:
RunTank
ID
3
158548.0
Test Temp.
Variation
Scale Check
Weight
4. If the three criteria above are not satisfied the Run must be repeated.
5
Segment
Mean
Temp.
Mean
Humidity
(%)
Mean pressure
(mbar)
Prepared by Marius-Dorin Surcel, Eng. (135765)
Wind Data (km/h, at 3 m, 10 ft)
Run
1
2
Segment
Autofill after each row
Observer Jean Guy
Vehicle
Time
4
5
2
Fuel tank
weight (kg)
3
4

33 / 38 Contract Report CR 942-02 (Addendum 3)
Test segment 2
Date: Segment: TEST Vehicle:
Test no.:
Supplier:
Meteorological conditions:
Wind Dir.Min Wind
Speed
239.72 11.70
249.20 8.88
245.92 10.76
244.95 8.88
7.39 8.36 7.77 0.97 61.08 YES-OK
8.23 8.74 8.48 0.51 57.40 YES-OK
8.52 9.88 9.09 1.36 55.15 YES-OK
7.39 9.88 8.45 S/O 57.88 S/O
1 57 10:45:00 129.02 11:43:01 93.70 0:58:01 35.32
2 7 12:07:00 95.74 13:05:03 60.40 0:58:03 35.34
3 57 13:15:00 93.70 14:13:04 58.82 0:58:04 34.88
4
5
Notes:
Driver
Prepared by Marius-Dorin Surcel, Eng. (135765)
Wind Data (km/h, at 3 m, 10 ft)
Run
1
2
Segment
Autofill after each row
Observer Steve André
Vehicle
Time
4
5
2
Fuel tank
weight (kg)
3
4
Run Temp.
Variation
2. All wind speed and wind temperature constraints must be satisfied.
3. No equipment failure or malfunction or drive error.
4. If the three criteria above are not satisfied the Run must be repeated.
5
Segment
1. Run Time for each vehicle must be within 0.25% of a vehicle's Segment Run #1 Time.
Fuel tank
weight (kg)
Vehicle
Time
1009.76 S/O
Test Runs Details:
RunTank
ID
178559.0
178661.0
Mean
Humidity
(%)
Mean pressure
(mbar)Weather
Test mean
temperature
9.78
Run
1
Vehicle
Time
Fuel tank
weight (kg)
3
Segment
Temp.
Variation
Test Temp.
Variation
Scale Check
WeightMin
Temp. Max Temp.
Mean
Temp.
1009.13 Mostly cloudy
Start Finish Difference
1009.98 Mostly cloudy
1010.17
SEGMENT DATA COLLECTION
31-Oct-17 Test Vehicle
C6-T8 (2243-343)
Testing Organization: FPInnovations - PIT Group 4
Max Wind Speed Mean Wind Speed
Dynacert Test Site/Type: PMG Technologies / Track test
HydraGen™ Duty Cycle:Constant speed 105 km/h, 15 laps (100
km), Clockwise
Segment Mean Wind Speed
Variation Test Mean Wind Speed Variation
Technology:
9.75
18.50
2.67
178661.0
178763.0
1.66
45.20 23.38
Temperature Data, ( °C) Other Data
Test Mean Wind Speed
40.00 24.38
39.83 23.03
45.20 22.72
Odometer (km)Odometer (km)
178458.0
Mostly cloudy1.32
102.0
102.0
Odometer (km)
178559.0 101.0

34 / 38 Contract Report CR 942-02 (Addendum 3)
Date: Segment: TEST Vehicle:
Test no.:
Supplier:
Meteorological conditions:
Wind Dir.Min Wind
Speed
239.72 11.70
249.2 8.88
245.92 10.76
S/O 8.88
7.39 8.36 7.77 0.97 61.08 YES-OK
8.23 8.74 8.48 0.51 57.40 YES-OK
8.52 9.88 9.09 1.36 55.15 YES-OK
7.39 9.88 8.45 S/O 57.88 S/O
1 5 10:47:00 123.02 11:45:04 87.04 0:58:04 35.98
2 6 12:09:00 90.52 13:07:05 54.62 0:58:05 35.90
3 5 13:17:00 87.04 14:15:02 51.18 0:58:02 35.86
4
5
Notes:
Driver
4. If the three criteria above are not satisfied the Run must be repeated.
5
Segment
Mean
Temp.
Mean
Humidity
(%)
Mean pressure
(mbar)
Prepared by Marius-Dorin Surcel, Eng. (135765)
Wind Data (km/h, at 3 m, 10 ft)
Run
1
2
Segment
Autofill after each row
Observer Steve Guy
Vehicle
Time
4
5
2
Fuel tank
weight (kg)
3
4
2. All wind speed and wind temperature constraints must be satisfied.
3. No equipment failure or malfunction or drive error.
22.72
Run
1
Vehicle
Time
Fuel tank
weight (kg)
1. Run Time for each vehicle must be within 0.25% of a vehicle's Segment Run #1 Time.
Fuel tank
weight (kg)
Vehicle
Time
1009.76 S/O
Test Runs Details:
RunTank
ID
3
Test Temp.
Variation
Scale Check
Weight
40.00 24.38
39.83 23.03
Odometer (km)
Test Mean Wind Speed
18.50
45.201.66
45.20 23.38
Run Temp.
Variation
Segment
Temp.
Variation
Weather
Temperature Data, ( °C) Other Data
Test mean
temperature
9.78
Odometer (km)
2.67
163522.0
163623.0
SEGMENT DATA COLLECTION
31-Oct-17 Control Vehicle
C7-T9 (2240-344)
Testing Organization: FPInnovations - PIT Group 4
Max Wind Speed Mean Wind Speed
Dynacert Test Site/Type: PMG Technologies / Track test
HydraGen™ Duty Cycle:Constant speed 105 km/h, 15 laps (100
km), Clockwise
Segment Mean Wind Speed
Variation
Test Mean Wind Speed
Variation
Min
Temp.
Technology:
Max Temp.
9.75
Odometer (km)
163319.0
163420.0
163522.0
1009.13 Mostly cloudy
Start Finish Difference
1009.98 Mostly cloudy
1010.17 Mostly cloudy1.32
101.0
102.0
101.0
163420.0

35 / 38 Contract Report CR 942-02 (Addendum 3)
Appendix B. Fuel consumption test data analysis
Test 1
Test no.: 4
Supplier: Test Site/Type:
Technology: Duty Cycle:
Date: 6-Jun-17 Date: 22-Aug-17
Test Control Test Control
C6-T8 (2243-
343)
C7-T9 (2240-
344)
C6-T8 (2243-
343)
C7-T9 (2240-
344)
1 36.30 34.96 1.0383 1 35.16 34.10 1.0311
2 36.52 35.18 1.0381 2 33.72 32.80 1.0280
3 36.74 35.52 1.0343 3 34.99 33.94 1.0309
4 4 34.38 33.56 1.0244
5 5
6 6
F-Test for Equal Variances
Baseline Final Baseline T/C Variance 0.00000
1.0369 1.0278 Test T/C Variance 0.00001
3 3 F test stat (test/baseline) 2.12835
0.0022 0.0033 F low 0.02564
0.000005 0.000011 F high 39.00000
0.0091 Are Variances Equal ? YES
0.00279 df (nu) 3.540
t-crit 2.776 t-crit 2.925
t-stat 3.997 t-stat 3.997
Is Fuel Economy Improved ? YES Is Fuel Economy Improved ? YESP-value 0.0161728 P-value 0.0205
lower CI bound 0.00278 lower CI bound 0.00244
upper CI bound 0.01545 upper CI bound 0.01579
2.776
Nominal Confidence Interval 0.00228
0.879% ± 0.611%
0.887% ± 0.616%
Consumed fuel (kg) Consumed fuel (kg)
Testing Organization: FPInnovations - PIT Group
RESULTS DATA ANALYSIS
Run Run T/CT/C
PMG Technologies / Track test
Constant speed 105 km/h, 15 laps (100 km), Clockwise
Baseline Segment Test Segment
Dynacert
HydraGen™
Prepared by Marius-Dorin Surcel, Eng. (135765)
CI t-critical
CI std err term
Difference in Means
T-Test with Equal Variances (2-tailed) T-Test with Unequal Variances (2-tailed)
Pooled St dev
Number of Data Points
Standard Deviations
Variances
Test Result
Fuel Savings
Fuel Improvement
Summary Stats
Mean T/C
36 / 38 Contract Report CR 942-02 (Addendum 3)
Test 2
Test no.: 4
Supplier: Test Site/Type:
Technology: Duty Cycle:
Date: 6-Jun-17 Date: 31-Oct-17
Test Control Test Control
C6-T8 (2243-
343)
C7-T9 (2240-
344)
C6-T8 (2243-
343)
C7-T9 (2240-
344)
1 36.30 34.96 1.0383 1 35.32 35.98 0.9817
2 36.52 35.18 1.0381 2 35.34 35.90 0.9844
3 36.74 35.52 1.0343 3 34.88 35.86 0.9727
4 4
5 5
6 6
F-Test for Equal Variances
Baseline Final Baseline T/C Variance 0.00000
1.0369 0.9796 Test T/C Variance 0.00004
3 3 F test stat (test/baseline) 7.54608
0.0022 0.0061 F low 0.02564
0.000005 0.000038 F high 39.00000
0.0573 Are Variances Equal ? YES
0.00462 df (nu) 2.521
t-crit 2.776 t-crit 3.554
t-stat 15.213 t-stat 15.213
Is Fuel Economy Improved ? YES Is Fuel Economy Improved ? YESP-value 0.0001089 P-value 0.0015
lower CI bound 0.04688 lower CI bound 0.04395
upper CI bound 0.06781 upper CI bound 0.07074
2.776
Nominal Confidence Interval 0.00377
5.530% ± 1.009%
5.854% ± 1.068%
Test Result
Fuel Savings
Fuel Improvement
Summary Stats
Mean T/C
Prepared by Marius-Dorin Surcel, Eng. (135765)
CI t-critical
CI std err term
Difference in Means
T-Test with Equal Variances (2-tailed) T-Test with Unequal Variances (2-tailed)
Pooled St dev
Number of Data Points
Standard Deviations
Variances
Testing Organization: FPInnovations - PIT Group
RESULTS DATA ANALYSIS
Run Run T/CT/C
PMG Technologies / Track test
Constant speed 105 km/h, 15 laps (100 km), Clockwise
Baseline Segment Final Segment
Dynacert
HydraGen™
Consumed fuel (kg) Consumed fuel (kg)

Contract Report CR 942-02 (Addendum 3)
THIS PAGE INTENTIONALLY LEFT BLANK
This report contains a total number of 38 pages including cover pages and empty pages Contract Report CR 942-02 (Addendum 3)
For more information:
Marius-Dorin Surcel, Eng., M.A.Sc.
Principal Scientist
570, boul. Saint-Jean, Pointe-Claire (QC) H9R 3J9
514 782-4519
[email protected] www.pit.fpinnovations.ca www.fpinnovations.ca