contribution of land use changes to future flood damage ...3.1 case study 3.1.1 hydrology and...
TRANSCRIPT

Nat. Hazards Earth Syst. Sci., 13, 2301–2318, 2013www.nat-hazards-earth-syst-sci.net/13/2301/2013/doi:10.5194/nhess-13-2301-2013© Author(s) 2013. CC Attribution 3.0 License.
Natural Hazards and Earth System
SciencesO
pen Access
Contribution of land use changes to future flood damage along theriver Meuse in the Walloon region
A. Beckers1,2,*, B. Dewals1, S. Erpicum1, S. Dujardin3, S. Detrembleur1, J. Teller3, M. Pirotton 1, and P. Archambeau1
1Hydraulics in Environmental and Civil Engineering (HECE), University of Liège (ULg), Liège, Belgium2Fund for Research Training in Industry and Agriculture (FRIA), Brussels, Belgium3Research Centre on Territorial, Urban and Rural Sciences (Lepur), University of Liège (ULg), Liège, Belgium* now at: Department of Geography, Geomorphology, University of Liège (ULg), Liège, Belgium
Correspondence to:A. Beckers ([email protected])
Received: 30 October 2012 – Published in Nat. Hazards Earth Syst. Sci. Discuss.: –Revised: 31 May 2013 – Accepted: 17 July 2013 – Published: 23 September 2013
Abstract. Managing flood risk in Europe is a critical issuebecause climate change is expected to increase flood hazardin many european countries. Beside climate change, land useevolution is also a key factor influencing future flood risk.The core contribution of this paper is a new methodology tomodel residential land use evolution. Based on two climatescenarios (“dry” and “wet”), the method is applied to studythe evolution of flood damage by 2100 along the riverMeuse. Nine urbanization scenarios were developed: threeof them assume a “current trend” land use evolution, leadingto a significant urban sprawl, while six others assume adense urban development, characterized by a higher densityand a higher diversity of urban functions in the urbanizedareas. Using damage curves, the damage estimation wasperformed by combining inundation maps for the presentand future 100 yr flood with present and future land usemaps and specific prices. According to the dry scenario,the flood discharge is expected not to increase. In this case,land use changes increase flood damages by 1–40 %, toC 334–462 million in 2100. In the wet scenario, the relativeincrease in flood damage is 540–630 %, corresponding tototal damages ofC 2.1–2.4 billion. In this extreme scenario,the influence of climate on the overall damage is 3–8 timeshigher than the effect of land use change. However, for sevenmunicipalities along the river Meuse, these two factors havea comparable influence. Consequently, in the “wet” scenarioand at the level of the whole Meuse valley in the Walloonregion, careful spatial planning would reduce the increasein flood damage by no more than 11–23 %; but, at the levelof several municipalities, more sustainable spatial planningwould reduce future flood damage to a much greater degree.
1 Introduction
Climate change is expected to increase flood hazard acrossmost of Europe, both in terms of peak discharge intensityand frequency (Dankers and Feyen, 2008; Kundzewicz,2005). For instance,Milly et al. (2002) show an increasein extreme flood frequency as a result of a quadrupling ofCO2 concentrations. Consequently, managing flood risk willremain an issue of primary importance for decades to come(Ernst et al., 2010).
Flood risk can be defined as the combination of theprobability of a flood event and its negative consequences(UNISDR, 2009). The latter are a function of the floodintensity, the exposure and the vulnerability. The exposureis defined here as the people, properties, systems, orother elements which are present in the flood-prone areas(UNISDR, 2009). As a consequence, exposure dependsdirectly on land use, and, in this respect, not only climatechange but also land use evolution is a key influencing factorfor the assessment of future flood damage.
For some European rivers, these two factors wereconsidered in flood damage assessments conducted for arelatively short term future (2030 inDe Roo et al., 2003;te Linde et al., 2011andPoussin et al., 2012; 2020 inElmeret al., 2012). In contrast, very few studies have taken theminto consideration for a longer term future (e.g.de Moelet al., 2011). The main purpose of this paper is to present anew methodological approach to model land use evolutionfor a long-term future and to evaluate the correspondingchange in potential flood damage.
This new methodology was applied to a specific casestudy, for which the potential damage related to the 100 yr
Published by Copernicus Publications on behalf of the European Geosciences Union.

2302 A. Beckers et al.: Future land use changes and flood damage, River Meuse
flood was assessed for the present situation and for 2100,using nine land use evolution scenarios and two climatechange scenarios. The study area is the river Meuse in theWalloon region (Belgium). The 100 yr flood was selectedsince it is the most frequently used return period to mapflood risk in Europe (de Moel et al., 2009). Although the timehorizon of 2100 is relatively distant, it was chosen here as it isusually used as a reference in studies on hydrological impactsof climate change (Leander et al., 2008; van pelt et al., 2009),including for the case study considered here (Drogue et al.,2010).
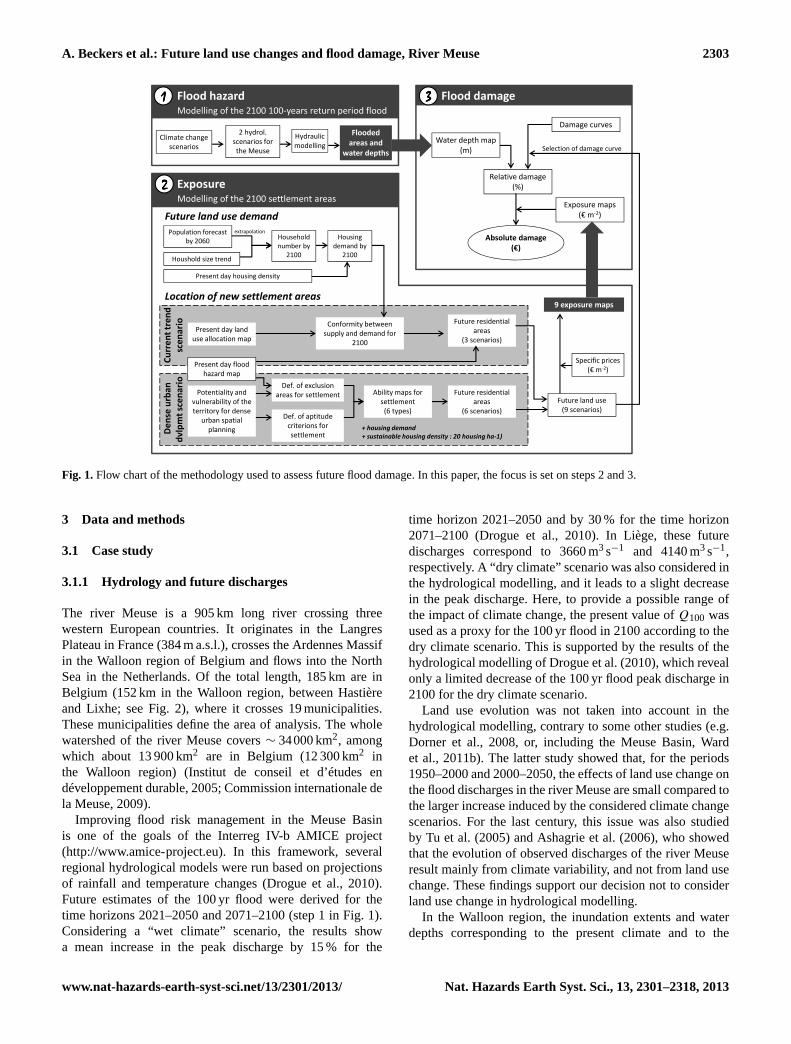
The assessment of future flood damage involves threesteps (Fig. 1): (1) future flood hazard assessment, (2)future exposure assessment, and (3) future flood damageassessment. Since climatic, hydrological, and hydraulicmodelling (step 1) were described in previous studies(Drogue et al., 2010; Detrembleur et al., 2011), thispaper focuses on the exposure and damage assessments,considering two different residential urbanization modelsand several scenarios. Here, rainfall–runoff modelling wasnot coupled with land use evolution, which is obviously anessential work to be performed in the future.
Section 2 of the paper provides some background onland use modelling. Section 3 details the data and methods,including the main hydrological characteristics of the riverMeuse and the spatial planning policy in the Walloon region(Sect. 3.1, step 1 in Fig.1), as well as the methodologyfor land use evolution modelling (Sect. 3.2, step 2) and fordamage assessment (Sect. 3.3, step 3). Section 4 presents theresults of land use evolution and flood damage, which thenare discussed in Sect. 5. Conclusions are drawn in Sect. 6.
2 Land use modelling
Numerous studies using land use evolution models havebeen carried out in western Europe (Verburg et al., 2002,2004, 2007; Barredo et al., 2003; Antrop, 2004; Antoni,2006; Overmars et al., 2007; Hoymann, 2010, 2011). Landuse evolution models simulate complex interactions betweenbio-physical and socio-economic factors.Verburg et al.(2004) reviewed different categories of models and identifiedsix main features to classify the existing models: the level ofanalysis, the cross-scale dynamics, the level of integration,the considered driving forces, and the spatial interactions andneighbourhood effects, as well as the temporal dynamics.
Verburg et al.(2004) distinguish first between micro- andmacro-levels. The former is mainly used in social sciencesand consists in studying the behaviour of individuals,either qualitatively or quantitatively. In contrast, geographersand ecologists usually analyse land use and societiescharacteristics at a macro-scale.
The second main feature of land use evolution modelling isthe cross-scale dynamics. Geographic processes often resultfrom interactions between processes taking place at different
scales (Gregory et al., 2011). In the present case, theseprocesses include residential choices of citizens (local level),spatial planning (regional or national level), and the evolutionof the price of oil (global level).
The consideration of these cross-scale dynamics in themodelling approach is a third main feature, called the levelof integration. Land use systems are characterized by stronginteractions between their constitutive parts (subsystems).A high level of integration consists in reflecting in themodel these interactions between levels or subsystems(Verburg, 2006). In contrast, each subsystem can be modelledseparately provided that feedbacks between the differentcomponents remain insignificant.
Another main feature pointed out byVerburg et al.(2004) is the reproduction in the model of the drivingforces responsible for land use changes (Bürgi et al., 2004).They are generally classified in four groups: socio-economicdrivers (population growth, standard of living, culture), bio-physical drivers (altitude, slope, soil type), land use policies(such as land use management plan), and neighbourhoodeffects.
This last group of driving forces is particularly importantbecause land use patterns often exhibit positive spatialautocorrelations. For example, urban expansion is oftensituated close to existing urban areas. Conversely, a nuclearpower plant tends to hinder the development of residentialareas around it. These attraction or repulsion effects withinthe same land use category (e.g. residential areas) or betweendifferent land use categories need to be accounted for.
The last feature is temporal dynamics. Future land useevolution is not necessarily the continuation of past trends.Therefore, rather than applying simple extrapolations ofpast trends, a scenario-based approach should be developed,in which each scenario corresponds to a combination ofconsistent assumptions concerning the future evolution ofsocieties, climate, price of oil, etc.
In practical terms, land use evolution modelling at themacro-level usually consists of two main steps: non-spatialand spatial analyses (Verburg et al., 2002). The goal of theformer is to quantify the future demand for each land usecategory (e.g. forest, cropland, residential area). This maybe carried out either using complex macro-economic andclimatic models (Verburg et al., 2007), or by extrapolationof recent trends (Antoni, 2006). In the framework of a rasteranalysis, the non-spatial analysis determines the number ofcells in which land use will change at each time step. Next,the location of the changing cells is defined by the spatialanalysis. It consists in identifying the driving forces for thelocation of land use changes (e.g. distance to the nearestcity, mean slope of the cell, land use of the neighbouringcells, land use policy) as well as in deriving transitionrules. Finally, the combination of land use demand (non-spatial analysis) and transition rules (spatial analysis) enablesdetermining in which cells land use will change at each timestep.
Nat. Hazards Earth Syst. Sci., 13, 2301–2318, 2013 www.nat-hazards-earth-syst-sci.net/13/2301/2013/
A. Beckers et al.: Future land use changes and flood damage, River Meuse 2303
Exposure
Modelling of the 2100 settlement areas
Flood hazard
Modelling of the 2100 100-years return period flood
Flood damage
Climate change
scenarios
2 hydrol.
scenarios for
the Meuse
Flooded
areas and
water depths
Damage curves
Water depth map
(m)
Relative damage
(%)
1111
2222
3333
Exposure maps
Hydraulic
modelling Selection of damage curve
Future land use demand
Location of new settlement areas
Population forecast
by 2060Housing
demand by
2100
Present day land
Present day housing density
Conformity between
supply and demand for
Cu
rre
nt
tre
nd
sce
na
rio
Houshold size trend
9 exposure maps
Absolute damage
(€)
extrapolationHousehold
number by
2100
Future residential
areas
Exposure maps
(€ m-2)
Present day land
use allocation map
Potentiality and
vulnerability of the
territory for dense
urban spatial
planning
Def. of aptitude
criterions for
settlement
Def. of exclusion
areas for settlement Ability maps for
settlement
(6 types)
supply and demand for
2100
Present day flood
hazard map
+ housing demand
+ sustainable housing density : 20 housing ha-1)
Cu
rre
nt
tre
nd
sce
na
rio
De
nse
urb
an
dv
lpm
tsc
en
ari
o
Future land use
(9 scenarios)
Specific prices
(€ m-2)
Future residential
areas
(6 scenarios)
areas
(3 scenarios)
Fig. 1.Flow chart of the methodology used to assess future flood damage. In this paper, the focus is set on steps 2 and 3.
3 Data and methods
3.1 Case study
3.1.1 Hydrology and future discharges
The river Meuse is a 905 km long river crossing threewestern European countries. It originates in the LangresPlateau in France (384 m a.s.l.), crosses the Ardennes Massifin the Walloon region of Belgium and flows into the NorthSea in the Netherlands. Of the total length, 185 km are inBelgium (152 km in the Walloon region, between Hastièreand Lixhe; see Fig.2), where it crosses 19 municipalities.These municipalities define the area of analysis. The wholewatershed of the river Meuse covers∼ 34000 km2, amongwhich about 13 900 km2 are in Belgium (12 300 km2 inthe Walloon region) (Institut de conseil et d’études endéveloppement durable, 2005; Commission internationale dela Meuse, 2009).
Improving flood risk management in the Meuse Basinis one of the goals of the Interreg IV-b AMICE project(http://www.amice-project.eu). In this framework, severalregional hydrological models were run based on projectionsof rainfall and temperature changes (Drogue et al., 2010).Future estimates of the 100 yr flood were derived for thetime horizons 2021–2050 and 2071–2100 (step 1 in Fig.1).Considering a “wet climate” scenario, the results showa mean increase in the peak discharge by 15 % for the
time horizon 2021–2050 and by 30 % for the time horizon2071–2100 (Drogue et al., 2010). In Liège, these futuredischarges correspond to 3660 m3s−1 and 4140 m3s−1,respectively. A “dry climate” scenario was also considered inthe hydrological modelling, and it leads to a slight decreasein the peak discharge. Here, to provide a possible range ofthe impact of climate change, the present value ofQ100 wasused as a proxy for the 100 yr flood in 2100 according to thedry climate scenario. This is supported by the results of thehydrological modelling ofDrogue et al.(2010), which revealonly a limited decrease of the 100 yr flood peak discharge in2100 for the dry climate scenario.
Land use evolution was not taken into account in thehydrological modelling, contrary to some other studies (e.g.Dorner et al., 2008, or, including the Meuse Basin,Wardet al., 2011b). The latter study showed that, for the periods1950–2000 and 2000–2050, the effects of land use change onthe flood discharges in the river Meuse are small compared tothe larger increase induced by the considered climate changescenarios. For the last century, this issue was also studiedby Tu et al.(2005) andAshagrie et al.(2006), who showedthat the evolution of observed discharges of the river Meuseresult mainly from climate variability, and not from land usechange. These findings support our decision not to considerland use change in hydrological modelling.
In the Walloon region, the inundation extents and waterdepths corresponding to the present climate and to the
www.nat-hazards-earth-syst-sci.net/13/2301/2013/ Nat. Hazards Earth Syst. Sci., 13, 2301–2318, 2013

2304 A. Beckers et al.: Future land use changes and flood damage, River Meuse
Fig. 2. Study area. Situation of the 19 studied municipalities in theriver Meuse Basin and flooded area corresponding to two studieddischarges (Q100 andQ100+ 30 %).
AMICE wet scenario were computed with the hydraulicmodel WOLF 2D, which is two dimensional and based onthe complete shallow-water equations (Detrembleur et al.,2011; seeErpicum et al., 2010, for detailed methodology andvalidation). The inundation extents corresponding toQ100andQ100+ 30 % are shown in Fig.2.
3.1.2 Spatial planning
Spatial planning is the main driving force of land useevolution in the Walloon region. Indeed, land allocationis strictly controlled by several regulations, including theregional development plan (calledplan de secteur). For eachland plot, it defines the legally authorized land allocation.Dating back to the 1980s, the development plan tends tofoster urban sprawl (Fig.3), which leads to increasinglychallenging difficulties such as a dramatic increase in thelength of supply networks and in the use of individualcars (Newman and Kenworthy, 1996; Halleux, 2008). Thisprompts the Walloon policymakers to initiate the preparationof an update of thisplan de secteur(Delforge and Géron,2008; CPDT, 2010).
3.1.3 Flood risk management
Official flood hazard maps are available in the Walloonregion. They identify flood-prone areas based on three levels:low, medium, or high flood hazard. Depending on thetype of river, three complementary methods were combined
to prepare these maps (Groupe Transversal Inondations,2006). First, for all river sections where hydrological datawere available, high-resolution 2-D hydraulic modelling wasperformed for the 25-, 50- and 100 yr floods. The typicalgrid resolution was 2–5 m. Using the matrix shown in Fig.4,the water depth computed in each grid cell was combinedwith the corresponding flood frequency to obtain the levelof flood hazard. When hydrological data were missing(ungauged catchments), the extent of flood-prone areas wasestimated from field investigations (Peeters et al., 2006)and by analysing the extent of Holocene alluvial deposits(Dautrebande et al., 2006). The resulting flood hazard mapswere approved by the Walloon government in 2006 and arenow available online (http://cartopro3.wallonie.be/CIGALE/viewer.htm). They are routinely used by the authorities intheir assessments of applications for building permits.
3.2 Exposure assessment
Exposure is a function of the type and characteristics of landuse categories (e.g. specific value), and is therefore directlyinfluenced by land use change. We focus here on the futureevolution of residential areas because this land use categoryrepresents more than 50 % of the total recorded damage forpast flood events in the Meuse Basin (Giron et al., 2009).This high share of damage in the residential sector has alsobeen observed for other basins, such as in Germany (te Lindeet al., 2011). For 2100, nine future land use scenarios weredeveloped and compared to the present situation (2009 data).
Information on the present land use in the Walloon regionwas obtained by combining two regional databases: the PLIdatabase and the land registry (Région Wallonne, 2012; SPFFinances, 2012). The PLI database (plan de localisationinformatique) contains the location and geometry of landplots and buildings at the scale 1: 10000. For each landplot, the land registry provides the corresponding land usecategory, out of a total of 222 categories. These were sampleddown into 10 classes, for which specific prices can be derivedfor the damage assessment (see the classification TableA1 inthe Appendix A). As the PLI database and the land registryare used for fiscal purpose, they are regularly updated andprovide reliable data.
The evolution of urbanization was not modelled dynam-ically, based on numerous transition rules. In contrast, webuilt our analysis upon the definition of residential areas withthe ability to provide housing for the expected population in2100. This approach is in line with the Standing Conferencefor Territorial Development (CPDT) working on an update ofthe regional development plan (CPDT, 2010), and is justifiedby the overwhelming influence of spatial planning amongthe driving forces for future developments. Two families ofurbanization scenarios were developed: the “current trend”scenario and the “dense urban development” scenarios. Theyare defined in detail in the following two sections.
Nat. Hazards Earth Syst. Sci., 13, 2301–2318, 2013 www.nat-hazards-earth-syst-sci.net/13/2301/2013/

A. Beckers et al.: Future land use changes and flood damage, River Meuse 2305
Fig. 3. Example of urban sprawl fostered by theplan de secteurin Profondeville: 1 – buildings; 2 – settlement areas of the landuse allocation map (LUAM); 3 – agriculture (LUAM); 4 – forest(LUAM); 5 – roads.
For each family of scenarios, three levels of buildingrestrictions based on the flood hazard maps were tested. Thefirst one stops the construction of new residential buildingsin the “high” flood hazard areas, which is in line withthe present regulations in the Walloon region. The secondlevel bans new developments not only in the “high” butalso in the “medium” flood hazard areas. This enables theinfluence on flood damage of a tightening of existing spatialplanning laws to be appreciated. To test the efficiency ofthe present regulation in mitigating flood damage, the thirdlevel constitutes a baseline scenario in which no buildingrestrictions based on flood hazard maps are taken intoaccount.
3.2.1 Current trend scenario
In the first considered scenario, the present trend inurbanization is assumed to continue in the future. It consistsmainly in urban sprawl, resulting in new residential areaswith a relatively low density and large land plots. By 2100,this scenario implies the urbanization of all land plots legallyallocated as “residential” according to theplan de secteur.
To show that this scenario is reasonable, the pasturbanization rate of each municipality was linearlyextrapolated in order to assess the time needed to urbanizethe whole municipality area (where urbanization is allowedby the plan de secteur). For this assessment, the 1997–2007 mean urbanization rates were obtained from theCAPRU database (http://www.gembloux.ulg.ac.be/eg/capru/communes-wallonnes-en-chiffres) and the available surfacein each municipality was derived by combining the PLIdatabase and the development plan. In the CAPRU database,the urbanized area is the sum of the areas of all land plotscontaining a building, whatever its function (residential,
Fig. 4. Levels of hazard used for the official flood hazard maps ofthe Walloon region. They are defined based on a combination of thewater depth (horizontal axis) and the range of return period (verticalaxis). H represents high flood hazard; M, medium flood hazard; L,low flood hazard. Adapted fromGroupe Transversal Inondations(2006).
industrial, etc.). It was also assumed that no transfer occursbetween the 19 municipalities in the considered study area.This means that when a municipality is fully urbanized, itsurbanization rate is not allocated to another municipality,resulting in a possible overestimation of the time needed forfull urbanization of all municipalities.
Figure5 shows the past evolution of urbanization in the19 municipalities. The mean year of full urbanization is 2102(standard deviation= 48 yr). The most quickly urbanizedmunicipality is Profondeville (2052) and the slowest one isAmay (2241). According to these results, and consideringthe probable overestimation of the time required for completeurbanization, the assumption of a complete urbanization by2100 of the residential areas defined by theplan de secteuris considered as realistic for the 19 studied municipalities.
Besides corresponding to the current trend in terms ofurbanization rate, this scenario is also consistent with theexpected population growth until 2100. Indeed, using 2004land use data,Lepers and Morelle(2008) estimated thatthe available residential areas of theplan de secteurcanprovide housing for∼ 1.5 million inhabitants in the case of acurrent trend scenario. This value is similar to the forecastfor the 2100 population in the Walloon region. Indeed,extrapolating linearly the Belgian average projected rate ofpopulation growth between 2007 and 2060 or 2040 and 2060(Bureau fédéral du Plan, 2008) results in an increase of inbetween 1.43 and 1.61 million inhabitants between 2004 and2100, which matches with Lepers and Morelle’s assessment(Fig. 6).
3.2.2 Dense urban development scenarios
Future spatial planning in the Walloon region is likely tobe guided by a revised version of theplan de secteur,which has been fostering urban sprawl for three decades. To
www.nat-hazards-earth-syst-sci.net/13/2301/2013/ Nat. Hazards Earth Syst. Sci., 13, 2301–2318, 2013

2306 A. Beckers et al.: Future land use changes and flood damage, River Meuse
Fig. 5. Growth in urbanization of the 19 studied municipalitiesbetween 1997 and 2007. Urbanized area in 1997 for eachmunicipality is 100.
take into account this possible evolution, a second familyof scenarios was developed, involving drivers which tendto promote a higher density in the future residential areas.The overarching objective underlying these “dense urbandevelopment” (DUD) scenarios is a reduction in the use ofindividual cars. Therefore, three main spatial planning ruleswere assumed: (1) more compact settlements to stop urbansprawl, (2) a higher settlement density to accommodate morepeople in urban centres, and (3) the preferred location of newhousing in places where the diversity of urban functions isalready high (schools, shops, public transports, etc.) in orderto reduce the demand for transportation.
In line with an ongoing work of the Walloon authorities(Delforge and Géron, 2008; Charlier et al., 2011), newresidential areas called “settlement cores” were defined. Inthese settlement cores, the housing density in 2100 shouldnot be less than 20 householdsha−1 (objective of density),and no new housing may be built outside these settlementcores (objective of compactness). Moreover, the total areaof settlement cores should accommodate housing for theexpected population in 2100.
The spatial delimitation of settlement cores was performedin four main steps: (1) build potential maps combiningindicators reflecting the spatial planning rules; (2) identifyso-called exclusion areas, where new developments are eithernot possible or not allowed; (3) define the thresholds tobe applied to the potential maps to obtain the settlementcores corresponding to a given scenario; and (4) disregardtoo small settlement cores. The analysis was conductedfor the entire Walloon region, which corresponds to theadministrative level at which spatial planning policy ismanaged. A raster with a resolution of 100m× 100 m wasused. This is consistent with the resolution of the availablehousing density data. The obtained settlement cores mayinclude both already-built and non-built land plots.
Fig. 6.Population forecast for the Walloon region. Latest data comefrom http://statbel.fgov.be, and projections fromBureau fédéral duPlan(2008). Linear extrapolations until 2100 use the mean increaserate between 2007–2060 (upper dashed line) and 2040–2060(lower dashed line). Housing supply until 2100 corresponds to theassessment ofLepers and Morelle(2008).
The potential maps were built using three variables:(1) the present housing density, (2) the present land usediversity, and (3) an employment-related potential. Thevariable representing the present housing density (D) wasevaluated as the mean housing density in a 700 m radiuscircle around each raster cell. This variable was used to fosterfuture developments near existing residential areas with ahigher density. Land use diversity (F ) was defined as theweighted sum of land use categories located in a 500 m radiuscircle around each cell (Dujardin et al., 2010). The landuse categories are listed in Table1. The weights vary from1 to 5 depending on the distance within the 500 m radiuscircle. Locating new housing where land use diversity is highenables new residents to decrease their need for an individualcar.
The employment-related potentialPe is used to reflecta preference for locating new housing at a lower distancefrom the main employment centres, and thus to decreasethe demand for transportation. Ten employment centres wereconsidered: Brussels, the six main cities of the Walloonregion (Liège, Charleroi, Namur, Mons, Verviers, Tournai)according to the urban hierarchy (Van Hecke et al., 2009),and the three main border cities (Luxembourg, Lille, andAachen). As a result, the variablePe is defined as
Pe = log
(10∑i=1
ei/d0.25i
), (1)
whereei is the number of jobs in the employment centrei and di is the Euclidian distance between the cell andthe employment centrei. This equation is derived fromHuff’s (1963) model, which enables human behaviours to bedescribed by mimicking gravitational interactions. Due to the
Nat. Hazards Earth Syst. Sci., 13, 2301–2318, 2013 www.nat-hazards-earth-syst-sci.net/13/2301/2013/

A. Beckers et al.: Future land use changes and flood damage, River Meuse 2307
Table 1.Land use categories considered for the assessment of landuse diversity.
Land use categories
HousingIndustry and craft industryAdministrative servicesSocial and health servicesScholar equipmentSocial and cultural equipmentIndoor sport and recreational equipmentTradeOffices and services
high density of highway and railway networks in Belgium,the Euclidian distance is an acceptable approximation for thereal travelled distance.
Potential maps were derived by combining these threevariables using the logical operator OR. Two differentcombinations were tested. The first one combines thehousing densityD with the land use diversityF :
PLD = 1− (1− D) · (1− F). (2)
The scenario obtained from this potentialPLD is referredto as the “local development scenario”. For the second one,the employment-related potentialPe was also included in theformula:
PRD = 1− (1− D) · (1− F) · (1− Pe) . (3)
The resulting scenario is called the “regional developmentscenario”, and is in line with a regional policy providingincentives to commuters for living closer to their job. Bycombining these two potential maps with the three differentlevels for considering flood hazard in spatial planning(Sect.3.1.3), a family of six DUD scenarios was obtained.Altogether, nine different urbanization scenarios for 2100were built (Fig.7).
In a second step, exclusion areas were identified toreflect the impossibility of accommodating residentialdevelopments on different land plots, due to bio-physicalfactors (steep slope, landslide hazard, karst hazard), legalreasons (nature conservation areas and other protected areas),or because the area is already occupied by other functionssuch as schools, transportation network, industry, etc. Theseexclusion areas were defined based on the list providedin Table 2. These exclusion areas were deleted from thepotential maps corresponding to each of the six DUDscenarios.
The spatial delimitation of the settlement cores requiresthe definition, for each potential map, of a threshold abovewhich a cell is considered as belonging to a settlement core.This threshold was selected so as to enable the amount ofnew housing to match the expected growth in the number
Fig. 7. Summary of the nine urbanization scenarios characteristicsaccording to two criteria.
Table 2.Exclusion areas, defined based on the PLI and land registrydatabase, as well as on additional data for non-registered land usecategories (hydrography, road network, etc.).
Class Source
Natura 2000 areas Walloon auth.Rockslide hazard Walloon auth.Karst hazard Walloon auth.Lakes and wet areas COSW∗
Planned “green areas” and parksPlan de secteurSlope> 35◦ 20 m resolution DEMIndustry and craft industry COSW∗
Aerodromes COSW∗
Airports COSW∗
Quarry COSW∗
Cemetery COSW∗
Urban parks COSW∗
Rail way and linked areas COSW∗
Road and linked areas COSW∗
Port COSW∗
Worship facilities COSW∗
Scholar facilities COSW∗
Social and cultural facilities COSW∗
Technical facilities COSW∗
Indoor sport andrecreational facilities COSW∗
Administrative facilities COSW∗
Health facilities COSW∗
∗COSW is a land use map developed by the Walloon authorities (seehttp://cartographie.wallonie.be/NewPortailCarto/PDF/legende_COSW.pdfforland use classifications).
of households by 2100. The population growth for 2100 inthe Walloon region was estimated at 1.43–1.61 M people(Sect. 3.2.1). Since the mean number of inhabitants perhousehold in 2100 will presumably lie in-between 2.00 and2.29 (2008 value), the number of new households in theWalloon region between 2008 and 2100 could be reasonablyestimated at 700 000.
www.nat-hazards-earth-syst-sci.net/13/2301/2013/ Nat. Hazards Earth Syst. Sci., 13, 2301–2318, 2013

2308 A. Beckers et al.: Future land use changes and flood damage, River Meuse
For a given threshold, a raster of the settlement coresdistribution (SC) could be created by reclassifying thecorresponding potential map (1 – core settlement; 0 – other)and a raster of the future housing density (FHD) could beobtained using
FHD = SC· (20− HD) , (4)
where HD is the raster of the present housing density, aselaborated byDujardin et al.(2010), in which values above20 housingha−1 were reclassified to 20 housingha−1. Thebest threshold value was obtained, for each potential map,using the false position method and Eq. (4) to link thethresholds values to the total amount of new housing.
Previous studies on the definition of settlement cores inthe Walloon region considered that actual settlement coresshould have a minimum size. This threshold was usually setat 150 inhabitants (Van der Haegen et al., 1981; Van Heckeet al., 2009). Since one cell of a settlement core contains20 or more residential units, each of them accommodatinga household of 2.00–2.29 inhabitants, a threshold of 4 ha(4 cells) was selected as the most reasonable for our purpose.As a result, each settlement core made of less than four cellswas removed. The neighbourhood used is eight cells.
3.2.3 2100 land use databases
For each of the nine urbanization scenarios for 2100, thefuture residential areas (defined based on theplan de secteuror on the settlement cores) were integrated into the presentPLI and land registry database. Land plots were first dividedto fit with the boundaries of the 2100 residential areas. Next,the land use category of each non-built land plot situatedin a future residential area was modified by substituting“residential area” to the past land use category.
3.2.4 Specific prices
Finally, for each scenario, a specific price was assignedto each land plot depending on its land use category.Specific prices (given in year 2009 euros) were derived fromATKIS (the official topographic-cartographic informationsystem of Germany (Muller, 2000; Sinaba and Peter Huber,2011)) data, and adapted to correspond to the mean specificprice of residential areas in the Walloon region (Table3).Residential area is the only land use category for whichprice data are available in the studied area. To estimatethe adaptation factor, a specific price for the residentialareas in the 19 studied municipalities was first assessedby dividing the average price of a house (C 129 427,from real-estate transactions in 2009) by the mean sizeof residential land plots in the maximum flooded area(332 m2). The specific price obtained for settlement in thestudied area isC 389 m−2, i.e. 31 % more than the ATKISvalue. Consequently, ATKIS specific prices for the land usecategories potentially influenced by the real-estate market
Table 3.Specific prices used for the damage assessment.
ATKIS damage ATKIS values Walloon Meusecategory values
Immobile Mobile Immobile Mobile[ C m−2] [ C m−2] [ C m−2] [ C m−2]
Miscellaneous(wood, lake) 0.00 0.00 0.00 0.00
Residential area 295 119 389 119
Industry andbusiness area 260 90.0 343 90.0
Mixed used 496 99.5 496 99.5
Governmentalutilization 281 1.32 370 1.32
Leisure andrecreation area 10.5 0.00 10.5 0.00
Infrastructure 106 280 106 280
Grassland andcultivated area 2.61 0.00 2.61 0.00
Supply buildings 297 2.17 297 2.17
Forestry 0.99 0.00 0.99 0.00
(residential, industrial and business, governmental use areas)were multiplied by 1.31. Only specific prices for buildingswere adapted, whereas ATKIS values were used for mobileassets, as proposed bySinaba and Peter Huber(2011).
3.3 Flood damage assessment
The objective of this step (no. 3 in Fig.1) is to combineinundation depths with exposure to obtain flood damagefor each municipality. Stage–damage functions were used toassess the relative damage for each land plot (Fig.8). TheFlood Loss Estimation Model (FLEMO) was used for theresidential, industrial, and commercial land plots (Kreibichet al., 2010; Thieken et al., 2008). For forestry, agriculture,and infrastructure we used stage–damage functions fromthe Rhine Atlas (IKSR, 2001). The same curve was usedfor mobile and immobile assets, except for industrial andcommercial assets, for which separate damage curves areavailable (FLEMOcs,Kreibich et al., 2010). The spatialresolutions of the inundation depth data (5m× 5 m raster)and the land use data (land plots geometry) are consistent.
The computed relative damage was multiplied by thespecific price and by the area of the processed land plot inorder to obtain absolute damage. Finally, absolute damagesof each land plot were summed up to deduce the amount ofdamage in each municipality.
The damage assessment was carried out for theQ100and Q100+ 30 % discharges, combined with the presenturbanization and the nine future land use scenarios.
Nat. Hazards Earth Syst. Sci., 13, 2301–2318, 2013 www.nat-hazards-earth-syst-sci.net/13/2301/2013/

A. Beckers et al.: Future land use changes and flood damage, River Meuse 2309
Fig. 8. FLEMO and IKSR damage curves. Black: industrial andcommercial areas (dotted line represents mobile assets; continuousline, immobile assets); light grey: residential areas; dark grey:infrastructure; dark grey, dotted line: forestry and agriculture.
4 Results
4.1 Future urbanization
4.1.1 Dense urban development scenarios
Before describing the location of new residential areasaccording to the DUD scenarios, the following intermediateresults are successively presented: the employment-relatedpotential, and the potential maps for the two DUD scenarios,as well as an example of exclusion areas.
As shown in Fig.9, the employment-related potentialis highly influenced by the capital city Brussels, wherethe highest number of jobs in Belgium are concentrated.The regional city Charleroi is also characterized by a highpotential, partly due to its relative proximity to Brussels. Incontrast, the potential is much lower in the southeastern partof the Walloon region (the Ardennes Massif), particularlyalong the French and German borders. It slightly increasesnear the Grand Duchy of Luxembourg because of the highnumber of jobs in this country.
The potential maps for new residential areas are shown inFig. 10 for the two subsets of DUD scenarios: regional vs.local development (Sect.3.2.2). In the first case, the mapsreflects the influence of the employment-related potential,while in both cases the spatial distribution of high values ofthe potential is determined by existing household density andland use diversity.
As an example, the exclusion areas in the centre of Liègeare illustrated in Fig.11. 21.6 % of the Walloon territory(i.e. 3640 km2) fall in such exclusion areas, consideredas inappropriate for housing. Natura 2000 areas represent60.4 % of the whole exclusion area.
Fig. 9. Employment-related potential in the Walloon region,used to define the core settlements according to the denseurban development scenario (regional development). Values werestandardized and are consequently non-dimensional.
Fig. 10. Potential maps for new residential areas in the Walloonregion in the two subsets of dense urban development scenarios.
Six operational potential maps were obtained bycombining the two potential maps presented in Fig.10 withthe three different levels of restriction on development basedon the flood hazard maps. After subtracting exclusion areas,thresholds were applied to these maps to define six spatialdistributions of settlement cores, as shown in Fig.12 forthe scenarios “regional development, high flood hazard”(Fig. 12a) and “local development, high flood hazard”
www.nat-hazards-earth-syst-sci.net/13/2301/2013/ Nat. Hazards Earth Syst. Sci., 13, 2301–2318, 2013

2310 A. Beckers et al.: Future land use changes and flood damage, River Meuse
Fig. 11.Exclusion areas in the centre of Liège: vector representationof raw data (top) and raster representation used in the analysis(bottom).
(Fig. 12b). In these figures, flood hazard and exclusion areaswere not subtracted from the settlement cores, in orderto improve the map readability. Comparing the six DUDscenarios reveals that the different levels of consideration ofthe flood hazard maps do not significantly change the overallpattern of the settlement cores distribution. In the regionaldevelopment scenario (Fig.12a), three large settlementcores are defined: Charleroi, Liège, and the southern suburbof Brussels. These correspond to the main employmentareas. Settlement cores are scarce and small within theArdennes (southeast). In the case of the local developmentscenario (Fig.12b), settlement cores show a more scattereddistribution. No large settlement core exists in the suburbof Brussels, and the Ardennes settlement cores are morenumerous and larger than in the regional developmentscenario.
4.1.2 Comparison of scenarios
As an example, the spatial distributions of future residentialareas near the city Namur is shown in Fig.13for the differentscenarios (current trend, DUD regional development, andDUD local development). In the same way as the level ofrestriction on development in flood-prone areas does notsignificantly change the pattern of settlement cores at thescale of the whole Walloon region, its influence on the overallregional distribution of future residential areas remains alsoinsignificant: within each family of scenarios, changing thelevel of restriction on development in flood-prone areas doesnot change the total surface area of new residential areas bymore than 1 %. In Fig.14, the evolution of urbanization foreach family of scenarios is detailed for each of the 19 studiedmunicipalities.
Fig. 12. Delimitation of the settlement cores in the two subsetsof dense urban development scenarios: regional(a) and local(b)development scenarios. At this stage, neither the exclusion areasnor the high or moderate flood hazard areas were subtracted fromthe settlement cores in order to improve map readability.
In the current trend scenario (Fig.13a), future residentialareas are more widespread in comparison to the two otherscenarios (Fig.13b and c). Section 3.1.2 already highlightedthis effect of dispersion of the future residential areas whentheplan de secteuris used. In this scenario, future urbanizedareas have a larger extent in every municipality than theyhave in the DUD scenarios (Fig.14a). This differencereaches between –69 % and –74 % on average in the 19municipalities (Fig.14b). Differences between the two DUDscenarios are smaller. New residential areas are larger inthe local development scenario in 15 municipalities, similarbetween both scenarios in two municipalities and larger inthe regional development scenario for two others (Namurand Liège), which correspond to a high employment-relatedpotential.
4.2 Flood damage
4.2.1 Damage evolution between 2009 and 2100
Computed damages for all scenarios are shown in Table4.In the present situation (2009), the damage induced in theWalloon region by a 100 yr flood of the river Meuse isestimated atC 331 million. Most of the damages take placein municipalities upstream of Engis, since flood protections
Nat. Hazards Earth Syst. Sci., 13, 2301–2318, 2013 www.nat-hazards-earth-syst-sci.net/13/2301/2013/

A. Beckers et al.: Future land use changes and flood damage, River Meuse 2311
Fig. 13. New residential areas in Namur, year 2100.(A) Currenttrend scenario;(B) dense urban development, regional developmentscenario; and(C) dense urban development, local developmentscenario. A high level of restriction on development in flood-proneareas was considered here.
further downstream were designed for the 100 yr flood(Figs.2 and15). In the dry climate scenario, the damage in2100 reaches betweenC 334 and 462 million, depending onthe urbanization scenario. This corresponds to an increase of1–40 %.
In the wet climate scenario, the damage in 2100 reachesbetween C 2124 and 2408 million, which correspondsto an increase of 540–630 % (Fig.16). The increase indamage varies strongly between municipalities. In the south,the municipalities of Hastière, Dinant, Anhée, Yvoir, andPhillipeville undergo relatively moderate damage increases,partly because the inundation extent does not change a lotbetween the dischargesQ100 andQ100+ 30 % (Fig.2). Thisresults from the topography of the valley in this part of theriver Meuse. The river crosses there the Ardennes Massifcomposed of resistant Palaeozoic rocks. Consequently, thefloodplain is relatively narrow (250–350 m wide) with steeplateral slopes, and is completely flooded for theQ100discharge. However, water depth increases by 125 % onaverage in this area compared to theQ100 discharge,reaching 3 m in some places. This induces a doublingof the damage in these municipalities when consideringthe most pessimistic urbanization scenario. Downstreamof Profondeville the increase in damage is larger, varyingbetween a factor 1.9 for Andenne to more than 5000 for themunicipalities downstream of Wanze which are almost notflooded for aQ100 flood in the present situation. In terms ofabsolute damage, the largest increases in the wet scenario areobserved in Liège (+C 430–450 million), Seraing (+C 275
Fig. 14.Increase in residential areas between 2009 and 2100 withinthe 19 municipalities studied.(A) Detail by municipality, and(B) sum over the 19 municipalities.
Table 4. Expected damages for a 100 yr flood of the river Meusein the Walloon region in 2009 (reference) and in 2100 (valuesin million euros). Building restrictions for 2100 are based on theavailable flood hazard map: high means no building in the high andmedium flood hazard areas; medium, no building in the high floodhazard areas; low, no restriction.
Urbanization scenarios for 2100
Discharges 2009 Level of DUD DUD Currentbuilding Regional Local trendrestriction
Q100 331 high 334 334 351medium 342 345 378low 364 377 462
Q100+ 30 % 1935 high 2124 2138 2246medium 2149 2169 2304low 2186 2213 2408
million) and Namur (+C 220–240 million). These threemunicipalities are characterized by large urbanized areasalong with a large increase in flooded area between 2009 and2100 (Fig.2).
4.2.2 Relative contribution of climate change andurbanization
In the dry scenario, the relative contribution of climatechange to the increase in flood damage between 2009 and2100 remains zero. This results simply from the definition
www.nat-hazards-earth-syst-sci.net/13/2301/2013/ Nat. Hazards Earth Syst. Sci., 13, 2301–2318, 2013

2312 A. Beckers et al.: Future land use changes and flood damage, River Meuse
Fig. 15. Flood damage evolution between 2009 and 2100 for the100 yr flood according to the wet climate scenario, and relativecontribution of future urbanization to damage by municipality.
of the dry climate scenario considered here (Sect.3.1.1).The corresponding relative contribution for the wet scenariois given by the difference between the damage in thepresent situation and the damage induced by theQ100+30 %flood combined with the present land use. The remainingpart of the additional damage is due to urbanization. Thisis shown in light grey in Fig.16. For the whole studyarea, the contribution of climate change is considerablylarger than that of land use change, reaching 77–89 %depending on the land use evolution scenario. However,the relative influences of both effects varies between themunicipalities. This is illustrated in Fig.15, where the colourof the municipalities represents the relative contribution ofurbanization in the increase of damage. In the upstream part,Hastière, Dinant, Yvoir, Anhée, and Profondeville show amaximum contribution of urbanization to the increase ofdamage between 32 % (Yvoir) and 54 % (Anhée). In thiscase, the contribution of urbanization in the current trendland use evolution scenario is significantly larger than thatof climate change. In Namur and Andenne, the contributionof urbanization to the additional damage is limited (22–27 %and 7–21 %, respectively). For the current trend scenarioin Huy and Wanze, it reaches 42 % and 46 %, respectively.This is due to the vast amount of land plots remainingavailable for building development in the 2100 flood-pronearea in these two municipalities. The influence of futureurbanization significantly decreases from Engis to Liège,due to the limited availability in non-built land plots in
Fig. 16. Evolution of flood damage between 2009 and 2100for a 100 yr flood of the river Meuse and according to a wetclimate scenario. DUD is dense urban development; MFH, no newresidential areas in the medium and high flood hazard areas; HFH,no new residential areas in the high flood hazard areas; and NFH,the flood hazard map is not considered for spatial planning.
the flood hazard areas in these municipalities. Finally, therelative contribution of urbanization to the additional damageis higher in Oupeye and Visé, which are two essentially ruralmunicipalities. The maximum value is reached in Visé (65 %in the current trend scenario) for the same reason as in Huyand Wanze.
5 Discussion
We successively discuss the land use evolution models andthe computed estimates for future flood damage.
5.1 Future urbanization
Since theplan de secteurremains one of the main drivingforces of urbanization in the Walloon region, it is ofparticularly high relevance to take it into account in theanalysis of future land use evolution. This supports the useof our “current trend” family of land use scenarios.
The development of original DUD scenarios may beanalysed in the light of the six main characteristics ofland use evolution models according toVerburg et al.(2004). Since characteristics of the territory, and not ofindividuals, were used in the model, the level of analysisis the macro-scale. Nonetheless, cross-scale dynamics wereconsidered: the regional level was used to assess the futureland use demand, while the definition of settlement coresand exclusion areas were based on data at the local level.No feedback was considered between the different levels.Driving forces were considered here, not to explain pastland use evolution, but to identify spatial opportunities fora future spatial planning enabling the ongoing urban sprawlto be better controlled and mitigated. This is in line with the
Nat. Hazards Earth Syst. Sci., 13, 2301–2318, 2013 www.nat-hazards-earth-syst-sci.net/13/2301/2013/

A. Beckers et al.: Future land use changes and flood damage, River Meuse 2313
methodology developed byCPDT (2010) in a similar studyfocused on the region of Huy. The three identified drivingforces are related to spatial interactions (employment-relatedpotential) and neighbourhood effects (function diversity,housing density). Finally, temporal dynamics were alsoconsidered by multiplying the future scenarios.
Results of our models show significant differences interms of additional urbanized areas between 2009 and 2100.More significant and spatially more uniform is the differencebetween the two main families of scenarios: current trendvs. DUD scenario (Fig.14). The reason for this is twofold.First, in the DUD scenarios, the density of households insettlement cores may be increased even if no more land plotsare available for building. Consequently, to accommodate agiven number of inhabitants, less area is needed in the DUDscenarios than in the current trend scenarios. Second, theDUD scenarios were developed in a way which land usesupply corresponds to land use demand in 2100 at the levelof the Walloon region. However, the future demand mayshow spatial variations (e.g. linked to the uneven distributionof population growth) so that the balance between supplyand demand is not met everywhere. Consequently, assuminga spatial homogeneity of land demand may cause localover- or underestimations of both the number and the sizeof core settlements. This in turn may lead to over- orunderestimations of flood damage.
Only the development of future residential areas isreproduced in the land use evolution models. In reality, allother land use categories will also evolve and influencefuture flood damage. Nevertheless, damage assessments inthe current situation have shown that the residential sectorrepresents over 54 % of the total damage at the level of the19 municipalities. Moreover, the residential sector is the landuse category in which the most important changes will occurin the flood-prone areas of the river Meuse forQ100+ 30 %.Therefore, neglecting the other land use categories in the landuse evolution models leads to a limited underestimation ofthe additional damage due to future land use changes in thefloodplains of the river Meuse.
5.2 Flood damage
5.2.1 Relative contribution of climate change andurbanization
The relative contribution of climate change and urbanizationto future flood damage is highly dependent on the consideredclimate scenario. In the dry scenario, urbanization is the onlyfactor influencing the evolution of flood damage, while in thewet scenario the effect of climate change largely exceeds thecontribution of urbanization. The results of the wet climatescenario are discussed here in comparison with previousstudies carried out in northwest Europe. Despite differencesin the studied areas, the methodology and the formulationof the results, our results in the wet climate scenario are
consistent with those ofte Linde et al.(2011). Based onthe analysis of the evolution of flood risk along the Rhineriver between 2000 and 2030,te Linde et al.(2011) obtainedbasin-wide flood risk increases by 43–160 % due to climatechange, whereas land use change resulted in increases ofonly 6.5–27 %. The computed flood risk/damage increasesare higher in the case of the present study (542–628 %),compared to the Rhine study (43–230 %), since the timehorizon considered here is also far more distant (2100 vs.2030). However, the relative contributions of both factorsare similar.Elmer et al. (2012) obtained opposite resultsin a German catchment. Based on the study of the driversof flood risk change in residential areas between 1990 and2020, they concluded that the expansion of residential areaswould be the main driver of flood risk evolution in thisregion. Poussin et al.(2012) studied the same issue for asection of the river Meuse in the southeast of the Netherlandsbetween 2000 and 2030. Unlike in the present study,Poussinet al.(2012) assumed that flood protections may be upgradedin the future to preserve their current nominal protectionstandards. Without this upgrade, the relative contributionof land use change exceeds the effect of climate change,whereas, with upgraded flood protections, both effects aresimilar in a “low” scenario and, in a “high” scenario, climatechange impacts exceed those of land use change. The “low”scenario refers here to a “low” climate scenario combinedwith a “low” land use scenario, as defined byPoussinet al. (2012), and conversely for “high” scenario. Threemain elements can explain these differences. First, the wetclimate scenario considered here is relatively extreme, andthe time horizon (2100) is more distant than those used inthe two previous studies. As emphasized byElmer et al.(2012), the climate influence could be more decisive inthe long term. Second, the land use characteristics of thethree studied areas are very different: the study area in thepresent study is much more urbanized than those analysed byElmer et al.(2012) andPoussin et al.(2012). Consequently,less space is available for new residential areas in theriver Meuse valley in the Walloon region, and the relativeinfluence of new urbanization on flood damage evolution istherefore reduced. Finally, no legal constraints force waterauthorities in the Walloon region to systematically upgradeflood defence systems to maintain protection against a givendesign flood, and, as a result, flood protection projects areevaluated on a case-by-case basis. Therefore, our modellingdid not include upgrades in the flood protections until2100. This simplification may partly explain the contrastbetween our results and some findings ofPoussin et al.(2012).
Based on our results for the wet climate scenario, moresustainable spatial planning, limiting urban sprawl, wouldnot be sufficient to substantially reduce the future rise in theoverall flood damage induced by a 100 yr flood of the riverMeuse in the Walloon region. Additional flood protectionmeasures should therefore be planned. Nonetheless, in seven
www.nat-hazards-earth-syst-sci.net/13/2301/2013/ Nat. Hazards Earth Syst. Sci., 13, 2301–2318, 2013

2314 A. Beckers et al.: Future land use changes and flood damage, River Meuse
of the studied municipalities, specifically considering floodhazard areas for spatial planning would reduce future flooddamage by over 40 %.
5.2.2 Flood damage and urbanization scenarios
The results demonstrate that the type of land use evolutionscenario influences the future value of flood damage, asshown in Fig.16 for the wet climate scenario. The currenttrend scenarios lead to the highest increase in damage.These differences may result from the combined effectof differences in the extents of the new residential areasand in the location of these areas with respect to theflood hazard zone. As shown in Sect.4.1.2, the currenttrend scenarios lead to the largest increase in the surfaceof new residential areas. In contrast, using the conceptof settlement cores, in the DUD scenarios, promotes theconcentration of new residential areas near the centre ofurban agglomerations, which are generally closer to the mainriverbed. Moreover, the spatial distribution of new residentialareas is more dispersed in the current trend scenarios (see forinstance Fig.13). Consequently, the results demonstrate thatthe wider expansion of new residential areas in the currenttrend scenarios has a more detrimental effect on damagethan the concentration of new residential areas in the DUDscenarios.
For the case of the wet climate scenario, Table5 showsthe effect of different levels of restriction on development inflood hazard areas. Prohibiting residential buildings withinthe high-hazard zone only, which is the current practice in theWalloon region, enables the future flood damage in the riverMeuse valley to decrease by 1.7–2.0 % (DUD scenarios)to 4.3 % (current trend scenario). If new developments areprohibited both in the high and in the medium hazard zones,the decrease in damage reaches 2.8–3.4 % to 6.7 %. Althoughrelatively small, these effects remain significant. Thishighlights the importance of accounting for the availableknowledge on flood hazard in spatial planning along the riverMeuse. A next step could be to control future developmentsalso in the low-hazard areas of the present flood maps, buta more sensible solution would consist in preparing updatedflood hazard maps taking into account the effects of climatechange on future flood discharges.
5.3 Limitations
Uncertainties on absolute flood damage values are highand difficult to quantify (de Moel and Aerts, 2011). Asdiscussed below, this results from the numerous sources ofuncertainties affecting flood damage assessment, as well asfrom the underlying assumptions.
Particularly high uncertainties arise from the climatechange projections. Their influence on flood hazard wasappreciated here by considering just two climate changescenarios (“wet” vs. “dry”). The extreme value statistics
Table 5.Influence of the degree of restriction on future developmentin flood-prone areas using the present-day flood hazard map onthe decrease in flood damage in the 19 municipalities for the wetclimate scenario. Values are the damage decrease (%) compared tothe non-consideration of the flood hazard map.
High flood Moderate andhazard high flood
hazard
Current trend 4.29 6.72
Dense urban development,regional development 1.68 2.83
Dense urban development,local development 1.99 3.41
used for flood frequency analysis introduce additionaluncertainties into the estimations of the present and future100 yr flood discharges. This was emphasized byApel et al.(2008), who quantified this effect in the case of the Rhineriver. Assuming no evolution in the flood defence system isobviously a simplifying assumption.
The main limitations in the assessment of future exposureresult from the following three simplifications: (i) asingle population growth scenario was considered, (ii) onlyresidential areas were modelled, and (iii) they were lumpedinto one single class because our land use evolution modelsdo not handle different trends depending on the type ofresidential areas. Moreover, the age of the buildings wasnot taken into account in the estimation of the specificprices, which were assumed constant in time. Adapting ourmodelling approach for the residential sector to other landuse categories, such as trade and industry, would highlyimprove the future exposure assessment.
The absolute values of present and future flood damageshould be considered with care since, as it is generally thecase, absolute damage estimates differ significantly betweendifferent damage models (Bubeck et al., 2011; Jongmanet al., 2012). The value of the elements at risk and thedamage curves constitute the main sources of uncertainties(de Moel and Aerts, 2011; Jongman et al., 2012). Sofar, no damage curve has been specifically developed forthe Walloon region. Filling this gap would significantlyimprove the accuracy of the results. A better quantificationof uncertainties would be obtained if the exposure andvulnerability models could be validated based on observedflood damage data in the Walloon region. This type ofinformation is recorded by the Belgian Disaster Fund, butavailable data so far significantly underestimate exposure anddamage, and are therefore difficult to use (Ernst et al., 2010).Collecting more reliable damage data in the river Meusevalley is an essential work to be conducted in the future.However, we focus here on relative changes in damage, andthese are considered as relatively well detected by current
Nat. Hazards Earth Syst. Sci., 13, 2301–2318, 2013 www.nat-hazards-earth-syst-sci.net/13/2301/2013/

A. Beckers et al.: Future land use changes and flood damage, River Meuse 2315
damage models, despite inaccuracies in the absolute damageestimates (Bubeck et al., 2011).
Finally, different return periods should be considered toderive the annual expected damage and perform a genuinerisk assessment. The EU Floods Directive (2007/60/EC)recommends using three return periods. Several studiessuggest that more return periods are needed to derive areliable estimate of the risk (e.g.Messner et al., 2007; Ernstet al., 2010; Penning-Rowsell et al., 2010; Ward et al.,2011a).
6 Conclusions
Damages induced by a 100 yr flood of the river Meuse inthe Walloon region (Belgium) were assessed at the level ofindividual land plots. Two time horizons were considered:present (2009) and 2100. To account for the evolutionof exposure between 2009 and 2100, a new methodologyhas been developed to model future developments in theresidential sector. Nine different spatial planning scenarioswere considered, together with two climate scenarios (“dry”and “wet”). Results show that, between 2009 and 2100,flood damage could be multiplied by 1.01–1.4 in the dryscenario and by 5.4–6.3 in the wet one. In the dry scenario,urbanization is the only influencing factor because 100 yrflood discharge is assumed not to increase. In contrast, in thewet scenario, the effect of climate change is 3–8 times moreinfluential than the effect of urbanization. These results mustbe considered in the light of the particularly wet hydrologicalscenario used as well as the assumption of no evolution ofprotection measures.
As shown by the results, a distinctive spatial pattern canbe identified between the different municipalities along theriver Meuse in the Walloon region. In the case of the wetclimate scenario, careful spatial planning for new residentialareas has a limited effect on the the total damage increaseby 2100, whereas, in 2 out of the 19 studied municipalities,the influence of future urbanization even exceeds the effectof climate change. Consequently, careful spatial planning,considering specifically future flood hazard, definitely needsto be promoted to reduce the future increase in flood damagein several municipalities. This should be complemented byadditional flood protection measures in other municipalities,in which the Meuse valley is already densely urbanized.
Appendix A
Table A1. Correspondence between the land use categories of theland registry of the Walloon region and the classes of specific priceused in the damage assessment.
Classes in the Land Registry (in French) Classes of specific prices
Habitations et dependances Residential area
Immeubles a appartements –Habitations superposees Residential area
Agriculture – Horticulture – Elevage Industry and business area
Artisanat – Petites entreprises Industry and business area
Industrie: productionde prouits alimentaires Industry and business area
Industrie: habillement et articles usuels Industry and business area
Industrie: materiaux de construction Industry and business area
Industrie: autres secteursde production que 5 a 7 Industry and business area
Industrie: batiments diverset constructionsdiverses, qui ne peuvent etreclasses dans un secteurde production bien determine,vise sous 5 a 8 Industry and business area
Commerce – Services –Entreprises “horeca” Industry and business area
Batiments publics –Batiments d’utilite publique Governmental utilization
Bienfaisance – Hospitalisation – Soins Governmental utilization
Enseignement Governmental utilization
Cultes Governmental utilization
Vancances – Sports –Récreation – Culture Leisure and recreation area
Batiments speciaux Supply buildings
Agriculture et Horticulture Grassland and cultivated area
Arbres Forestry
Recreation Leisure and recreation area
Eaux –
Chemins cadastres Infrastructure
Terres vaines et vagues –
Industrie Industry and business area
Destination speciale –
Materiel et outillage non bati Infrastructure
Acknowledgements.The authors gratefully acknowledge the twoanonymous reviewers for their very valuable comments, which ledto significant improvements in the manuscript. The authors alsogratefully acknowledge the “Service Public de Wallonie” (SPW)for the provided data, as well as Jean-Marie Halleux, Jean-MarcLambotte, and Christelle Viaud-Mouclier for fruitful discussions.
Edited by: H. KreibichReviewed by: two anonymous referees
www.nat-hazards-earth-syst-sci.net/13/2301/2013/ Nat. Hazards Earth Syst. Sci., 13, 2301–2318, 2013

2316 A. Beckers et al.: Future land use changes and flood damage, River Meuse
References
Antoni, J.-P.: Calibrer un modèle d’évolution de l’occupation dusol urbain: L’exemple de Belfort, Cybergeo: European Journal ofGeography, Systèmes, Modélisation, Géostatistiques, 347, 19 pp.doi:10.4000/cybergeo.2436, 2006 (in French).
Antrop, M.: Landscape change and the urbanization process inEurope, Landscape Urban Plan., 67, 9–26, 2004.
Apel, H., Merz, B., and Thieken, A. H.: Quantification ofuncertainties in flood risk assessments, International Journal ofRiver Basin Management, 6, 149–162, 2008.
Ashagrie, A. G., de Laat, P. J. M., de Wit, M. J. M., Tu, M., andUhlenbrook, S.: Detecting the influence of land use changeson Floods in the Meuse River Basin – the predictive power ofa ninety-year rainfall-runoff relation, Hydrol. Earth Syst. Sci.Discuss., 3, 529–559, doi:10.5194/hessd-3-529-2006, 2006.
Barredo, J. I., Lavalle, C., Demicheli, L., Kasanko, M., andMcCormick, N.: Sustainable urban and regional planning:the MOLAND activities on urban scenario modelling andforecast, Tech. rep., 55 pp., European Commission JointResearch Center, available at:http://publications.jrc.ec.europa.eu/repository/handle/111111111/7836, last access: 30 June2012, 2003.
Bubeck, P., de Moel, H., Bouwer, L. M., and Aerts, J. C. J. H.: Howreliable are projections of future flood damage?, Nat. HazardsEarth Syst. Sci., 11, 3293–3306, doi:10.5194/nhess-11-3293-2011, 2011.
Bureau fédéral du Plan: Planning paper 105 – Perspectives depopulation 2007–2060, Tech. rep., 136 pp., Bureau fédéral duPlan, available at:http://www.plan.be/publications/Publication_det.php?lang=fr\&TM=30\&KeyPub=650, last access: 30 June2012, 2008.
Bürgi, M., Hersperger, A. M., and Schneeberger, N.: Driving forcesof landscape change – current and new directions, LandscapeEcol., 19, 857–868, 2004.
Charlier, J., Reginster, I., and Juprelle, J.: Constructiond’indicateurs de développement territorial: étude dela localisation résidentielle récente et analyse auregard de critères de développement territorial durable,Tech. rep., 60 pp., Institut wallon de l’évaluation,de la prospective et de la statistique, available at:http://www.iweps.be/working-paper-de-liweps-ndeg2, lastaccess: 30 June 2012, 2011 (in French).
Commission internationale de la Meuse: Plan de gestion du districthydrographique international de la Meuse – Partie faitière, Tech.rep., 87 pp., Commission internationale de la Meuse, availableat: http://www.meuse-maas.be, last access: 15 December 2012,2009 (in French).
CPDT: Expertise veille –état du territoire wallon, annexes, Tech.rep., 75 pp., Conférence permanente du développement territorialde la Wallonie, available at:http://cpdt.wallonie.be/old/Data/recherches/finalisees/subv_09-10/V3/Rapport.pdf, last access:15 December 2012, 2010 (in French).
Dankers, R. and Feyen, L.: Climate change impact on floodhazard in Europe: An assessment based on high-resolutionclimate simulations, J. Geophys. Res., 113, D19105,doi:10.1029/2007JD009719, 2008.
Dautrebande, S., Colard, F., Dagnelies, J., Gaspar, S., andVandendael, L.: Détermination de la “courbe enveloppe” deszones d’inondation de cours d’eau en Région wallonne par une
méthode hydropédologique, in: Les risques majeurs en Régionwallonne: prévenir en aménageant, edited by: Direction généralede l’Aménagement du territoire du Logement et du Patrimoine,Ministère de la Région wallonne, Namur, 90–97, 2006 (inFrench).
Delforge, Y. and Géron, G.: Les noyaux d’habitat en Wallonie: jet’aime, moi non plus!, Les cahiers de l’urbanisme, 67, 16–20,2008 (in French).
de Moel, H. and Aerts, J. C. J. H.: Effect of uncertainty in land use,damage models and inundation depth on flood damage estimates,Nat. Hazard, 58, 407–425, 2011.
de Moel, H., van Alphen, J., and Aerts, J. C. J. H.: Flood maps inEurope – methods, availability and use, Nat. Hazards Earth Syst.Sci., 9, 289–301, doi:10.5194/nhess-9-289-2009, 2009.
de Moel, H., Aerts, J. C. J. H., and Koomen, E.: Developmentof flood exposure in the Netherlands during the 20th and 21stcentury, Global Environ. Chang., 21, 620–627, 2011.
De Roo, A., Schmuck, G., Perdiago, V., and Thielen, J.: Theinfluence of historic land use changes and future planned land usescenarios on floods in the Oder catchment, Phys. Chem. Earth,28, 1291–1300, 2003.
Detrembleur, S., Dewals, B., Fournier, M., Becker, B., Guilmin,E., Moeskops, S., Kufeld, M., Archambeau, P., de Keizer,O., Pontegnie, D., Huber, N., Vanneuville, W., Buiteveld, H.,Schüttrumpf, H., and Pirotton, M.: Hydraulic modelling of theMeuse: WP1 report – Action 6, Tech. rep., 12 pp., Interreg IVbAMICE project, 2011.
Dorner, W., Porter, M., and Metzka, R.: Are floods in part a form ofland use externality?, Nat. Hazards Earth Syst. Sci., 8, 523–532,doi:10.5194/nhess-8-523-2008, 2008..
Drogue, G., Fournier, M., Bauwens, A., Commeaux, F., DeKeizer, O., François, D., Guilmin, E., Degré, A., Detrembleur,S., Dewals, B., Pirotton, M., Pontegnie, D., Sohier, C., andVaneuville, W.: Analysis of climate change, high-flows and low-flows scenarios on the Meuse basin, Tech. rep., 69 pp., InterregIV-b AMICE project, available at:http://orbi.ulg.ac.be/handle/2268/66197, last access: 30 June 2012, 2010.
Dujardin, S., Labeeuw, F.-L., Melin, E., Pirart, F., and Teller,J.: Structuration du territoire pour répondre aux objectifs deréduction des émissions des gaz à effets de serre, Territoire(s)wallon(s), 6, 43–57, 2010 (in French).
Elmer, F., Hoymann, J., Düthmann, D., Vorogushyn, S., andKreibich, H.: Drivers of flood risk change in residen-tial areas, Nat. Hazards Earth Syst. Sci., 12, 1641–1657,doi:10.5194/nhess-12-1641-2012, 2012.
Ernst, J., Dewals, B. J., Detrembleur, S., Archambeau, P., Erpicum,S., and Pirotton, M.: Micro-scale flood risk analysis based ondetailed 2D hydraulic modelling and high resolution geographicdata, Nat. Hazards, 55, 181–209, 2010.
Erpicum, S., Dewals, B. J., Archambeau, P., Detrembleur, S.,and Pirotton, M.: Detailed inundation modelling using highresolution DEMs, Engineering Applications of ComputationalFluid Mechanics, 2, 196–208, 2010.
Giron, E., Coninx, I., Dewals, B. J., El Kahloun, M., De Smet, L.,Sacre, D., Detrembleur, S., Bachus, K., Pirotton, M., Meire, P.,De Sutter, R., and Hecq, W.: Towards an integrated decision toolfor adaptation measures – case study: floods, ADAPT final reportphase 1., Tech. rep., Belgian Science Policy, 2009.
Nat. Hazards Earth Syst. Sci., 13, 2301–2318, 2013 www.nat-hazards-earth-syst-sci.net/13/2301/2013/

A. Beckers et al.: Future land use changes and flood damage, River Meuse 2317
Gregory, D., Johnston, R., Pratt, G., Watts, M., and Whatmore,S.: The Dictionary of Human Geography, John Wiley & Sons,Chichester, UK, 2011.
Groupe Transversal Inondations: La cartographie des zonesd’inondation dans le cadre du Plan “PLUIES”, in: Les risquesmajeurs en Région wallonne: prévenir en aménageant, edited byDirection générale de l’Aménagement du territoire du Logementet du Patrimoine, Ministère de la Région wallonne, Namur, 34–40, 2006 (in French).
Halleux, J.-M.: Une ville compacte, qualitative . . . dans les limbes,Politique, 55, 12–14, 2008 (in French).
Hoymann, J.: Spatial allocation of future residential land use in theElbe River Basin, Environ. Plann. B, 37, 911–928, 2010.
Hoymann, J.: Modelling Future Residential Development: AScenario Analysis for the Elbe River Basin, Ph.D. thesis, Techn.Univ. of Berlin, Germany, 2011.
Huff, D.: A Probabilistic Analysis of Shopping Center Trade Areas,Land Econ., 39, 81–90, 1963.
IKSR: Atlas der Überschwemmungsgefährdung und möglichenSchäden bei Extremhochwasser am Rhein, Koblenz, Tech. rep.,Internationale Kommission zum Schutz des Rheins (IKSR), 2001(in German).
Institut de conseil et d’études en développement durable: Atlas deWallonie, Ministere de la Region Wallone, Direction généralede l’Aménagement du territoire, du Logement et du Patrimoine(DGATLP), 2005 (in German).
Jongman, B., Kreibich, H., Apel, H., Barredo, J. I., Bates, P. D.,Feyen, L., Gericke, A., Neal, J., Aerts, J. C. J. H., and Ward,P. J.: Comparative flood damage model assessment: towards aEuropean approach, Nat. Hazards Earth Syst. Sci., 12, 3733–3752, doi:10.5194/nhess-12-3733-2012, 2012.
Kreibich, H., Seifert, I., Merz, B., and Thieken, A.: Development ofFLEMOcs – a new model for the estimation of flood losses in thecommercial sector, Hydrolog. Sci. J., 55, 1302–1314, 2010.
Kundzewicz, Z. W.: Is the Frequency and Intensity of FloodingChanging in Europe?, in: Extreme Weather events and PublicHealth Responses, Chapter 1, 25–32, doi:10.1007/3-540-28862-7_3, 2005.
Leander, R., Adri Buishand, T., van den Hurk, B., and de Wit, M.:Estimated changes in flood quantiles of the river Meuse fromresampling of regional climate model output, J. Hydrol., 351,331–343, 2008.
Lepers, M. and Morelle, D.: Occupation et affectation du sol,empreintes de la structure du territoire?, Territoire wallon, 2, 44– 58, available at:http://cpdt.wallonie.be/old/Data/publications/territoire(s)wallon(s)/TW2/5.occupation%20sol%20corr.pdf,last access: 30 June 2012, 2008 (in French).
Messner, F., Pennning-Rowsell, E. C., Green, C., Meyer, V.,Tunstall, S. M., and Van der Veen, A.: Evaluating flood damages:guidance and recommendations on principles and methods, Tech.rep., FLOODsite Report Number T09-06-01, 2007.
Milly, P. C. D., Wetherald, R., Dunne, K., and Delworth, T.:Increasing risk of great floods in a changing climate, Nature, 415,514–517, 2002.
Muller, W.: ATKIS® data base revision and generation ofdigital topographic base maps, International Archives ofPhotogrammetry and Remote Sensing, 33, 710–717, 2000.
Newman, P. and Kenworthy, J.: The land use – transport connexion,Land Use Policy, 13, 1–22, 1996.
Overmars, K. P., Verburg, P. H., and Veldkamp, T. A.: Comparisonof a deductive and an inductive approach to specify landsuitability in a spatially explicit land use model, Land Use Policy,24, 584–599, 2007.
Peeters, A., Van Campenhout, J., Donnay, F., Mols, J., Snijders, J.-P., and Petit, F.: La cartographie des zones inondées: approchegéomorphologique et enquêtes de terrain, in: Les risquesmajeurs en Région wallonne: prévenir en aménageant, edited by:Direction générale de l’Aménagement du territoire du Logementet du Patrimoine, Ministère de la Région wallonne, Namur, 44–59, 2006 (in French).
Penning-Rowsell, E., Viavattene, C., Pardoe, J., Chatterton, J.,Parker, D., and Morris, J.: The benefits of flood and coastalrisk management: a handbook of assessment techniques, FloodHazard Research Centre, London, 2010.
Poussin, J. K., Bubeck, P., Aerts, J. C. J. H., and Ward, P.J.: Potential of semi-structural and non-structural adaptationstrategies to reduce future flood risk: case study for theMeuse, Nat. Hazards Earth Syst. Sci., 12, 3455–3471,doi:10.5194/nhess-12-3455-2012, 2012.
Région Wallonne: PLI – Plan de Localisation Informatique VO6,available at: http://dgo4.spw.wallonie.be/dgatlp/dgatlp/default.asp, last access: 9 April 2012, 2012 (in French).
Sinaba, B. and Peter Huber, N.: Quantification of the impacts offuture floods on the economy in the transnational Meuse basin– Flood Risk Assessment Methodology – Action 7, Tech. rep.,Interreg IV-b AMICE project, 2011.
SPF Finances: SPF Finances – Documentation Patrimoniale,Informatisation du plan cadastral: le projet CADMAP,available at: http://minfin.fgov.be/portail2/fr/current/spokesperson-12-07-03.htm, last access: 30 June 2012,2012.
te Linde, A. H., Bubeck, P., Dekkers, J. E. C., de Moel, H.,and Aerts, J. C. J. H.: Future flood risk estimates alongthe river Rhine, Nat. Hazards Earth Syst. Sci., 11, 459–473,doi:10.5194/nhess-11-459-2011, 2011.
Thieken, A., Ackermann, V., Elmer, F., Kreibich, H., Kuhlmann,B., Kunert, U., Maiwald, H., Merz, B., Müller, M., Piroth, K.,Schwarz, J., Schwarze, R., Seifert, I., and Seifert, J.: Methodsfor the evaluation of direct and indirect flood losses, in: 4thInternational Symposium on Flood Defence: Managing FloodRisk, Reliability and Vulnerability, 6–8 May 2008, Toronto,Ontario, Canada, 2008.
Tu, M., Hall, M. J., De Laat, P., and De Wit, M.: Extremefloods in the Meuse river over the past century: aggravatedby land-use changes?, Phys. Chem. Earth Pt. C, 30, 267–276,doi:10.1016/j.pce.2004.10.001, 2005.
UNISDR: 2009 UNISDR Terminology on Disaster Risk Reduction,United Nations International Strategy for Disaster Reduction,Tech. rep., 30 pp., 2009.
Van der Haegen, H., Pattyn, M., and Rousseau, S.: Dispersion etrelations de niveau élémentaire des noyaux d’habitat en Belgique– Situation en 1980, Bulletin de Statistique, 5–6, 265–284, 1981(in French).
Van Hecke, E., Halleux, J., Decroly, J., and Mérenne-Schoumaker,B.: Noyaux d’habitat et régions urbaines dans une Belgiqueurbanisée, in: Monographie urbanisation de l’Enquête socio-économique 2001, SPF Economie, PME, Classes moyennes etEnergie, Brussels, 2009 (in French).
www.nat-hazards-earth-syst-sci.net/13/2301/2013/ Nat. Hazards Earth Syst. Sci., 13, 2301–2318, 2013
2318 A. Beckers et al.: Future land use changes and flood damage, River Meuse
van Pelt, S. C., Kabat, P., ter Maat, H. W., van den Hurk, B.J. J. M., and Weerts, A. H.: Discharge simulations performedwith a hydrological model using bias corrected regionalclimate model input, Hydrol. Earth Syst. Sci., 13, 2387–2397,doi:10.5194/hess-13-2387-2009, 2009.
Verburg, P. H.: Simulating feedbacks in land use and land coverchange models, Landscape Ecol., 21, 1171–1183, 2006.
Verburg, P. H., Veldkamp, A., Espaldon, V., and Mastura, S. A.:Modelling the Spatial Dynamics of Regional LandUse: TheCLUE-S Model, Environ. Manage., 30, 391–405, 2002.
Verburg, P. H., Schot, P. P., Dijst, M. J., and Veldkamp, A.: Landuse change modelling: current practice and research priorities,Geojournal, 61, 309–324, 2004.
Verburg, P. H., Eickout, B., and VanMeijl, H.: A multi-scale, multi-model approach for analyzing the future dynamics of Europeanland use, Ann. Regional Sci., 42, 57–77, 2007.
Ward, P. J., de Moel, H., and Aerts, J. C. J. H.: How are floodrisk estimates affected by the choice of return-periods?, Nat.Hazards Earth Syst. Sci., 11, 3181–3195, doi:10.5194/nhess-11-3181-2011, 2011a.
Ward, P. J., Renssen, H., Aerts, J. C. J. H., and Verburg, P. H.:Sensitivity of discharge and flood frequency to 21st Centuryand late Holocene changes in climate and land use (RiverMeuse, northwest Europe), Climatic Change, 106, 179–202,doi:10.1007/s10584-010-9926-2, 2011b.
Nat. Hazards Earth Syst. Sci., 13, 2301–2318, 2013 www.nat-hazards-earth-syst-sci.net/13/2301/2013/