contribution of sp3 clusters in films and fibers obtained from camphor
TRANSCRIPT
Diamond and Related Materials 8 (1999) 481–484
Contribution of sp3 clusters in films and fibers obtained from camphor
E. Rzepka a,*, A. Lusson a, C. Levy-Clement a, Mukul Kumar b, K. Mukhopadhyay b,Maheshwar Sharon b
a Laboratoire de Physique des Solides de Bellevue, CNRS, 92195 Meudon, Cedex, Franceb Department of Chemistry, Indian Institute of Technology, Powai, Bombay 400 076, India
Received 27 July 1998; accepted 31 October 1998
Abstract
Considerable attention has been focused on the growth of carbon-based films or fibers by various methods. Diamond-likecarbon (DLC) films may be of greater importance in some specific electronic applications such as flat panel displays, whichrepresent a very large market. In this study, carbon-based thin films and fibers obtained from doped camphor soot were studiedby confocal microRaman spectroscopy at 632.8 nm.
Different contributions were identified between 1000 and 1650 cm−1 in the Raman spectra of the as-grown and laser-annealedfilms and fibers. The contributions were the D-like and G-like peaks of polycrystalline graphite at about 1345 and 1530 cm−1,respectively, with a FWHM value about 5 times larger than in a:C. It is now well established from correlation between Ramansignature and grain size measurements that the width of the Raman line is a decreasing function of the graphite grain size. Fromthese results, one can estimate that the grain size of this polycrystalline graphitic phase was small. An additional feature isobserved at about 1240 cm−1 which could be due to sp3-bonded carbon clusters. © 1999 Elsevier Science S.A. All rights reserved.
Keywords: DLC; sp3 cluster; MicroRaman; Camphor
1. Introduction tube under a nitrogen atmosphere. A small part of thesoot collected was kept in a quartz boat of a conven-tional thermal vacuum deposition unit. This was keptMost diamond-like carbon (DLC) films have been
prepared from a precursor containing either pure sp3 inside the tungsten filament and its temperature wasmaintained at 1300–1500°C. The deposition was carriedcarbon (e.g. methane) or pure sp2 carbon atoms (e.g.
graphite). Recently, Sharon et al. [1] have reported the out onto Si, glass and quartz substrates. The substratetemperature was varied from 500 to 1000°C. Phosphorusformation of carbon-based films from a natural source
camphor by a simple vacuum evaporation technique. or boron was added to camphor prior to its burning toobtain respectively n-type doped or p-type dopedCamphor is superior to conventional precursors, because
it contains both types of carbon atoms needed for the carbon-based soot. This soot was then used to preparethin films. It is important to note that either a small sizeformation of DLC films. As a result, less stringent
conditions are needed to make DLC films from the soot crystalline or an amorphous structure may be formedduring deposition. Thickness values range from 400 toof camphor. In this study, we investigate carbon-based
films and fibers prepared from camphor, by means of 700 A. Carbon fibers were prepared by pyrolysis ofcamphor vapor at 1000°C for 2 h in an argon atmo-the confocal microRaman scattering technique.sphere. The fibers grew on a stainless steel substratewhich was kept in the furnace. For this study, weselected two kind of fibers: a thick one having a diameter2. Materials and methodsof about 20 mm and 8 cm long, and a thin one having adiameter of 1 mm and 4–8 cm long.Samples were prepared using a method described
The Raman spectra were recorded at room temper-elsewhere [1]. Camphor was burnt in a 1 m long quartzature in the backscattering geometry using a LabramDilor confocal microRaman probe from ISA Jobin-* Corresponding author. Fax: +33 1450 75841;
e-mail: [email protected] Yvon. Excitation was performed with the 632.8 nm line
0925-9635/99/$ – see front matter © 1999 Elsevier Science S.A. All rights reserved.PII: S0925-9635 ( 98 ) 00403-8
482 E. Rzepka et al. / Diamond and Related Materials 8 (1999) 481–484
from an He–Ne laser. The laser beam was focused onto 3.2. MicroRaman studies of amorphous diamond-likefilm annealed by laserthe sample with a spot size of about 1 mm. Gaussian
curves superimposed on a linear or quadratic polynomialbackground (attributed to laser-induced luminescence) Extremely high power densities were easily reached in
the focal plane of the laser beam, especially whenare preferred for the spectral analysis and fit the datawell; more elaborate lineshape functions were not neces- performing microRaman measurements, and may lead
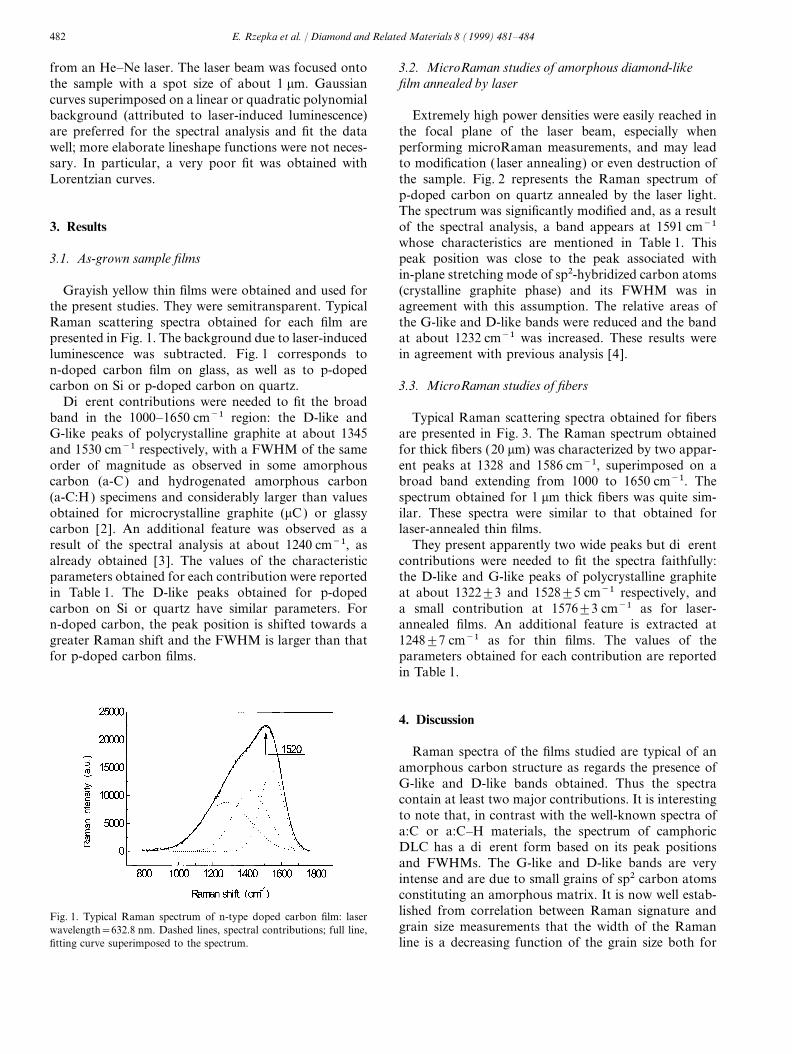
to modification ( laser annealing) or even destruction ofsary. In particular, a very poor fit was obtained withLorentzian curves. the sample. Fig. 2 represents the Raman spectrum of
p-doped carbon on quartz annealed by the laser light.The spectrum was significantly modified and, as a resultof the spectral analysis, a band appears at 1591 cm−13. Resultswhose characteristics are mentioned in Table 1. Thispeak position was close to the peak associated with3.1. As-grown sample filmsin-plane stretching mode of sp2-hybridized carbon atoms(crystalline graphite phase) and its FWHM was inGrayish yellow thin films were obtained and used for
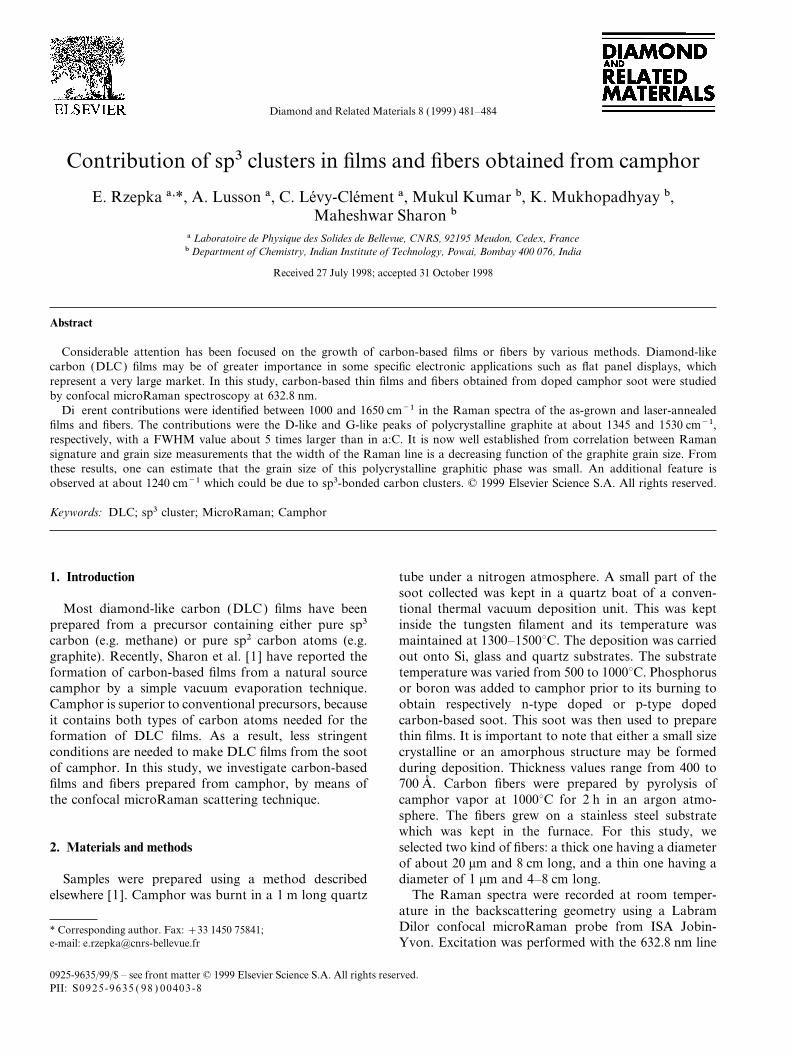
the present studies. They were semitransparent. Typical agreement with this assumption. The relative areas ofthe G-like and D-like bands were reduced and the bandRaman scattering spectra obtained for each film are
presented in Fig. 1. The background due to laser-induced at about 1232 cm−1 was increased. These results werein agreement with previous analysis [4].luminescence was subtracted. Fig. 1 corresponds to
n-doped carbon film on glass, as well as to p-dopedcarbon on Si or p-doped carbon on quartz. 3.3. MicroRaman studies of fibers
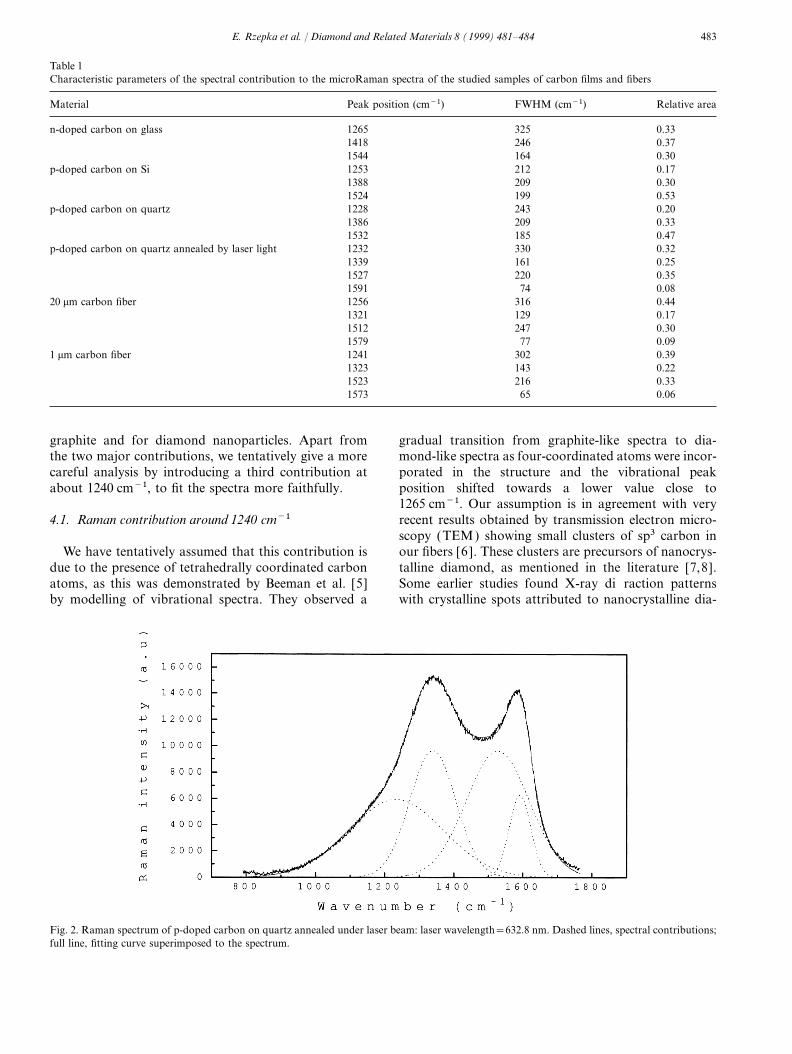
Different contributions were needed to fit the broadband in the 1000–1650 cm−1 region: the D-like and Typical Raman scattering spectra obtained for fibers
are presented in Fig. 3. The Raman spectrum obtainedG-like peaks of polycrystalline graphite at about 1345and 1530 cm−1 respectively, with a FWHM of the same for thick fibers (20 mm) was characterized by two appar-
ent peaks at 1328 and 1586 cm−1, superimposed on aorder of magnitude as observed in some amorphouscarbon (a-C) and hydrogenated amorphous carbon broad band extending from 1000 to 1650 cm−1. The
spectrum obtained for 1 mm thick fibers was quite sim-(a-C:H) specimens and considerably larger than valuesobtained for microcrystalline graphite (mC) or glassy ilar. These spectra were similar to that obtained for
laser-annealed thin films.carbon [2]. An additional feature was observed as aresult of the spectral analysis at about 1240 cm−1, as They present apparently two wide peaks but different
contributions were needed to fit the spectra faithfully:already obtained [3]. The values of the characteristicparameters obtained for each contribution were reported the D-like and G-like peaks of polycrystalline graphite
at about 1322±3 and 1528±5 cm−1 respectively, andin Table 1. The D-like peaks obtained for p-dopedcarbon on Si or quartz have similar parameters. For a small contribution at 1576±3 cm−1 as for laser-
annealed films. An additional feature is extracted atn-doped carbon, the peak position is shifted towards agreater Raman shift and the FWHM is larger than that 1248±7 cm−1 as for thin films. The values of the
parameters obtained for each contribution are reportedfor p-doped carbon films.in Table 1.
4. Discussion
Raman spectra of the films studied are typical of anamorphous carbon structure as regards the presence ofG-like and D-like bands obtained. Thus the spectracontain at least two major contributions. It is interestingto note that, in contrast with the well-known spectra ofa:C or a:C–H materials, the spectrum of camphoricDLC has a different form based on its peak positionsand FWHMs. The G-like and D-like bands are veryintense and are due to small grains of sp2 carbon atomsconstituting an amorphous matrix. It is now well estab-lished from correlation between Raman signature andFig. 1. Typical Raman spectrum of n-type doped carbon film: lasergrain size measurements that the width of the Ramanwavelength=632.8 nm. Dashed lines, spectral contributions; full line,
fitting curve superimposed to the spectrum. line is a decreasing function of the grain size both for
483E. Rzepka et al. / Diamond and Related Materials 8 (1999) 481–484
Table 1Characteristic parameters of the spectral contribution to the microRaman spectra of the studied samples of carbon films and fibers
Material Peak position (cm−1) FWHM (cm−1) Relative area
n-doped carbon on glass 1265 325 0.331418 246 0.371544 164 0.30
p-doped carbon on Si 1253 212 0.171388 209 0.301524 199 0.53
p-doped carbon on quartz 1228 243 0.201386 209 0.331532 185 0.47
p-doped carbon on quartz annealed by laser light 1232 330 0.321339 161 0.251527 220 0.351591 74 0.08
20 mm carbon fiber 1256 316 0.441321 129 0.171512 247 0.301579 77 0.09
1 mm carbon fiber 1241 302 0.391323 143 0.221523 216 0.331573 65 0.06
graphite and for diamond nanoparticles. Apart from gradual transition from graphite-like spectra to dia-mond-like spectra as four-coordinated atoms were incor-the two major contributions, we tentatively give a more
careful analysis by introducing a third contribution at porated in the structure and the vibrational peakposition shifted towards a lower value close toabout 1240 cm−1, to fit the spectra more faithfully.1265 cm−1. Our assumption is in agreement with veryrecent results obtained by transmission electron micro-4.1. Raman contribution around 1240 cm−1scopy (TEM) showing small clusters of sp3 carbon inour fibers [6 ]. These clusters are precursors of nanocrys-We have tentatively assumed that this contribution is
due to the presence of tetrahedrally coordinated carbon talline diamond, as mentioned in the literature [7,8].Some earlier studies found X-ray diffraction patternsatoms, as this was demonstrated by Beeman et al. [5]
by modelling of vibrational spectra. They observed a with crystalline spots attributed to nanocrystalline dia-
Fig. 2. Raman spectrum of p-doped carbon on quartz annealed under laser beam: laser wavelength=632.8 nm. Dashed lines, spectral contributions;full line, fitting curve superimposed to the spectrum.
484 E. Rzepka et al. / Diamond and Related Materials 8 (1999) 481–484
5. Conclusion
Raman scattering allows us to determine the natureof the different carbon-based phases in our samples.Amorphous carbon phases are well resolved by usingred excitation. Our carbon-based films and fibers arecomposed sp3 carbon atom clusters embedded in ansp2 amorphous matrix. The ratio of hydrogen bonds tocarbon atoms is very low as shown by FTIR absorptionmeasurements.
Fig. 3. Raman spectrum of 20 mm carbon fiber: laser wavelength=632.8 nm. Dashed lines, spectral contributions; full line, fitting curvesuperimposed on the spectrum. Acknowledgements
The authors are grateful to the ISA Jobin-Yvonmond [9–12]. However, the Raman signature of dia-Raman staff, H. Boyer, J. Oswalt and T. Nguyen, formond nanoclusters is much debated. The moreperforming the measurements and for valuable discus-convincing results are provided on the basis of TEMsions. One of us ( K.M.) is thankful to I.I.T.data or the 1332 cm−1 Raman line, in the case ofPowaı–Mumbai for providing him with a fellowship todiamond crystals with a size of about 4 nm [13]. Thecarry out this work. We (CLC and MS) are thankful torelaxation of the k=0 ‘selection rule’ for Raman scatter-the India–French Cooperation for Advanced Scienceing, due to phonon scattering from the boundaries ofResearch for providing us with a grant to visitthe Brillouin zone, leads to significant broadening of theCNRS–Bellevue and I.I.T. Powaı–Mumbai to carry outRaman lines observed from nanophase materialscertain parts of this experiment.[14,15], and the position of the 1240 cm−1 peak attrib-
uted to nanocrystalline diamond seems to be controver-sial [14]. In recent results obtained from studies of thetemperature dependence of the growth rate for nanocrys-
Referencestalline diamond [16], Raman spectra are presented withmajor contributions at 1332 cm−1 (sp3 bonding) and at
[1] K. Mukhopadhyay, K.M. Krishna, M. Sharon, Carbon 341580 cm−1 (sp2 bonding in boundaries) with various(1996) 251.relative intensities. A significant contribution is also
[2] J. Robertson, Prog. Solid State Chem. 21 (1991) 199 and refer-observed in the 1240 cm−1 range. This band could be a ences thereinRaman signature for precursors of nanocrystalline dia- [3] C.V. Cooper, C.P. Beetz Jr.,, B.W. Bucholtz, P.J. Wilbur, R. Wei,
Diamond Relat. Mater. 3 (1994) 534.mond in our films and in our fibers. Similar Raman[4] R.O. Dillon, J.A. Woollam, V. Katkanant, Phys. Rev. B 29spectra are obtained with hydrogen-free DLC where
(1984) 3482.both diamond (~40 nm in diameter size) and graphite[5] D. Beeman, J. Silverman, R. Lynds, M.R. Anderson, Phys. Rev.
crystals are embedded in an amorphous carbon matrix B 30 (1984) 870.[17]. [6 ] N. Alonso-Vante et al., personal communication, to be published.
[7] F. Li, J.S. Lannin, Appl. Phys. Lett. 61 (1992) 2116.On the basis of three contributions to the Raman[8] R.J. Nemanich, J.T. Glass, G. Lucovsky, R.E. Shroder, J. Vac.spectra obtained for as-grown films, fibers or laser-
Sci. Technol. A 6 (1988) 1783.annealed films, the spectra are fitted by introducing one[9] E.G. Spencer, P.H. Schmidt, D.C. Joy, F.J. Sansabone, Appl.
more contribution due to crystalline graphite. These Phys. Lett. 29 (1976) 118.fittings by four contributions are not obvious as the [10] C. Weissmantel et al., Thin Solid Films 72 (1980) 19.
[11] H. Vora, T.J. Moravec, J. Appl. Phys. 52 (1981) 6151.spectra present only two apparent peaks, and up to now[12] T. Mori, Y. Namba, J. Appl. Phys. 55 (1984) 3276.many authors have tried, with success, to used only two[13] A.N. Obraztsov, M.A. Timofeyev, M.B. Guseva, V.G. Babaev,contributions, but in our case two contributions never
Z.Kh. Valiullova, V.M. Babina, Diamond Relat. Mater. 4fit the spectra faithfully. We assume that this progression (1995) 968.in the number of contributions in spectral analysis is [14] R.J. Nemanich, J.T. Glass, G. Lucovsky, R.E. Shroeder, J. Vac.
Sci. Technol. A 6 (1988) 1783.well founded and allows a better physical analysis of[15] R.E. Shroder, R.J. Nemanich, J.T. Glass, Phys. Rev. B 41the composition of the materials. Camphoric DLC films
(1990) 3738.appear to be different from other conventional DLC[16] T.G. MacCauley, D.M. Gruen, A.R. Krauss, Appl. Phys. Lett.
films that we have analyzed in our laboratory: the 73 (1998) 1648.contribution in the 1240 cm−1 range is much more [17] S. Satel, J. Robertson, Z. Tass, M. Scheib, D. Wiescher, H. Ehr-
ardt, Diamond Relat. Mater. 6 (1997) 255.pronounced for the Raman spectra.