contributions to the history of the hungarian ethnic...
TRANSCRIPT

CONTRIBUTIONS TO THE HISTORY OF THE HUNGARIAN ETHNIC MAPPING
Károly KOCSIS1 – Patrik TÁTRAI2
1 Head of Department, Geographical Research InstituteHungarian Academy of Sciences
Department of Human GeographyUniversity of [email protected]
2 Research fellow, Geographical Research InstituteHungarian Academy of Sciences
ADALÉKOK A MAGYAR ETNIKAI TÉRKÉPEZÉS TÖRTÉNETÉHEZ
Összefoglalás
Az Európában egyik legrégibb múltra visszatekintő magyar, vagy magyarországi etnikai jellegű térképezés főként annak köszönheti eddigi különösen nagy termékenységét, hogy a Kárpát-medence területe a 17-18. szá-zad óta etnikai-nyelvi szempontból Európa etnikai-vallási szempontból egyik legtarkább népességű és éppen ezért – a felvilágosodás, a nemzeti ébredés kora óta – etnikai feszültségekkel egyik legjobban terhelt területének számít. A Magyar Királyság népeinek középkori békés együttélését fokozatosan ellenségessé változtató elmúlt két évszázad során, jórészt a nemzetiségek irredenta mozgalmai miatt, a tarka etnikai struktúra térbeli vetületének kutatása, térképezése emberek ezreinek-millióinak sorsát befolyásoló tényezővé vált. Írásunkban ennek a több mint két évszázados, a mindenkori politikai eseményekkel összefüggésben változó intenzitású, a Kárpát-medence területéhez kapcsolódó magyar etnikai térképezési tevékenység történetét szeretnénk vázolni.
Summary
Ethnic mapping in Hungary has a long history in European comparison. This abundance is due to the fact that the Carpathian Basin i.e. historical Hungary has been one of the most heterogeneous regions of the continent from the ethnic, lingual and confessional aspects since the 16–17th centuries. This is the reason why this has been an area under the burden of ethnic tensions since the period of the Enlightenment, the emergence of national consciousness. Over the past two centuries, during which a previous peaceful coexistence of the peoples typical of the medieval Hungarian Kingdom had been gradually turning into a hostile attitude – mostly owing to irredentist movements of national minorities – the study and mapping of this ethnic mixture and its heterogeneous pattern has grown into a factor influencing the fate of thousands and millions of people. This contribution is aimed to outline the history of these activities of ethnic mapping in Hungary which have taken place with changing intensity over these centuries in dependence on the contemporary political background.

KOCSIS – TÁTRAI: CONTRIBUTIONS TO THE HISTORY OF THE HUNGARIAN ETHNIC MAPPING
250
The period before 1918
The interest in the spatial aspects of ethnic issues and ethnic mapping activities in the Carpathian Basin (historical Hungary) goes back to the emergence of modern nations and awakening national consciousness. In late 18th and early 19th century, this manifested itself in the appearance of „ethnographic” maps with simple areal representation and poor reliability, meeting requirements of state administration and certain political movements, primarily those of national minorities. Of them maps compiled by cartographer János KORABINSZKY (1740–1811) and ethnographer János CSAPLOVICS (1780–1847) are worth mentioning. A map of ca 1 : 1 million by Korabinszky (published in 1791) – according to the prevailing standards of the age – showed distribution of ethnic groups with areal representation, however, his atlas of 1804 already provided ethnic information by settlements using various symbols under the inscriptions of towns and villages. Csaplovics published an ethnographic (ethnic) map in 1829 without Transylvania but including Croatia–Slavonia, topographically based on Lipszky’s map (LIPSZKY, 1806) with very simple and surprisingly inaccurate areal representation, biased in favour of non-Hungarian population. After the War of Hungarian Independence (1848–49) it was Ignác HÁTSEK (1828–1902), a cartographer of the Hungarian Royal Statistical Office, who compiled a map of nationalities statistically based upon the census data of 1869 and estimations by Károly Keleti (KELETI, 1871) and published in 1871. Relying on statistical information, this map showed spatial and percentage distribution of the ethnic groups by counties of Hungary, on chorograms. Later, a growing tension between ethnicities, strengthening separatist efforts from the side of neighbour nations (Romanians, Serbs, Czechs), the publication of the 1880 census data on native tongue prompted an increasing number of statisticians, historians, linguists, ethnographers, geographers and cartographers to deal with the spatial aspects of the ethnic question and with the compilation of ethnic maps. Then Ferenc RÉTHEY edited the first map of native language of Hungary, which could be claimed to be accurate. Using the method of areal representation, minorities were shown to 5-10% in towns and 10-20% in villages as the lower limits (RÉTHEY,1885). Somewhat later, with the elaboration of the 1890 census data on native language a highly accurate map at 1 : 2 million scale appeared (without mentioning the authors) which deployed the method of stripe diagram, a novelty of the time and regarded a pioneer representation of ethnic mixture of population (MAGYARORSZÁG…, 1891). A chorogram map entitled „A CZIGÁNYOK...”(1895) based upon the data collected by the Gypsy census of 1893 presented the share of this ethnic group by districts and urban settlements.
Figure 1. A detail of the map of Réthey (1885)

251
KOCSIS – TÁTRAI: CONTRIBUTIONS TO THE HISTORY OF THE HUNGARIAN ETHNIC MAPPING
Ethnic mapping was especially active in Central and South-East Europe in the first two decades of the 20th century, prior to First World War and peace treaties aftermath. Multiethnic Austro–Hungarian Empire had become the focus of interest; its ethnic pattern, although along general lines of information and its dissemination, was studied eagerly by French, German, Austrian, Italian experts. On the other hand, similar ethnographic-lingual maps were compiled by specialists of minor nations of the subcontinent in support of territorial claims and Pan-Slavic efforts encouraged by Russians. At the turn of the 20th century Hungarian researchers (not necessarily geographers) dealing with territorial outcomes of ethnic issues engaged in studies on the changing weight and ratio of Hungarian ethnicity, processes of Rumanisation, Slovakisation, geographical position of Hungarian lingual islets and ethnic spatial processes in general. (e.g. KÖRÖSI, 1898; GYÖRFFY 1915). The first, although eclectic work (of historical, geographical, ethnographic, anthropological character) which might be considered an ethnic geographical essay was written by Pál BALOGH (1854–1933), a journalist and statistician (BALOGH, 1902). In his first map attachment the ethnic map of Hungary was represented by an anamorphic chorogram. Districts of Hungary were shown by squares of identical size divided by screens according to the distribution of ethnic groups by the 1900 census. A serious shortcoming of this novel method was that eg. a district with 15 thousand Slovakian population (Alsókubin – Dolný Kubin) was shown by a square of the same dimension as the purely Hungarian Debrecen with 75 thousand inhabitants. Attachments III through IX (maps at a scale of 1 : 300 thousand) ethnic pattern was shown by settlements with symbols that are hard to interpret. Parallel with these achievements, in an attempt of increasingly realistic visualisation of ethnic patterns – as a response to propagandistic efforts of the representatives of Romanian, Serbian, Czech ethnic mapping neglecting factual census results – Hungarian ethnic cartography had developed considerably. To replace previous areal representation – widely used in areas of low population density mainly inhabited by ethnic minorities and highly unfavourable for the Hungarians usually living in urban settlements and river valleys – mapping methods of representation were sought to reflect real spatial ethnic patterns and huge differences in population densities. It was Jenő CHOLNOKY (1870–1950), a prominent Hungarian geographer who, learning from the fault of P. Balogh, published a map in 1906, where the urban settlements and district were not treated as of the same size but their administrative area was screened proportionately to the percentage of the ethnic groups represented. Distortions stemming from the varied population size between districts, however, could not be eliminated with this method. Zsigmond BÁTKY, an ethnographer and geographer (1874–1939) tried to solve problems associated with limited possibilities of visual representation and differences in population densities with showing uninhabited areas as blank spots on the map. At this time (1908) was published an ethnic map featuring pie-charts should be considered of medium scale (1 : 360 000) as compared with the previous ones and represented the complex ethnic structure of the population of Hungary in sufficient detail and with substantial accuracy, by settlements (A MAGYAR ÁLLAM...).
The period between 1918 and 1945
During preparations for peace treaties closing the First World War, compilation of ethnic maps was given a strong emphasis both in the neighbour countries and in Hungary hoping that they will positively influence the drawing of the new state boundaries. The Hungarian delegation was in a humiliated situation during the negotiations, but having at hand a detailed documentation including three ethnic maps attempted to maintain the „thousand
KOCSIS – TÁTRAI: CONTRIBUTIONS TO THE HISTORY OF THE HUNGARIAN ETHNIC MAPPING
252
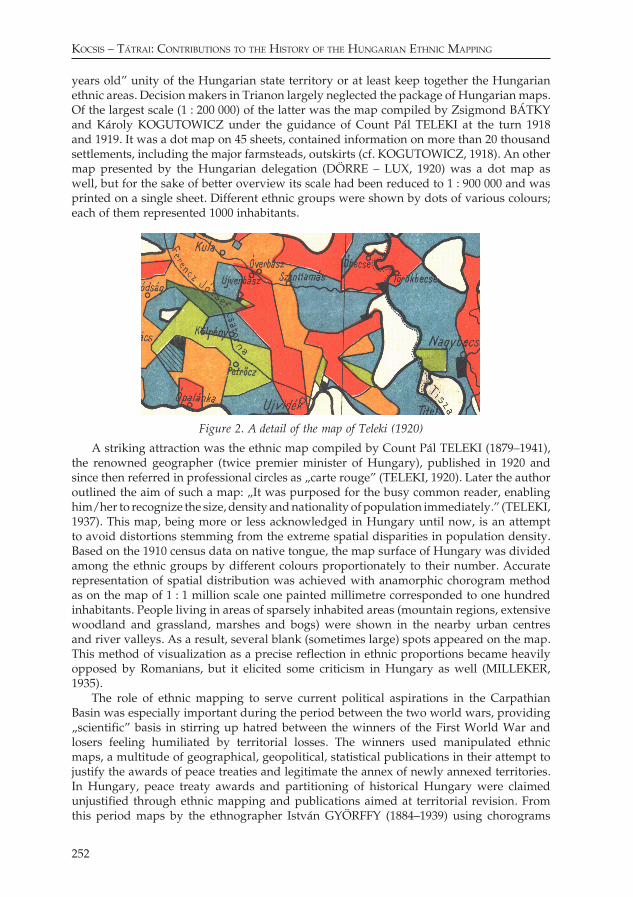
years old” unity of the Hungarian state territory or at least keep together the Hungarian ethnic areas. Decision makers in Trianon largely neglected the package of Hungarian maps. Of the largest scale (1 : 200 000) of the latter was the map compiled by Zsigmond BÁTKY and Károly KOGUTOWICZ under the guidance of Count Pál TELEKI at the turn 1918 and 1919. It was a dot map on 45 sheets, contained information on more than 20 thousand settlements, including the major farmsteads, outskirts (cf. KOGUTOWICZ, 1918). An other map presented by the Hungarian delegation (DÖRRE – LUX, 1920) was a dot map as well, but for the sake of better overview its scale had been reduced to 1 : 900 000 and was printed on a single sheet. Different ethnic groups were shown by dots of various colours; each of them represented 1000 inhabitants.
Figure 2. A detail of the map of Teleki (1920)
A striking attraction was the ethnic map compiled by Count Pál TELEKI (1879–1941), the renowned geographer (twice premier minister of Hungary), published in 1920 and since then referred in professional circles as „carte rouge” (TELEKI, 1920). Later the author outlined the aim of such a map: „It was purposed for the busy common reader, enabling him/her to recognize the size, density and nationality of population immediately.” (TELEKI, 1937). This map, being more or less acknowledged in Hungary until now, is an attempt to avoid distortions stemming from the extreme spatial disparities in population density. Based on the 1910 census data on native tongue, the map surface of Hungary was divided among the ethnic groups by different colours proportionately to their number. Accurate representation of spatial distribution was achieved with anamorphic chorogram method as on the map of 1 : 1 million scale one painted millimetre corresponded to one hundred inhabitants. People living in areas of sparsely inhabited areas (mountain regions, extensive woodland and grassland, marshes and bogs) were shown in the nearby urban centres and river valleys. As a result, several blank (sometimes large) spots appeared on the map. This method of visualization as a precise reflection in ethnic proportions became heavily opposed by Romanians, but it elicited some criticism in Hungary as well (MILLEKER, 1935). The role of ethnic mapping to serve current political aspirations in the Carpathian Basin was especially important during the period between the two world wars, providing „scientific” basis in stirring up hatred between the winners of the First World War and losers feeling humiliated by territorial losses. The winners used manipulated ethnic maps, a multitude of geographical, geopolitical, statistical publications in their attempt to justify the awards of peace treaties and legitimate the annex of newly annexed territories. In Hungary, peace treaty awards and partitioning of historical Hungary were claimed unjustified through ethnic mapping and publications aimed at territorial revision. From this period maps by the ethnographer István GYÖRFFY (1884–1939) using chorograms

253
KOCSIS – TÁTRAI: CONTRIBUTIONS TO THE HISTORY OF THE HUNGARIAN ETHNIC MAPPING
and strip diagrams, by Károly KOGUTOWICZ applying areal and symbol chorograms (1927) and books on historical ethnic patterns by the linguist István KNIEZSA (1898–1965) and their map attachments (1938) are worth mentioning. Beside research serving political purposes there have been fundamental studies analysing the ethnic structure of the Carpathian Basin and its subregions or outlining problems of ethnic mapping (TELEKI, 1937; TELEKI – RÓNAI, 1937). During the Second World War, around the First and Second Vienna awards (1938 and 1940, respectively) and later, ethnic mapping once again obtained primary importance, particularly in relation with territorial revisions. In Hungary, a country with strong ambitions to regain certain regions inhabited by Hungarian minorities, several ethnic maps were compiled and used successfully during the negotiations at Vienna due to their topographic accuracy and professionalism. The re-annex of territories in Upper Hungary (today South Slovakia) was partly owing to a map using square diagrams at a scale of 1 : 200 000 entitled „A MAGYAR – SZLOVÁK NYELVHATÁR... (1942)”, whereas the revision in Transylvania was substantiated by a dot map by BÁTKY – KOGUTOWICZ – TELEKI (1940) and a map of square diagrams by István TARNÓCZI (1940). In this period, the Institute of Political Sciences played a prominent part, where studies under the guidance of the geographer András RÓNAI (1906–1991), director between 1940 and 1945, had received wide international recognition. A specific feature of the above mentioned map on Upper Hungary on double sheets was a pioneer application of the method of divided square diagrams and the dominant red colour was reserved for showing Slovakian population instead of Hungarian inhabitants. At the same time, maps by Bátky–Kogutowicz–Teleki and by Tarnóczi emphasized Hungarian ethnic space painted in red; Romanian and Slovakian population shown in pale violet and green faded almost entirely into the shading of relief representation. In 1942, by the Institute of Political Sciences, an „Ethnographic map of Central Europe” was published at 1 : 1 million scale, in four languages (JAKABFFY, 1942). Due to its high accuracy, square diagram method of representation and the extensive area embraced it is to be considered one of the finest examples of Hungarian ethnic mapping, associated with the name of Imre JAKABFFY (1915–), under the professional guidance of András Rónai. The map depicted ethnic conditions of a huge territory between Venice–Vinnitsa–Chemnitz–Varna on the basis of the official data of censuses conducted around 1930. A square of 1 mm2 size represented 200 rural and small town inhabitants whereas the ethnic structure of urban centres above 50 thousand were shown on pie-charts proportional to population number (see JAKABFFY, 1994). Chorogram and dot maps referring to ethnic and native language conditions at 1 : 6 million scale in „Atlas of Central Europe” completed at the Institute of Political Sciences by the spring of 1945 but widely known only since its publication in 1993 represent also a high value for cartography (RÓNAI, 1945, 1993).
Figure 3. A detail of the map of Jakabffy (1942)
KOCSIS – TÁTRAI: CONTRIBUTIONS TO THE HISTORY OF THE HUNGARIAN ETHNIC MAPPING
254
The period between 1945 and 1989
After the Second World War, and especially following the Communist takeover in the socialist countries of Europe including Hungary the part the ethnic mapping played previously had decreased considerably owing to restrictive measures, frustration and disillusionment. That is why ethnic mapping was vanishing until the mid-1960s. Research work was particularly crippled because primary sources i.e. ethnic data on the settlement level were labelled „for official use only” or „secret”. The ideology of proletarian inter- nationalism denied the significance of nationality issues and ethnic conflicts were declared non-existent. The first (although small scale) maps depicting ethnic pattern which had undergone a profound change after Second World War appeared in various atlases beginning with the 1960s. The first of them was published in the National Atlas of Hungary (ANYANYELV..., 1967) using chorograms and dots as the tools of visual representation. In the 1980s, the geographical approach to ethnic problems within the Carpathian Basin gathered momentum hitherto studied primarily by demography, ethnography, sociology and history. This trend was typical abroad and – with some delay – also emerged in Hungary. It was in this decade that geographical science in Hungary turned to revive ethnic mapping with its rich traditions. Depending on map scales, pie-charts, square diagrams, chorograms, dots and symbols were the dominant methods of representation (KOCSIS, 1989a, 1989b).
The period after 1989
Ethnic conflicts and warfare in the eastern part of Europe following the recent political changes, collapse of regimes and disintegration of federal states have led to a revival of ethnic mapping. During the years since the change of regime, the issues of Hungarians living beyond the state border, of ethnic minorities of Hungary and of the Gypsy population (Romas) have come to the fore. As a result, beside historical, ethnographical, demographical and sociological writings ethnic geographical publications appeared as well, especially on the Hungarian minority. The ethnic pattern in the Carpathian Basin was a topic of maps between 1 : 200 000 and 1 : 2 000 000 scales, based predominantly on the official census data (eg. KOCSIS, 1989b, 1990a, b, 1992, 1994) and visualising them with chorograms, pie-charts, or using symbols. The latter of them entitled „Ethnic map of Hungary and its surroundings” (KOCSIS, 1994b) was a novel as regards methods of visual representation – compared with the ethnic maps published in the first half of the 20th century. Similar to Teleki’s map (1920) it is also considered to be an anamorphic chorogram, but in order to reduce spatial distortion not the whole area of the country (Teleki: the Hungarian Kingdom) on the map but the inhabited portions of the administrative territory of settlements were divided among the resident ethnic groups (based on census data). It was an attempt to eliminate distortion caused by cities of considerable population size „crushing” their environs removing ethnic information from its actual geographical point of reference (see criticism by Milleker 1935 on Teleki’s map). This map in fact is an attempt to a joint and compromising application of demographic-ethnic and geographical-topographic approaches required by the small scale (1 : 2 million) of the map in concern. An ethnic map by László SEBŐK representing a similar area also at a scale of 1 : 2 million was published by Teleki László Foundation (SEBŐK, 1998) to be classified into areal and symbol chorogram maps (see KOGUTOWICZ, 1919; KOCSIS 1990a). Different colours showed ethnic groups forming absolute majority whereas symbols represented minorities and pie-charts depicted cities with more than 50 000 inhabitants (similar to Jakabffy, 1942).

255
KOCSIS – TÁTRAI: CONTRIBUTIONS TO THE HISTORY OF THE HUNGARIAN ETHNIC MAPPING
In the 1990s – along with the activities in regional and national dimensions – ethnic mapping was also conducted in the local scale, following the traces of prominent predecessors (e.g. GYÖRFFY, 1913, FODOR, 1942). These cartographic, ethnic geographical and ethnographic investigations in combination require thorough field work on the level of settlements. An outstanding representative of these studies is Róbert KEMÉNYFI (1994, 1998, with a special reference to his works in Bihar and Gömör). The Geographical Research Institute of the Hungarian Academy of Sciences (MTA FKI) is considered the successor of the geographical studies and stock of maps of the Institute of Political Sciences. Ethnic mapping resumed in the mid-1980s gained a strong impetus in the second half of the 1990s with the publication of the series of ethnic maps comprising the Carpathian Basin: 1. Transylvania, 2. Slovakia, 3. Transcarpathia, 4. Pannonian-Croatia, 5. Vojvodina, 6. Transmura Region, 7. Burgenland (see KOCSIS, 1997, 2000, 2001, 2002, 2004, 2005a, b). On the front page as a rule, ethnic information of the latest censuses (1991–2001) and of the 1941 census is visualised on maps of 1 : 300 000 to 1 : 400 000 scales, using pie-charts. On the reverse, ethnic dynamics between the 15th and 20th centuries shown by choropleth maps, derived from information on settlement level, and extensive memoirs and tables (in English and Hungarian) can be found. This map series were modelled in the 2000s by other authors in mapping ethnic data of the latest censuses: Slovakian settlements and Romanian urban centres and communes were shown also on pie-charts, with background colouring representing the proportion of the different ethnic groups (SEBŐK – GYURGYÍK, 2003; SEBŐK – KISS 2004).
Figure 4. A detail of the map of Kocsis–Kicošev (2004)
Conclusion
Hungarian ethnic cartography in the Carpathian Basin goes back at least two hundred years: mapping was conducted with changing intensity and for various purposes. In the „peace periods” this kind of cartographic activities generally served state administration and public information whereas during the world wars and peace treaty negotiations they were purposed for saving territorial integrity of the historical Hungarian Kingdom or at least part of the Hungarian ethnic area, through peaceful territorial revision. As a result, a high amount of ethnic maps was published in the periods 1918–1920 and 1939–1945. Subsequently, in the Communist countries – to avoid the emergence of any conflict in the Eastern bloc – ethnic mapping had been stopped for several decades. Since 1989, however, with an explosion of ethnic hostilities similar activities gained a new momentum in this part of Europe to serve fundamental research and to provide reliable information for the domestic and international public opinion.

KOCSIS – TÁTRAI: CONTRIBUTIONS TO THE HISTORY OF THE HUNGARIAN ETHNIC MAPPING
256
References
Anyanyelv 1920 és 1960 (1 : 2 000 000). Magyarország Nemzeti Atlasza, Bp. 1967 p. 41.BALOGH P. (1902): Magyarország fajnépei a vármegyék járásaiban (ca. 1 : 1 000 000). In: Balogh P. Népfajok Magyarországon, I. térképmelléklet, Budapest.BÁTKY ZS. (1908): Magyarország néprajzi térképe (1 : 1 600 000), Budapest.BÁTKY ZS. – KOGUTOWICZ K. (1918/1919): Magyarország néprajzi térképe település és lélekszám szerint (1 : 200 000 és 1 : 300 000). Magyar Földrajzi Intézet, Bp.BÁTKY ZS. – KOGUTOWICZ K. – TELEKI P. (1940): Magyarország néprajzi térképe(1 : 500 000). Államtudományi Intézet, Budapest.CHOLNOKY J. (1906): Magyarország néprajzi térképe (1 : 1 900 000), Budapest.CSAPLOVICS J. (1829): Ethnographische Karte des Königreichs Ungern… In: Csaplovics J.: Gemälde von Ungarn. Harleben, Pest.A czigányok létszáma az összes népességben (1 : 2 000 000). In: A Magyarországban 1893. január 31-én végrehajtott czigányösszeírás eredményei. Magyar Stat. Közlemények I., 1895.DÖRRE J. – LUX E. (1920): Magyarország néprajzi térképe (1 : 900 000), Budapest.FODOR F. (1942): Az elnemsodort falu. Athenaeum, Budapest. 257 p.GYÖRFFY I. (1913): A Fekete-Körös völgyi magyarság. Földr. Közlemények 41. pp. 451-552.GYÖRFFY I. (1915): Dél-Bihar népesedési és nemzetiségi viszonyai negyedfélszáz év óta. Földrajzi Közlemények 43. 6-7. pp. 257-293.GYÖRFFY Is. (192..): Carte ethnographique des Pays Danubiens (1 : 2 000 000), Bp.HÁTSEK I. (1871): A nemzetiségek (1 : 3.456.000). In: Keleti K.: Hazánk népe a közgazdaság és társadalmi statistika szempontjából. Athenaeum, Pest.JAKABFFY I. et al. (1942): Közép-Európa néprajzi térképe (1 : 1 000 000), Budapest.JAKABFFY I. (1994): Magyarázat Közép-Európa nemzetiségi térképéhez 1942. Teleki László Alapítvány Könyvtára, Budapest. 109 p.KELETI K. (1871): Hazánk népe a közgazdaság és társadalmi statistika szempontjából, PestKEMÉNYFI R. (1994): Etno-kulturgeográfiai vizsgálatok két magyar-román faluban. Folklór és etnográfia 84., KLTE, Debrecen. 165 p.KEMÉNYFI R. (1998): A történeti Gömör és Kis-Hont vármegye etnikai rajza, KLTE, DebrecenKNIEZSA I. (1938): Magyarország népei a XI. században. Athenaeum. Bp. 172 p.KOCSIS K. (1989a): Vegyes etnikumú területek társadalmának népességföldrajzi kutatása Szlovákia és a Vajdaság példáján. Studia Geographica 6., KLTE, Debrecen. 147 p.KOCSIS K. (1989b): A cigányság, 1984-87 (1 : 1 500 000). In: Magyarország Nemzeti Atlasza, Budapest. pp. 114, 115.KOCSIS K. (1990a): Erdély anyanyelvi térképe 1986 (1 : 700 000). Héttorony Kiadó, Bp.KOCSIS K. (1990b): Sprachenverteilung in Siebenbürgen (1 : 400 000). Atlas Ost- und Südosteuropa 2.2 - R3, Österreichisches Ost- und Südosteuropa Institut, Wien.KOCSIS K. (1994): Magyarország és szomszédsága etnikai térképe (1 : 2 000 000). Magyarország Nemzeti Atlasza Kiegészítő lapjai 1. füzet, Budapest.KOCSIS K. (1997): Erdély etnikai térképe – Ethnic Map of Transylvania 1992 (1 : 400 000). MTA FKI, Budapest.KOCSIS K. (2000): Szlovákia mai területének etnikai térképe – Ethnic Map of the Present Territory of Slovakia 1991 (1 : 400 000). MTA FKI, Budapest.KOCSIS K. (2001): Kárpátalja mai területének etnikai térképe – Ethnic Map of Present Territory of Transcarpathia (Subcarpathia) 1941, 1999 (1 : 266.000). MTA FKI, Budapest.KOCSIS K. – BOGNÁR A. (2002): Horvátország pannon területének etnikai térképe – Ethnic Map of Pannonian Territory of Croatia 1941, 1991, 2001 (1 : 400 000). MTA FKI – MTA KKI, Bp.KOCSIS K. – KICOŠEV, S. (2004): A Vajdaság mai területének etnikai térképe – Ethnic Map of Present Territory of Vojvodina 1941, 2002 (1 : 350 000). MTA FKI – MTA KKI, Budapest.

KOCSIS – TÁTRAI: CONTRIBUTIONS TO THE HISTORY OF THE HUNGARIAN ETHNIC MAPPING
257
KOCSIS K. (2005a): A Muravidék mai területének etnikai térképe – Ethnic Map of Present Territory of Prekmurje 1880-2002 (1 : 200 000). MTA FKI, Budapest.KOCSIS K. (2005b): Az Őrvidék mai területének etnikai térképe – Etnische Karte des heutigen Gebiets von Burgenland – Ethnic Map of Present Territory of Burgenland 1910, 1934, 2001 (1 : 350 000). MTA Földrajztudományi Kutató Intézet, Budapest.KOCSIS K. (szerk. 2005a): Délkelet-Európa térképekben. MTA Földrajztudományi Kutatóintézet – Kossuth Kiadó, Budapest.KOGUTOWICZ K. (1918): Magyarország 1 : 200 000 méretű néprajzi térképe. Földrajzi Közlemények 46. (1918) 7-10. p. 320-326.KOGUTOWICZ K. (1919): Magyarország néprajzi térképe az 1910. évi népszámlálás alapján. Nemzetiségi többségek, kisebbségek, népsűrűség (1 : 1 000 000). Magyar Földrajzi Intézet, Bp.KOGUTOWICZ K. (1927): Magyarország néprajzi térképe (1 : 1 000 000). Kókai L., Bp.KORABINSZKY J. (1791): Ethnographische Karte Ungarns (1 : 1 000 000). Wien.KORABINSZKY J. (1804): Atlas Regni Hungariae Portatilis. Wien.KŐRÖSY J. (1898): Pozsony, Nyitra, Bars, Hont megye magyar-tót nyelvhatára (1 : 500 000). In: Kőrösy J.: A Felvidék eltótosodása. Grill K., Budapest.LIPSZKY J. (1806): Mappa generalis regni Hungariae…, WienA magyar állam közigazgatási térképe. Az 1900. évi anyanyelvi adatokkal kiegészítve (1 : 360 000). Magyar Királyi Központi Statisztikai Hivatal, Budapest.Magyarország ethnographiai térképe (1 : 2 000 000), Budapest. 1891.A magyar-szlovák nyelvhatár vidékének és a szomszédos területeknek nemzetiségi térképe I-II (1 : 200 000). Államtudományi Intézet, Budapest. 1942.MILLEKER R. (1935): Néprajzi térkép és nemzetiségi kataszter. Földrajzi Közlemények 63. pp. 189-203.RÉTHEY F. (188...): A magyar Sz. Korona országainak ethnographiai térképe az 1880.ik évi népszámlálás adatai alapján (1 : 1 152 000)., Budapest.RÓNAI A. (1945): Atlas of Central Europe. Államtudományi Intézet, Bp-Balatonfüred, (digital faximile edition) 1993: Szent István Társulat – Püski Kiadó, Bp. 411 p.SEBŐK L. (1998): Nationality Map of East Central and Southeast Europe 1989-1992 (1 : 2 000 000). Südost-Institut (München) – Teleki László Alapítvány (Budapest).SEBŐK L. – GYURGYÍK L. (2003): Szlovákia etnikai térképe, 2001 (1 : 500 000). Lilium Aurum Könyvkiadó, Dunaszerdahely.SEBŐK L. – KISS T. (2004): Erdély nemzetiségei a 2002. évi népszámlálás végleges adatai alapján (1 : 700 000), RMDSZ, Kolozsvár.TARNÓCZI István (1940): A Trianon előtti Magyarország Romániához csatolt területének és a határmenti megyéknek néprajzi térképe (1 : 800 000). Magyar Nemzeti Szövetség, Bp.TELEKI P. (1920): Magyarország néprajzi térképe a népsűrűség alapján (1 : 1 000 000). Klösz és Fia Térképészeti Műintézet, Budapest.TELEKI P. (1937): Egy néprajzi térképről. Földrajzi Közlemények 65. 4-5. pp. 60-70.TELEKI P. – RÓNAI A. (1937): The different types of ethnic mixture of population. Bp. 30 p.