contributory factors to changing consumer …3).pdf · demographics, psychological factors and...
TRANSCRIPT

International Journal of 360 Management Review, Vol. 06, Issue 02, October 2018, ISSN: 2320-7132
28
CONTRIBUTORY FACTORS TO CHANGING CONSUMER
COMPLAINT BEHAVIOUR
Prof. Madan Lal
Professor, Department of Commerce,
Delhi School of Economics, University of Delhi, India
Heena Kashyap
Ph.D Research Scholar, Department of Commerce,
Delhi School of Economics, University of Delhi, India
_____________________________________________________________________
ABSTRACT
India is a nation where people from the different cultural, religious background have
different values, needs, wants and desires. These growing needs has lead to
technological developments all over the world. Understanding consumer behaviour is
as complex as understanding human minds having different Cognitive, Emotional and
Curiosity level etc. The study of Consumer complaint behaviour is a part Consumer
behaviour study such that there has been a shift from the wider to narrower concepts.
With the change in generation and lifestyle, it has been seen that young people have
become less patient and more aggressive. Company’s have also expanded their
horizon towards listening, addressing consumer needs and grievances.
The Paper focuses on the reasons behind complaining and non-complaining nature of
consumers and factors contributing towards it. The concerned study has been
conducted in Delhi-NCR (North) region of India through convenience sampling and
collected data has been analyzed using T-test, ANOVA and Regression test. The
focus is on few categories of Consumer electronic products like Television, Washing
machine, Refrigerator, Inverter, Dishwasher, Microwave, Air Conditioner. The results
revealed that Demographics affects the Psychological factors and further these
psychological factors affect the Customer Complaint Behaviour. However the impact
of social factors and product related factors on CCB has been very less.

International Journal of 360 Management Review, Vol. 06, Issue 02, October 2018, ISSN: 2320-7132
29
Keywords: Customer Complaint Behaviour (CCB); Customer Satisfaction; Cognitive
Dissonance; Consumer Protection.
INTRODUCTION
The Electronic Industry is one of the fastest growing and important sectors of Indian
Economy. The changing lifestyles and urban culture has inspired women to work and
become self-dependent, which has led to increase in consumption of time saving
electronic products like washing machines, Microwaves and dishwashers etc..Also,
people intend to have comfortable and luxurious life, for which they are driven
towards consumer electronic items. The Indian Electronic Industry was originated in
1960s and had many restrictions demarcating the growth and development of the
Economy. Initially the electronic sector was primarily government owned and with
the liberalization, Globalization and Privatization many private companies started
growing in Electronic Industry. Globalization has enabled International companies
like Samsung, Sony, Whirlpool, Sansui, Philips and L.G etc. to create a strong market
for the consumer electronics in India. With the increase in changing roles of Men and
Women the demand for electronic products has shown a spurious growth. There are
several factors that Influences Consumer Behaviour and CCB i.e Cultural, Social,
Demographics, Psychological factors and Marketing mix. The Consumer protection
Act was passed in 1986 by the Act of Parliament of India for the protection of
consumers in India.The law does not only protects an Individual consumer but also a
firm, HUF and a company. The study of Consumer complaint behaviour opens the
path of linkages with many other concepts and fields like Human resource
management, Digitization, Legal system etc. However, this paper is an initial step
towards understanding of roots and basics of Consumer complaint behaviour.
NEED FOR STUDY
● The studies reveal that the satisfaction level differs between male & female
consumers but the literature is insufficient to justify the reasons for the
dissimilarity. Therefore, it is imperative to study relationship between
Demographics (Gender, income, occupation, education) and consumer complaint
behavior.The literature says that the decision to complain differs at various
education/literacy level. However with the changing scenario the conditions may

International Journal of 360 Management Review, Vol. 06, Issue 02, October 2018, ISSN: 2320-7132
30
not stay the same, therefore it is crucial to investigate the relationship between
Demographics and CCB.
● In some countries, the research related to complaint behaviour of elderly
consumers have been done but no such deep study has been done in India so far.
Therefore, it is crucial to test the concept of “Learned helplessness” amongst
elderly consumers in India i.e reasons behind passivity of elderly consumers. This
paper is an initial step where it is investigated that whether there is difference
between the complaint behaviour of young and elderly people.
● The human psychology changes due to the social conditioning over the time and
thus the perception, attitude and motives related to Complaint behaviour changes.
Therefore it is necessary to study the differences in complaint behaviour and
reasons for the same.
OBJECTIVES
1. To identify and study the factors influencing Customer Complaint Behaviour
(CCB).
2. To study the relationship between Psychological factors and CCB.
3. To study the relationship between Social factors (Creating Cognitive
Dissonance) and CCB.
4. To study the relationship between Product related factors (Customer
Satisfaction) and CCB.
5. To examine the relationship between Demographics and CCB.
REVIEW OF LITERATURE
“A customer is the most important visitor on our premises. He is not depending on us.
We are depending on him. He is not an interruption on our work. He is the purpose of
it. He is not an outsider on our business. He is a part of it. We are not doing him a
favor by serving him. He is doing us a favor by giving us an opportunity to do so.”
-Mahatma Gandhi
Consumer behavior synthesizes the knowledge drawn from various disciplines-
Psychology, Social psychology, Sociology, and Anthropology etc. All the disciplines
International Journal of 360 Management Review, Vol. 06, Issue 02, October 2018, ISSN: 2320-7132
31
are interlinked in such a way that they mutually shape the behaviour of a consumer.
Many studies have been conducted on the different aspects of Consumer behaviour by
various researchers in different countries. However, we cannot study any concept in
an isolation as all the concepts of the field are interrelated and interdependent.
Therefore before understanding Consumer complaint behaviour (which is a post
purchase activity) it is important to understand the concept of consumer behaviour,
customer dissatisfaction, cognitive dissonance and related concepts. According to
Donthu and Gilliland (1996) in case of electronic items, degree of risk continuum
varies from moderate to high level, therefore consumers may have risk averse attitude
towards the electrical products. Also, consumers prefer those products which are
technologically advanced and new, therefore consumers might purchase highly
innovative products.
Consumer Satisfaction & Dissatisfaction
“Satisfaction is the guest‟s fulfilment response. It is a judgement that a product or
service feature, or the product or service itself, provided (or is providing) a
pleasurable level of consumption-related fulfilment, including levels of under- or
over-fulfilment”
Ekinci et al (2004)
The question is that how the expectations are built before purchases. The
expectations are built on various basis like through family, friends, culture, religion,
own opinions, beliefs and marketers efforts etc. The expectations are determined by
factors such as advertising, prior experience, personal needs, word of mouth and the
image of service provider. If the performance exceeds the expectations that are built
over the time then consumer will be satisfied and if not then he/she will be
dissatisfied.
Cognitive Dissonance
Cognitive dissonance refers to any incompatibility that an individual might perceive
between two or more of his attitudes or between his behaviour and attitudes.
- Leon Festinger (1950)
Satisfaction level cannot be determined immediately as it is developed over the time
and what a consumer initially face is known as dissonance. Cognitive dissonance is
the inner tension that a consumer experiences after recognizing a purchased product’s
disadvantages

International Journal of 360 Management Review, Vol. 06, Issue 02, October 2018, ISSN: 2320-7132
32
Consumer Complaint Behaviour
Tax, Brown and Chandrashekaran (1998) focused on the reaction time of customers,
I.e., whether complaints are made instantly or after some time. He talked about the
difference between conflict and complaint where he treated former as dependent
variable and latter as independent variable. Woodside, Sheth, bennett (1977) quoted a
different reason for the complaint and said that purchase is not a necessary condition
for complaint and the reasons could be related to price of product, promotional
activities and delivery etc. Haefner and Leckenby (1975) in his research reported that
98% respondents were willing to take action in any form in case of any defect in
electronic item. Consumer complaint behaviour is also known as consumer complaint
responses (Singh & Widing, 1991). Singh (1988) has divided the complaining
behaviour in three heads:- Voice responses (complaint to seller), Private responses
(word of mouth communication) and Third party responses (legal action). Broad
bridge and Marshall (1995) has compiled different forms of complaining action like:-
No action, Private action(WOM or not using the product of that brand) and seeking
legal help. Barlow and Moller (1996:43) has also presented similar kinds of
complainers i.e. Voicers( reporting to seller), Passives(silently switches to other
brands or seller), Irates (Negative WOM). Heung & et al, (2003, p284); Hansen,
1997, (p134) studied motivation as an Independent variable effecting the Customer
complaint behaviour and quoted two motives for complaining I.e. monetary or non-
monetary. The reasons for non-complaining were time, money, loyalty, false
perceptions related to complaining. Solomon (2008) studied relationship between
Social class and probability to seek legal action. He concluded that Consumers
belonging to higher social class perceive themselves as more capable of winning court
cases and also identified a negative relationship between Social class and Time
availability to seek legal redressal.
The Attribution Theory
It is natural that an individual will either appraise or blame for occurrence of any
event. However, blaming self or others for the occurrence of events depends on the
psychology of individual. Folkes, (1984) has contributed in explaining the
relationship between complaint behaviour and attribution of responsibility. It has
insights from Attribution theory which explains that how one person attributes his
failure on to the others. He concluded that the complaint behavior is affected by three

International Journal of 360 Management Review, Vol. 06, Issue 02, October 2018, ISSN: 2320-7132
33
considerations of customers: Stability of the problem (permanent/accidental); Locus
of responsibility; Control (seller controlled/ uncontrollable factors).
HYPOTHESIS
H01- There is no significant relationship between Perception towards complaining
and CCB.
H02- There is no significant relationship between Attitude towards complaining and
CCB.
H03- There is no significant relationship between Learning regarding complaining
and CCB.
H04- There is no significant relationship between Motivation towards complaining
and CCB.
H05- There is no significant relationship between Product related factors and CCB.
H06- There is no significant relationship between social factors and CCB.
H07- There is no significant relationship between Age and CCB.
H08- There is no significant relationship between Age and perception.
H09- There is no significant relationship between Age and Attitude.
H10- There is no significant relationship between Age and Learning.
H11- There is no significant relationship between Age and Motivation.
H12- There is no significant relationship between Age and Product related factors.
H13- There is no significant relationship between Age and social factors.
H14- There is no significant relationship between Gender and CCB.
H15- There is no significant relationship between Gender and perception.
H16- There is no significant relationship between Gender and Attitude.
H17- There is no significant relationship between Gender and Learning.
H18- There is no significant relationship between Gender and Motivation.
H19- There is no significant relationship between Gender and Product related factors.
H20- There is no significant relationship between Gender and social factors.
H21- There is no significant relationship between Education and CCB.
H22- There is no significant relationship between Education and perception.

International Journal of 360 Management Review, Vol. 06, Issue 02, October 2018, ISSN: 2320-7132
34
H23- There is no significant relationship between Education and Attitude.
H24- There is no significant relationship between Education and Learning.
H25- There is no significant relationship between Education and Motivation.
H26- There is no significant relationship between Education and Product related
factors.
H27- There is no significant relationship between Education and social factors.
H28- There is no significant relationship between Employment status and CCB.
H29- There is no significant relationship between Employment status and perception.
H30- There is no significant relationship between Employment status and Attitude.
H31- There is no significant relationship between Employment status and Learning.
H32- There is no significant relationship between Employment status and Motivation.
H33- There is no significant relationship between Employment status and Product
related factors.
H34- There is no significant relationship between Employment status and social
factors.
H35- There is no significant relationship between Income and CCB.
H36- There is no significant relationship between Income and perception.
H37- There is no significant relationship between Income and Attitude.
H38- There is no significant relationship between Income and Learning.
H39- There is no significant relationship between Income and Motivation.
H40- There is no significant relationship between Income and Product related factors.
H41- There is no significant relationship between Income and social factors.
RESEARCH METHODOLOGY
The research is descriptive in nature. The data was collected through Primary source
i.e Questionnaire and the conceptual understanding of theories and concepts has been
derived from Secondary data i.e. reviewing the literature.
Questionnaire: The questionnaire consists of 39 questions divided into 4 sections.
Pilot testing was done on 40 respondents before the circulation of final questionnaire.

International Journal of 360 Management Review, Vol. 06, Issue 02, October 2018, ISSN: 2320-7132
35
The first section focuses on the collection of data regarding Demographics; second
section consists of the questions relating to Customer dissatisfaction and cognitive
Dissonance; third section consists of questions relating to complaint behaviour and
customer loyalty; lastly the fourth section consists of questions focusing on non-
complaining behaviour of Consumers. The questions were closed-ended containing
multiple choices and checklists. In case of Demographics the data has been collected
regarding Age, Gender, Educational Qualification, Occupation and Income. A 7 point
likert scale has been used for statements related to Psychological factors, Social
factors, product related factors and CCB.(7– Strongly disagree, 6– Disagree, 5–
Somewhat disagree, 4 – Neither agree or disagree, 3 – Somewhat agree, 2 – Agree,
1– Strongly agree)
Sample Size:- The sample size includes the consumers of Delhi-NCR region who have
purchased Household Electronic products in past 3 years. Convenience sampling has
been used and responses are collected through questionnaire. The number of
responses received were 336, out of which only 300 were useful. The age group has
three categories:- 20-35 years; 36- 50 years; 50 years & above. The educational
qualification has three categories:- Metric pass; Graduate & Post graduate (Since the
sample for “metric pass” was not adequate, therefore only two categories have been
considered I.e. Graduate and Post Graduate. In case of employment statues there are
three categories: Student/unemployed; Employed/ Business person. For Monthly
family income there are three options:- Rs.20,000- Rs.40,000; Rs. 40,000- Rs. 80,000;
Rs. 80,000 & above.
Statistical tools applied:- The data is collected using a 7 point Likert scale, therefore
the techniques like Correlation, Regression and ANOVA etc. has been applied.
However, the Descriptive Statistics like Frequencies, Percentages and Crosstabs etc.
has been used for better understanding of data. The software used for this purpose is
SPSS. Cronbach alpha was tested for checking internal consistency and multi-
collinearity was also tested between the dependent variables.
ANALYSIS AND RESULTS
Kaiser-Meyer-Olkin test was conducted to measure the sample adequacy and it
resulted as 0.739 which means that there is enough correlation between the statements
that Principal component analysis can be applied (Table-1). Also, the Bartlett's Test of

International Journal of 360 Management Review, Vol. 06, Issue 02, October 2018, ISSN: 2320-7132
36
Sphericity was significant i.e. below 0.05. After KMO and Bartlett's Test, Factor
analysis was conducted and 6 factors were extracted and labelled as Perception,
Learning, Social, Motivation, attitude and Product related factors. To check the
internal consistency of factors, Cronbach alpha test was conducted and the value for
each was above 0.60 (Table-2). Initial Eigen values indicated that the first four factors
explained 19.03%, 14.365%, 9.99% and 8.8 % of the variance respectively. Fifth and
sixth values explained 6.21% and 5.67% of variance and cumulatively all the 6 factors
explain 64.81 % of the variance.
TABLE-1
TABLE-2
Factor-1(Perception) was loaded on 3 statements and factor loading range was 0.868-
0.927. The statements were meant to measure the perceptions that people form and
which restricts them to complain. Because of the misbehavior of the staff or
withdrawal of the service and perception that a defect cannot be completely
eliminated, the respondents do not complain.
Factor-2 (Learning) was loaded on 4 statements and factor loading range was 0.702-
0.841. The statements were meant to analyse the learning regarding legal actions and
learninng through past experiences, or through social learning.
Factor-3 (Motivation) was loaded on 2 statements and factor loading range was 0.760-
0.808. The statements measured the motive behind complaining i.e. whether
individuals prefer to seek monetary compensation or non-monetary compensation.
Factor-4 (Attitude) was loaded on 2 statements and factor loading range was 0.823-
0.857. The statements were meant to measure the negative or positive attitude towards
complaining.
Factor-5 (Product related factors) was loaded on 4 statements and factor loading range
was 0.692- 0.864. The statements were meant to measure the satisfaction level related
to product attributes and service.
Factor-6 (Social factors) was loaded on 2 statements and factor loading range was
0.742- 0.828. The statements had two perspectives, one to measure role of friends,

International Journal of 360 Management Review, Vol. 06, Issue 02, October 2018, ISSN: 2320-7132
37
family etc. and second the social class, that an individual prefers to buy another
product than to devote time in complaining.
TABLE-3
Table-3 shows that maximum variance is being explained by perception i.e 34% and
least by Attitude, Learning (17.30%, 12.30% respectively). However Motivation does
not explain variance in CCB, therefore we accept the null hypothesis H04.
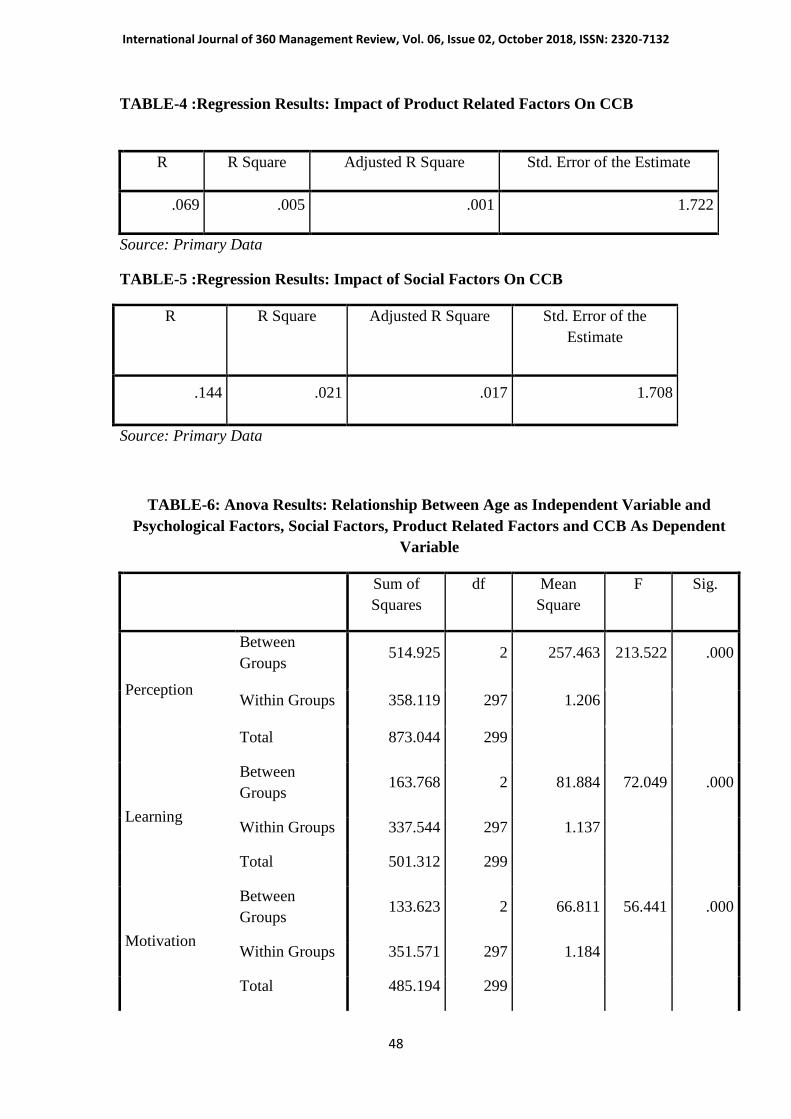
TABLE-4
TABLE-5
Table 4 and 5 shows that Social factors and product related factors do not explain
enough variance in Customer complaint Behaviour(CCB) and it can be conclude that
there is no significant relationship between Social factors and CCB; and Product
Related factors and CCB. Hence we accept the null hypothesis H05and H06.
TABLE-6
Since the significance value for all the factors is less than 0.05, therefore we reject the
null hypothesis H07, H08, H09, H10, H11, H12, H13 and conclude that Age has significant
relationship with Psychological factors, social factors, product related factors and
CCB (Table-6)
Mean score for the Age group (20-35 years) (M= 5.45, S.D= 1.00); Age group (36- 50
years) (M=4.526, S.D= 1.379); Age group (50 years & above)(M= 2.326; S.D=
.8381) for Perception.
Mean score for the Age group (20-35 years) (M= 4.587, S.D= 1.01); Age group (36-
50 years) (M=3.49, S.D= 1.17); Age group (50 years & above)(M= 2.79; S.D= 1.00
for Learning.
Mean score for the Age group (20-35 years) (M= 3.667, S.D= 1.32); Age group (36-
50 years)(M=2.15, S.D= 0.594); Age group (50 years & above)(M= 3.436; S.D=
1.19) for Motivation.

International Journal of 360 Management Review, Vol. 06, Issue 02, October 2018, ISSN: 2320-7132
38
Mean score for the Age group (20-35 years) (M= 2.475, S.D= 1.028); Age group (36-
50 years)(M=2.875, S.D= .826); Age group (50 years & above)(M= 3.575; S.D=
.826) for Attitude.
Mean score for the Age group (20-35 years) (M= 5.122, S.D= .8775); Age group (36-
50 years) (M=5.092, S.D= .839); Age group (50 years & above)(M= 4.83; S.D=
.0.918) for Product related factors.
Mean score for the Age group (20-35 years) (M= 5.54, S.D= 2.09); Age group (36- 50
years) (M=6.42, S.D= 2.57); Age group (50 years & above)(M= 5.04; S.D= 1.38) for
Social factors.
Mean score for the Age group (20-35 years) (M= 2.55, S.D= 1.14); Age group (36- 50
years) (M=3.11, S.D= .1.063); Age group (50 years & above)(M= 5.47; S.D= 1.291)
for CCB.
It can be concluded that there is significant difference in Perception, Learning,
Attitude and CCB between Age group (20-35 years) and Age group (50 years &
above). However there is significant difference in Motivation and Social factors
between Age group (20-35 years) and Age group (36- 50 years).
TABLE-7
An independent sample t-test was applied to compare the impact of Gender on
psychological factors, social factors, product related factors and CCB. Since the
significance level for all the factors except CCB in Table-7 is greater than 0.05,
therefore we accept the null hypothesis H15, H16, H17, H18, H19, H20 and reject the null
hypothesis H14. There was a significant difference in the scores for male(M= 3.27,
S.D= 1.633) and Female (M= 4.15, S.D= 1.702) in case of CCB. These results suggest
that males are more interested in complaining than females. There was a significant
difference in the scores for male and Female in relation to Perception, Motivation and
product related factors.

International Journal of 360 Management Review, Vol. 06, Issue 02, October 2018, ISSN: 2320-7132
39
TABLE-8
An independent sample t-test was applied to compare the impact of Education on
psychological factors, social factors, product related factors and CCB. The
significance value for factors learning, Attitude and CCB is less than 0.05 therefore
we reject the null hypothesis H21,H23, H24 and conclude that there is significant
relationship between education and learning, Attitude and CCB(Dependent variables).
There was a significant difference in the scores for Graduate(M= 4.05, S.D= 1.741)
and Post Graduate (M= 3.37, S.D= 1.640) in relation to CCB. These results suggest
that Post Graduate are more willing to complain. There was a significant difference in
the scores for Graduate(M= 2.96, S.D= 1.31) and Post Graduate (M= 4.27, S.D=
0.872) in relation to Learning which means that Graduates are more learned about
non-complaining behaviour. There was a significant difference in the scores for
Graduate(M= 3.26, S.D= 0.97) and Post Graduate (M= 2.69, S.D= 0.957) in relation
to Attitude which means that Post Graduates have more positive attitude towards
complaining. The significance value for the other factors is greater than 0.05 therefore
we accept the null hypothesis H22,H25,H26,H27 and conclude that there is no significant
relationship between education and Perception, Motivation, social factors and product
related factors (dependent variable).
TABLE-9
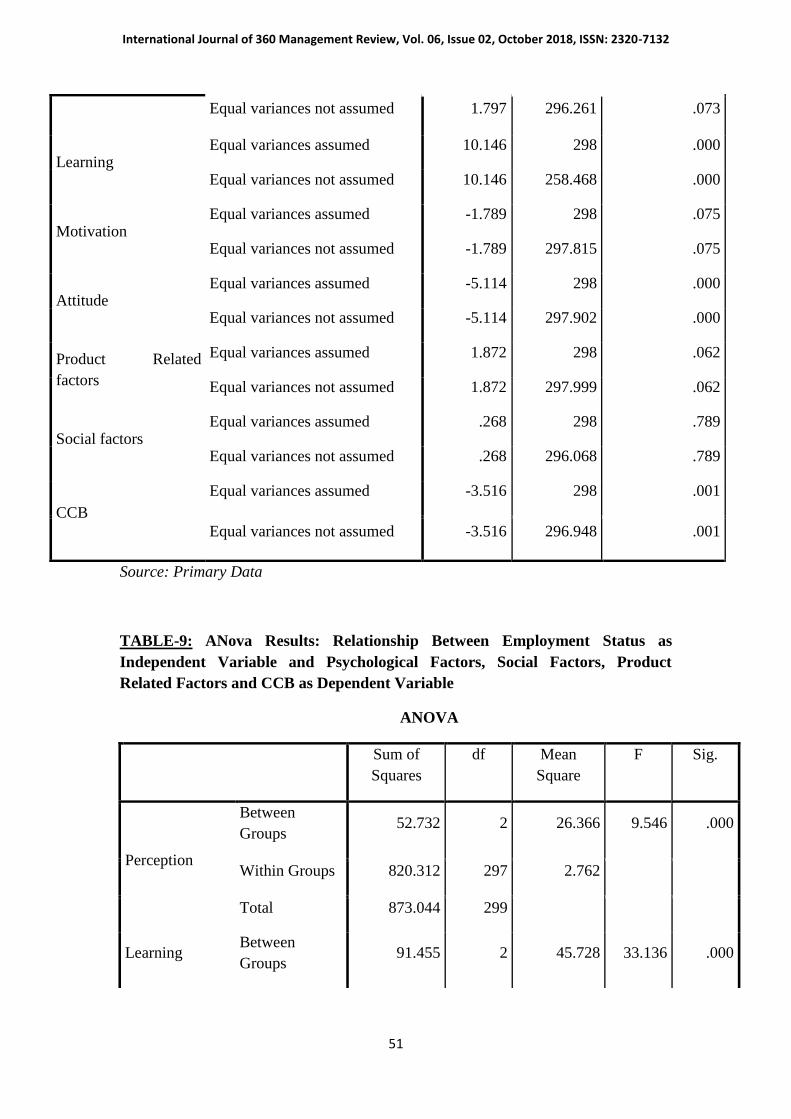
At 5% significance level it was found that Employment status has significant
relationship with Psychological factors (except motivation), product related factors
and CCB. Therefore we reject the null hypothesis H28, H29, H30, H31, H33, and accept
the null hypothesis H32,H34.
Mean score for the Employment status (Student/Unemployed) (M= 4.4367, S.D=
.580); Employment status (Employed) (M=4.356, S.D= 1.629); Employment status
(Business person)(M= 3.510; S.D= 1.77) for Perception.
Mean score for the Employment status (Student/Unemployed) (M= 4.101, S.D=
1.216); Employment status (Employed) (M=4.012, S.D= 1.169); Employment status
(Business person) (M= 2.842; S.D= .1.136) for for Learning.
International Journal of 360 Management Review, Vol. 06, Issue 02, October 2018, ISSN: 2320-7132
40
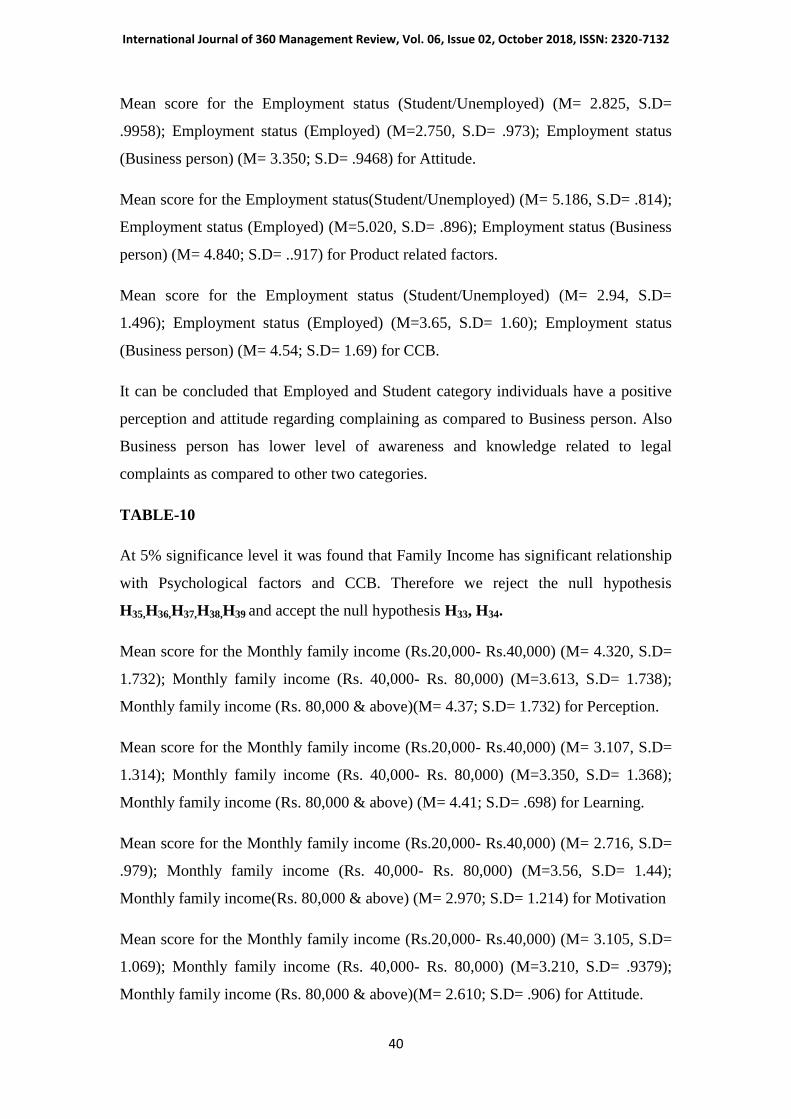
Mean score for the Employment status (Student/Unemployed) (M= 2.825, S.D=
.9958); Employment status (Employed) (M=2.750, S.D= .973); Employment status
(Business person) (M= 3.350; S.D= .9468) for Attitude.
Mean score for the Employment status(Student/Unemployed) (M= 5.186, S.D= .814);
Employment status (Employed) (M=5.020, S.D= .896); Employment status (Business
person) (M= 4.840; S.D= ..917) for Product related factors.
Mean score for the Employment status (Student/Unemployed) (M= 2.94, S.D=
1.496); Employment status (Employed) (M=3.65, S.D= 1.60); Employment status
(Business person) (M= 4.54; S.D= 1.69) for CCB.
It can be concluded that Employed and Student category individuals have a positive
perception and attitude regarding complaining as compared to Business person. Also
Business person has lower level of awareness and knowledge related to legal
complaints as compared to other two categories.
TABLE-10
At 5% significance level it was found that Family Income has significant relationship
with Psychological factors and CCB. Therefore we reject the null hypothesis
H35,H36,H37,H38,H39 and accept the null hypothesis H33, H34.
Mean score for the Monthly family income (Rs.20,000- Rs.40,000) (M= 4.320, S.D=
1.732); Monthly family income (Rs. 40,000- Rs. 80,000) (M=3.613, S.D= 1.738);
Monthly family income (Rs. 80,000 & above)(M= 4.37; S.D= 1.732) for Perception.
Mean score for the Monthly family income (Rs.20,000- Rs.40,000) (M= 3.107, S.D=
1.314); Monthly family income (Rs. 40,000- Rs. 80,000) (M=3.350, S.D= 1.368);
Monthly family income (Rs. 80,000 & above) (M= 4.41; S.D= .698) for Learning.
Mean score for the Monthly family income (Rs.20,000- Rs.40,000) (M= 2.716, S.D=
.979); Monthly family income (Rs. 40,000- Rs. 80,000) (M=3.56, S.D= 1.44);
Monthly family income(Rs. 80,000 & above) (M= 2.970; S.D= 1.214) for Motivation
Mean score for the Monthly family income (Rs.20,000- Rs.40,000) (M= 3.105, S.D=
1.069); Monthly family income (Rs. 40,000- Rs. 80,000) (M=3.210, S.D= .9379);
Monthly family income (Rs. 80,000 & above)(M= 2.610; S.D= .906) for Attitude.
International Journal of 360 Management Review, Vol. 06, Issue 02, October 2018, ISSN: 2320-7132
41
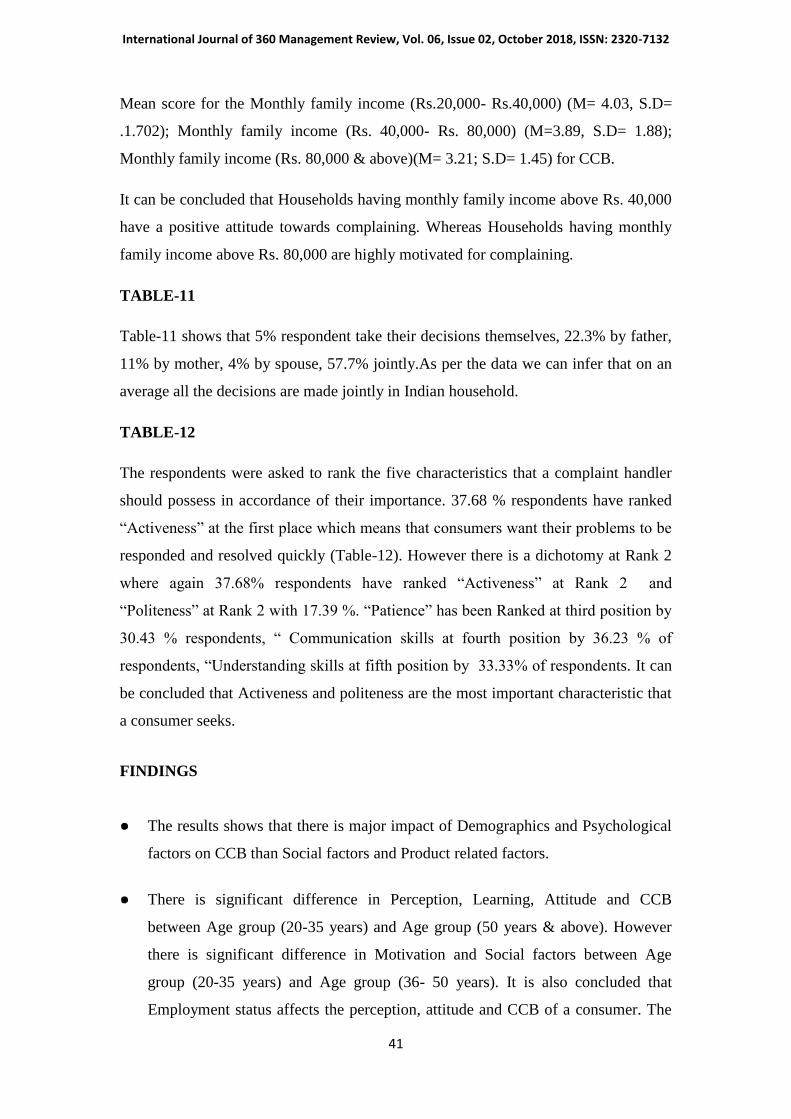
Mean score for the Monthly family income (Rs.20,000- Rs.40,000) (M= 4.03, S.D=
.1.702); Monthly family income (Rs. 40,000- Rs. 80,000) (M=3.89, S.D= 1.88);
Monthly family income (Rs. 80,000 & above)(M= 3.21; S.D= 1.45) for CCB.
It can be concluded that Households having monthly family income above Rs. 40,000
have a positive attitude towards complaining. Whereas Households having monthly
family income above Rs. 80,000 are highly motivated for complaining.
TABLE-11
Table-11 shows that 5% respondent take their decisions themselves, 22.3% by father,
11% by mother, 4% by spouse, 57.7% jointly.As per the data we can infer that on an
average all the decisions are made jointly in Indian household.
TABLE-12
The respondents were asked to rank the five characteristics that a complaint handler
should possess in accordance of their importance. 37.68 % respondents have ranked
“Activeness” at the first place which means that consumers want their problems to be
responded and resolved quickly (Table-12). However there is a dichotomy at Rank 2
where again 37.68% respondents have ranked “Activeness” at Rank 2 and
“Politeness” at Rank 2 with 17.39 %. “Patience” has been Ranked at third position by
30.43 % respondents, “ Communication skills at fourth position by 36.23 % of
respondents, “Understanding skills at fifth position by 33.33% of respondents. It can
be concluded that Activeness and politeness are the most important characteristic that
a consumer seeks.
FINDINGS
● The results shows that there is major impact of Demographics and Psychological
factors on CCB than Social factors and Product related factors.
● There is significant difference in Perception, Learning, Attitude and CCB
between Age group (20-35 years) and Age group (50 years & above). However
there is significant difference in Motivation and Social factors between Age
group (20-35 years) and Age group (36- 50 years). It is also concluded that
Employment status affects the perception, attitude and CCB of a consumer. The

International Journal of 360 Management Review, Vol. 06, Issue 02, October 2018, ISSN: 2320-7132
42
results revealed that Educational Qualification has impact over the conditioning
of an individual i.e. the Learning, attitude and CCB etc. It was found that males
are more interested in complaining than females. Motivation, Perception,
Learning, Attitude and CCB are affected by Income of a consumer.
● In case of Decision making, It can be inferred that on an average all the decisions
are made jointly (57.7%) in Indian household, may be because electronic
products are expensive and to minimise the risk level the family members take
decisions by consulting each other. Geert Hofstede , Dutch researcher introduced
5 main dimensions of culture- Power distance, Uncertainty avoidance,
Individualism, Masculinity, Long-term Orientation vs. Short-term Orientation.
Targeting the cultural dimension of Masculinity, it can be seen that the
percentage of households where father takes the decision (22.30 %) is greater
than the households where mother’s takes the decision (11%), thus depicting
Masculine dimension of India.
CONCLUSION
It can be concluded that Demographics affect the Psychological factors and
further these psychological factors affect the Customer Complaint Behaviour.
Under Psychological factors, major impact has been shown by Learning,
Perception and Attitude. However the impact of social factors and product related
factors has been very less on CCB. Our study reveals that males are more
interested in complaining than females, may be due to the difference in consumer
socialization process of both the gender. While complaining, the two most
important characteristics that a complaint handler should posses according to the
consumers are activeness and politeness. This is because, the problem creates
dissonance in such a way that consumer demands a quick response. The study
will not only help the marketers in formulating marketing strategies but also in
building a strong complaint handling mechanism.

International Journal of 360 Management Review, Vol. 06, Issue 02, October 2018, ISSN: 2320-7132
43
LIMITATIONS
No study is free from the limitations as it is not possible to cover each and every
aspect in a single research. The limitations in our study provides the opportunity for
future research directions.
● The first limitation is that our results shows lesser impact of social factors and
product related factors on CCB which as per the literature review is not correct.
Therefore study can be done using different statements and different
Demographics to study the relationship between social factors and product related
factors with CCB.
● Secondly, due to time constraint all the descriptive tests has not been applied.
There could have been more extraction from the collected data.
REFERENCES
1. Adelina Broadbridge, Julie Marshall, (1995) "Consumer complaint behaviour: the
case of electrical goods",International Journal of Retail & Distribution Management,
Vol. 23 Iss: 9, pp.8 – 18.
2. Barlow, J., & Moller, C. (1996),“A Complaint is a Gift. San Francisco”: Berrett-
Koehler Publishers.
Blodgett, J.G., Wakefield, K.L. Barnes, J.H. (1995),"The effects of customer service
on consumer complaining behaviour", Journal of Services Marketing, 9(4), pp.31 –
42.
3. Crie, D. (2003), “Consumer's complaint behaviour, taxonomy, typology and
determinants: Towards a unified ontology”. Journal of Database Marketing and
Customer Strategy Management, 11(1), 60-66.
4. Donthu, N., Gilliland, D., 1996. “The informercial shopper”. Journal of
Advertising Reearch 36 (March/April), 69-76.
5. Ekinci Y. & Sirakaya E. (2004). „An Examination of the Antecedents and
Consequences of Customer Satisfaction‟. In: Crouch G.I., Perdue R.R., Timmermans
H.J.P., & Uysal M. Consumer Psychology of Tourism, Hospitality and Leisure.
Cambridge, MA: CABI Publishing, pp. 189-202.
6. Folkes, Vs. 1984,“Consumer reactions to product failure: an attributional
approach”, Journal of Consumer Research 10:398-409.
7. Festinger, L. (1950). “Informal social communication”. Psychological Review,
57, 271-282.

International Journal of 360 Management Review, Vol. 06, Issue 02, October 2018, ISSN: 2320-7132
44
8. Haefner, J., & Leckenby, J. (1975). Consumers' Use and Awareness of Consumer
Protection Agencies. The Journal of Consumer Affairs, 9(2), 205-211
9. Heung, V.C.S. & Lam, T. (2003), “Customer complaint behaviour towards hotel
restaurant services”, International Journal of Contemporary Hospitality Management,
15(5), 283-89.
10. Hofstede, G. (1980). “Cutural Consequences”. Beverly Hills, CA: Sage.
11. Mary C. LaForge, Louis H. Stone, (1989) "An analysis of the industrial buying
process by means of buying center communications", Journal of Business & Industrial
Marketing, Vol. 4 Iss: 1, pp.29 – 36.
12. McAlister, Dt& Erffmeyer, Rc. 2003,“A content analysis of outcomes and
responsibilities for consumer complaints to third-party organizations”, Journal of
Business Research 56:341-351.
13. Michael E. Porter, (1985) "Technology and competitive advantage", Journal of
Business Strategy, Vol. 5 Issue: 3, pp.60-78.
14. Richins, M.L. (1982), 'An investigation of consumers' attitudes toward
complaining', Advances in consumer research, 9, pp. 502-506.
Schiffman LG, Kanuk LL (2009), „Consumer behavior‟, LTC press, Rio de Janeiro,
Brazil. P.469
15. Singh, J. & Widing, R. E. (1991), “What Occurs Once Consumers Complain? A
Theoretical Model for Understanding Satisfaction/Dissatisfaction Outcomes of
Complaint Responses”, European Journal of Marketing, Vol 25(5), pp. 30-46.
16. Singh, J. (1988). “Consumer Complaint Intentions and Behavior: Definitional and
Taxonomical Issues”. Journal of Marketing, 52(1), 93-107
17. Solomon, M. R., Polegato, R., & Zaichkowsky, J. L. (2008). Consumer
behaviour: Buying, having, and being. Toronto: Pearson Prentice Hall.
18. Tax, S. S., Brown, S. W., & Chandrashekaran, M. (1998) “Customer evaluations
of service complaint experiences: Implications for relationship marketing”. Journal of
Marketing, Vol. 62,(April), pp. 60-76
19. Woodside, A. G., Sheth, J. N., & Bennett, P. D. (1977). Consumer and industrial
buying behavior. New York: North-Holland.

International Journal of 360 Management Review, Vol. 06, Issue 02, October 2018, ISSN: 2320-7132
45
LIST OF TABLES
TABLE NO. DESCRIPTION
Table-1 KMO and Bartlett's Test
Table-2 Factors affecting Customer Complaint Behaviour
Table-3 Regression Results: Impact Of Psychological Factors On CCB
Table-4 Regression Results: Impact of Product Related Factors On CCB
Table-5 Regression Results: Impact of Social Factors On CCB
Table-6 Anova Results: Relationship Between Age as Independent Variable
and Psychological Factors, Social Factors, Product Related Factors
and CCB As Dependent Variable
Table-7 T-Test Results: Relationship Between Gender as Independent
Variable and Psychological Factors, Social Factors, Product Related
Factors And CCB as Dependent Variable
Table-8 T-Test Results: Relationship Between Education as Independent
Variable and Psychological Factors, Social Factors, Product Related
Factors and CCB as Dependent Variable
Table-9 Anova Results: Relationship Between Employment Status as
Independent Variable and Psychological Factors, Social Factors,
Product Related Factors and CCB as Dependent Variable
Table-10 Anova Results: Relationship Between Monthly Family Income as
Independent Variable and Psychological Factors, Social Factors,
Product Related Factors and CCB As Dependent Variable
Table-11 Final Decision Maker
Table-12 Characteristics of Complaint Handler

International Journal of 360 Management Review, Vol. 06, Issue 02, October 2018, ISSN: 2320-7132
46
Table-1: KMO and Bartlett's Test
Kaiser-Meyer-Olkin Measure of Sampling Adequacy. .739
Bartlett's Test of Sphericity
Approx. Chi-Square 2361.652
df 210
Sig. .000
Source: Primary Data
TABLE-2: Factors affecting Customer Complaint Behaviour
Factor 1: Perception (Alpha Coefficient) 0.905
I am Worried about misbehaviour from the staff if will complain .927
I feel complaining is not a solution, a product with a defect can never be repaired. .903
I am Worried that service would be withdrawn if I complained .868
Factor 2:Learning (Alpha Coefficient) 0.808
I have no knowledge regarding filing a court case .841
I am afraid that Company's are more powerful and may misuse power to win the
legal case .837
I feel that court cases take years and years to give judgement so need to complain .749
Warranty period has expired and I feel company will not entertain such products .702
Factor 3:Motivation (Alpha Coefficient) 0.733
To express emotions or Anger .808
It is necessary to ask for change or return, if the product or service to the company .760
To seek Monetary Compensation .803
Factor-4: Attitude (Alpha Coefficient) 0.748
Complaining about unsatisfactory product is my Duty .857
I don't feel embarrassing in complaining .823

International Journal of 360 Management Review, Vol. 06, Issue 02, October 2018, ISSN: 2320-7132
47
Factor 5: Product related factors (Alpha Coefficient) 0.822
Overall product performance was satisfactory .864
Product matches with the one shown in advertisement .775
Product installation was easy .754
Product price was reasonable .725
Product delivery was fast .692
Factor 6: Social factors (Alpha Coefficient:) 0.60
My friends, family etc. told me that there is no use of complaining .828
I can afford to buy a new product rather than indulging in complaint process .748
Source: Primary Data
TABLE-3 :Regression Results: Impact Of Psychological Factors On CCB
Factors R R
Square
Adjusted R
Square
Std. Error of
the Estimate
Mean
Square
(Regressio
n)
F Sig.
Perception .587 .344 .342 1.398 94.947 55.138 .000
Attitude .420 .176 .173 1.567 156.359 63.706 .000
Motivation .015 .000 .003 1.726 .207 .069 .792
Learning .355 .126 .123 1.614 111.591 42.843 .000
Source: Primary Data
International Journal of 360 Management Review, Vol. 06, Issue 02, October 2018, ISSN: 2320-7132
48
TABLE-4 :Regression Results: Impact of Product Related Factors On CCB
R R Square Adjusted R Square Std. Error of the Estimate
.069 .005 .001 1.722
Source: Primary Data
TABLE-5 :Regression Results: Impact of Social Factors On CCB
R R Square Adjusted R Square Std. Error of the
Estimate
.144 .021 .017 1.708
Source: Primary Data
TABLE-6: Anova Results: Relationship Between Age as Independent Variable and
Psychological Factors, Social Factors, Product Related Factors and CCB As Dependent
Variable
Sum of
Squares
df Mean
Square
F Sig.
Perception
Between
Groups 514.925 2 257.463 213.522 .000
Within Groups 358.119 297 1.206
Total 873.044 299
Learning
Between
Groups 163.768 2 81.884 72.049 .000
Within Groups 337.544 297 1.137
Total 501.312 299
Motivation
Between
Groups 133.623 2 66.811 56.441 .000
Within Groups 351.571 297 1.184
Total 485.194 299

International Journal of 360 Management Review, Vol. 06, Issue 02, October 2018, ISSN: 2320-7132
49
Attitude
Between
Groups 62.000 2 31.000 38.353 .000
Within Groups 240.063 297 .808
Total 302.063 299
Product Related
Factors
Between
Groups 5.087 2 2.543 3.292 .039
Within Groups 229.443 297 .773
Total 234.529 299
Social factors
Between
Groups 97.627 2 48.813 11.317 .000
Within Groups 1281.040 297 4.313
Total 1378.667 299
CCB
Between
Groups 480.320 2 240.160 175.058 .000
Within Groups 407.450 297 1.372
Total 887.770 299
Source: Primary Data
TABLE-7: T-Test Results: Relationship Between Gender as Independent
Variable and Psychological Factors, Social Factors, Product Related Factors
And CCB as Dependent Variable
t df Sig. (2-tailed)
Perception
Equal variances assumed 1.319 298 .188
Equal variances not
assumed 1.319 297.369 .188
Learning Equal variances assumed 1.227 298 .221

International Journal of 360 Management Review, Vol. 06, Issue 02, October 2018, ISSN: 2320-7132
50
Source: Primary Data
TABLE-8: T-Test Results: Relationship Between Education as Independent
Variable and Psychological Factors, Social Factors, Product Related Factors and
CCB as Dependent Variae
Equal variances not
assumed 1.227 297.653 .221
Motivation
Equal variances assumed 1.179 298 .239
Equal variances not
assumed 1.179 282.199 .239
Attitude
Equal variances assumed -.315 298 .753
Equal variances not
assumed -.315 297.675 .753
Product Related factors
Equal variances assumed 1.082 298 .280
Equal variances not
assumed 1.082 297.927 .280
Social factors
Equal variances assumed -.483 298 .629
Equal variances not
assumed -.483 294.322 .629
CCB
Equal variances assumed -4.604 298 .000
Equal variances not
assumed -4.604 297.495 .000
t df Sig. (2-tailed)
Perception Equal variances assumed 1.797 298 .073
International Journal of 360 Management Review, Vol. 06, Issue 02, October 2018, ISSN: 2320-7132
51
Source: Primary Data
TABLE-9: ANova Results: Relationship Between Employment Status as
Independent Variable and Psychological Factors, Social Factors, Product
Related Factors and CCB as Dependent Variable
ANOVA
Sum of
Squares
df Mean
Square
F Sig.
Perception
Between
Groups 52.732 2 26.366 9.546 .000
Within Groups 820.312 297 2.762
Total 873.044 299
Learning Between
Groups 91.455 2 45.728 33.136 .000
Equal variances not assumed 1.797 296.261 .073
Learning Equal variances assumed 10.146 298 .000
Equal variances not assumed 10.146 258.468 .000
Motivation Equal variances assumed -1.789 298 .075
Equal variances not assumed -1.789 297.815 .075
Attitude Equal variances assumed -5.114 298 .000
Equal variances not assumed -5.114 297.902 .000
Product Related
factors
Equal variances assumed 1.872 298 .062
Equal variances not assumed 1.872 297.999 .062
Social factors Equal variances assumed .268 298 .789
Equal variances not assumed .268 296.068 .789
CCB
Equal variances assumed -3.516 298 .001
Equal variances not assumed -3.516 296.948 .001

International Journal of 360 Management Review, Vol. 06, Issue 02, October 2018, ISSN: 2320-7132
52
Within Groups 409.856 297 1.380
Total 501.312 299
Motivation
Between
Groups 3.967 2 1.984 1.224 .295
Within Groups 481.227 297 1.620
Total 485.194 299
Attitude
Between
Groups 21.375 2 10.688 11.309 .000
Within Groups 280.688 297 .945
Total 302.063 299
Product Related
factors
Between
Groups 5.989 2 2.995 3.892 .021
Within Groups 228.540 297 .769
Total 234.529 299
Social factors
Between
Groups 18.047 2 9.023 1.970 .141
Within Groups 1360.620 297 4.581
Total 1378.667 299
CCB
Between
Groups 128.540 2 64.270 25.142 .000
Within Groups 759.230 297 2.556
Total 887.770 299
Source: Primary Data

International Journal of 360 Management Review, Vol. 06, Issue 02, October 2018, ISSN: 2320-7132
53
TABLE-10: Anova Results: Relationship Between Monthly Family Income as
Independent Variable and Psychological Factors, Social Factors, Product
Related Factors and CCB As Dependent Variable
ANOVA
Sum of
Squares
df Mean
Square
F Sig.
Perception
Between
Groups 35.814 2 17.907 6.352 .002
Within Groups 837.230 297 2.819
Total 873.044 299
Learning
Between
Groups 96.358 2 48.179 35.335 .000
Within Groups 404.954 297 1.363
Total 501.312 299
Motivation
Between
Groups 38.090 2 19.045 12.651 .000
Within Groups 447.104 297 1.505
Total 485.194 299
Attitude
Between
Groups 20.535 2 10.268 10.832 .000
Within Groups 281.527 297 .948
Total 302.062 299
Product Related
factors
Between
Groups 4.648 2 2.324 3.003 .051
Within Groups 229.881 297 .774
Total 234.529 299
Social factors
Between
Groups 10.287 2 5.143 1.116 .329
Within Groups 1368.380 297 4.607
Total 1378.667 299

International Journal of 360 Management Review, Vol. 06, Issue 02, October 2018, ISSN: 2320-7132
54
CCB
Between
Groups 38.480 2 19.240 6.728 .001
Within Groups 849.290 297 2.860
Total 887.770 299
Source: Primary Data
TABLE-11: Final Decision Maker
Decision
Maker
Yourself Father Mother Spouse Jointly
Percentage 5.0 22.3 11.0 4.0 57.7
Source: Primary Data
TABLE-12: Characteristics of Complaint Handler
RANK 1 RANK 2 RANK 3 RANK 4 RANK 5
Politeness 33.33% 17.39% 15.94% 20.29% 13.04%
Activeness 37.68% 33.33% 11.59% 5.80% 11.59%
Patience 15.94% 15.94% 30.43% 20.29% 17.39%
Communication
Skills 14.49% 14.49% 17.39% 36.23% 17.39%
Understanding 26.09% 13.04% 17.39% 10.14% 33.33%
Source: Primary Data