control and strategy for reduction of pollutants from ... · control and strategy for reduction of...
TRANSCRIPT
Jongchoon KimJongchoon Kim
Control and Strategy for Reduction of Pollutantsfrom Automobiles for Low-Carbon Green Growth
in Korea
25 February, 2009
4th Regional EST Forum in Asia

2
Policy Backgrounds and Circumstances
Policy measures to promote environment-friendly transportation
Contents
3
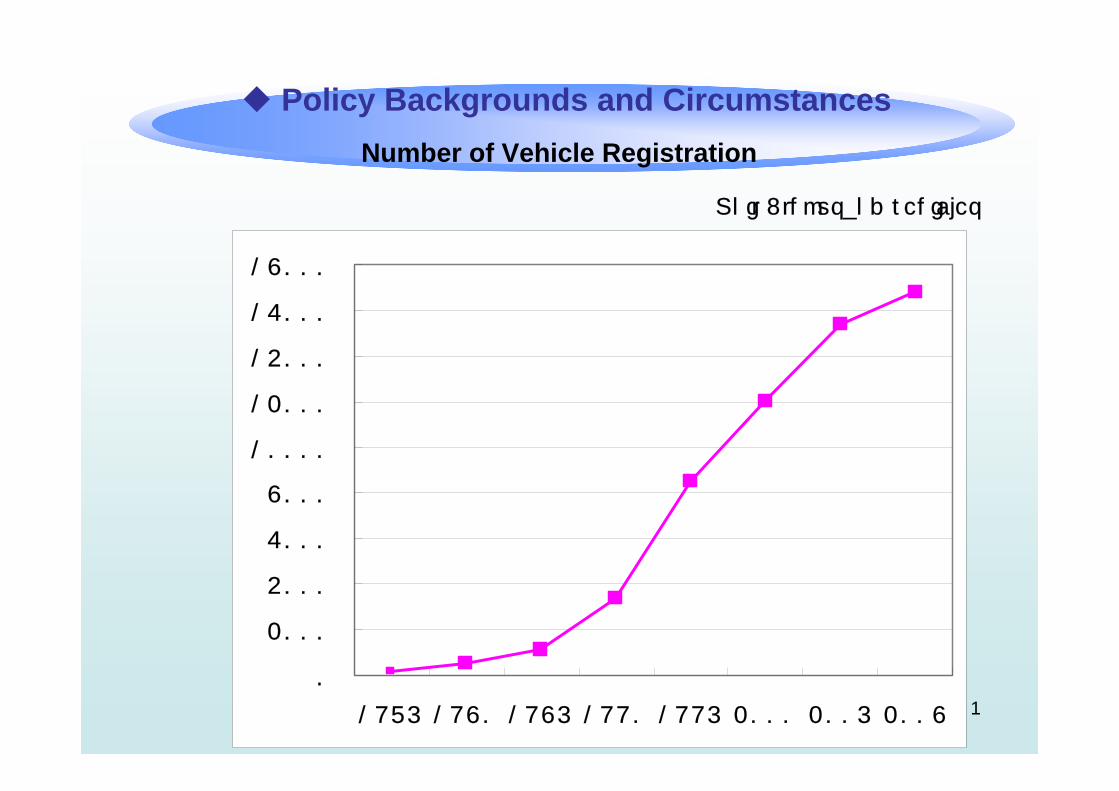
Unit : thousand vehicles
Policy Backgrounds and CircumstancesNumber of Vehicle Registration
0
2,000
4,000
6,000
8,000
10,000
12,000
14,000
16,000
18,000
1975
1977
1979
1981
1983
1985
1987
1989
1991
1993
1995
1997
1999
2001
2003
2005
2007
0
2000
4000
6000
8000
10000
12000
14000
16000
18000
1975 1980 1985 1990 1995 2000 2005 2008

4
Unit : ton/year
Air Pollutants by Source(National Statistics, 2005)
Emission Source Total % CO NOx SO2 PM10 VOC
Total 3,327,809 100 67,343 1,306,724 408,462 67,343 756,421
Energy Industry 579,343 17.4 35,889 390,895 139,064 8,229 5,326
Non-industry 238,142 7.2 79,759 93,658 58,706 2,978 3,041
Manufacturers 209,135 6.3 14,342 108,186 68,181 16,000 2,426
Manufactur Process 301,961 9.1 22,882 55,327 82,371 6,888 134,493
Energy storage 25,933 0.7 - - - - 25,933
Organic solvent use
432,828 13.0 - - - - 432,827
Mobile source 1,172,403 35.2 25,313 455,217 5,190 25,313 102,198
Non-mobile source 318,081 9.6 7,870 188,631 53,506 7,870 18.461
Waste treatment 49,983 1.5 64 14,811 1,444 64 31,716

5
Unit : ton/year
Air Pollutants by Source(Seoul City Statistics, 2005)
Emission Source Total % CO NOx SO2 PM10 VOC
Total 337,061 100 161,873 107,257 8,050 4,311 75,970
Energy Industry 2,008 0.6 580 1,062 265 14 87
Non-industry 41,827 12.4 13,228 20,744 6,614 367 874
Manufacturers 1,907 0.6 458 1,346 35 3 65
Manufactur Process 1 0.01 1 0.3 0.01 0.08
Energy storage 3,364 1.0 - - - - 3,364
Organic solvent use 45,877 13.6 - - - - 45,877
Mobile source 205,484 61.0 140,202 59,333 717 3,009 22,623
Non-mobile source 35,107 10.4 7,193 23,937 249 913 2,815
Waste treatment 1,486 0.4 212 835 169 4 266
6
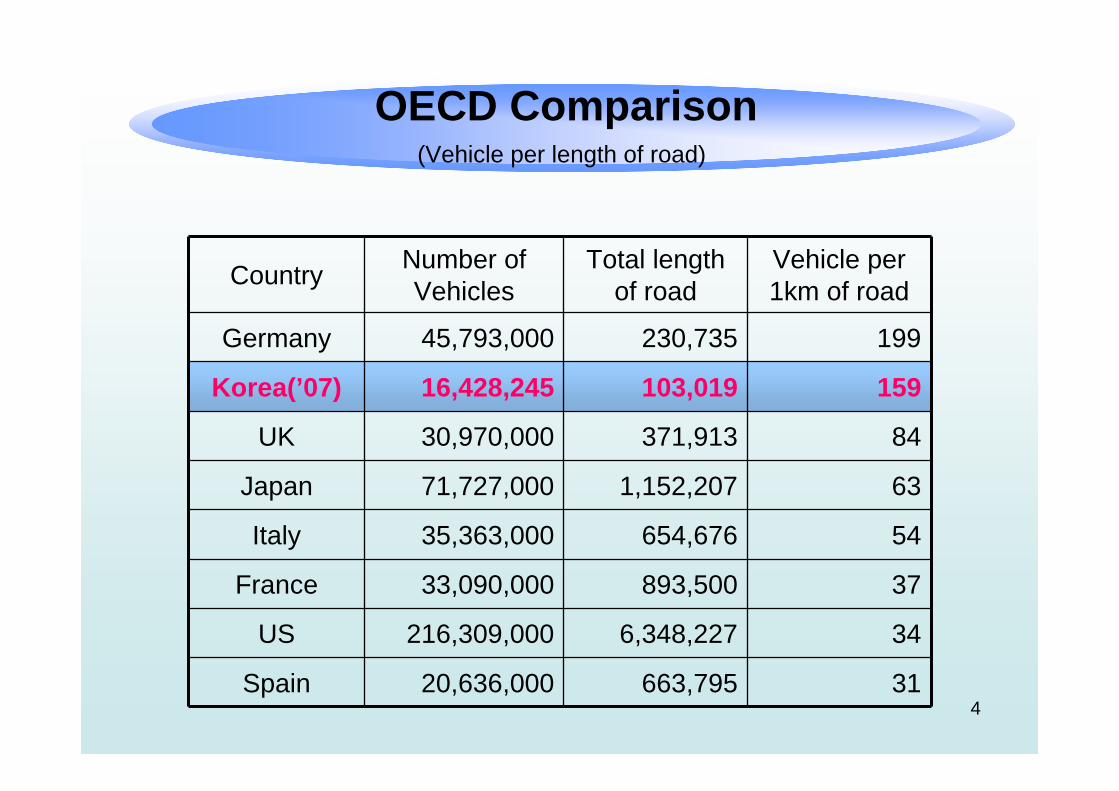
Country Number of Vehicles
Total length of road
Vehicle per 1km of road
Germany 45,793,000 230,735 199
Korea(’07) 16,428,245 103,019 159
UK 30,970,000 371,913 84
Japan 71,727,000 1,152,207 63
Italy 35,363,000 654,676 54
France 33,090,000 893,500 37
US 216,309,000 6,348,227 34
Spain 20,636,000 663,795 31
OECD Comparison(Vehicle per length of road)

7
Typenumber of users(2007)
Total users(thousand people)
%
Total 12,627,826 100.0
Railroad 989,294 7.8
Subway 2,090,290 16.6
Road 9,518,760 75.4
Ship 12,634 0.1
Air 16,848 0.1
Proportion by Transportation type

8
2002 2003 2004 2005 2006 2008
Total 13,949 14,586 14,882 15,397 15,895 16,794
Gasoline7,672
(55.0%)
7,760
(53.2)
7,703
(51.7)
7,800
(50.7)
7,916
(49.8)
8,256
(49.2)
Diesel4,607
(33.0%)
5,054
(34.6)
5,385
(36.3)
5,650
(36.7)
5,869
(36.9)
6,136
(36.5)
LPG1,625
(11.7%)
1,723
(11.8)
1,794
(12.1)
1,890
(12.3)
2,047
(12.)
2,321
(13.8)
Unit : thousand vehicles
Vehicles by Fuel Type

9
Korea France Germany UK Japan US OECD avg.
Diesel (commercial
use)0.910 0.645 0.715 0.901 0.624 0.997 0.706
Diesel (non-
commercial use)
0.910 0.771 0.829 1.058 0.813 0.997 0.865
Unleaded Gasoline 1.000
1.000 1.000 1.000 1.000 1.000 1.000
OECD Comparison(Relative Diesel Prices, 2002)
* Korea : Jan. 2009

10
Policy measures to promote environment-friendly
transportation

11
Natural Gas Vehicles (NGVs) have been introduced since 2000.
Hybrid Vehicles have been distributed to public bodies with supports from the government since 2005
Other LEV, ZEVs (electric, fuel-cell etc.) are still in development stage.
1. Low- & Zero-Emission Vehicles

12
1992 – started to develop CNG bus engines
1999 – Revised Air Quality Management Act (AQMA)
2000 – commercialized CNG buses as a replacement for old diesel-powered buses
Compressed Natural Gas (CNG) BusesCompressed Natural Gas (CNG) Buses

13
Total2000-2004
2005 2006 2007 2008
Bus 19,078 6,121 2,544 3,323 3,109 3,981
Garbage Truck
429 41 23 71 154 140
Mother Station
261 172 40 14 21 14
Unit : Vehicles
Number of CNG VehiclesNumber of CNG Vehicles
14
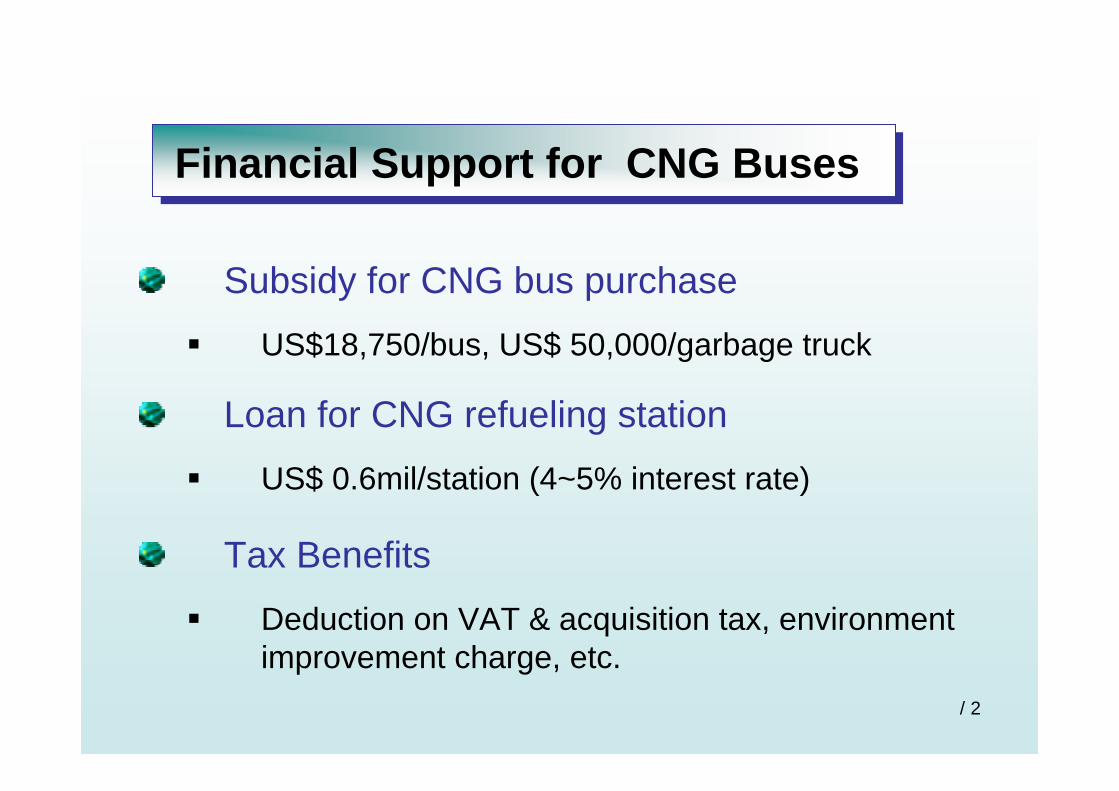
Financial Support for CNG BusesFinancial Support for CNG Buses
Subsidy for CNG bus purchase
US$18,750/bus, US$ 50,000/garbage truck
Loan for CNG refueling station
US$ 0.6mil/station (4~5% interest rate)
Tax Benefits
Deduction on VAT & acquisition tax, environment improvement charge, etc.

15
Emission standards for vehicles have been enhanced to the level of advanced countries by 2006.
< Passenger vehicles>Gasoline : LEV ULEV* (starting 2004)
Diesel : EURO-3 EURO-4 (starting 2006)1~2 years behind compared with other advanced countries
The next enhancement on emission(EURO-5, 2009.9)will take place simultaneously with EU
2. Enhancement of Emission Standards
* Gasoline : California ULEV

16
After-treatment technologies (ATT) such as DPF, DOC considered for reducing emission from diesel commercial vehicles
Special Act for Seoul Metropolitan Air Quality Improvement Measures goes into effect 2005.
- DPF : Diesel Particulate Filter- DOC : Diesel Oxidation Catalyst
The ATTs project in seeking the appropriate technology for the Korea’s environment began in 2004 and duty-bounded from 2006.
3. ATTs for Diesel Vehicle
17
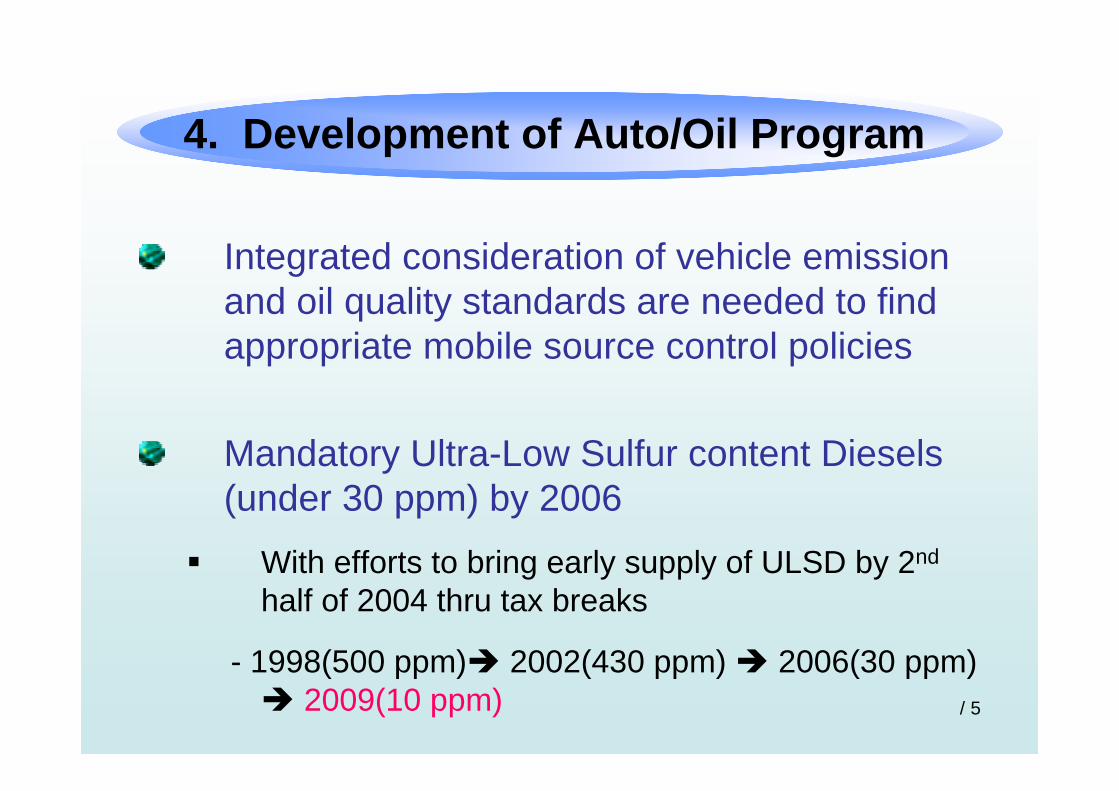
Integrated consideration of vehicle emission and oil quality standards are needed to find appropriate mobile source control policies
Mandatory Ultra-Low Sulfur content Diesels (under 30 ppm) by 2006
With efforts to bring early supply of ULSD by 2nd
half of 2004 thru tax breaks
- 1998(500 ppm) 2002(430 ppm) 2006(30 ppm) 2009(10 ppm)
4. Development of Auto/Oil Program

18
Starting July 2004, US Tier-1 level emission standard have been applied to 6 types of construction vehicles (excavators, bulldozers, forklift, loader, roller, crane)
From 2005~2007, gradually increased to Tier-2 level emission standardFrom 2009 Tire-3 level emission standard
5. Measures for Construction Machinery

19
In order to improve the accuracy of regular emission check-up, loaded smog-check program introduced2002 : Seoul2003 : Incheon, Gyeonggi-do2004 : Daegu2005 : Busan2006 : Daejeon, Gwangju, Ulsan, Youngin2008 : Cheonan, Cheongju, Jeonju, Changwon,
Pohang, Gimhea- 15% failure rate on smog-check (2005)
6. Smog-Check for Existing On-Road Vehicles

20
Establish quality standards for each kinds of automotive fuel
Gasoline : Regulations on lead, phosphorus, smokeless, benzene, etc.
Diesel : Regulations on sulfur content, cetane number
7. Enhancement of quality standards for automotive fuel

21
8. Control of Idle
Idle: Economic loss and generation of automobile emission gas
Fuel consumption expenses of 79.4 billion won and social cost of 55.8 billion won caused by automobile emission gas
Legislated regulations on unnecessary idle in terminal, garages, etc in 2002
Enacted and enforced measures banning idle in 14 municipalities and provinces

22
Emission System Recall introduced in 1992
- 1st Recall in 1995
- 2nd Recall in 2005
- 3th Recall in 2006
Promoting to introduce a reporting system on defects in components which control and reduce automobile emission gas
9. Strengthening the Recall System

23
Introduced in US (1996) and EU (2000)
- Gasoline vehicle(OBD II)
- Diesel vehicle(EOBD)
Will be gradually introduced in Korea starting in 2005Gasoline passenger cars :
- Large vol. ‘05(10%), ’06(30%), ’07(100%)
- Small vol. ‘05(10%), ’06(30%), ’07(50%), ’08(75%), ’09(100%)
Diesel passenger cars :
- ’06(new cars), ’07(all cars)
10. On-Board Diagnostics (OBD)

24
Performing establishment of environmental zone already in Stockholm and London
Restriction old- aged vehicles and encouraging low emission vehicles
11. Establishment of Environmental Zone

25
TDM(Travel Demand Management)
FAS(Fleet Average System)
EST (Environmentally Sustainable Transport)
12. Others

Thank You for AttentionThank You for Attention
URL; www.nier.go.krE-mail; [email protected]; www.nier.go.krE-mail; [email protected]