control charts for attributes 1 introduction data that can be classified into one of several...
Post on 21-Dec-2015
225 views
TRANSCRIPT
Control Charts for Attributes 1
Introduction
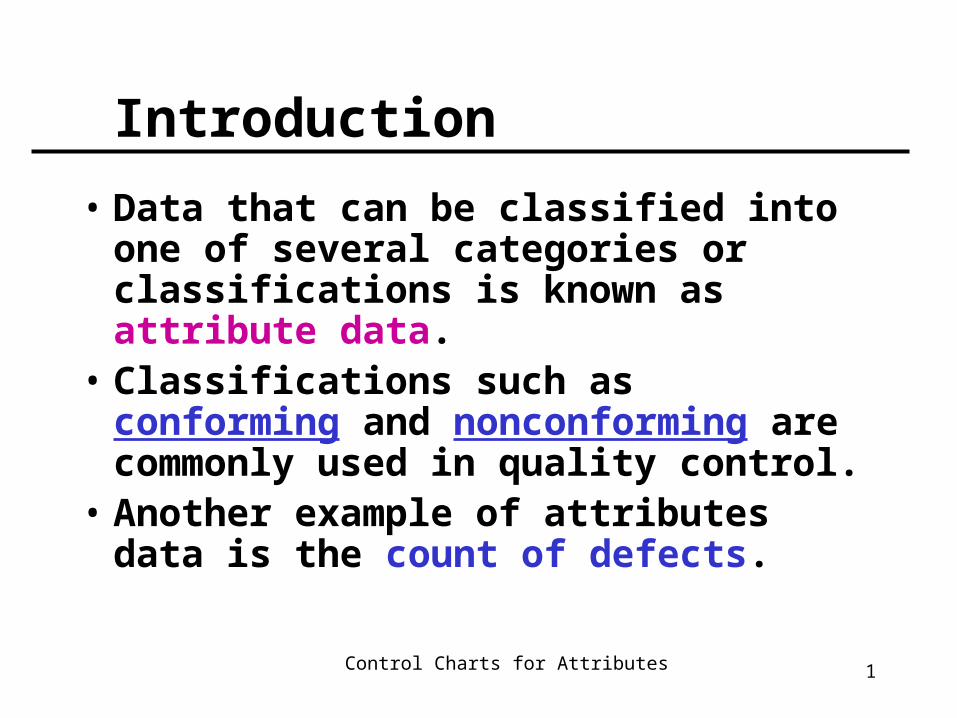
• Data that can be classified into one of several categories or classifications is known as attribute data.
• Classifications such as conforming and nonconforming are commonly used in quality control.
• Another example of attributes data is the count of defects.

Control Charts for Attributes 2
Type of Attributes Control Chart
• Control Chart for Fraction Nonconforming — p chart
• Control Chart for Nonconforming — np chart
• Control Chart for Nonconformities — c chart
• Control Chart for Nonconformities per unit — u chart
Control Charts for Attributes 3
Control Charts for Fraction Nonconforming
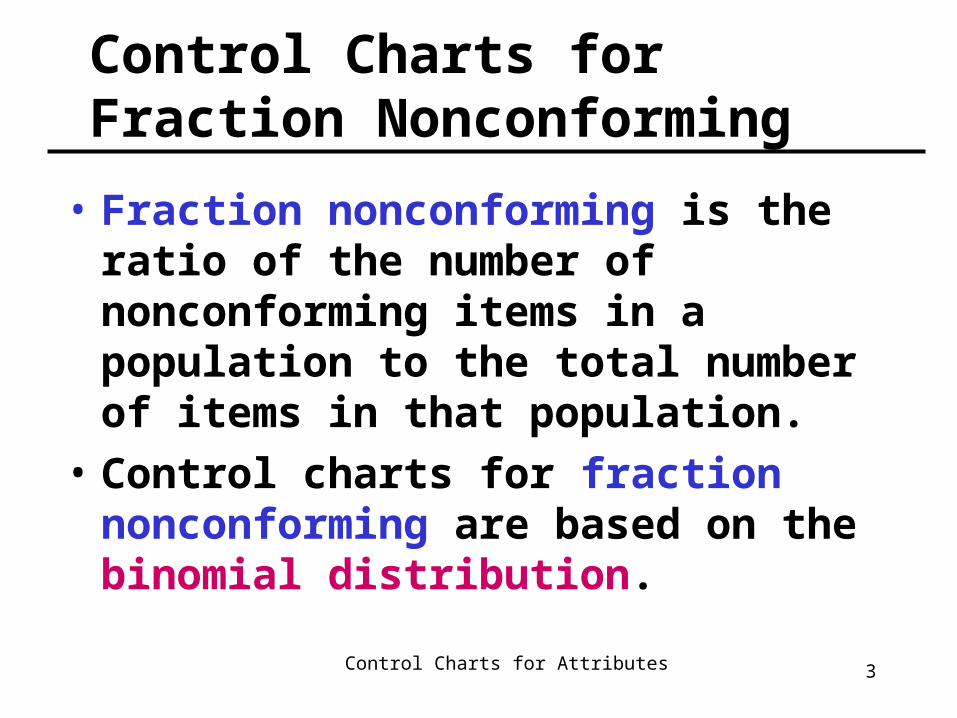
• Fraction nonconforming is the ratio of the number of nonconforming items in a population to the total number of items in that population.
• Control charts for fraction nonconforming are based on the binomial distribution.

Control Charts for Attributes 4
The characteristic of binomial distribution
1. All trials are independent.
2. Each outcome is either a “success” or “failure”.
3. The probability of success on any trial is given as p. The probability of a failure is
1-p.
4. The probability of a success is constant.

Control Charts for Attributes 5
The Binomial distribution
• The binomial distribution with parameters n 0 and 0 < p < 1, is given by
• The mean and variance of the binomial distribution are
xnx )p1(px
n)x(p
)p1(npnp 2

Control Charts for Attributes 6
Development of the Fraction Nonconforming Control Chart1
Assume • n = number of units of product selected
at random. • D = number of nonconforming units from
the sample• p= probability of selecting a
nonconforming unit from the sample.• Then: xnx )p1(p
x
n)xD(P

Control Charts for Attributes 7
Development of the Fraction Nonconforming Control Chart2
• The sample fraction nonconforming is given as
where is a random variable with mean and variance
n
Dp̂
p̂
n
)p1(pp 2
Control Charts for Attributes 8
Development of the Fraction Nonconforming Control Chart3
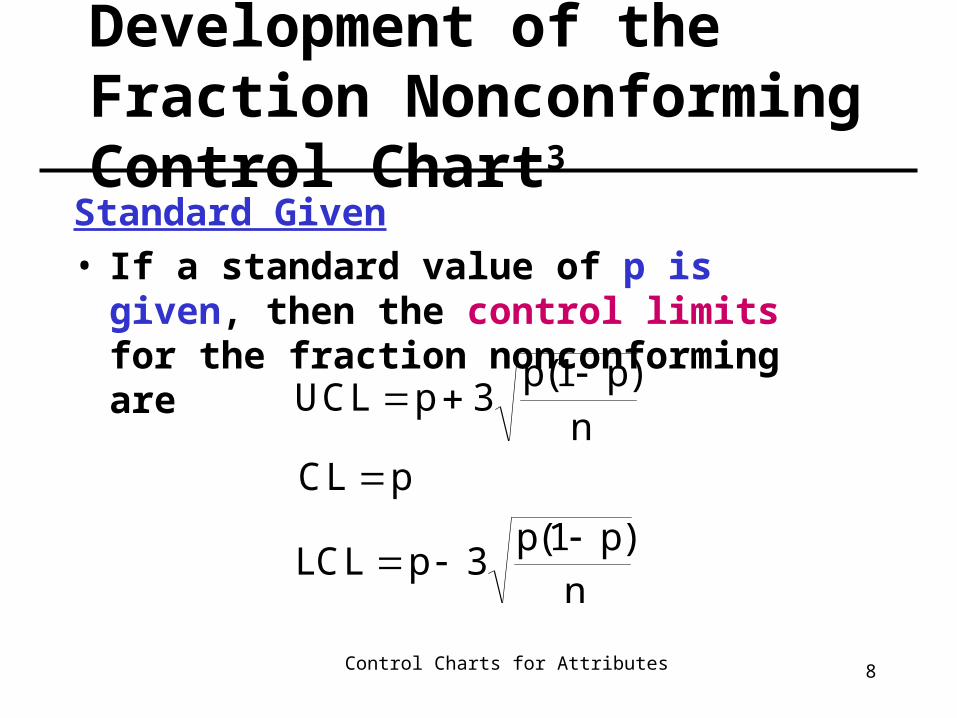
Standard Given• If a standard value of p is given, then the
control limits for the fraction nonconforming are
UCL pp p
nCL p
LCL pp p
n
31
31
( )
( )

Control Charts for Attributes 9
Development of the Fraction Nonconforming Control Chart4
No Standard Given• If no standard value of p is given, then the
control limits for the fraction nonconforming are
wheren
pppLCL
pCL n
pppUCL
)1(3
)1(3
m
p̂
mn
Dp
m
1ii
m
1ii

Control Charts for Attributes 10
Development of the Fraction Nonconforming Control Chart5
Trial Control Limits• Control limits that are based on a preliminary
set of data can often be referred to as trial control limits.
• The quality characteristic is plotted against the trial limits, if any points plot out of control, assignable causes should be investigated and points removed.
• With removal of the points, the limits are then recalculated.

Control Charts for Attributes 11
Example1
A process that produces bearing housings is investigated. Ten samples of size 100 are selected.
• Is this process operating in statistical control?
Sample # 1 2 3 4 5 6 7 8 9 10
#Nonconf 5 2 3 8 4 1 2 6 3 4
Control Charts for Attributes 12
Example2
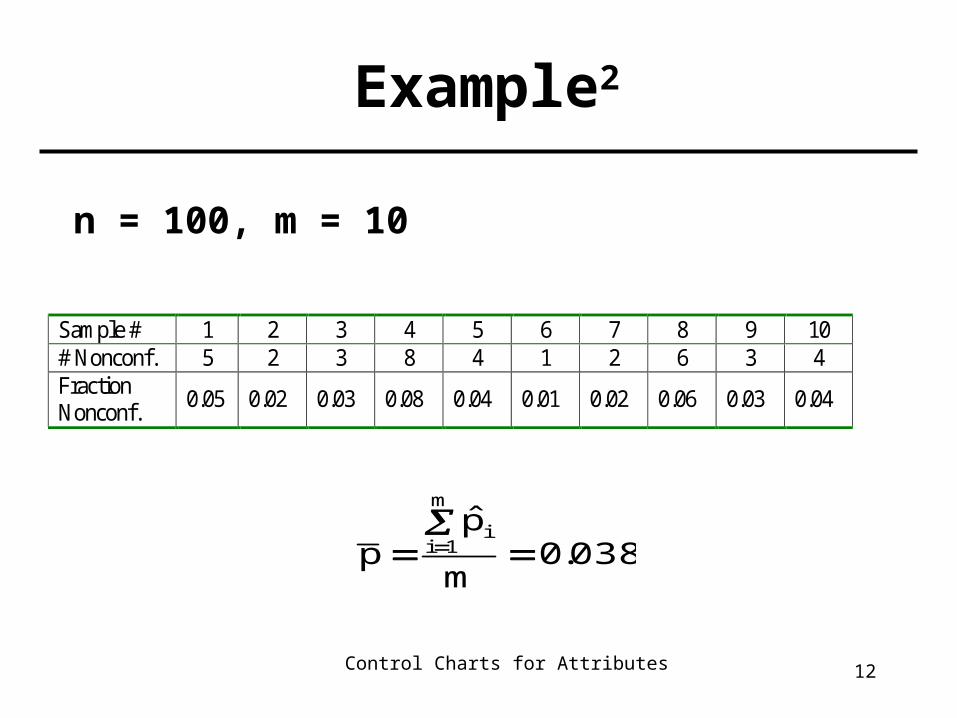
n = 100, m = 10
Sample # 1 2 3 4 5 6 7 8 9 10 # Nonconf. 5 2 3 8 4 1 2 6 3 4 Fraction Nonconf.
0.05 0.02 0.03 0.08 0.04 0.01 0.02 0.06 0.03 0.04
038.0m
p̂p
m
1ii

Control Charts for Attributes 13
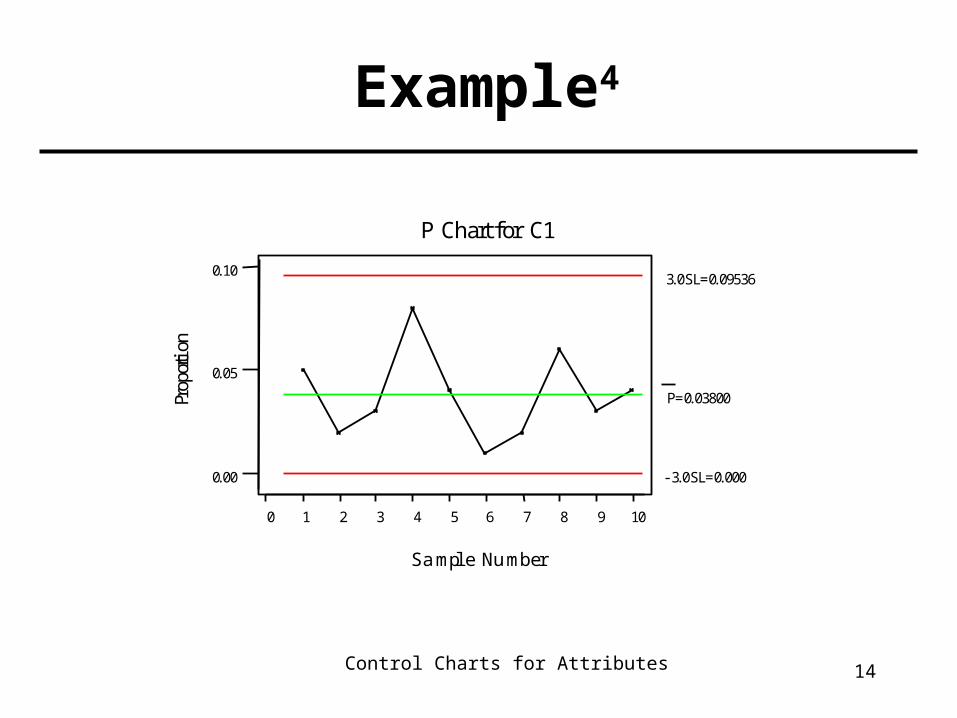
Example3
Control Limits are:
002.0100
)038.01(038.03038.0LCL
038.0CL
095.0100
)038.01(038.03038.0UCL
Control Charts for Attributes 14
Example4
Sample Number
109876543210
0.10
0.05
0.00
Prop
ortio
n
P Chart for C1
P=0.03800
3.0SL=0.09536
-3.0SL=0.000

Control Charts for Attributes 15
Design of the Fraction Nonconforming Control Chart
• Sample size
• Frequency of sampling
• Width of the control limits
Control Charts for Attributes 16
Sample size of fraction nonconforming control chart
• If p is very small, we should choose n sufficiently large so that we have a high probability of finding at least one nonconforming unit in the sample.
• Otherwise, we might find that the control limits are such that the presence of only one nonconforming unit in the sample would indicate an out-of control condition.

Control Charts for Attributes 17
Sample size of fraction nonconforming control chart1
• Choose the sample size n so that the probability of finding at least one nonconforming unit per sample is at least γ.
De
P(D 1) P D 0 1D!
Control Charts for Attributes 18
Example1
• If P=0.01, n=8, then UCL=0.1155
• If there is one nonconforming unit in the sample, then p=1/8=0.1250, and we can conclude that the process is out of control.

Control Charts for Attributes 19
Example2
Suppose we want the probability of at least one nonconforming unit in the sample to be at least 0.95.
0e
P(D 1) 0.95 P D 0 1 0.950!3
np n 300

Control Charts for Attributes 20
Sample size of fraction nonconforming control chart2
The sample size can be determined so that a shift of some specified amount, can be detected with a stated level of probability (50% chance of detection, Duncan, 1986). If is the magnitude of a process shift, then n must satisfy:
Therefore,
n
)p1(pL
)p1(pL
n2
Control Charts for Attributes 21
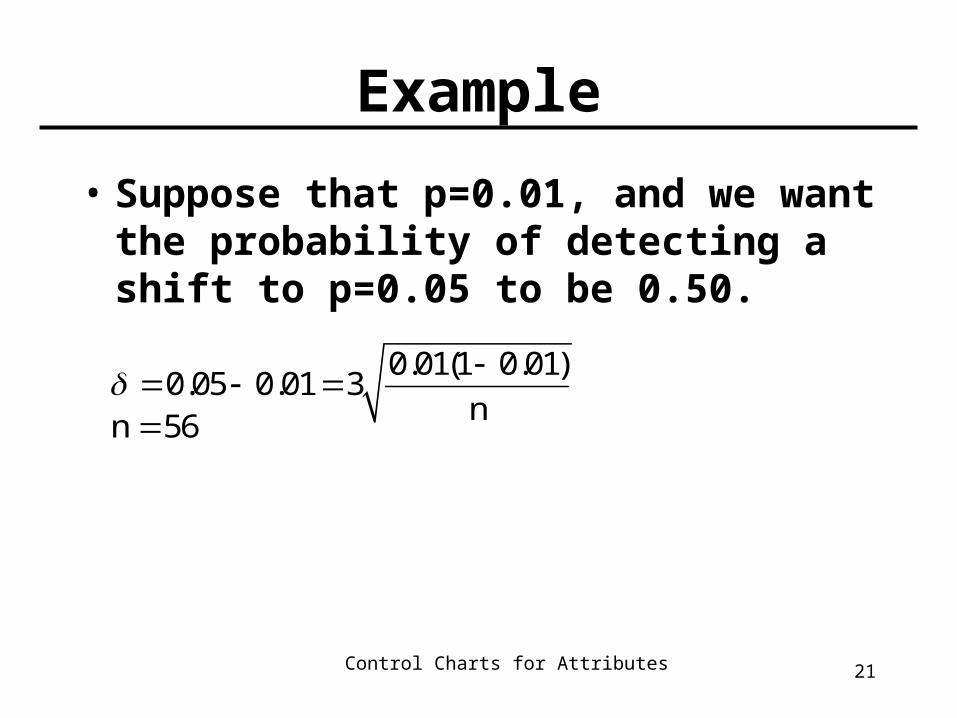
Example
• Suppose that p=0.01, and we want the probability of detecting a shift to p=0.05 to be 0.50.
0.01(1 0.01)0.05 0.01 3
nn 56

Control Charts for Attributes 22
Sample size of fraction nonconforming control chart3
Positive Lower Control Limit • The sample size n, can be chosen so that the
lower control limit would be nonzero:
and
0n
)p1(pLpLCL
2Lp
)p1(n

Control Charts for Attributes 23
Example
• If p=0.05 and three-sigma limits are used, the sample size must be
2(1 0.05)n 3 171
0.05

Control Charts for Attributes 24
Width of the control limits
• Three-sigma control limits are usually employed on the control chart for fraction nonconforming.
• Narrower control limits would make the control chart more sensitive to small shifts in p but at the expense of more frequent “false alarms.”

Control Charts for Attributes 25
Interpretation of p Chart
• Care must be exercised in interpreting points that plot below the lower control limit.– They often do not indicate a real improvement in
process quality.– They are frequently caused by errors in the
inspection process or improperly calibrated test and inspection equipment.
– Inspectors deliberately passed nonconforming units or reported fictitious data.

Control Charts for Attributes 26
The np control chart
• The actual number of nonconforming can also be charted. Let n = sample size, p = proportion of nonconforming. The control limits are:
(if a standard, p, is not given, use )p
)p1(np3npLCL
npCL
)p1(np3npUCL

Control Charts for Attributes 27
Variable Sample Size1
• In some applications of the control chart for the fraction nonconforming, the sample is a 100% inspection of the process output over some period of time.
• Since different numbers of units could be produced in each period, the control chart would then have a variable sample size.
Control Charts for Attributes 28
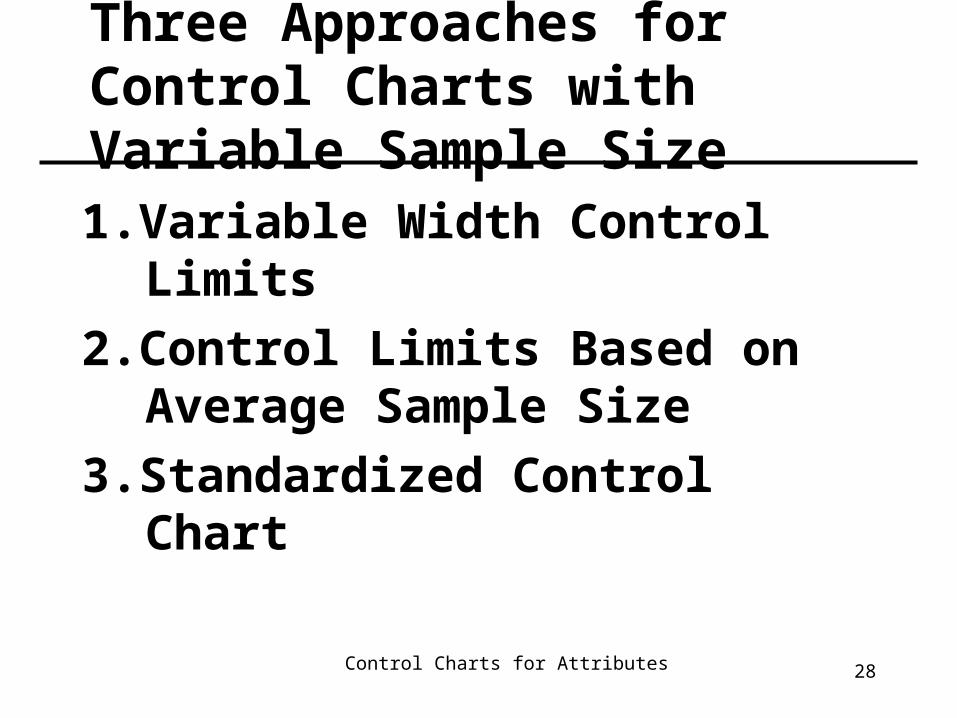
Three Approaches for Control Charts with Variable Sample Size
1.Variable Width Control Limits
2.Control Limits Based on Average Sample Size
3.Standardized Control Chart
Control Charts for Attributes 29
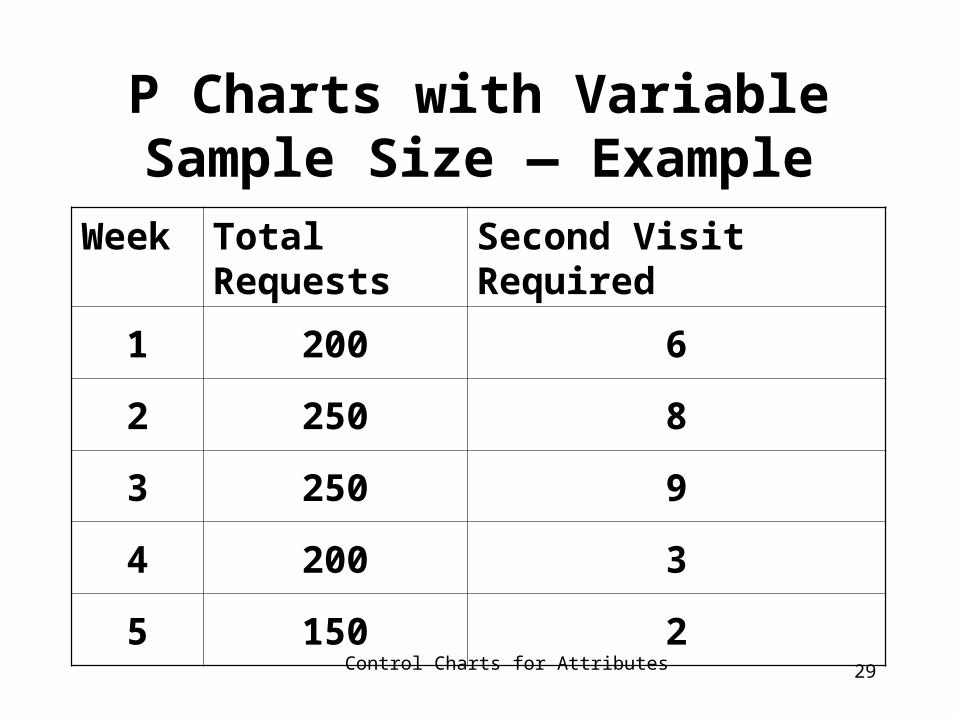
P Charts with Variable Sample Size — Example
Week Total Requests Second Visit Required
1 200 6
2 250 8
3 250 9
4 200 3
5 150 2
Control Charts for Attributes 30
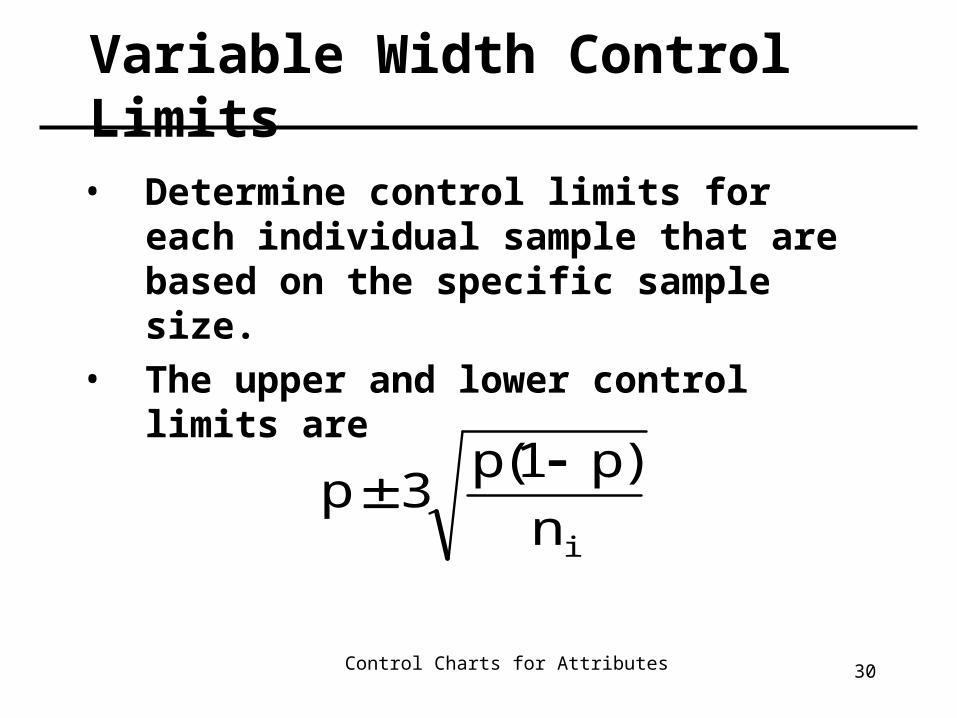
Variable Width Control Limits
• Determine control limits for each individual sample that are based on the specific sample size.
• The upper and lower control limits are
in
)p1(p3p
Control Charts for Attributes 31
Control Charts for Attributes 32
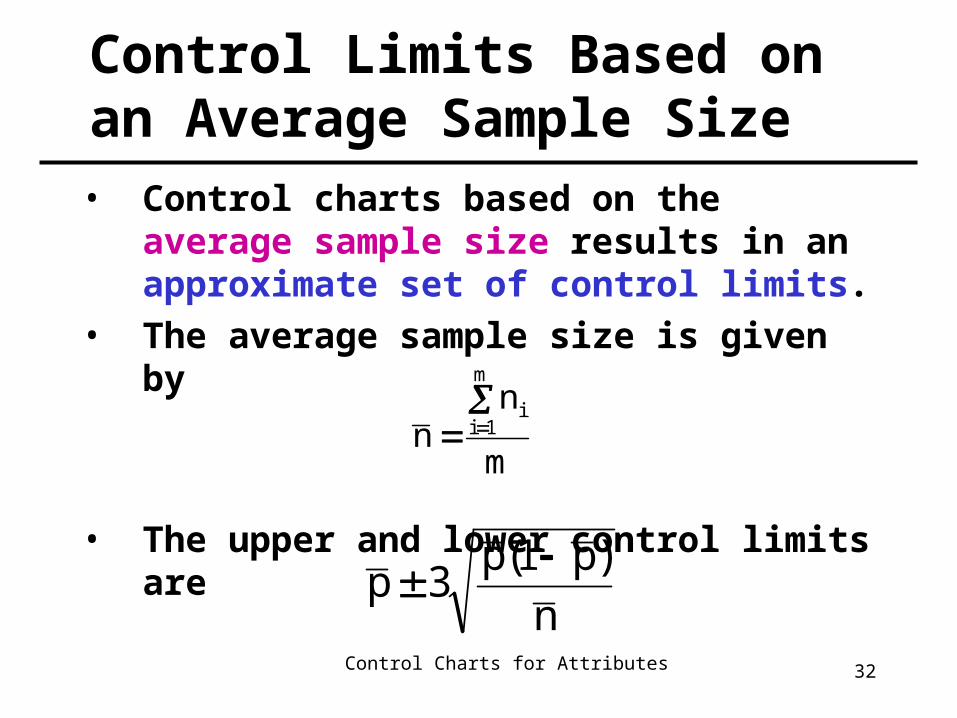
Control Limits Based on an Average Sample Size• Control charts based on the average sample
size results in an approximate set of control limits.
• The average sample size is given by
• The upper and lower control limits arem
nn
m
1ii
n
)p1(p3p
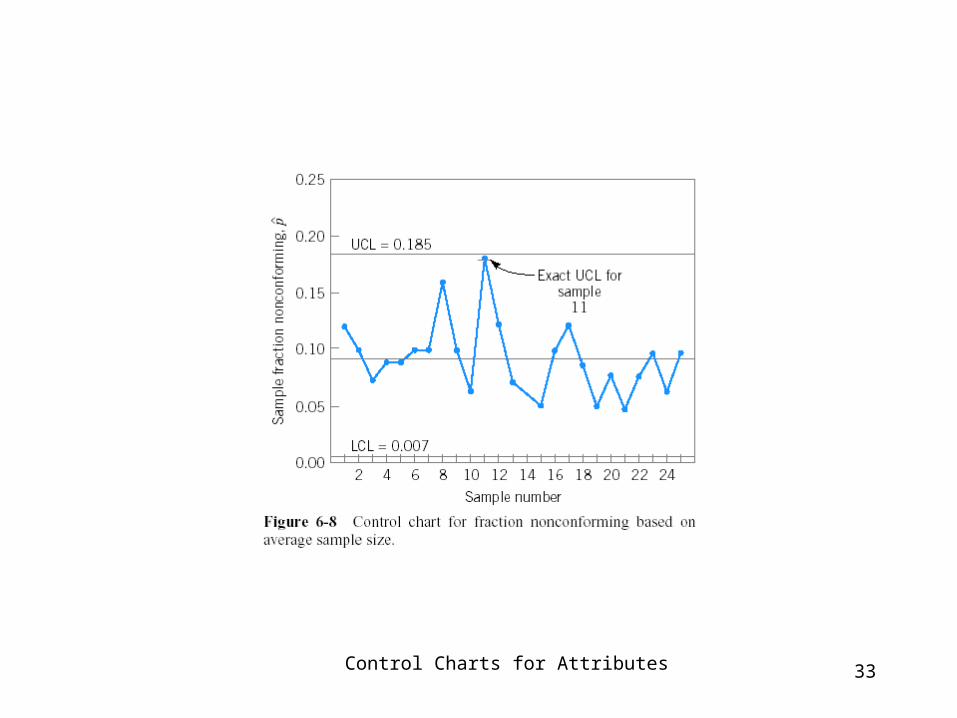
Control Charts for Attributes 33

Control Charts for Attributes 34
平均管制界限與個別不良率之分析 1
• 點落在管制界限內,其樣本大小,小於平均樣本大小時– 不須計算個別管制界限,該點在管制狀態內。
• 點落在管制界限內,其樣本大小,大於平均樣本大小時– 計算個別管制界限,再對該點樣本進行判斷。

Control Charts for Attributes 35
平均管制界限與個別不良率之分析 2
• 點落在管制界限外,其樣本大小,大於平均樣本大小時– 不須計算個別管制界限,該點在管制狀態外。
• 點落在管制界限外,其樣本大小,小於平均樣本大小時– 計算個別管制界限,再對該點樣本進行判斷。
Control Charts for Attributes 36
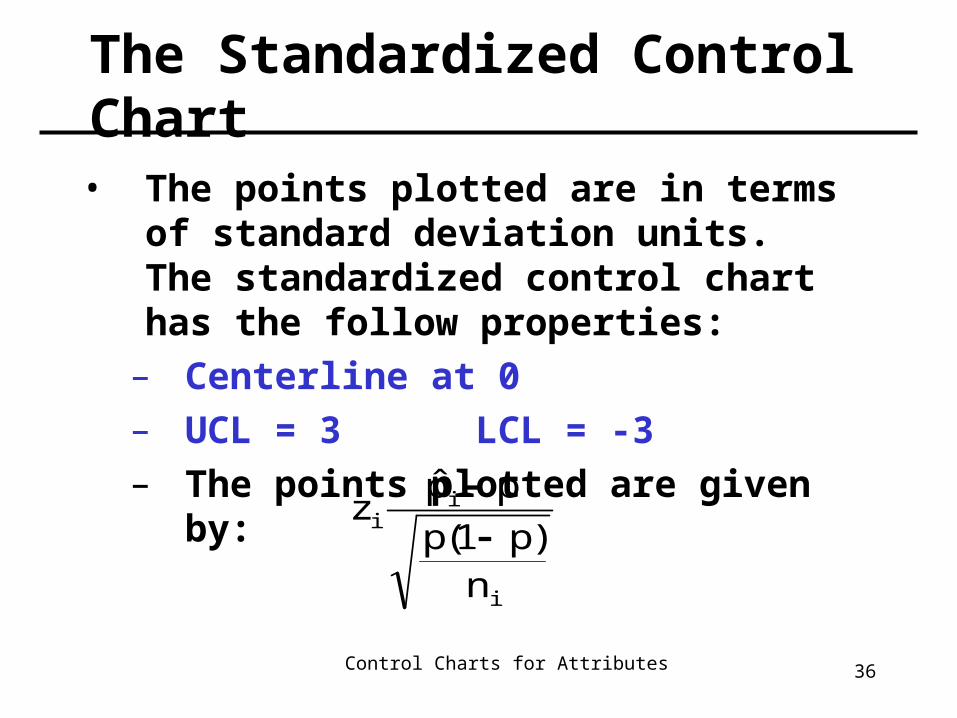
The Standardized Control Chart
• The points plotted are in terms of standard deviation units. The standardized control chart has the follow properties:
– Centerline at 0– UCL = 3 LCL = -3– The points plotted are given by:
i
ii
n)p1(p
pp̂z

Control Charts for Attributes 37

Control Charts for Attributes 38
Control Charts for Nonconformities (Defects)1
• There are many instances where an item will contain nonconformities but the item itself is not classified as nonconforming.
• It is often important to construct control charts for the total number of nonconformities or the average number of nonconformities for a given “area of opportunity”. The inspection unit must be the same for each unit.

Control Charts for Attributes 39
Control Charts for Nonconformities (Defects)2
Poisson Distribution• The number of nonconformities in a given area can
be modeled by the Poisson distribution. Let c be the parameter for a Poisson distribution, then the mean and variance of the Poisson distribution are equal to the value c.
• The probability of obtaining x nonconformities on a single inspection unit, when the average number of nonconformities is some constant, c, is found using:
!x
ce)x(p
xc

Control Charts for Attributes 40
c-chart
• Standard Given:
• No Standard Given:
c3cLCL
cCL
c3cUCL
c3cLCL
cCL
c3cUCL

Control Charts for Attributes 41
Choice of Sample Size: The u Chart
• If we find c total nonconformities in a sample of n inspection units, then the average number of nonconformities per inspection unit is u = c/n.
• The control limits for the average number of nonconformities is
n
u3uLCL
uCLn
u3uUCL

Control Charts for Attributes 42
Three Approaches for Control Charts with Variable Sample Size
1. Variable Width Control Limits
2. Control Limits Based on Average Sample Size
3. Standardized Control Chart

Control Charts for Attributes 43
Variable Width Control Limits
• Determine control limits for each individual sample that are based on the specific sample size.
• The upper and lower control limits are
in
u3u
Control Charts for Attributes 44
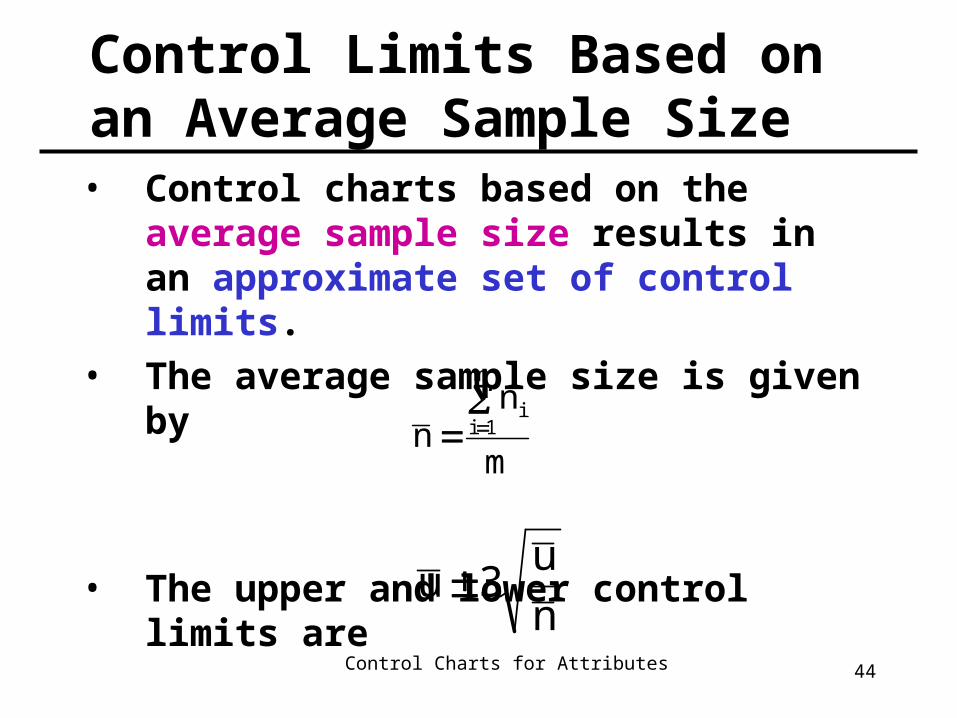
Control Limits Based on an Average Sample Size• Control charts based on the average sample
size results in an approximate set of control limits.
• The average sample size is given by
• The upper and lower control limits arem
nn
m
1ii
n
u3u

Control Charts for Attributes 45
The Standardized Control Chart
• The points plotted are in terms of standard deviation units. The standardized control chart has the follow properties:
– Centerline at 0– UCL = 3 LCL = -3– The points plotted are given by:
i
ii
nu
uuz
Control Charts for Attributes 46
Demerit Systems1
• When many different types of nonconformities or defects can occur, we may need some system for classifying nonconformities or defects according to severity; or to weigh various types of defects in some reasonable manner.
Control Charts for Attributes 47
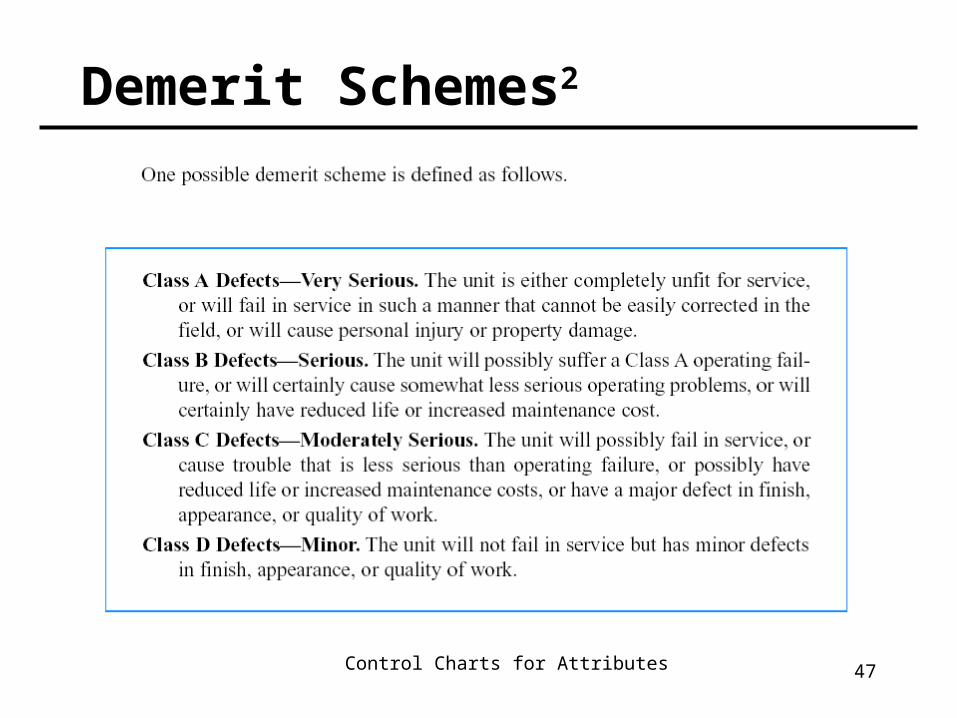
Demerit Schemes2

Control Charts for Attributes 48
Demerit Schemes3
• Let ciA, ciB, ciC, and ciD represent the number of units in each of the four classes.
• The following weights are fairly popular in practice:
– Class A-100, Class B - 50, Class C – 10, Class D - 1
di = 100ciA + 50ciB + 10ciC + ciD
di - the number of demerits in an inspection unit

Control Charts for Attributes 49
Demerit Systems—Control Chart Development1
• Number of demerits per unit:
where n = number of inspection units
D =
n
Du i
n
1iid
Control Charts for Attributes 50
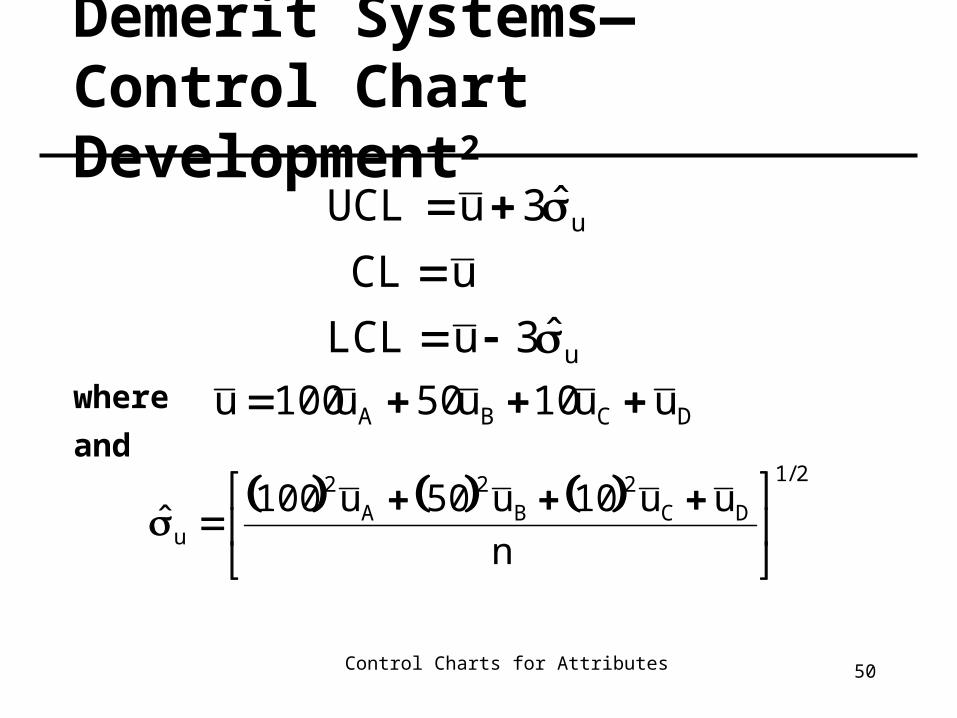
Demerit Systems—Control Chart Development2
where and
u
u
ˆ3uLCL
uCL
ˆ3uUCL
DCBA uu10u50u100u
2/1
DC2
B2
A2
u n
uu10u50u100ˆ
Control Charts for Attributes 51
Dealing with Low-Defect Levels1
• When defect levels or count rates in a process become very low, say under 1000 occurrences per million, then there are long periods of time between the occurrence of a nonconforming unit.
• Zero defects occur• Control charts (u and c) with statistic
consistently plotting at zero are uninformative.

Control Charts for Attributes 52
Dealing with Low-Defect Levels2
• Chart the time between successive occurrences of the counts – or time between events control charts.
• If defects or counts occur according to a Poisson distribution, then the time between counts occur according to an exponential distribution.

Control Charts for Attributes 53
Dealing with Low-Defect Levels3
• Exponential distribution is skewed.• Corresponding control chart very asymmetric.• One possible solution is to transform the
exponential random variable to a Weibull random variable using x = y1/3.6 (where y is an exponential random variable) – this Weibull distribution is well-approximated by a normal.
• Construct a control chart on x assuming that x follows a normal distribution.
• See Example 6-6, page 304.

Control Charts for Attributes 54
Dealing with Low-Defect Levels4
• Data transformation: defect (Poisson distribution) → time between event (Exponential distribution) → x=y1/3.6=y0.2777
→ X bar – MR control chart

Control Charts for Attributes 55
Choice Between Attributes and Variables Control Charts• Each has its own advantages and disadvantages• Attributes data is easy to collect and several
characteristics may be collected per unit.• Variables data can be more informative since specific
information about the process mean and variance is obtained directly.
• Variables control charts provide an indication of impending trouble (corrective action may be taken before any defectives are produced).
• Attributes control charts will not react unless the process has already changed (more nonconforming items may be produced).
Control Charts for Attributes 56
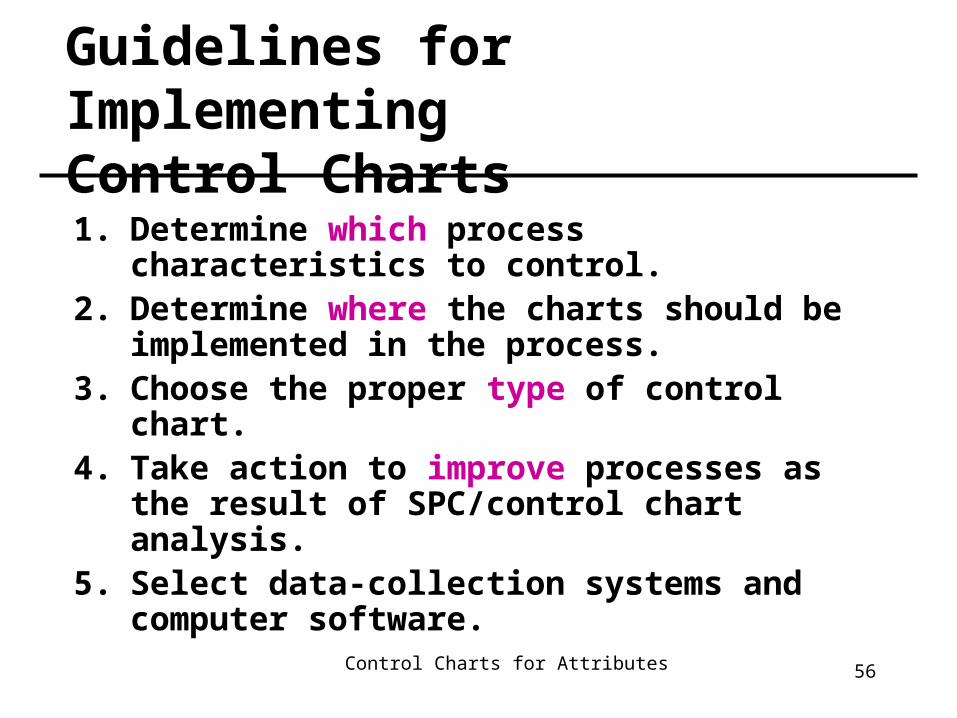
Guidelines for Implementing Control Charts
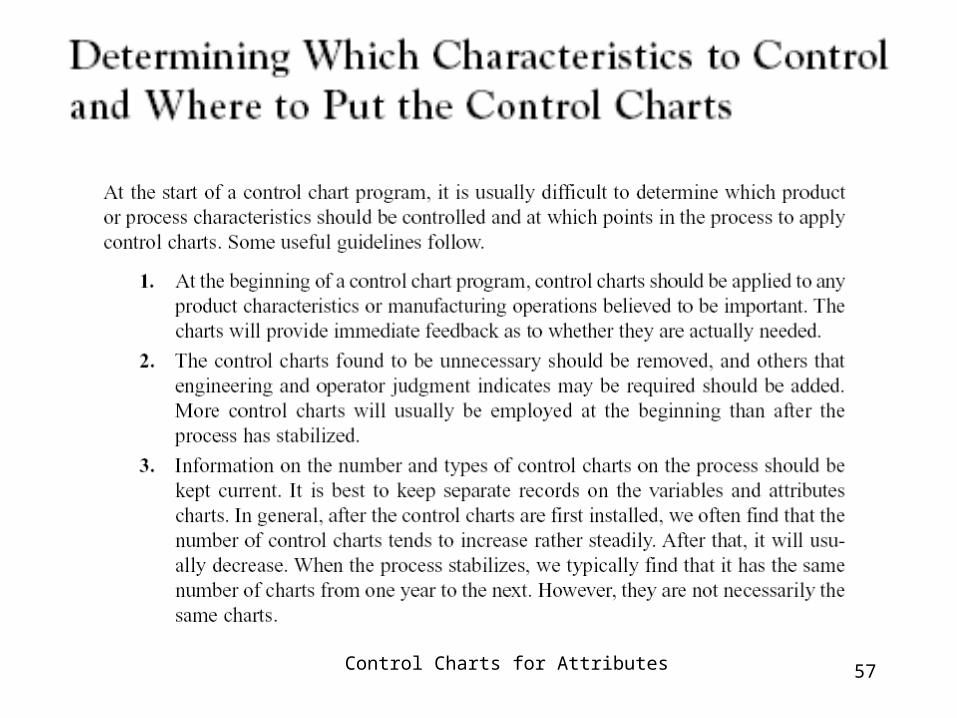
1. Determine which process characteristics to control.
2. Determine where the charts should be implemented in the process.
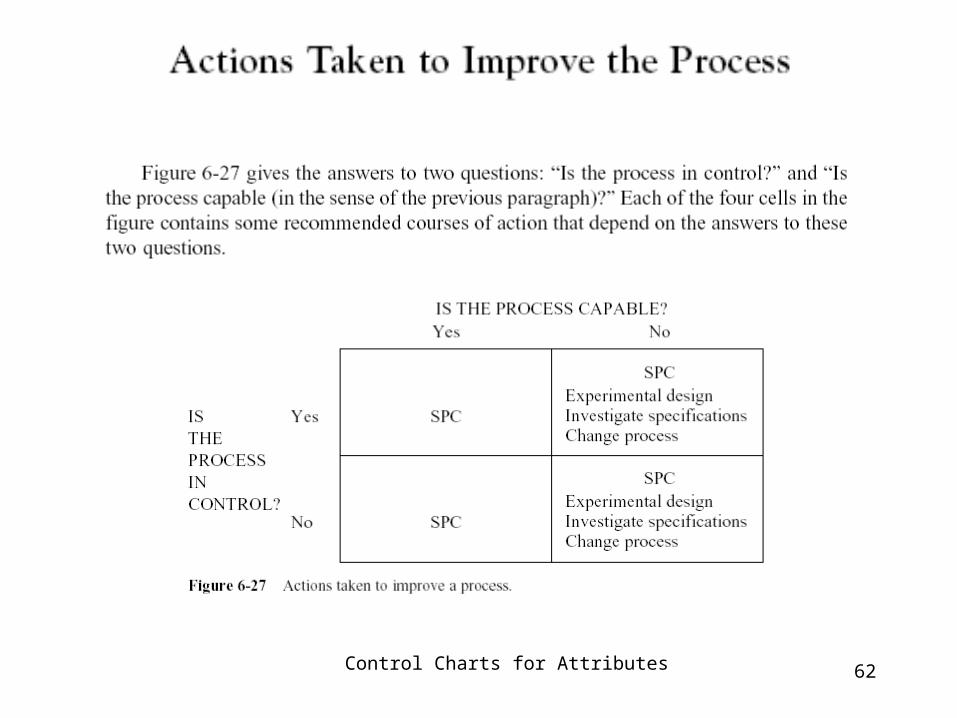
3. Choose the proper type of control chart.4. Take action to improve processes as the result
of SPC/control chart analysis.5. Select data-collection systems and computer
software.
Control Charts for Attributes 57

Control Charts for Attributes 58

Control Charts for Attributes 59

Control Charts for Attributes 60

Control Charts for Attributes 61
Control Charts for Attributes 62