control of voltage and damping - iea.lth.se
TRANSCRIPT

mo
ha
mm
ad
rez
a sa
far
i tirta
shi
C
ontrol of Voltage and D
amping in B
ulk Power System
s 2018
978
9188
9348
71
Faculty of EngineeringDivision of Industrial Electrical Engineering and Automation
Department of Biomedical EngineeringISBN 978-91-88934-87-1 (print)ISBN 978-91-88934-86-4 (pdf)
CODEN: LUTEDX/(TEIE-1086)/1-165/(2018)
Control of Voltage and Damping in Bulk Power Systemsmohammad reza safari tirtashi
faculty of engineering | lund university
Prin
ted
by M
edia
-Try
ck, L
und
2018
N
ORD
IC S
WA
N E
CO
LABE
L 3
041
0903
mohammad reza safari tirtashi has been a PhD student at the Division of Industrial Electrical Engineering and Automation, Lund University, Sweden. He has a Master’s degree in Electrical Engine-ering (Power) from Zanjan University, Iran.
His PhD research is focused on power system dynamics and stability. Particularly he did work on voltage and damping controls in bulk power systems.

Control of Voltage and Damping in Bulk Power Systems
Mohammad Reza Safari Tirtashi
Thesis for the degree of Doctor of Philosophy in Engineering Thesis supervisors: Prof. Olof Samuelsson
Assoc. Prof. Jörgen Svensson
To be presented, with the permission of the Faculty of Engineering of Lund University, for public criticism in the E:1406, E-building, Ole Römers väg 3, Lund on the 15rd of February
2018 at 10:15.
Faculty opponent: Prof. Kjetil Uhlen Norwegian University of Science and Technology (NTNU), Norway
Organization:
LUND UNIVERSITY Faculty of Engineering Division of Industrial Electrical Engineering and Automation
Document name:
DOCTORAL DISSERTATION
Date of issue: 2018 February 15 Author Mohammad Reza Safari Tirtashi
Sponsoring organization Swedish Foundation for Strategic Research (SSF)
Title: Control of Voltage and Damping in Bulk Power Systems
AbstractModern power system is a complex dynamical system and one of the largest man-made systems. With recent driving forces like environmental concerns over air emissions, the modern power system is evolving towards an even more complex system. So it is necessary to handle the current challenges in power systems with simple approaches and avoid adding further complexity as much as possible. Also the implementation issues should be taken into account to meet the Transmission System Operators’ (TSOs’) interests. The considered problems in this thesis are related to voltage control and damping control which are two important issues challenging secure power system operation. The first voltage control problem addressed in the thesis occurred during the restoration of the Swedish power system after the blackout in 2003 and is called reactor hunting. Large scale voltage fluctuations are the consequence of the reactor hunting. The common practice used by the Swedish TSO to handle the reactor hunting is to turn off voltage control automatics during the restoration period. That leaves the shunt reactors in manual operation which leads to a longer restoration process. To prevent reactor hunting, an adaptive tolerance band strategy is proposed in the thesis together with two ways to implement it. One is model based and uses short circuit capacity of buses which are going to be energized during the restoration. The short circuit capacity associated to each bus is normally available in the Energy Management System (EMS) in the TSO control center. The second implementation can be completely local and independent of a model. By implementing this strategy, the automatic operation of the reactive shunts will continue during the restoration time, and reactor hunting is eliminated. This should shorten the restoration process. The second voltage control issue addressed in the thesis is related to control of shunt capacitors. Shunt capacitors are commonly controlled using a local scheme, which switches in the capacitor when the voltage at the locally monitored bus is outside a tolerance band. In some cases a shunt capacitor remains unused in a region lacking reactive power just because the local voltage is within the tolerance band. An alternative control strategy proposed in the thesis is called the neighboring scheme. It uses both the local voltage and the voltage at neighboring buses. The neighboring bus voltage is estimated from measurements at the local bus, so this strategy can be implemented locally and communication free which is important for TSOs. In a situation near voltage collapse, this strategy has better performance in the sense of improving the voltage control by connecting more shunt capacitors or connecting them earlier compared to the local scheme. For some scenarios, the voltage collapse that occurs using the local scheme is avoided when using the neighboring scheme. The second actuator used in the thesis for voltage control improvement is VSC-HVDC converters which have the capability to control active and reactive power independently. For emergency voltage control this thesis suggests adjusting active and reactive power set-points to change the AC system power flow. Based on the considered strategy, the active and reactive power set-points are adjusted depending on the disturbance. This control strategy improves the AC system long-term voltage stability and could prevent voltage collapse in some severe scenarios. When designing voltage control systems, the lack of a simple text book size version of NORDIC32 test system for long-term voltage stability study is another issue addressed in the thesis. The NORDIC32 test system is a reduced order model of the Swedish power system but in some cases still a complex test system. In this thesis, we propose the N3area test system which is a text book size version of NORDIC32 with minimum model complexity for our purposes. Applying complex control algorithms to the N3area system and analyzing them is much easier than to the NORDIC32 system. Still it retains a dynamic behaviour quite close to NORDIC32 and reality. The last problem addressed in the thesis is related to inter-area oscillations damping in power systems. These oscillations are becoming a big concern for TSOs since the power systems are getting more and more interconnected. Inter-area oscillations are often limiting the transfer capacity of transmission lines and may even lead to system break up as in the 1996 western North America blackout. Active power modulation is an effective solution to damp out such oscillations. This can be implemented by active power modulation at two points in the network, using for example VSC-HVDC links. Also single-point active power modulation using actuators like Energy Storage (ES) works well. Single-point reactive power modulation using actuators like SVC indirectly controls the active power and is also efficient. Proportional control of active power with local frequency as input is used in reality today for HVDC links. This type of damping controller can be applied for the ES and can also be translated for SVC damping controller. Implementing such proportional damping controllers is simple as they use local feedback signals. However, the damping of the inter-area mode is limited due to nearby zeros, which is evident in the associated root locus plot. It is therefore important to use the optimum gain to achieve the maximum possible damping. Gain selection is normally done using visual inspection of the root locus or through optimization. In this thesis, we propose the impedance matching based gain selection for the VSC-HVDC, ES and SVC damping controllers. It gives a physically based criterion for the optimum gain selection to reach the maximum possible damping of the mode with the greatest mode observability and controllability which depends on the actuator location while not affecting negatively the other modes in the system. The proposed approach may be used as basis for a controller that is self-tuning which is an important feature since the power system operating points are changing a lot. Also it is simpler for implementation in reality compared to the root locus inspection or application of advanced optimization methods for gain selection.Key words: Damping control, energy storage, impedance matching, power system restoration, reactive shunts, reactor hunting, SVC, voltage control, voltage stability, VSC-HVDC.
Classification system and/or index terms (if any)
Supplementary bibliographical information Language: English
ISBN 978-91-88934-87-1 (print) 978-91-88934-86-4 (pdf) ISSN and key title
Recipient’s notes Number of pages: 165 Price
Security classification
I, the undersigned, being the copyright owner of the abstract of the above-mentioned dissertation, hereby grant to all reference sources permission to publish and disseminate the abstract of the above-mentioned dissertation.
Signature Date 2017-12-22
Control of Voltage and Damping in Bulk Power Systems
Mohammad Reza Safari Tirtashi

Cover illustration back: Author’s portrait
© 2018 Mohammad Reza Safari Tirtashi, All previously published papers and images were reproduced with kind permission from the publishers
Division of Industrial Electrical Engineering and Automation
Department of Biomedical Engineering
Lund University, Sweden
ISBN: 978-91-88934-87-1 (print)
ISBN:978-91-88934-86-4 (pdf)
CODEN: LUTEDX /(TEIE-1086)/1-165/(2018)
Printed in Sweden by Media-Tryck, Lund University, Lund 2018
En del av Förpacknings- och Tidningsinsamlingen (FTI)

Acknowledgements
First of all, I would like to express my deepest gratitude to my main supervisor, Prof. Olof Samuelsson for his support and guidance during the whole PhD period. He always helped me a lot and gave me the right directions to continue my work and go forward. Without his continuous support, this work would not have been accomplished. I would also like to thank my co-supervisor Assoc. Prof. Jörgen Svensson. He helped me with planning also gave me valuable comments during supervision meetings and for the papers and the thesis. I would also like to thank Lars Lindgren who did share the office with me. He helped me to learn how to work with ARISTO. We had lots of discussions about everything and I really appreciate his intelligence.
The work presented here is financed by the Swedish Foundation for Strategic Research and the Elektra program of Energiforsk and the Swedish Energy Agency which is gratefully acknowledged.
A special thank goes to all people at IEA for nice work environment. I am very thankful to Ulf, Carina, Ulrika and Getachew. Thanks Finn! I remember the first Midsummer here in Lund and frog dancing we had. I hope we will continue our friendship.
I’m also really thankful to all of my nice Iranian friends in Sweden especially Hossein, Nadia and Peyman. Thank you all for gatherings, long talks, going to concerts, and for all good memories we made together.
Finally, I would like to deeply thank my parents, Habib (Mohandes) and Marzieh, and my family back in Iran. You always motivated me and supported me to struggle with all difficulties I had during my life time.
Lund, December 2017 Mohammad Reza Safari Tirtashi

Popular summary
Secure and reliable power systems are the backbones of the modern industrial societies. Power system is a complex dynamical system which has its own challenges. One important factor which always must be kept in mind to treat and handle those challenges is looking for simple approaches. This is important because the power system itself is a complex system and we should try to find simple ideas to handle the current challenges and try to avoid adding further complexity as much as possible. In this thesis we address some current problems in power systems with respect to simple ideas and less complexity. The main motivation during this PhD thesis was to bring up new ideas and comprehensively explore them to handle real and important challenges in power systems while keeping them as simple as possible. Moreover, we always work on the ideas and explore them in a way to be understandable and trustable by Transmission System Operators (TSOs). This means that we consider the implementation issues in real power systems as much as possible and try to include them when solving the targeted problems in the thesis.
Reactor hunting, voltage and damping controls are the main problems addressed in this thesis. Reactor hunting is a real problem which happened during the 2003 Swedish/Danish blackout. It caused large voltage fluctuations during the power system restoration following the blackout. The common practice used by TSOs to avoid the reactor hunting works well to eliminate it but it increases the restoration time which is a critical issue. Another problem addressed in the thesis which threats power system stability is voltage control. Switched reactive shunts are traditionally utilized to control the voltage in power systems. Moreover, VSC-HVDC links are gaining considerable attention from power system industry due to many reasons, for example integrating the offshore wind power plants to the grid. VSC-HVDC technology has the capability to quickly control the active and reactive powers independently. So it can efficiently improve the voltage control especially during emergency conditions. In this thesis we consider both reactive shunts and VSC-HVDC links to improve the voltage control in power systems. The goal is to bring up alternative control schemes to improve the established one for the reactive shunts and consider appropriate control scheme for VSC-HVDC links. In both cases the simplicity of the control scheme is the key point. To further utilize the capability of the VSC-HVDC links and to address another important issue for the modern interconnected power systems, the inter-area oscillations damping is also addressed in this thesis. The main goal is to find an approach to tune the gain of a VSC-HVDC damping controller automatically while obtaining the maximum damping for the inter-area oscillations. The approach is also applicable to damping control of Energy Storage (ES) and SVC.

The key findings of the thesis in order to address all the above objectives are presented as follows;
- To handle the reactor hunting problem, a simple control concept called adaptive tolerance band is proposed. The proposed concept eliminates the reactor hunting while keeping the automatic operation of the reactive shunts during the power system restoration. This speeds up the restoration process.
- An improved version of the local control scheme which is currently used by many TSOs is proposed for reactive shunts control to improve the voltage control in the system. The proposed control strategy is a simple approach which can be implemented locally and is communication free which is a great advantage with respect to complexity reduction in power systems.
- An appropriate control scheme is considered for VSC-HVDC links to improve the voltage control and possibly avoid the large scale blackouts in power systems.
- To select the gain of damping controller of VSC-HVDC links, a simple method is proposed in the thesis. This method selects the optimum gain of the VSC-HVDC damping controller which gives the maximum damping. The aim is to damp out the inter-area oscillations. The proposed method application is extended to single-point active power modulation also single-point reactive power modulation damping controllers. Only local feedback signals are needed to implement the proposed method. If it works successful in reality, then it leads to a self-tuning controller which improves the damping in power systems. Self-tuning controller is important since the operating points change in power systems also the network topology might change.

List of Tables
Table 1: Reaction time for capacitors connection for generator outage scenario Table 2: Load flow parameters of N3area test system Table 3: Load dynamic model parameters [79] Table 4: OXL model parameters used for N3area test system Table 5: Power system and equivalent circuit model data Table 6: Eigenvalues of the NORDIC32 test system; Fenno-Skan Link Table 7: Eigenvalues of the NORDIC32 test system; South-West link Table 8: Two-area test system data Table 9: Electro-mechanical modes of the Four-Machine Two-Area system

List of Figures
Fig. 1: The South-West link ongoing project in Sweden, the northern part is an AC connection from Hallsberg substation to Barkeryd substation and the southern part is a DC connection from Barkeryd substation to Hurva substation [15].
Fig. 2: Blacked out area (gray area) for 2003 Swedish/Danish blackout, also the substations where reactor hunting happened.
Fig. 3: Voltage fluctuation caused by reactor hunting phenomenon during power system restoration.
Fig. 4: Basic circuit represents a large system connected by lossless transmission line to a load bus.
Fig. 5: PV curves for different load angles; P+jQ=S( cos + sinj ). Fig. 6: Generic two-area power system. M1=9.26 MJ/MVA , M2=8 MJ/MVA, D1=D2=2
p.u./(rad/s). With p.u. magnitudes: X1=X2=0.25, X3=0.35, P1=P2=PAC=1, E1δ1=1.080°, E2δ2=1.08-46°, V1θ1=1-13°, V2θ2=1-33°.
Fig. 7: AC line active power following the impulse disturbance in G1 mechanical power (5% for 100 ms).
Fig. 8: Observation method concept. Fig. 9: NORDIC32 test system, some buses are pointed out by the red letters which are
involved in restoration strategies. Fig. 10: Reactor hunting at bus 4062 for the first restoration path while the default
tolerance band is used. Fig. 11: No reactor hunting at bus 4062 for the first restoration path after applying
prediction control scheme. Fig. 12: Reactor hunting at bus 4051 for the second restoration path while the default
tolerance band is used. Fig. 13: No reactor hunting at bus 4051 for the second restoration path after applying
observation control scheme. Fig. 14: Basic flow chart of the local (left) and neighboring (right) methods for control of
reactive shunts for the case of low voltage. For the neighboring scheme, shunts at bus i (local bus) are controlled using voltages at bus i and the neighboring buses j, j+1 and j+2. Increase Qinjection corresponds to first reactor disconnection and then capacitor connection.
Fig. 15: For a local bus i with three neighbors j, j+1 and j+2, the local scheme (top) uses only voltage at bus i while the neighboring scheme (down) uses also voltage at neighbor buses j, j+1 and j+2.
Fig. 16: Voltage at bus 4044 in NORDIC32, for the local scheme (red) and for the neighboring scheme (green) for the generator outage scenario. Dashed lines indicate voltage tolerance limits.
Fig. 17: N3area test system. Fig. 18: OXL model implemented in PowerFactory [27].

Fig. 19: The NORDIC32 test system with the South-West link between buses 4032 and 4045. The red transmission line is out of service and red generator would be tripped during the dynamic simulation.
Fig. 20: Voltage at different buses of the southern part of NORDIC32 test system when the VSC-HVDC link is in place without active reactive powers ramp function.
Fig. 21: Active powers for the transmission lines connecting the northern and central areas and for the converter at bus 4032 and also reactive power of the converter at bus 4045.
Fig. 22: Voltage at different buses of the southern part of NORDIC32 test system when the VSC-HVDC link is in place with active reactive powers ramp function.
Fig. 23: Two-area system with VSC-HVDC link. Fig. 24: Equivalent circuit-model that reproduces the small-disturbance electro-mechanical
dynamics of the generic two-area system in Fig. 23. Fig. 25: Root locus of oscillatory mode when changing KHVDC=1/RHVDC with pole
locations corresponding to no control (x), zeros (o) and impedance matching (*) indicated as well as lines through (*) and the origin. Plots for circuit model and power system coincide.
Fig. 26: Gain plot of Bode-diagram of power system in Fig. 23 with VSC-HVDC active power as input and difference in frequency at the converters as output. Indicated frequencies are P (left), OPT (middle) and Z (right).
Fig. 27: The NORDIC32 test system with two VSC-HVDC links corresponding to Fenno-Skan and South-West links to investigate the impact of DC link position on the impedance matching based gain selection approach.
Fig. 28: Gain plot of Bode-diagram of the NORDIC32 test system with VSC-HVDC active power as input and difference in frequency at the converters as output for the Fenno-Skan link position (left) and the South-West link position (right). Indicated frequencies are P (left), OPT (middle) and Z (right).
Fig. 29: Two-area system with SVC at the middle of the AC line. Fig. 30: Gain plot of Bode-diagram of two-area test system with SVC reactive power as
input and the time derivative of the deviation of the local voltage from nominal voltage as output. Indicated frequencies are P (left), OPT (middle) and Z (right).
Fig. 31: Root locus of oscillatory mode with pole location corresponding to impedance matching (*) indicated as well as line through (*) and the origin.
Fig. 32: Four-machine two-area test system with SVC. Fig. 33: Gain plot of Bode-diagram of the four-machine two-area test system with SVC
reactive power as input and the time derivative of the deviation of the local voltage from nominal voltage as output. Indicated frequencies are P (left), OPT (middle) and Z (right).
Fig. 34: Dynamic response of the four-machine two-area test system with SVC. (a) Faulted tie-line active power. (b) Angular separation between G1 and G3. (c) Control effort.

Contents
1. Introduction ........................................................................................... 1
1.1 Background and Challenges ................................................................................. 1 1.2 Objectives ............................................................................................................ 6 1.3 Contributions ....................................................................................................... 7 1.4 Outline ................................................................................................................. 8 1.5 Publications .......................................................................................................... 9
2. Power Systems Complexity ................................................................. 11
2.1 Managing the Power System Complexity .......................................................... 11 2.2 Voltage Control during Restoration ................................................................... 13 2.3 Voltage Control during System Operation ......................................................... 14 2.4 Inter-area Oscillations in Power Systems ........................................................... 18 2.5 Summary ............................................................................................................ 20
3. Reactive Shunts for Voltage Control ................................................... 21
3.1 Reactive Shunts for Voltage Control during Restoration ................................... 21 3.2 Reactive Shunts for Voltage Control during Operation ..................................... 27 3.3 N3area Test System ........................................................................................... 31 3.4 Summary ............................................................................................................ 34
4. VSC-HVDC for Emergency Voltage Control ..................................... 37
4.1 VSC-HVDC for Voltage Control ....................................................................... 37 4.2 Control Strategy and Simulation Results .......................................................... 39 4.3 Summary ........................................................................................................... 42
5. Damping Control in Power Systems ................................................... 43
5.1 Inter-area Oscillations in Power Systems .......................................................... 43 5.2 Impedance Matching for VSC-HVDC Damping Controller Gain Selection .... 44 5.3 Impedance Matching for Single-point Active Power Modulation .................... 53 5.4 Impedance Matching for Single-point Reactive Power Modulation ................. 53 5.5 Summary ........................................................................................................... 60
6. Conclusions and Future Work ............................................................. 61
Summary of Appended Papers .......................................................................... 72 Author Contributions ........................................................................................ 76


1
1.Introduction
In this chapter the background and challenges, objectives and contributions of the work are provided, followed by the outline of the thesis.
1.1 Background and Challenges
Electrification is listed as the first achievement among 20 greatest engineering achievements of the 20th century [1]. This indicates that the modern society heavily depends on secure and reliable power systems. From the first electric network built by Thomas Edison in 1882 [2], the electric power system has always evolved over the course of time. In the early period of power systems, the transition from DC to AC networks did occur which can be considered as the first evolutionary movement. Then the transformers and AC transmission lines developed [3]. The power system evolution continues and nowadays new driving forces make the main trends behind the power system development.
Environmental concern over air emissions is one of the recent driving forces behind the modern power system evolution. In this respect, growing fossil free and clean energy is a target for many countries around the world [4]. For example, Sweden has the goal to have completely fossil free generation and entirely depend on renewable energy by 2040 [5]. Solar electricity and wind power are two types of renewable electricity generation which are now growing faster than any other energy source and they are about to be competitive with traditional energy sources. For example, wind based electrical power generation made up more than half of the new power generation in European countries in 2016 [6]. Power electronic
1
2
converters are necessary equipment to integrate such energy sources to the main power grid [7]. This indicates that the future power system would mainly be based on non-synchronous generation [8]. Non-synchronous generation influences the dynamics of power systems and creates some new challenges. One negative impact is power system inertia reduction [9]. Another one for example would be different fault behavior of wind turbines compared to traditional power plants with synchronous generators [10]. These new challenges must be handled to have secure and reliable power systems.
To interconnect large scale offshore wind power plants which are growing rapidly as a type of affordable renewable energy to the main power grid, using Voltage Source Converter-High Voltage Direct Current (VSC-HVDC) transmission lines is gaining considerable attention from power system industry due to their high controllability [11]. This type of transmission line is also environmental friendly by offering some benefits including oil-free cables and compact converter stations [12].
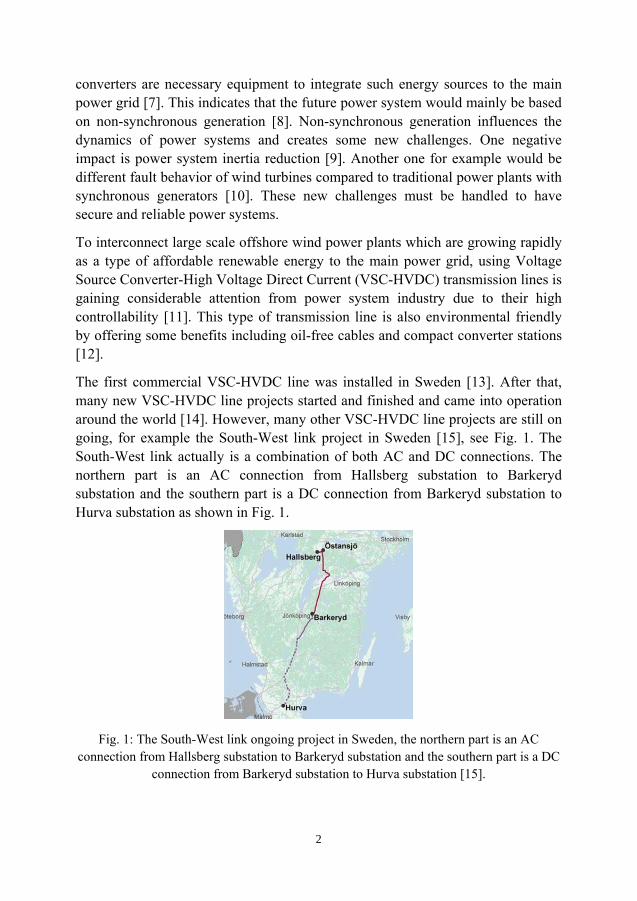
The first commercial VSC-HVDC line was installed in Sweden [13]. After that, many new VSC-HVDC line projects started and finished and came into operation around the world [14]. However, many other VSC-HVDC line projects are still on going, for example the South-West link project in Sweden [15], see Fig. 1. The South-West link actually is a combination of both AC and DC connections. The northern part is an AC connection from Hallsberg substation to Barkeryd substation and the southern part is a DC connection from Barkeryd substation to Hurva substation as shown in Fig. 1.
Fig. 1: The South-West link ongoing project in Sweden, the northern part is an AC connection from Hallsberg substation to Barkeryd substation and the southern part is a DC
connection from Barkeryd substation to Hurva substation [15].
2
3
Recently, application of multi-terminal VSC-HVDC systems has been proposed to integrate large scale renewable energy sources to the main power grid also to make interconnection among different electricity markets [16]. For example in Europe, there are some suggestions to make pan-European overlay DC grids based on VSC-HVDC technology [17]. Introducing the multi-terminal DC grids to the future power systems will result in some new challenges regarding their operation and control. This makes the current power system evolve towards even more complex system in an incremental manner [18].
Electricity markets are also influenced by increasing amounts of variable renewable generation. This leads to evolution of trading forms during the last years towards low-carbon economy [19]. It also leads to different interconnections among different electricity markets like cross-border interconnections. All of these indicate that the electric power systems are undergoing big changes and it is growing both in size and complexity [20].
As stated earlier, integrating more renewable sources like offshore wind power plants to the main power grid influences the dynamics of power systems. To ensure the reliability of the whole network and possibly avoiding the large scale blackouts, modern wide area monitoring systems seem to be promising. Recently, Wide-Area Measurement Systems (WAMSs) based on Phasor Measurement Units (PMUs) are gaining considerable attention. This type of measurement systems need fast communication links [21] resulting in huge data exchange in the system which naturally add some sort of complexity to the power systems.
So the modern power system is a large scale complex system and with new driving forces which are shaping the new trends behind the power system evolution, it would be an even more complex system in the near future. This complex dynamical system has its own challenges. To avoid adding further complexity, the current challenges in power systems must be treated with simplest possible approaches. This is exactly what we aim to meet in this thesis. Actually we address some current problems in power systems with respect to simple ideas and less complexity. Moreover, we work on those ideas and explore them in a way to make them understandable and trustable by Transmission System Operators (TSOs). Also we avoid communication and data exchange in the system and solve the considered problems locally as much as possible.
The problems addressed in the thesis are connected to voltage and damping controls which are two important issues challenging secure power system operation. The primary goal is to improve the power system stability and avoid large scale blackouts such as those that occurred in Sweden in 1983 and 2003 [22],
3
4
[23]. Also, if the blackout happens then restore the power system as fast and securely as possible.
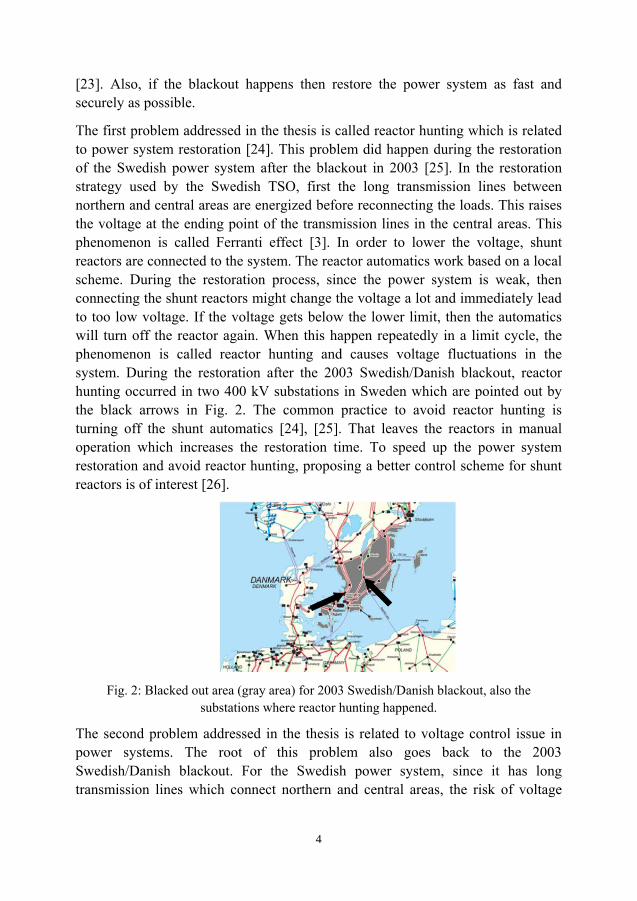
The first problem addressed in the thesis is called reactor hunting which is related to power system restoration [24]. This problem did happen during the restoration of the Swedish power system after the blackout in 2003 [25]. In the restoration strategy used by the Swedish TSO, first the long transmission lines between northern and central areas are energized before reconnecting the loads. This raises the voltage at the ending point of the transmission lines in the central areas. This phenomenon is called Ferranti effect [3]. In order to lower the voltage, shunt reactors are connected to the system. The reactor automatics work based on a local scheme. During the restoration process, since the power system is weak, then connecting the shunt reactors might change the voltage a lot and immediately lead to too low voltage. If the voltage gets below the lower limit, then the automatics will turn off the reactor again. When this happen repeatedly in a limit cycle, the phenomenon is called reactor hunting and causes voltage fluctuations in the system. During the restoration after the 2003 Swedish/Danish blackout, reactor hunting occurred in two 400 kV substations in Sweden which are pointed out by the black arrows in Fig. 2. The common practice to avoid reactor hunting is turning off the shunt automatics [24], [25]. That leaves the reactors in manual operation which increases the restoration time. To speed up the power system restoration and avoid reactor hunting, proposing a better control scheme for shunt reactors is of interest [26].
Fig. 2: Blacked out area (gray area) for 2003 Swedish/Danish blackout, also the substations where reactor hunting happened.
The second problem addressed in the thesis is related to voltage control issue in power systems. The root of this problem also goes back to the 2003 Swedish/Danish blackout. For the Swedish power system, since it has long transmission lines which connect northern and central areas, the risk of voltage
4

5
instability and the lack of voltage control at the central or southern parts of the country is an inherent feature of the system. To have more secure power system, the voltage control issues must be handled. One option is using shunt reactors and capacitors to regulate the voltage throughout the entire network. These shunt elements are commonly controlled using a local scheme which switches the shunts when the voltage at the local bus is outside a tolerance band [27], [28]. The local scheme is utilized by the TSOs for shunt automatics but it cannot guarantee the voltage control and voltage stability in all situations. Therefore other alternative simple schemes are of interest for power system operators to improve voltage control [26].
Moreover, to study the problems associated with the voltage control in power systems, there are some standard test systems used in research internationally including Single Load Infinite Bus (SLIB) [27], the Carson Taylor test system [29] and NORDIC32 test system [30], [31]. The relevant model for Swedish power system is NORDIC32 test system. This test system has the key long-term dynamics of the Swedish power system and is widely used in academic world to study the associated voltage control problems. Although NORDIC32 is a reduced order model of the Swedish power system, it is still a complex test system. A text book size version of NORDIC32 test system which reduces its model complexity to a minimum is of interest to study the relevant voltage control problems [26].
Still in voltage control, another actuator which has been used recently to improve the voltage control in power systems is VSC-HVDC technology [32]. It can be used to control the power flow in the system. To utilize this actuator, an appropriate control scheme for both active power and reactive power are of interest which is addressed in the thesis.
Furthermore, for modern interconnected power systems, another important issue to improve the stability and have more secure power network is the damping control in power systems [33]. Satisfactory damping control is important to avoid power system oscillations. One type of power system oscillations is called inter-area oscillations [34]. Since the power systems are becoming more interconnected, inter-area oscillations are becoming a big concern for TSOs. These oscillations impose a limitation for the transfer capacity of the transmission lines and they also might lead to system break up as happened during the 1996 western North America blackout [35]. So they seriously threat the power system stability and integrity. As inter-area oscillations are active power oscillations among areas, an effective solution to damp out such oscillations is to modulate the active power flow between these areas [36]. This can be implemented using two points active
5

6
power control by actuators like VSC-HVDC [37] and single-point active power control by actuators like Energy Storage (ES) [38] to directly modulate the active power or using SVC to modulate the reactive power [39] and indirectly modulate the active power.
One control scheme which is treated in reality today for HVDC links to improve the damping of power systems is proportional control of active power with local frequency as input [40]. This control scheme can be applied for ES damping controller also can be translated for SVC damping controller as well. For SVC case, the proportional control of reactive power with time derivative of local voltage magnitude as input is used instead. Using local feedback signals is a great advantage of this type of damping controller with respect to power system complexity reduction but it results in limited damping of the inter-area mode due to nearby-zeros in the associated root locus plot. This type of control scheme also generally needs no phase compensation and the single challenge is to select the optimum gain to achieve the maximum damping. A simple approach to find out the optimum gain for such a controller is not addressed in the literature yet.
1.2 Objectives
The main purpose of the thesis is to address some current problems related to voltage and damping controls in bulk power systems with respect to the fact that the power system is a complex dynamical system at the current stage. Also, it would be even more complex in the future. So the main goal of the thesis is to provide control schemes which are simple for implementation, understandable and trustable by TSOs. Also, providing simpler test systems to understand complex dynamical phenomena is another goal of the thesis. Moreover, we consider utilizing the actuators which are accessible for many TSOs and specifically for the Swedish national grid operator (Svenska Kraftnät). Both voltage and damping controls improvement are treated in the thesis with the aim of having more secure power systems. To do so, first the reactor hunting problem during the power system restoration is investigated with the aim to propose a control scheme to improve the Extreme Voltage Automatic (EVA) of the reactor shunts to avoid large scale voltage fluctuations. Then the switched shunt reactors and capacitors which are the traditional reactive resources are investigated and used in this thesis with the aim to improve the voltage control and possibly avoiding the voltage collapse and large scale blackouts. Proposing a text book size version test system to study the long-term voltage instability of the Swedish power system is another
6

7
objective investigated in the thesis. We focus on the long-term voltage instability since that is a potential problem for the Swedish power system. For the voltage control improvement, the VSC-HVDC link capability is also treated and investigated. Furthermore, the last part of the thesis work is directed towards methods to improve the damping in power systems. The goal is to find out the optimum gain of the considered damping controllers which gives the maximum damping to damp out the inter-area oscillations. VSC-HVDC and ES are used as actuators to modulate the active power directly and SVC is used to modulate the active power indirectly. Here the main goal is to provide a simple and possibly self-tuning method for gain selection of the damping controllers of two points active power control (can be implemented by VSC-HVDC), single-point active power control (can be implemented by ES) and single-point reactive power control (can be implemented by SVC).
1.3 Contributions
To meet the above mentioned objectives of the thesis, the following contributions are made:
- The new control concept called adaptive tolerance band is proposed for shunt reactors automatics to avoid reactor hunting during power system restoration. By applying the proposed approach, the reactor hunting is eliminated so that the automatic operation of the shunt reactors will continue during the power system restoration.
- The neighboring scheme is proposed as an improvement of the local scheme for reactive shunts to improve the voltage control in the system. The neighboring scheme can raise the voltage stability-constrained transfer limit compared to the local one. It has also better performance in the sense of suppressing the contingencies and improving the post-disturbance voltage control by connecting more shunt capacitors or connecting them earlier in a scenario with declining voltages.
- The new test system called N3area which is a text book size version of the NORDIC32 test system is proposed to replicate the long-term voltage dynamics of NORDIC32 and the Swedish power system. This test system actually reduces the NORDIC32 model complexity. So implementing the control algorithms in the N3area test system is much easier than in the NORDIC32 test system.
7
8
- A control scheme is considered for the VSC-HVDC links with respect to the VSC converter capability curve to control the active and reactive power in the AC system. The goal is to improve the long-term voltage stability as much as possible.
- Impedance matching based gain selection approach is proposed for proportional control of VSC-HVDC, ES and SVC damping controllers. The optimum gain is selected based on the proposed approach which gives the maximum damping.
- The proposed approach based on the impedance matching is simple and can be easily implemented for optimum gain selection. It also could lead to a self-tuning controller.
- Low data requirement is another feature of the proposed approach based on the impedance matching. It actually can be implemented just based on the local data meaning that it does not require a supervisory system and centralized control.
1.4 Outline
Chapter 2 first gives the general impression about power systems complexity managing in terms of modelling and controller structure and tuning. Then the voltage control issues during power system restoration are addressed. Especially the reactor hunting problem is introduced and the proposed methods in the thesis to handle it are provided. After that, the voltage control issues during power system operation are considered. Then the approaches to control the reactive shunts and VSC-HVDC links are presented to address the current challenges with respect to less complexity in power systems. Moreover, the proposed N3area test system as a text book size version of NORDIC32 and Swedish power system is presented. Then, the rest of the chapter is devoted to the electro-mechanical oscillations and in particular the inter-area oscillations to highlight the importance of the damping control in power systems. The utilized actuators in the thesis are mentioned. Then the challenges related to select the optimum gain of the damping controllers of the actuators are presented. And finally the proposed approach in the thesis to find out the optimum gain is introduced.
Chapter 3 describes first the adaptive tolerance band concept as new simple control scheme proposed in the thesis to avoid the reactor hunting. Then the application of reactive shunts to improve the voltage control during power system
8

9
operation is addressed. Then the local and neighboring schemes are presented as two control schemes to control the reactive shunts to improve the post-disturbance voltage control. The performances of these control schemes are compared. Finally the N3area test system is presented in detail as simplified version of NORDIC32 test system.
In chapter 4, the application of VSC-HVDC technology to improve the long-term voltage stability is investigated. Also the considered control scheme for the VSC-HVDC active and reactive powers is presented.
In chapter 5, first the inter-area oscillations in power systems are shortly presented. Then the application of the impedance matching concept to select the optimum gain of the VSC-HVDC damping controller is explained. Finally the application of the impedance matching concept to select the optimum gain of the SVC damping controller is proposed. The eigenvalue analysis and also the dynamic simulation results are presented.
1.5 Publications
Papers included in compilation thesis:
1- M. Reza Safari Tirtashi, Olof Samuelsson and Jörgen Svensson “Adaptive tolerance band for shunt automatics to avoid reactor hunting during power system restoration” Submitted to international journal.
2- M. Reza Safari Tirtashi, Olof Samuelsson and Jörgen Svensson “Improved local control of reactive shunts to enhance post-disturbance voltage control” Submitted to international journal.
3- M. Reza Safari Tirtashi, Olof Samuelsson and Jörgen Svensson “Dynamic and static analysis of the shunt capacitors control effect on the long-term voltage instability”. 2016 IEEE Power & Energy Society General Meeting, Boston, USA, 17-21 July, 2016.
4- M. Reza Safari Tirtashi, Jörgen Svensson and Olof Samuelsson “VSC-HVDC application to improve the long-term voltage stability” 12th IEEE PES PowerTech Conference, Manchester, UK, 18-22 June, 2017.
5- M. Reza Safari Tirtashi, Olof Samuelsson and Jörgen Svensson “Impedance matching for VSC-HVDC and energy storage damping controllers” IEEE Transactions on Power Delivery, DOI: 10.1109/TPWRD.2017.2719578.
9

10
6- M. Reza Safari Tirtashi, Olof Samuelsson, Jörgen Svensson and Richard Pates “Impedance matching for VSC-HVDC damping controller gain selection” Submitted to international journal.
7- M. Reza Safari Tirtashi, Olof Samuelsson, Richard Pates, and Jörgen Svensson “Impedance matching for gain selection of single-point active power modulation damping controller” Submitted to international journal.
Other Publications:
8- M. Reza Safari Tirtashi “Control of reactive shunts-Voltage stability and restoration” Licentiate thesis, Lund University, April 2015.
9- M. Reza Safari Tirtashi, Olof Samuelsson and Jörgen Svensson “Long-term voltage collapse analysis on a reduced order Nordic system model” 49th International Universities Power Engineering Conference (UPEC), Romania, 2-5 September, 2014.
10- Peyman Farhang, M. Reza Safari Tirtashi, Reza Noroozian and G.B. Gharehpetian “Combined design of VSC-HVDC and PSS controllers for LFO damping enhancement” Transactions of the Institute of Measurement and Control, vol. 36. no. 4, pp. 529-540, 2014.
11- M. Reza Safari Tirtashi, Olof Samuelsson and Jörgen Svensson “Control strategies for reactive shunts to improve long-term voltage stability” 48th International Universities Power Engineering Conference (UPEC), Dublin, Ireland, 2-5 September, 2013.
12- Ahmad Rohani, M. Reza Safari Tirtashi, and Reza Noroozian “Combined design of PSS and STATCOM controllers for power system stability enhancement” Journal of Power Electronics (JPE), vol. 11, no. 5, pp. 734-742, Sep. 2011.
10

11
2.Power Systems Complexity
This chapter aims to mainly address how we manage the power system complexity with respect to the considered problems in the thesis. To do so, first ways to manage the power system complexity is introduced using some general terms. Then for each problem addressed in the thesis, the relevant issues and also the proposed approaches are presented.
2.1 Managing the Power System Complexity
As stated earlier in chapter 1, an electric power system is a large-scale complex dynamical system [2] and it is important to manage the complexity of such a big system. To meet this goal, we consider the power system complexity reduction as much as possible when addressing any issue throughout this thesis. In particular, we target minimum complexity when it comes to power system modelling, designing the structure of relevant controllers and tuning the controllers parameters.
2.1.1 Modelling
Reduced order models are important tools to study complex phenomena in power systems. Moreover, they are helpful when designing controllers [41] and when evaluating the performance of different control algorithms as countermeasures.
For model complexity reduction, maintaining reasonable accuracy is important point which should be carefully respected. In power system case, it can be modeled as multiple subsystems, focusing on one subsystem and model the rest of
11

12
the system as a simplified equivalent. The latter is what we have accomplished for voltage stability study purposes for the Swedish power system in this thesis presented later in chapter 3. This type of models helps to provide a framework to gain conceptual understanding of complex phenomena in power systems. The value of this is clearly demonstrated by the extensive use, in education and research, of the single machine infinite bus system for studies of angle stability.
2.1.2 Controllers Structure and Tuning
Control of modern electric power system is a complex problem due to its size, its nonlinearity and the huge number of variables and parameters [42]. However, in modern power systems, there are a huge number of controllers for many reasons from voltage control to frequency control and etc [43]. The structure of the controllers and how to tune the controller parameters are two important elements which impact on the complexity of power systems.
With respect to structure, controllers can be implemented either as localized control scheme [44] or as centralized control [45]. The localized control scheme is appropriate when limited communication is important while for centralized control, communications and supervisory control are necessary. The latter increase the power system complexity which we try to avoid in this thesis. So we mainly go for local control to address our challenges in the thesis.
With respect to controllers tuning, it is well known that the wrong parameter tuning impacts negatively on system performance and stability [46]–[48]. Also to avoid adding further complexity to the system, simple approaches for tuning may be better than sophisticated ones. An exception is of course when the sophisticated methods lead to self-tuning controllers. This is particularly valuable since the power systems operating conditions are always changing. The last preferable feature for controller tuning approaches which we consider in this thesis is that they should be understandable and trustable by TSO personnel. For that purpose the controllers should match intuitive understanding and preferably be similar to previous solutions.
The considered problems and challenges in the thesis are presented in the following. The proposed approaches to handle them are also provided while the above features are respected to avoid adding further complexity and to propose methods which are practical from a TSO perspective.
12

13
2.2 Voltage Control during Restoration
The first challenge which is addressed in the thesis is related to voltage control during power system restoration. This section thus aims to give a short story about it and particularly focuses on the reactor hunting phenomenon. To do so, first two main strategies used by TSOs for power system restoration, called the build-up and build-down, are explained [49].
For the build-up strategy, the entire network is first divided into some electrically isolated islands. The voltage and frequency are usually controlled and regulated in each island. Loads are also connected gradually in each island. After making islands, then they should be synchronized and interconnected to restore the whole network [49]. The build-down strategy, on the other hand, is usually used for partial blackouts. First the status of the circuit breakers and also power plants are checked. Then from the running parts of the system, the transmission lines are connected to other stations in order to supply them with emergency power which is necessary for starting them. In fact in this strategy the bulk network is re-energized before reconnecting the loads and also re-synchronizing the generators. After energizing the high voltage transmission lines, then the generators are synchronized to the system. Most of the loads are connected after the main part of the bulk power system is restored [49].
In Sweden, since the large amount of hydro power plants are located in the northern part and the main load areas are in the central and southern parts of the system, the blackouts have mainly happened in the central and southern areas. Then it is natural to apply build-down strategy for the system restoration. So the restoration process usually starts with energizing the long transmission lines between north and central areas. This energization initially results in excess of reactive power and high voltages due to the Ferranti effect. During the restoration for 2003 Swedish/Danish blackout, the voltage rose to 476.5 kV in the southern part of the system [25], corresponding to nearly 115 % of the operating voltage 415 kV. In order to manage such voltages, shunt reactors are installed in the system. These reactors have their own automatics to switch them on/off. The reactor automatics work based on a local scheme. It means they switch once the local bus voltage is out of a tolerance band. During the restoration process, since the power system is weak, then connecting the shunt reactors have large impact and may immediately cause extreme low voltage. If the voltage gets below the lower limit, then the automatics will turn off the reactor again and the voltage returns to above the tolerance band. The resulting repetitive connection and disconnection of the shunt reactors is a limit cycle oscillation called reactor
13

14
hunting [24] and causes voltage fluctuations in the system as it happened in 2003 Swedish/Danish blackout and is illustrated in Fig. 3. The traditional way to handle the reactor hunting is by turning off the automatics. That leaves the reactive shunts in manual operation which increases the restoration time [50].
In this thesis we propose adaptive tolerance band concept to avoid reactor hunting phenomenon. The concept simply means instead of having a fixed tolerance band for the shunt reactors, it can be adaptive and changes based on the network strength. To implement the proposed concept, two control methods are proposed. One method can be implemented locally by first measuring the voltage change once the reactor shunt is connected and then adjusts the tolerance band. This is similar to injecting probing signals by control signal modulation for system identification purposes [51]. The local implementation eliminates the need for communication and corresponds to less complexity which is important for power system operators. Another proposed control method is model based and predicts the voltage change before the reactor connection from associated bus short circuit power. Then the tolerance band adjusts beforehand. This approach could not be implemented locally but the essential data needed, associated bus short circuit power, is available at the TSO control center.
Application of both proposed control methods eliminates reactor hunting while keeping the automatic operation for shunt reactors. This speeds up the restoration process. For more details see chapter 3 and paper I.
Fig. 3: Voltage fluctuation caused by reactor hunting phenomenon during power system restoration.
2.3 Voltage Control during System Operation
The second challenge addressed in the thesis is related to voltage control issues during power system operation. So we are looking for methods to improve the
14

15
current challenges and enhance the voltage control in the system. To do so, first it is important to know the definition of the voltage stability. This is important since usually the goal of improving the voltage control is to enhance the voltage stability in the system. Voltage stability refers to the ability of a power system to keep all the bus voltages within the acceptable limits during both normal and emergency conditions [52]. It depends on the network structure. Two time frames are normally considered relating to dynamics in the time-scale of seconds and several minutes [53]. It means this type of stability could be either short-term or long-term. Here we focus on the long-term voltage instability since for the Swedish power system it is the main concern. This type of instability usually occurs in heavily stressed systems.
To gain conceptual understanding of the voltage stability, the following radial system is considered. This basic circuit represents a large system connected by lossless transmission line to a load bus.
Fig. 4: Basic circuit represents a large system connected by lossless transmission line to a
load bus.
The following equation relates the voltage at load bus (V) with respect to the line reactance (X), sending end voltage (E) and active and reactive powers delivered to the load bus (P, Q):
XQEPX4
E
2
EXQV 222
42
(1)
Based on the Eq. 1, the PV-curves for different load angles ( ) are plotted in Fig. 5 while E=100 kV and X=100 .
The operating points above the critical points (maximum power transfer) represent normal operating conditions [27]. Based on the Fig. 5, it could be said that the reactive power influences the voltage stability and also the maximum capability of the line which corresponds to impedance matching condition. The impedance matching concept has been widely used as a basis for voltage stability monitoring [54].
15

16
Different actuators can be used to improve the voltage control and voltage stability in power systems including transformer tap changers [29], synchronous generators [29], VSC-HVDC links [32], SVC [29] and reactive shunts [29].
Fig. 5: PV curves for different load angles; P+jQ=S( cos + sinj ).
The application of reactive shunts to control the voltage has increased because they are relatively economical, easy and quick to install in power systems [55]. Moreover, VSC-HVDC is considered as new flexible control technologies to improve power system performance [56]. Active and reactive power of the VSC-HVDC links can change rapidly within its capability curve and can be controlled independently. This makes it possible to modulate the power flow in the system and support the power system with the best mixture of active and reactive power during stressed conditions [57]. Both reactive shunts and VSC-HVDC are used as actuators in this thesis to improve the voltage control in power systems.
For the reactive shunts, the common control practice which is used by TSOs is called the local scheme [58]. This scheme switches the shunts when the voltage is out of a tolerance band, typically [0.95-1.05] pu [27], at the local bus. This control scheme is established since a very long time but it cannot guarantee the voltage control and stable voltage in all situations [59]. Therefore other alternative schemes are of interest for power system operators to improve voltage control in the system.
In this thesis we propose the neighboring scheme as alternative to the local scheme to control the reactive shunts. In this strategy both the local voltage and the voltage at neighboring buses are considered. The neighboring bus voltages are estimated based on the measurements at the local bus. So the voltage control can still be implemented completely locally meaning that the proposed approach like the local
0 10 20 30 40 50 60 70 800
20
40
60
80
100
120
Active Power P [MW]
Volta
ge V
[kV
]
Locusofcriticalpoints
=10=20=0
=-10=-15
16

17
scheme is still communication free. This is important feature from implementation standpoint in reality. Actually the differences between local and neighboring schemes are small but the proposed neighboring scheme still gives better performance in the sense of suppressing the disturbance effects and improving the voltage control. For more details, see chapter 3 and paper II and III.
For VSC-HVDC links, some research efforts have been devoted to use its capability for voltage control and voltage stability improvement [56], [57], [60] while mainly the VSC-HVDC active-reactive power set-points are fixed regardless of the strength of the disturbances. This strategy is not the best one as it would be shown later in chapter 4 and paper IV.
In this thesis we consider a strategy to control the active and reactive powers of VSC-HVDC links with respect to the VSC converter capability curve to improve the voltage control in the system. The main idea is that the VSC-HVDC link active power control mimics the behavior of a parallel AC line while the remaining converter capacity goes to the reactive power that supports the voltage. To trigger the power flow controller of the VSC-HVDC link, the voltages at transmission buses in the system are monitored continuously. Based on the considered strategy, the active-reactive power set-points are not fixed anymore and they depend on the strength of the disturbances. The goal is to reach the best condition from voltage control and in particular the long-term voltage stability standpoint and possibly avoid the large scale blackouts in power systems.
Both of the above proposed approaches for reactive shunts and VSC-HVDC links control need a framework to evaluate their performances. So here we need appropriate power system models to study the voltage stability related issues. As stated in chapter 1, there are some relevant models including SLIB [27], the Carson Taylor test system [29] and the NORDIC32 test system [30], [31].
The NORDIC32 test system is developed to capture the key long-term dynamics of Swedish national power system and is suitable to simulate long-term voltage collapses like what happened in 1983 and 2003 in Sweden [31]. Although NORDIC32 is a reduced order model of the Swedish power system, it is still a complex test system.
In this thesis we propose the N3area test system which is the simplest test system that can replicate the long-term voltage dynamics of NORDIC32 and the Swedish power system. The main advantage of the N3area test system is that it reduces NORDIC32 model complexity, so long-term voltage instability behaviour and countermeasures can be analyzed much easier there than in NORDIC32, still
17

18
retaining a dynamic behaviour quite close to NORDIC32 and reality. For more details, see chapter 3.
2.4 Inter-area Oscillations in Power Systems
The last problem addressed in the thesis is related to power system oscillations. One type of such oscillations is called inter-area oscillations [33]. We focus on this type of oscillations because the power systems are getting more and more interconnected and these oscillations are becoming a concern for many TSOs around the globe.
The first inter-area oscillations experienced in the Nordic system did occur in 1960. Today such oscillations still could be problematic for the Nordic system since one restrictive factor which may affect the transfer capacity from Finland to Sweden in some operational situations is the damping of inter-area oscillations between these two countries [61].
These oscillations are actually the active power oscillations among the participating generators which are usually interconnected by weak tie-lines. This phenomenon usually includes many generators in power systems.
The damping of inter-area mode [52] depends on the tie-line power flow, load characteristics and the interactions of loads with the dynamic of the generators and their associated controls [62]. The immediate impact of such oscillations is to limit the transfer capacity of the transmission lines as mentioned for Finland-Sweden case [61]. They might also lead to system break up as it did happen during the 1996 western North America blackout [35].
To give better explanation of the inter-area oscillations, a generic two-area test system is considered in Fig. 6.
1G 2G1P 2P
ACPT1d11 XX'X T2d22 XX'X 3X1E
1V 2V2E1
1 22
Fig. 6: Generic two-area power system. M1=9.26 MJ/MVA , M2=8 MJ/MVA, D1=D2=2
p.u./(rad/s). With p.u. magnitudes: X1=X2=0.25, X3=0.35, P1=P2=PAC=1, E1δ1=1.080°, E2δ2=1.08-46°, V1θ1=1-13°, V2θ2=1-33°.
To excite the inter-area mode, the G1 mechanical power is changed 5% for 100 ms at t=1 s. This represents a small disturbance for the system.
18

19
For a transmission line, the inter-area oscillations are best observed in the line active power flow. They can also be observed in bus voltage and bus frequency [61]. So the AC line (tie-line) active power flow is selected to show the inter-area oscillations, see Fig. 7. As it can be seen, the oscillations are poorly damped. These oscillations must be avoided in power systems and be damped as soon as possible. To reach this goal, the damping control of the inter-area mode in the system should be improved.
Fig. 7: AC line active power following the impulse disturbance in G1 mechanical power (5% for 100 ms).
Since the inter-area oscillations are actually the active power oscillations among the participating generators, then direct active power modulation through actuators like VSC-HVDC and Energy Storage (ES) may improve the damping control in the system. Indirect active power modulation through actuators like SVC could also positively contribute to damp out the oscillations.
One control scheme which is treated in reality today for HVDC links to improve the damping of inter-area oscillations is proportional control of active power with local frequency difference as input. It has been already utilized for Fenno-Skan link between Finland and Sweden [63], in China southern power grid [40] and for Pacific DC intertie in USA [64] which all are Current Source Converter-HVDC (CSC-HVDC) links. This control scheme can be applied to VSC-HVDC links also to ES damping controller and can be translated to SVC damping controller as well. For the SVC case, the proportional control of reactive power with time derivative of local voltage magnitude as input is used instead.
One good feature of this type of damping controller which motivates us to utilize it in this thesis is using the local feedback signals instead of wide-area measurement
0 5 10 15 20 25-0.02
-0.01
0
0.01
0.02
Time (s)
AC
line
act
ive
pow
er (
pu)
19

20
based feedback signals. This is important because the local feedback signals are more robust against communication failure and network changes compared to wide-area measurement based feedback signals [65]. Also they do not correspond to huge data exchange in the system which contributes positively to less complexity in power systems.
Moreover, this type of damping controller needs no phase compensation and the main challenge is to select the optimum gain to achieve the maximum damping. Generally the gain selection task is done through visual inspection of a root locus or through optimization [65]–[70].
In this thesis, we propose the impedance matching based gain selection approach for the VSC-HVDC, ES and SVC damping controllers. It selects the optimum gain which gives the maximum damping ratio for the mode with the greatest mode observability and controllability in the system which depends on the actuator location. Other modes are not negatively impacted. This leads to well-damped system response following the disturbances.
Compared to the root locus visual inspection or application of advanced optimization methods for gain selection, the proposed approach based on the impedance matching application is simpler for implementation in reality and it could lead to a self-tuning controller. This is important since the operating points in power system are always changing. So the proposed approach can adjust the gain of damping controllers to follow the maximum damping once the operating points change in the system.
2.5 Summary
In this chapter the main problems addressed in the thesis are presented. First a short description of each problem is provided, and then the left gaps to either propose better control schemes, simpler models or better controller tuning approaches related to the considered problems in the thesis are explained. Then we propose what we came up as solutions in the thesis to target those problems. In all cases, we try to avoid increasing the complexity in power systems as much as possible and also we consider the implementation issues to make all the improvements in the thesis be more understandable and trustable by TSOs. Actually the complexity reduction and considering the TSOs’ interests are two important elements which tie up different parts of the thesis. In next chapters, to address the problems, the solutions proposed in the thesis are provided in more details.
20

21
3.Reactive Shunts for Voltage Control
In this chapter, the considered problems in the thesis related to voltage control in power systems are addressed. The first part goes to voltage control during the power system restoration which relates to appended paper I and also the Licentiate thesis [26]. The second part investigates the voltage control issues during power system operation which relates to appended papers II and III and also the Licentiate thesis. The connecting goals of the thesis which are stated in the previous chapter including the complexity reduction in power systems and considering the TSOs’ interests are respected in this chapter as well.
3.1 Reactive Shunts for Voltage Control during Restoration
During the power system restoration, if the build-down strategy is carried out, then as described in chapter 2, the reactor hunting might happen. This is a voltage control issue during the restoration process which must be handled.
To avoid reactor hunting, the control method proposed in this thesis is instead of having fixed tolerance bands for the shunt automatics, they can be flexible and adaptive based on the network strength. In fact the EVA settings will change based on the operating condition and automatic operation of the shunts can continue during the restoration time. This speeds up the restoration process.
One indicator for the network strength is the short circuit capacity. To employ the short circuit capacity to frame the adaptive tolerance band concept, we need an
21

22
approximate formula to relate the short circuit capacity to the voltage and reactive power changes. This approximate formula is presented in Eq. 2 for a lossless transmission line which is going to be energized from a sending point with voltage E.
sc
2
S
Q
21
EV
(2)
V is the receiving point voltage, is a constant value greater than 1, Q is the amount of nominal reactive power change from shunt reactor connection at the receiving point of the line and Ssc is the short circuit power of the receiving point bus. The detailed descriptions to derive Eq. 2 and also about are explained in paper I.
To use the Eq. 2 in power system restoration, the short circuit power of the node that would be energized must be known. The required short circuit power is available for TSOs. The method to calculate this short circuit power is thoroughly explained in paper I.
The Eq. 2 can be employed during the restoration process to predict the bus voltage after the shunt reactor connection. Then before the reactor connection, the EVA setting of the shunt reactors can change accordingly to avoid reactor hunting. This approach to avoid the reactor hunting is called the prediction method. See paper I for further details of the prediction method.
The second approach to avoid the reactor hunting proposed in the thesis is called the observation method. In contrast to the prediction method, the observation method is model free and can be implemented locally based on the voltage change measurement at the buses in the system. First the shunt reactor at the targeted bus is connected, then the voltage change measurement (deltaV) is noted and the shunt automatic threshold band is adjusted based on this. As stated in chapter 2, this approach mechanism is similar to injecting the probing signals for system identification purposes.
To avoid reactor hunting, the tolerance band lower limit for the shunt automatics will change based on the measured deltaV. The upper limit is skipped to avoid further voltage increase. The adjusted lower limit is set to be below the low measured voltage to have a safe margin for avoiding the reactor hunting. The simplified description of the observation method is illustrated in Fig. 8.
22

23
Fig. 8: Observation method concept.
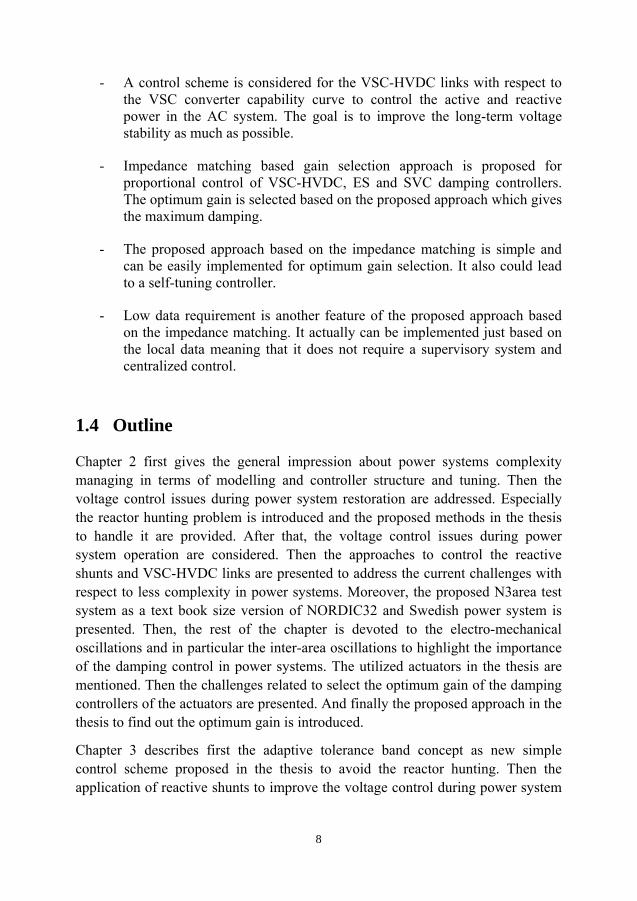
To evaluate the observation and prediction approaches for reactor hunting avoidance, the NORDIC32 test system is used and two random restoration strategies are considered. The first considered restoration path is as following and pointed out by the red track in Fig. 9.
BE then ED then DF then FH.
BE means the bus E (4041) is energized from bus B (4031) in Fig. 9 and so on. In case of existing two parallel transmission lines between two buses, only one of them will be energized.
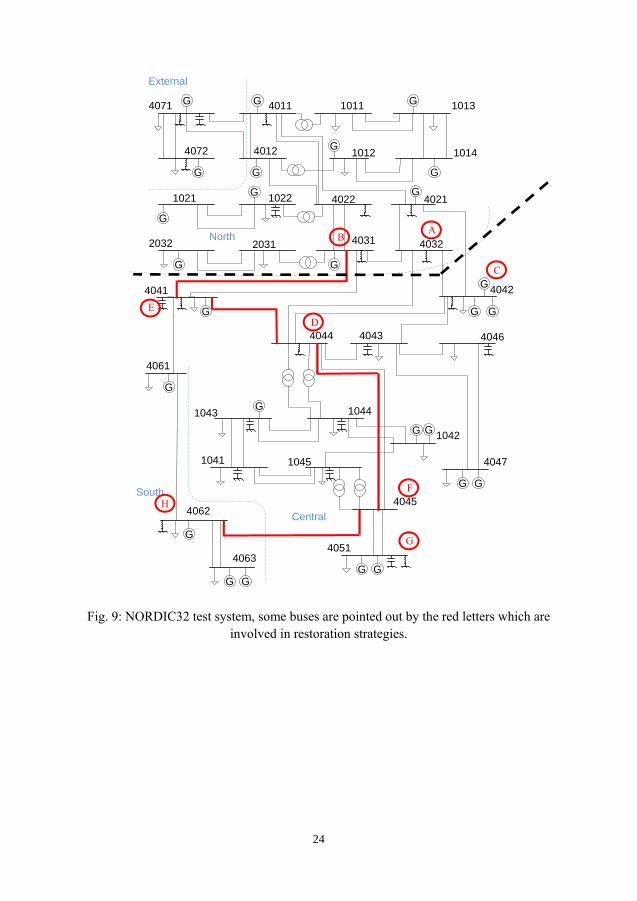
After following the first path at the end the transmission line between buses 4045 and 4062 in Fig. 9 is energized. Fig. 10 shows the reactor hunting at bus 4062 (H) when the line 4045-4062 is connected at t=10 s and with the default tolerance band.
During normal operation, the tolerance band for shunt automatics is usually set to [380-420] kV for the 400 kV transmission system [27]. During the restoration time, the upper limit of the tolerance band is usually increased to create a safer margin for avoiding reactor hunting. The new upper limit is set to 440 kV [25].
23
24
G4071 4011 1011 1013
1014101240124072
1021 1022 4022 4021
4032
4042
4046
4047
40434044
4041
2032 2031 4031
4061
1043 1044
1042
10451041
4062
40634051
4045
External
North
South
Central
G G
G
GG
G
G G
G
G
G
G
GG
G
G
G
GG
G G
GGGG
G
Fig. 9: NORDIC32 test system, some buses are pointed out by the red letters which are involved in restoration strategies.
B A
H
E
F
G
D
C
24
25
Fig. 10: Reactor hunting at bus 4062 for the first restoration path while the default
tolerance band is used.
To avoid reactor hunting at bus 4062, the corresponding short circuit power is utilized in Eq. 2 while the nominal value of the shunt reactor is considered for the reactive power change, sending point voltage is considered 400 kV (1 pu) and
15.1 . After that the tolerance band lower limit is adjusted and set to 364 kV based on Eq. 2. A simulation using the adjusted tolerance band is shown in Fig. 11. As it can be seen in this figure, the reactor hunting is eliminated using the proposed prediction method. It is also clear that there is a safety margin for the tolerance band lower limit adjustment and this is because of including the term in Eq. 2.
Fig. 11: No reactor hunting at bus 4062 for the first restoration path after applying
prediction control scheme.
0 10 20 30 40 50 600
200
380
440
520
Time (s)
Vol
tage
(kV
)
4031
4041
4044
4045
4062
0 10 20 30 40 50 600
200
364
440
520
Time (s)
Vol
tage
(kV
)
4031
4041
4044
4045
4062
25

26
For further analysis of the prediction method and also to see how the tolerance bands reset to their default values based on the prediction method once the power system is getting stronger, see paper I.
To evaluate the performance of the observation method, the second restoration path in Fig. 9 as following is considered:
BE then ED then DF then FG.
Fig. 12 shows the reactor hunting at bus 4051 (G) while the default tolerance band for the restoration is used. In this figure, the transmission line between buses 4045-4051 is energized at 10 s.
By applying the proposed observation method, the reactor hunting is removed at bus 4051 as it is shown in Fig. 13. The new lower limit based on the observation method is set to 356 kV and is shown in this figure.
Fig. 12: Reactor hunting at bus 4051 for the second restoration path while the default tolerance band is used.
0 10 20 30 40 50 600
200
380
440
520
Time (s)
Vol
tage
(kV
)
4031
4041
4044
4045
4051
26

27
Fig. 13: No reactor hunting at bus 4051 for the second restoration path after applying
observation control scheme.
For further details of the observation method and also for the comparison between the observation and prediction methods, see paper I.
3.2 Reactive Shunts for Voltage Control during Operation
Reactive shunts are considered as traditional reactive sources to improve the voltage control and voltage stability in power systems [71], [72]. Switching of them to control the voltage usually occurs quite frequently in power systems [73]. The common practice used by TSOs to control the reactive shunts is the local scheme. This scheme switches the reactive shunts when the voltage at the local bus is outside the tolerance band. In this thesis, we propose the neighboring scheme as improvement to the local scheme. Both the local and neighboring bus voltages are considered for reactive shunts switching in the neighboring scheme. So by applying this scheme, a shunt element will respond to voltage deviations both at its own bus as well as at the neighboring buses. This scheme potentially leads to more or sooner action from the shunt reactors and capacitors. This eliminates some action from tap changers in the system since the transmission level voltage recovers. This reduces the need for reactive power transfer through the nearby lines and associated additional loading. Consequently it could improve the voltage control in the system.
The main concept of the proposed algorithm is illustrated and compared with the local scheme in Fig. 14 for the case of low voltage. With the local scheme, the local reactive shunt is just sensitive to the local bus voltage (Vi). But in the
0 10 20 30 40 50 600
200
356
440
520
Time (s)
Vol
tage
(kV
)
4031
4041
4044
4045
4051
27

28
neighboring scheme, once either the local or a neighbor bus voltage is below the lower limit, then reactive power injection will increase at the local bus. Increasing reactive power injection corresponds to first reactor disconnection and then capacitor connection.
The neighbor bus means the bus(es) at the remote end of any line(s) connected to the local bus as shown in Fig. 15. As it can be seen, for the neighboring scheme, the voltages at the neighboring buses are estimated at the local buses. This means that the proposed neighboring scheme can be implemented locally which makes it communication free. For more details on the implementation of the neighboring scheme, see paper II.
Fig. 14: Basic flow chart of the local (left) and neighboring (right) methods for control of reactive shunts for the case of low voltage. For the neighboring scheme, shunts at bus i
(local bus) are controlled using voltages at bus i and the neighboring buses j, j+1 and j+2. Increase Qinjection corresponds to first reactor disconnection and then capacitor connection.
28

29
Fig. 15: For a local bus i with three neighbors j, j+1 and j+2, the local scheme (top) uses only voltage at bus i while the neighboring scheme (down) uses also voltage at neighbor
buses j, j+1 and j+2.
To evaluate the performance of the local and neighboring schemes, the NORDIC32 test system is considered and different instability scenarios are applied.
One instability scenario applied on NORDIC32 is tripping of one generator at bus 4047 at 60 s, see Fig. 9. The local and neighboring schemes are implemented in the NORDIC32 test system in Advanced Real-time Interactive Simulator for Training and Operation (ARISTO) [74]. ARISTO is a real-time simulator used by the Swedish TSO. The detailed model of NORDIC32 is available in ARISTO. The minimum voltage level for shunt actions is set to 395 kV, which is 5% below the operating voltage level of 415 kV used by the Swedish TSO [25]. Fig. 16 shows the voltage curves for the neighboring and local schemes at bus 4044 which is located in the Central area.
29

30
Fig. 16: Voltage at bus 4044 in NORDIC32, for the local scheme (red) and for the neighboring scheme (green) for the generator outage scenario. Dashed lines indicate
voltage tolerance limits.
Following the disturbance and after the short-term dynamics, the long-term dynamics including the tap changer, Over Excitation Limiter (OXL) actions and the load dynamics [27] take over the system behaviour. All of these dynamics lead to lack of the reactive power in the system.
To compensate the lack of the reactive power, there are some connections and disconnections of the reactive shunts in the system. Both of the local and neighboring schemes lead to reactive shunts actions in the system. In Table 1, the reaction time spent to connect the first and second capacitors for the local and neighboring schemes are shown. This is important since the system is lack of the reactive power and connecting the capacitors compensates that. To see more details on the description of Fig. 16, see paper II.
Table 1: Reaction time for capacitors connection for generator outage scenario
Conditions Bus Time (Sec)
Neighboring Local
First capacitor 4041 64s 109s
Second capacitor 4051 321s 1584s
Application of the neighboring scheme results in sooner action of the capacitors. This corresponds to higher voltage level and more reactive power injection from the capacitors. To find out more details on the analysis of the local and
0 200 400 600 800 1000 1200 1400 1600 18000
100
200
300
395420
Time(s)
V(k
V)
30

31
neighboring schemes and why the local scheme application leads to voltage collapse, see paper II.
More instability scenarios are conducted on NORDIC32 test system including the line tripping, see paper II. In all cases the application of the neighboring scheme gives better or the same performance as the local scheme.
The PV curve analysis and also the modal analysis are conducted to investigate why the neighboring scheme application leads to better performance in the dynamic simulations. For more detailed descriptions, see paper II.
3.3 N3area Test System
In the previous part, the NORDIC32 test system is utilized to evaluate the local and neighboring schemes performances. As stated earlier in chapter 1, although NORDIC32 is a reduced order model of the Swedish national power system but still is a complex test system.
In this thesis we propose N3area test system, a text book size version of the NORDIC32 test system, which captures the long-term voltage stability behaviour of NORDIC32. It reduces NORDIC32 model complexity while maintaining reasonable accuracy in dynamic simulation results. This test system is shown in Fig. 17 and Table 2 and is modeled in PowerFactory [75] to make it more general than NORDIC32 in ARISTO. Applying complex control schemes on N3area is much easier than the NORDIC32 test system.
Like NORDIC32, the main generation area is located in the northern part, while the main load area is placed in the central part. G1 and L1 represent the northern part which is an export area, G2 and L2 represent the southern part of NORDIC32 which is an import area while G3 and LB represent the central part of NORDIC32 which is a mixture of load and generation areas.
31

32
1L
AL
BL
CL
2L
A
B
C
1G
2G
AC
BC
CC
3G
Fig. 17: N3area test system.
Table 2: Load flow parameters of N3area test system
Component MW Mvar Component MW Mvar
G1 2000 Slack bus LA,LC 100 50
G2 50 PV bus LB 1500 550
G3 100 PV bus CA - 100
L1 200 100 CB - 200
L2 125 75 CC - 150
The N3area test system is supposed to replicate the long-term voltage stability behaviour of NORDIC32. So the main factors to study the long-term voltage instability including the load dynamics [76] and OXL action [77] must be included in the N3area test system.
The load model used for the N3area test system is the multiplicative generic load model. The equations describe the model are provided as follows [27]:
t
0p0 )
V
V(ZPP (3)
t
0q0 )
V
V(ZQQ (4)
32

33
t
0p
s
0
pp )
V
V(Z)
V
V(
dt
dZT (5)
t
0q
s
0
qq )
V
V(Z)
V
V(
dt
dZT (6)
Where P and Q are the active and reactive power consumed by the load respectively, while P0 and Q0 are their initial values. V is the load voltage with initial value V0. Zp and Zq are dimensionless state variables, t and t are transient load exponents, s and s are steady state load exponents and Tp and Tq are recovery time constants for active and reactive power respectively [78]. Digsilent Simulation Language (DSL) is used to implement the load dynamic model.
Parameters for the load model implemented in N3area are given in Table 3 [79]. In this thesis, these parameters are selected to replicate the thermostatic load behavior which is dominant in Sweden due to a large amount of electrical heating [79].
Table 3: Load dynamic model parameters [79]
Tp Tq αt αs βt βs
127.6 s 75.3 s 2.26 0.38 5.22 2.68
Moreover, in the N3area test system, all the generators are equipped with OXL protection. The block diagram model of the OXL implemented is shown in Fig. 18 [27]. DSL is used to implement this model.
1*22
1*12
01
xSx
otherwise
xSx
xif
s/1
0
0
tx
tx
siK /
)1( )2()3(
)4(
0
fdi
1k
2k
rk
3x
limfd
i
oxlx
2x1x tx
Fig. 18: OXL model implemented in PowerFactory [27].
Based on the Fig. 18, if the excitation current is bigger than the predefined limit, the timer (block 2) will be activated. After K1 seconds, the xt signal goes positive and then the xoxl signal is injected to AVR to enforce the field limit. Block 1 implements the inverse time characteristic of the controller so that higher
33

34
excitation current deviation leads to sooner action from limiter. S1, S2, K1, K2, Kr and Ki are constant positive values which are given in Table 4.
Table 4: OXL model parameters used for N3area test system
S1 S2 K1 K2 Kr Ki
3 2 20 5 5 0.01
Based on Fig. 18, once the field current is above the rated value, after a waiting time, xt goes positive. This waiting time or switching time could be derived by the following equation [27]:
IS
KT
1
1sw (7)
Also Kr and S2 force xoxl to be reset when fdfd ii lim .
When both the load dynamics and OXL action are embedded in the N3area test system, then its performance to replicate the NORDIC32 test system behavior in long-term voltage stability context should be evaluated. This is carried out in paper III. Based on the simulation results provided in paper II for NORDIC32 test system and paper III for N3area test system, it can be said that the N3area test system provides simulation results very similar to the NORDIC32. In both test systems, the voltage is lowest in the central part. Also, by applying the neighboring scheme, more capacitor connections are doable compared to the local one in both test systems. These results verify the capability of the proposed N3area as a simplified test system to emulate the long-term voltage instability behavior of NORDIC32 and the Swedish power system.
3.4 Summary
In this chapter the considered problems in the thesis related to voltage control in power systems are presented. First reactor hunting which is a real problem occurred during the 2003 Swedish/Danish blackout is addressed and two control methods are proposed to solve it. One is model based but needs data which is available for TSOs and the second one can be implemented completely locally. Then the application of reactive shunts to improve the voltage control is investigated. Also the common control algorithm for reactive shunts used by TSOs is presented and the proposed control algorithm in the thesis to improve the established one is introduced. The proposed control algorithm let the voltage
34

35
control can still be completely locally which needs no communications and supervisory control. Finally to reduce the NORDIC32 test system complexity, a simplified text book size version of it is proposed, called the N3area test system. This test system can emulate very well the long-term voltage instability behavior of the NORDIC32 test system. In all there parts of this chapter, the plan was first to solve the issues locally if possible otherwise proposing methods which require available data for TSOs. Moreover, complexity reduction as much as possible is also considered for all parts of this chapter especially for the last section.
35

36
36

37
4.VSC-HVDC for Emergency Voltage Control
In this chapter, the application of VSC-HVDC technology is investigated for voltage control during emergency conditions and a control strategy is considered for VSC-HVDC links to improve the long-term voltage stability. The work presented here relates to appended paper IV.
4.1 VSC-HVDC for Voltage Control
A VSC-HVDC system includes two Voltage Source Converters (VSCs) with the same configuration. Each of the converters has two degrees of freedom. One degree in each converter is used to control the reactive power, and other degree is used to control the active power or DC voltage [80].
This new technology has many benefits over the conventional HVDC transmission system, CSC-HVDC system. One main feature of the VSC-HVDC transmission is that it has the ability to almost instantly change its working point within its capability curve and control active and reactive powers independently [81]. This can be used to support the grid with the best mixture of active and reactive power during stressed conditions and contribute positively to improve the long-term voltage stability [32]. In this thesis, we utilize this capability to inject the best mixture of active and reactive power to improve the long-term voltage stability in the system.
37

38
The South-West link which is currently being built in Sweden is considered as VSC-HVDC link in the NORDIC32 test system, see Fig. 19. As stated in chapter 1, this link is a mixture of AC overhead line and DC underground cable. The DC part consists of a 250 km long DC connection with a transfer capacity of 1200 MW [15]. The South-West link is scaled down to fit the NORDIC32 test system. The rating of the implemented South-West link in NORDIC32 for active power is 600 MW, AC voltage is 370 kV and the DC voltage is 300 kV.
G4071 4011 1011 1013
1014101240124072
1021 1022 4022 4021
4032
4042
4046
4047
40434044
4041
2032 2031 4031
4061
1043 1044
1042
10451041
4062
40634051
4045
External
North
South
Central
G G
G
GG
G
G G
G
G
G
G
GG
G
G
G
GG
G G
GGGG
G
Fig. 19: The NORDIC32 test system with the South-West link between buses 4032 and
4045. The red transmission line is out of service and red generator would be tripped during the dynamic simulation.
38

39
4.2 Control Strategy and Simulation Results
The control scheme applied for the VSC-HVDC link is based on the following descriptions.
First the voltages at all transmission buses (4041, 4042, 4043, 4044, 4045, 4046, 4047 and 4051 in Fig. 19) in the central area are monitored continuously. Once the voltage for the majority (at least five) of them is below a lower limit (0.95 pu), this is considered as a stressed situation and then the power flow controller of the VSC-HVDC link changes the power flow to improve the long-term voltage stability of the AC system. The active and reactive power of the VSC-HVDC link are ramped up/down to change the power flow based on the following equations [82]:
)δ(δsin.VIP 212itlimdc (8)
)δ(δcos.VIQ 212itlimdc (9)
Bus 1 is the bus 4032 and Bus 2 is the bus 4045 in Fig. 19. Ilimit is the maximum steady state AC current allowed in the converter, V2 is the AC voltage magnitude at bus 4045 and 1δ is the AC voltage angle at bus 4032 and 2δ is the AC voltage angle at bus 4045. Based on Eq. 8 and 9, the active power of the DC link is controlled in a way to mimic an AC line and the remaining converter capacity is used for the reactive power.
The ramp up/down rate for active power is set to 30 MW/min [25]. This rate seems to be slow, but this is because the Swedish TSO wants to be sure that the ramp action will not lead to further stress on the system. For the reactive power, the ramp up/down is set to 50 Mvar/min [25]. For further details about the VSC-HVDC link control see paper IV.
The considered long-term voltage instability scenario to evaluate the control strategy is the combination of transmission line and generator outages. In fact, first it is assumed that the transmission line between buses 4032 and 4042 is out of service. Then one generator at bus 4047 is tripped at t=150s, see Fig. 19.
The voltages at the south area are shown in Fig. 20. As it can be seen, with fixed set points for the active and reactive powers of the VSC-HVDC link, the long-term voltage collapse ultimately happens.
39

40
Fig. 20: Voltage at different buses of the southern part of NORDIC32 test system when the VSC-HVDC link is in place without active reactive powers ramp function.
To improve the long-term voltage stability, based on the Eq. 8 and 9, the active and reactive power set points of the VSC-HVDC link are changed. As mentioned, the instability indicator is voltage magnitude at all buses in the central area. Then once the trigger signal is sent to change the power flow, the active and reactive power of the VSC-HVDC link are ramped down/up respectively based on the Eq. 8 and 9 to inject the best mixture of active and reactive power to the AC system. For more details see paper IV.
Fig. 21 shows the active power transferred by the transmission lines placed between the northern and central areas also the active power of the converter placed at bus 4032 and reactive power of the converter placed at bus 4045. As it can be seen, the active power transferred by the VSC-HVDC link is decreased and on the other hand the reactive power of the DC link is increased based on the Eq. 8 and 9. The power flow change in the system helps to prevent the long-term voltage collapse as is shown in Fig. 22.
0 500 1000 1500 2000 25000.7
0.75
0.8
0.85
0.9
0.95
1
1.05
Time (s)
Vol
tage
(pu
)
4061
4062
4063
40

41
Fig. 21: Active powers for the transmission lines connecting the northern and central areas and for the converter at bus 4032 and also reactive power of the converter at bus 4045.
Fig. 22: Voltage at different buses of the southern part of NORDIC32 test system when the VSC-HVDC link is in place with active reactive powers ramp function.
For further details and more instability scenarios, see paper IV.
What we have done here might be a bit away from communication free system which is one connecting goal of different parts of the thesis for less complexity in power systems wish. We need communication here since we need to monitor the transmission level buses at the central area. The transmission level buses monitoring is necessary to detect the stressed conditions in the system. Apart from this, the rest of control strategy considered here for the VSC-HVDC links can be implemented locally. Also, to reduce the communications, considering a pilot bus [83] in the central area might be useful.
0 500 1000 1500 2000 2500 30000
100
200
300
400
500
600
700
800
Time(s)
Act
ive-
Rea
ctiv
e P
ower
s(M
W,
Mva
r)
Line 4021-4042
Converter 4032
Converter 4045
Line 4032-4044
Line 4031-4041
0 500 1000 1500 2000 2500 30000.94
0.95
0.96
0.97
0.98
0.99
1
1.01
Time(s)
Vol
tage
(pu)
4061
4062
4063
41

42
4.3 Summary
In this chapter, the application of VSC-HVDC links to improve the long-term voltage stability during emergency conditions is investigated. A control strategy is considered for the embedded South-West link in the NORDIC32 test system. The control strategy needs communication to monitor the transmission level buses voltages to detect the stressed conditions. Apart from that, the rest of control strategy can be implemented locally. Also we consider practical limitations and numbers when setting the control strategy which makes it more suitable for implementation in reality.
42

43
5.Damping Control in Power Systems
This chapter first shortly presents the inter-area oscillations in power systems. Then the proposed impedance matching based approach to select the optimum gain for a VSC-HVDC damping controller which relates to appended papers V and VI is presented. Then the application of the proposed impedance matching based approach to select the optimum gain of a single-point active power modulation damping controller (using for example Energy Storage, ES) which relates to paper VII is briefly explained. Finally the application of the proposed impedance matching based approach to select the optimum gain of a single-point reactive power modulation damping controller (using for example SVC) is presented.
5.1 Inter-area Oscillations in Power Systems
There are some advantages with interconnecting power systems including reliability improvement also economical efficiency [84]. For interconnected power systems, the inter-area oscillations are a global problem [85]. These oscillations are observed once a group of generators are connected to another group through a weak tie-line. The inter-area oscillations usually occur following a small disturbance in the power systems but they might also happen during ambient conditions [86]. These oscillations are naturally the active power oscillations among the participating generators in the system [87]. So the active power modulation through appropriate actuators like VSC-HVDC and ES is an effective
43

44
solution to damp out such oscillations. SVC could also be utilized to modulate the reactive power and indirectly modulate the active power.
One important issue when designing the damping controller to damp out the inter-area oscillations is the impact of the controller on other non-targeted modes in the system over the full range of the system operating conditions [88]. Another issue which is important when the achievable damping of the inter-area mode is limited due to nearby-zeros in the associated root locus plot is to set the gain of the controller to reach the maximum possible damping.
Generally, the gain selection task is done through visual inspection of a root locus or through optimization. In this thesis, the impedance matching based gain selection is proposed for VSC-HVDC damping controller, single-point active power modulation damping controller (using ES) and single-point reactive power modulation damping controller (using SVC) to achieve the maximum damping of the inter-area mode. The proposed approach does not impact negatively on other modes in the system as well.
5.2 Impedance Matching for VSC-HVDC Damping Controller Gain Selection
In this part, the optimum gain selection of the VSC-HVDC damping controller is formulated in a way to apply the impedance matching concept. The damping controller of the DC link is based on the control of active power in proportion to the difference in local frequency at the VSC-HVDC converter stations. It can be formulated as:
fKP (10)
Frequency feedback in Eq. 10 leads to damping torque control in the system. To control the synchronizing torque which is not the concern of this thesis, angle feedback must be used instead [89].
As stated in chapter 2, the control law presented in Eq. 10 is already used in reality for the Fenno-Skan link between Finland and Sweden also in China and USA. With a VSC-HVDC link, this control law actually leads to active power modulation at two points in the network. The nature of this type of damping controller needs no phase compensation and is limited to gain selection as concerned in the thesis.
44

45
One good feature about the control law presented in Eq. 10 is using the local feedback signals instead of wide-area measurement based signals. The local feedback signals are more robust against the network topology changes and communication failures in the system and thus correspond to less complexity in power systems.
As it can be clearly seen from Eq. 10, the frequency difference at the VSC-HVDC converter stations is what we need to measure to implement the damping controller. Measuring the frequency difference of the VSC-HVDC converter stations is straightforward and easy. One important point here is to achieve the maximum possible damping since with using just the local frequency feedback signals to modulate the active power flow, the damping of the inter-area mode is limited due to nearby-zeros in the associated root locus plot [65].
To maximize the damping of the inter-area mode, we utilize the circuit analogy which is applied in some power systems literature to study the electro-mechanical oscillations [90]. Based on this analogy, the electro-mechanical dynamics of a power system can be translated to a passive LC circuit. Moreover, based on the preliminary idea presented in [68] for active load modulation, the damping controller in power system which follows the Eq. 10 control law corresponds to introducing a resistor in the circuit model. Then maximum damping in the power system corresponds to selecting the resistor in the circuit model using the impedance matching concept. In this thesis, we comprehensively explore this idea and extend it to VSC-HVDC, ES and SVC damping controller optimum gain selection.
To see how this method can be realized, a generic two-area test system with inclusion of a VSC-HVDC link is considered in Fig. 23. The conceptual insight of the optimum gain selection which gives the maximum damping based on the impedance matching concept is presented here based on this simple text book size version test system.
1G 2G1P
DCP
2P
ACPT1d11 XX'X T2d22 XX'X 3X1E
1V 2V2E1
1 22
Fig. 23: Two-area system with VSC-HVDC link.
This test system has appropriate characteristics to study the electro-mechanical oscillations.
45

46
The equivalent circuit model of the generic two-area power system in Fig. 23, is shown in Fig. 24.
1L 3L
HVDCR
2L
2C1C 1i 2i
1V 2V
Fig. 24: Equivalent circuit-model that reproduces the small-disturbance electro-mechanical dynamics of the generic two-area system in Fig. 23.
RHVDC represents the damping control of the VSC-HVDC link.
The first step to apply the impedance matching is to make the power system model in Fig. 23 and the circuit model in Fig. 24 equal from the electro-mechanical dynamic behavior perspective. This has been done as provided in paper VI. Based on the descriptions provided in paper VI, if the circuit parameters are chosen as follows:
s
11
H2C
,
s
22
H2C
, RHVDC=1/K
1
11 K
XL ,
2
22 K
XL ,
3
33 K
XL (11)
then the two models are equal and have the same electro-mechanical dynamic behavior.
Once the power system model is equal with the circuit model, the optimum gain for damping controller is selected based on the impedance matching as described in the following.
Without damping control (K=1/RHVDC =0), the systems in Fig. 23 and 24 are both undamped and when the swing mode is excited, energy will oscillate between the two areas or between the two capacitances. When the damping controller introduces, the swing energy dissipates in the damper, RHVDC. Based on the impedance matching concept, the maximum energy dissipates in RHVDC when RHVDC=RHVDCOPT=|Z| where Z is the complex impedance of the circuit model seen from the terminals of RHVDC evaluated at the resonance frequency.
Without the damper, RHVDC= , the resonance frequency of the circuit in Fig. 24 can be calculated easily. Once the damper is introduced, the resonance frequency changes. To calculate the resonance frequency of the circuit in Fig. 24 with inclusion of the damper, RHVDC, the following simple iterative code is applied.
46
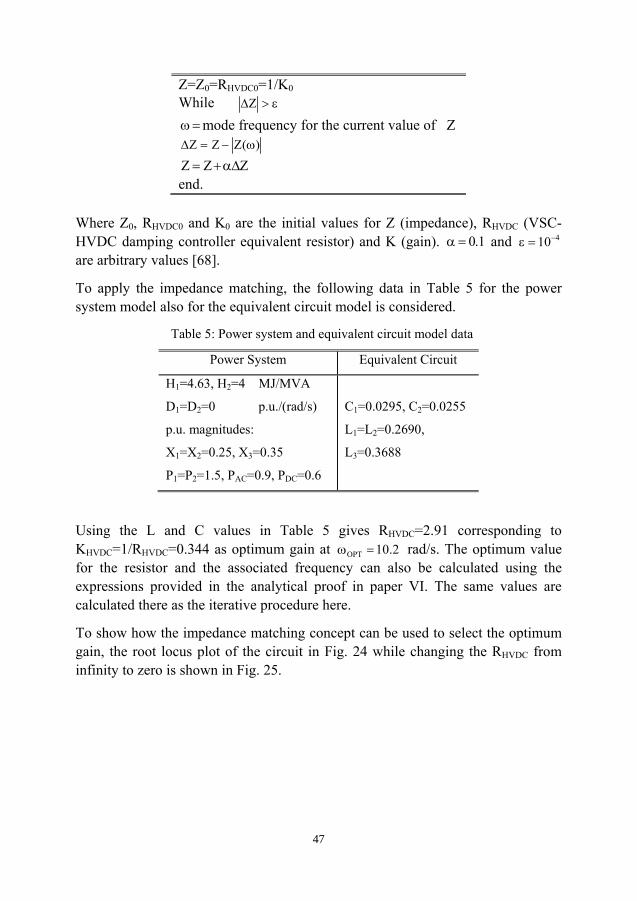
47
Z=Z0=RHVDC0=1/K0 While Z
mode frequency for the current value of Z )(ZZZ
ZZZ end.
Where Z0, RHVDC0 and K0 are the initial values for Z (impedance), RHVDC (VSC-HVDC damping controller equivalent resistor) and K (gain). 1.0 and 410 are arbitrary values [68].
To apply the impedance matching, the following data in Table 5 for the power system model also for the equivalent circuit model is considered.
Table 5: Power system and equivalent circuit model data
Power System Equivalent Circuit
H1=4.63, H2=4 MJ/MVA
D1=D2=0 p.u./(rad/s)
p.u. magnitudes:
X1=X2=0.25, X3=0.35
P1=P2=1.5, PAC=0.9, PDC=0.6
C1=0.0295, C2=0.0255
L1=L2=0.2690,
L3=0.3688
Using the L and C values in Table 5 gives RHVDC=2.91 corresponding to KHVDC=1/RHVDC=0.344 as optimum gain at 2.10OPT rad/s. The optimum value for the resistor and the associated frequency can also be calculated using the expressions provided in the analytical proof in paper VI. The same values are calculated there as the iterative procedure here.
To show how the impedance matching concept can be used to select the optimum gain, the root locus plot of the circuit in Fig. 24 while changing the RHVDC from infinity to zero is shown in Fig. 25.
47

48
Fig. 25: Root locus of oscillatory mode when changing KHVDC=1/RHVDC with pole
locations corresponding to no control (x), zeros (o) and impedance matching (*) indicated as well as lines through (*) and the origin. Plots for circuit model and power system
coincide.
As it can be seen in Fig. 25, the impedance matching gives the pole locations with maximum damping ratio. Damping ratio is used by many TSOs to specify minimum damping; usually 5% [91]. The definition of the damping ratio is, for the pole location at j the damping ratio is calculated as:
22/ (12)
On the other hand, the absolute damping is . To explain better, for the equivalent circuit example, without damping control (K=1/RHVDC =0), the inter-area mode is located at 98.8j , while with the impedance matching controller, it moved to 2.10j54.1 with maximum damping ratio, 14.9%. Regarding the maximum absolute damping, the best location in the root locus plot in Fig. 25 is located at 3.10j55.1 with 14.7% as damping ratio.
The performance of the impedance matching based gain selection approach at different loading conditions is evaluated and the results are provided in paper VI. Based on the results, it can be said that the proposed approach is robust against the operating points change in power systems. For further details, see paper VI.
In real power systems, obtaining the circuit model for the whole network is not an easy task. So an alternative approach for applying the impedance matching without using the circuit model is of interest. To reach that approach, a translation from impedance matching in the circuit context to the power system context is necessary. In the circuit, impedance matching application is straightforward; a voltage tsinu is applied at the terminals of RHVDC, the current amplitude i is measured and RHVDC is set to |Z|= i/u . This can be translated for power system context; the output active power of the VSC-HVDC link is modulated to excite the
48

49
electro-mechanical dynamics in open-loop and then the frequency deviations at the converter stations are measured. Using this, the Bode-magnitude plot, see Fig. 26, of the transfer function from active power input to the frequency deviations at the converters output can be derived. The critical issue then would be at which frequency the Bode-magnitude plot must be read. It can be shown, the analytical proof is available in paper VI, that the relevant frequency is the geometric mean of the open-loop pole frequency P and the frequency of the corresponding zero Z, OPT= ZP . At the geometric mean frequency the Bode-magnitude plot reads 9.29 dB=1/0.343 which gives KHVDC=0.343.
Fig. 26: Gain plot of Bode-diagram of power system in Fig. 23 with VSC-HVDC active power as input and difference in frequency at the converters as output. Indicated
frequencies are P (left), OPT (middle) and Z (right).
To further analysis, the performance of the proposed approach on the Four-Machine Two-Area [52] and NORDIC32 test systems is also investigated which is provided in paper VI.
Moreover, the impact of VSC-HVDC link position on the proposed approach is explored using the NORDIC32 test system, see Fig. 27. For the first position which represents the Fenno-Skan link [61] between Finland and Sweden, between buses 4072 and 4044, the Bode-magnitude plot of the NORDIC32 test system with VSC-HVDC active power as input and difference in frequency at the converters as output is derived and is shown in Fig. 28. Looking at the geometric mean frequency, the Bode-diagram reads -13.92 dB=1/4.96 which corresponds to the optimum gain KOPT=4.96. The critical swing modes of the NORDIC32 test system with Fenno-Skan link are shown in Table 6 with and without the optimum gain. With Fenno-Skan link position, the DC link has the strongest leverage on mode 2 since it has the greatest mode observability and controllability.
10 15
-10
0
10
20
30
Mag
nitu
de
(d
B)
(rad/s)
49
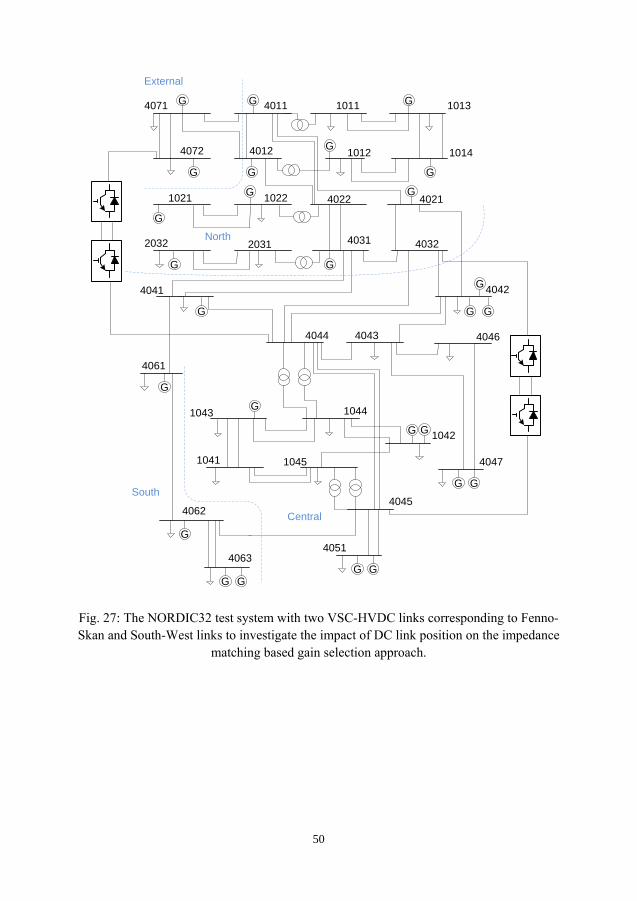
50
G4071 4011 1011 1013
1014101240124072
1021 1022 4022 4021
4032
4042
4046
4047
40434044
4041
2032 2031 4031
4061
1043 1044
1042
10451041
4062
40634051
4045
External
North
South
Central
G G
G
GG
G
G G
G
G
G
G
GG
G
G
G
GG
G G
GGGG
G
Fig. 27: The NORDIC32 test system with two VSC-HVDC links corresponding to Fenno-Skan and South-West links to investigate the impact of DC link position on the impedance
matching based gain selection approach.
50

51
Fig. 28: Gain plot of Bode-diagram of the NORDIC32 test system with VSC-HVDC
active power as input and difference in frequency at the converters as output for the Fenno-Skan link position (left) and the South-West link position (right). Indicated frequencies are
P (left), OPT (middle) and Z (right).
Based on Table 6, the proposed approach improves the mode 2 damping ratio dramatically and other modes are not negatively impacted. This leads to way better performance for the proposed approach compared to no control in the time-domain simulations, see paper VI.
Table 6: Eigenvalues of the NORDIC32 test system; Fenno-Skan Link
Mode Electro-mechanical modes
K=0 K=4.96
Damping ratio, %
K=0 K=4.96
1
2
3
4
5
-0.12 j4.96 -0.20 j4.86
-0.15 j3.77 -0.69 j4.13
-0.28 j6.18 -0.36 j6.21
-0.34 j5.70 -0.34 j5.70
-0.42 j6.13 -0.42 j6.13
2.47 4.12
4.13 16.45
4.59 5.87
5.99 5.99
6.94 6.95
The second position of the DC link, the South-West link, which is installed between buses 4032 and 4045, gives different Bode-magnitude plot and also different eigenvalues as shown in Fig. 28 and Table 7. Reading off the Bode-magnitude plot at the geometric mean frequency gives KOPT=10.63 as optimum gain. Apparently, the optimum gain from proposed impedance matching based gain selection approach cannot change the mode 2 damping ratio sufficiently as shown in Table 7. This is because of the low mode observability and controllability for mode 2, with the new position of the VSC-HVDC link.
2 4 6 8 10
-25
-15
-5
0
Frequency (rad/s)
Ma
gn
itud
e (
dB
)
2 4 6 8 10 12-30
-25
-20
-15
Frequency (rad/s)
Mag
nitu
de
(dB
)
51
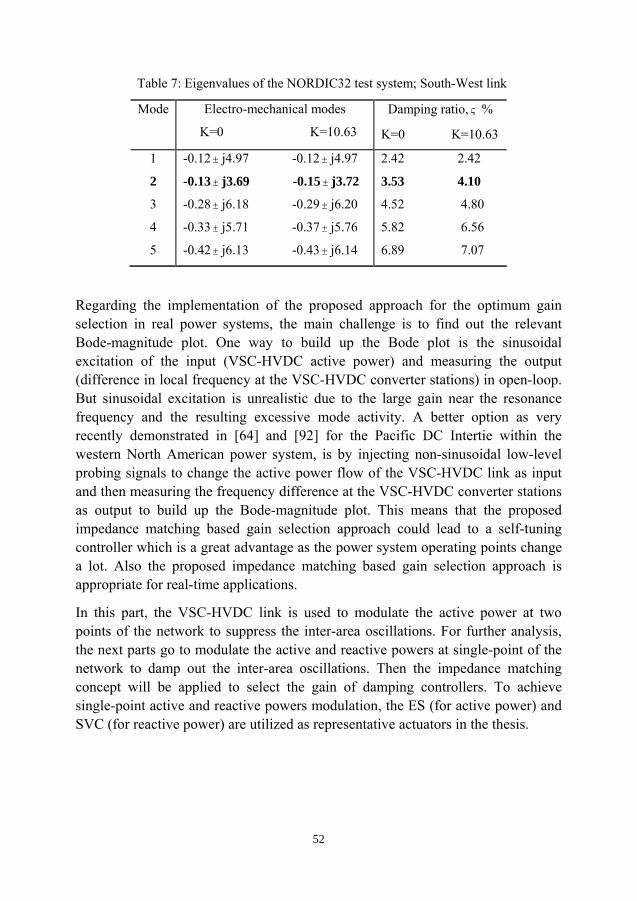
52
Table 7: Eigenvalues of the NORDIC32 test system; South-West link
Mode Electro-mechanical modes
K=0 K=10.63
Damping ratio, %
K=0 K=10.63
1
2
3
4
5
-0.12 j4.97 -0.12 j4.97
-0.13 j3.69 -0.15 j3.72
-0.28 j6.18 -0.29 j6.20
-0.33 j5.71 -0.37 j5.76
-0.42 j6.13 -0.43 j6.14
2.42 2.42
3.53 4.10
4.52 4.80
5.82 6.56
6.89 7.07
Regarding the implementation of the proposed approach for the optimum gain selection in real power systems, the main challenge is to find out the relevant Bode-magnitude plot. One way to build up the Bode plot is the sinusoidal excitation of the input (VSC-HVDC active power) and measuring the output (difference in local frequency at the VSC-HVDC converter stations) in open-loop. But sinusoidal excitation is unrealistic due to the large gain near the resonance frequency and the resulting excessive mode activity. A better option as very recently demonstrated in [64] and [92] for the Pacific DC Intertie within the western North American power system, is by injecting non-sinusoidal low-level probing signals to change the active power flow of the VSC-HVDC link as input and then measuring the frequency difference at the VSC-HVDC converter stations as output to build up the Bode-magnitude plot. This means that the proposed impedance matching based gain selection approach could lead to a self-tuning controller which is a great advantage as the power system operating points change a lot. Also the proposed impedance matching based gain selection approach is appropriate for real-time applications.
In this part, the VSC-HVDC link is used to modulate the active power at two points of the network to suppress the inter-area oscillations. For further analysis, the next parts go to modulate the active and reactive powers at single-point of the network to damp out the inter-area oscillations. Then the impedance matching concept will be applied to select the gain of damping controllers. To achieve single-point active and reactive powers modulation, the ES (for active power) and SVC (for reactive power) are utilized as representative actuators in the thesis.
52

53
5.3 Impedance Matching for Single-point Active Power Modulation
Sing-point active power modulation can be implemented by active load modulation [68], damping from VSC-HVDC connected offshore wind power plants [93] and using actuators like ES [38]. As stated earlier, ES is utilized in the thesis as a representative for the actuators which modulate the active power at single-point in power systems.
To apply the impedance matching concept for the ES damping controller gain selection, the same process as applied for the VSC-HVDC link is carried out. Here the utilized equations to describe the power system and the circuit models are different. Also the analytical proof to find out the near optimum gain is different from the VSC-HVDC case. To see the detailed descriptions of the impedance matching application for the ES damping controller gain selection, see paper VII.
5.4 Impedance Matching for Single-point Reactive Power Modulation
After applying the impedance matching concept to select the optimum gain for two points active power modulation (using VSC-HVDC) and single-point active power modulation (using ES) damping controllers, the concept application is extended to single-point reactive power modulation (using SVC) damping controller.
For the SVC damping controller, the reactive power is modulated and the damping controller is based on the control of reactive power in proportion to the time derivative of the deviation of the local voltage from the nominal voltage. It can be formulated as:
)V(dt
dKQ (13)
where Q is a supplementary damping control signal added to the reactive power set-point, K is the gain of the controller and V is the deviation in local voltage from the nominal voltage.
Here we found empirically that the proposed method based on reading the Bode-magnitude plot at the geometric mean frequency works very well to select the near optimum gain which nearly maximizes the inter-area mode damping. The near optimum gain must be emphasized as like the ES damping controller gain
53

54
selection case. The equivalence of the power system and the equivalent circuit models is not found yet for the SVC case.
The generic two-area power system model with the SVC installed at the middle of the AC line is shown in Fig. 29 and Table 8 to investigate the application of the impedance matching concept for SVC damping controller gain selection.
1G 2Ge1P e2P
ACPT1d11 XX'X T2d22 XX'X
/2X3
1E1V 2V
2E1 1 2
2
SVC
Q
V /2X3
Fig. 29: Two-area system with SVC at the middle of the AC line.
Table 8: Two-area test system data
H1=4.63, H2=4 MJ/MVA
D1=D2=2 p.u./(rad/s)
p.u. magnitudes :
X1=X2=0.25, X3=0.35
Pe1=1,Pe2=-1, PAC=1
E1δ1=1.080°, E2δ2=1.08-46°
V1θ1=1-13°, V2θ2=1-33°
The equations which describe the power system model including the SVC damping controller are presented in the following.
The classic second order generator model is considered for the G1 and G2 [52].
The electrical powers for G1 and G2 can be written as:
)sin()2/XX(
VEP 1
31
11e
(14)
)sin()2/XX(
VEP 2
32
22e
(15)
If we introduce:
11z (16)
54

55
Then:
122 zz (17) The reactive power at the midpoint of the AC line can be presented as:
)2/XX(
V)cos(
)2/XX(
VE2Q
31
2
131
1 (18)
By linearizing the above equations also considering that the SVC damping controller is based on the control of reactive power in proportion to the time derivative of the deviation of the local voltage from nominal voltage as presented in Eq. 13, the following linearized power system model can be derived:
XA)X(dt
d (19)
where the state vector ΔX is:
T121 VzX (20)
and the state matrix A with Di=0 is:
65
bb
43
21
KK00
0022
KK00
KK00
A (21)
K1, K2…K6 are the linearization constants.
To apply the impedance matching for optimum gain selection of the SVC damping controller, the Bode-magnitude plot of the SVC reactive power as input and the time derivative of the deviation of the local voltage from the nominal voltage as output is derived and shown in Fig. 30. Reading the Bode plot at the geometric mean frequency of the open-loop pole frequency and the frequency of the corresponding zero, OPT 8.84 rad/s, gives KOPT=0.46.
55

56
Fig. 30: Gain plot of Bode-diagram of two-area test system with SVC reactive power as
input and the time derivative of the deviation of the local voltage from nominal voltage as
output. Indicated frequencies are P (left), OPT (middle) and Z (right).
The root locus plot of the generic two-area power system model with SVC damping controller is shown in Fig. 31. As it can be seen, the impedance matching application gives nearly the maximum damping ratio for the inter-area mode.
Fig. 31: Root locus of oscillatory mode with pole location corresponding to impedance
matching (*) indicated as well as line through (*) and the origin.
To further investigate the impedance matching based gain selection for SVC damping controller, the Four-Machine Two-Area system [52] while the SVC with 50 Mvar nominal capacity is installed at the midpoint of the AC lines is considered, see Fig. 32.
6 10-15
-10
-5
0
5
10
15
20
25
Mag
nitu
de (
dB)
(rad/s)
-1 -0,8 -0,6 -0,4 -0,2 0
8.4
8.6
8.8
9
9.2
Real Axis (seconds-1)
Imag
inar
y A
xis
(sec
onds
-1)
56

57
Fig. 32: Four-machine two-area test system with SVC.
The electro-mechanical modes of the Four-Machine Two-Area system with SVC inclusion are shown in Table 9.
Table 9: Electro-mechanical modes of the Four-Machine Two-Area system
Mode Electro-mechanical modes
K=0 K=2.32
Damping ratio, %
K=0 K=2.32
1
2
3
-0.10 j2.84 -0.23 j2.94
-0.63 j6.71 -0.63 j6.71
-0.70 j6.92 -0.70 j6.92
3.67 8.05
9.38 9.43
10.10 10.10
When the damping controller gain is set to zero, then there is an inter-area mode, mode 1, with 3.67% damping ratio. The two other modes are the local modes. If we consider 5% as minimum damping ratio, then the goal is to have the damping ratio above this value for the inter-area mode. To do so, the impedance matching based gain selection approach is applied and the optimum gain is selected based on the following.
First the Bode-magnitude plot of the SVC reactive power as input and the time derivative of the deviation of the local voltage from nominal voltage as output is derived and shown in Fig. 33. Then the geometric mean frequency of the open-loop pole frequency and the frequency of the corresponding zero is calculated. Reading the Bode-magnitude plot at the geometric frequency gives KOPT=2.32. Using the optimum gain for the SVC damping controller leads to improvement of the damping ratio of the inter-area mode, see Table 9. The local modes in Table 9 are not negatively impacted.
57

58
Fig. 33: Gain plot of Bode-diagram of the four-machine two-area test system with SVC reactive power as input and the time derivative of the deviation of the local voltage from
nominal voltage as output. Indicated frequencies are P (left), OPT (middle) and Z (right).
To excite the inter-area mode and evaluate the performance of the impedance matching based gain selection, a solid three-phase fault is applied at the middle of one of the AC lines between buses 7 and 8, see Fig. 32. The self-clearing fault is applied at 5 s and removed at 5.1 s. The non-linear simulation results including the faulted line active power, angular separation between G1 and G3 and the control effort (modulated reactive power) are shown in Fig. 34 for zero and optimum gains.
2 4-15
-10
-5
0
5
rad/s
Mag
nitu
de (
dB)
58

59
Fig. 34: Dynamic response of the four-machine two-area test system with SVC. (a) Faulted tie-line active power. (b) Angular separation between G1 and G3. (c) Control effort.
Clearly, applying the optimum gain leads to better response in the dynamic simulations. This is in line with the eigenvalue movement in Table 9. It should be
0 5 10 15 20 25 3050
100
150
200
250
300
Time (s)
Tie
-line
act
ive
pow
er (
MW
)
Optimum
Zero
0 5 10 15 20 25 3035
40
45
50
55
60
65
70
Time (s)
Ang
ular
sep
arat
ion
(deg
)
Optimum
Zero
0 5 10 15 20 25 30
-40
-20
0
20
40
Time (s)
Con
trol
eff
ort
(Mva
r)
(a)
(b)
(c)
59

60
noticed that the control effort for the SVC damping controller (modulated reactive power) is limited to ±50 Mvar.
5.5 Summary
In this chapter, the impedance matching concept is proposed as criterion to select the optimum gain of the considered damping controllers which gives the maximum damping for the mode with the greatest mode observability and controllability in the system. The aim is to suppress the inter-area oscillations. The damping controller is based on either the control of active power in proportion to the local frequency or control of reactive power in proportion to the time derivative of the local voltage. First it goes for the actuators like VSC-HVDC which can modulate the active power at two points in the network. Then the actuators like ES which modulates the active power at single-point in the network are considered. And finally, single-point reactive power modulation is also considered using SVC damping controller. The proposed optimum gain selection approach based on the impedance matching is robust against the operating points change in the system and also appropriate for real-time applications. Moreover, it is simpler for implementation in reality than other established approaches for gain selection. And finally using the probing signal tests, the proposed approach can lead to a self-tuning controller which is a great advantage for real-time applications.
60

61
6.Conclusions and Future Work
In this thesis, some current challenges related to voltage and damping controls in power systems are addressed. The connecting goals throughout the whole thesis were to avoid adding further complexity also proposing simple approaches to handle the problems. Moreover, we always tried to keep track of TSO’s interests also considering the practical issues as much as possible while handling the considered problems in the thesis.
The first problem related to voltage control addressed in the thesis is the reactor hunting during the power system restoration. This problem delays the power system restoration process. To solve this problem, the common practice used by TSOs is to shut down the shunt automatics during the restoration. This leaves the shunts in manual operation which increases the restoration time. In this thesis, the adaptive tolerance band concept is proposed to eliminate reactor hunting. The main idea is instead of having fixed tolerance band for the shunt automatics, it can change and be adaptive. To apply the proposed concept, two methods including the prediction and observation methods have been proposed in the thesis. The first one is model based and cannot be implemented completely locally and it needs some communication which adds some sort of complexity to the system but the required data to implement the method is available for TSOs. The observation method is based on the measuring of voltage change once the shunt reactor is connected and it can be done locally.
Still in voltage control part, two different actuators including the reactive shunts and the VSC-HVDC links are considered to improve the voltage stability in power systems. Switching of the reactive shunts to control the voltage happens quite frequently in power systems. The common control scheme for the reactive shunts applied by TSOs is called the local scheme. An alternative control scheme called
61

62
the neighboring scheme is proposed in the thesis to control the reactive shunts. This control scheme application leads to better voltage control. The proposed neighboring scheme can still be implemented locally and it is communication free which is a great point from TSOs standpoint.
Moreover, the VSC-HVDC link application to improve the long-term voltage instability situations is investigated. An appropriate control scheme is considered in the thesis for VSC-HVDC active and reactive power control. This control scheme first monitors the critical buses voltages and then once the majority of them are below the lower limit, the active and reactive power set-points of the VSC converters are ramped up/down to change the power flow in the system. The considered control scheme needs communication to monitor the critical buses voltages which adds some complexity to the system.
Furthermore, to have a text book size version of NORDIC32 and Swedish power system for long-term voltage stability analysis, the N3area test system is proposed in the thesis. The main goal is to reduce the NORDIC32 test system complexity while replicating its behavior in long-term voltage stability simulations. The simulation results show that the N3area test system can replicate the NORDIC32 test system behaviour in long-term voltage stability context very well.
The problems related to damping control and in particular the inter-area oscillations in power systems are also addressed in the thesis. These oscillations might happen following a disturbance in power systems or during ambient conditions. They are actually the active power oscillations among the participating generators. So the actuators which can modulate the active power at two points in the network like VSC-HVDC and those who can modulate the active power at single-point in the network like ES can be utilized to damp out such oscillations. The reactive power modulation at single-point in the network could also improve the damping since it indirectly modulates the active power. Then the actuators like SVC can also be used to improve the damping. In this thesis, a new approach based on the impedance matching concept is proposed to select the optimum gain of actuators which modulate the active power at two points like VSC-HVDC, actuators which modulate the active power at single-point like ES and actuators which modulate the reactive power at single-point like SVC damping controllers to improve the damping of inter-area oscillations. The used controller with the selected optimum gain from impedance matching application does not negatively impact on other modes in the system. This is very important factor for tuning the damping controller parameters. Another important factor is to reach the possible maximum damping (if the damping is limited) which as stated above is corresponding to optimum gain selection met by impedance matching application.
62

63
To apply the proposed approach for large scale complex power systems, an open-loop relevant Bode-magnitude plot is needed. This can be achieved from a model or by injecting low-level probing signals in closed-loop operation of damping controllers. This means that the proposed approach is appropriate for real-time application and also can lead to a self-tuning controller which is a great advantage since the power system operating points are changing a lot. Moreover, the proposed approach just needs local feedback signals to be implemented which make it more robust against communication failure and possible network topology changes. The performance of the proposed approach is investigated through eigenvalue analysis and different small-signal instability scenarios with time-domain simulations. The analyses prove the credibility of the proposed approach to find out either the optimum or nearly optimum gain of the considered damping controllers.
This thesis can be extended in some possible future research directions. To control the reactive shunts for voltage control improvement, the real time optimizer like Model Predictive Control (MPC) could be used to switch the reactive shunts. Computational time and additional complexity from MPC to the system would be another issue which should be carefully treated. Other actuators like synchronous generators and tap changers performances for voltage control improvement can also be investigated. For the damping control part, impedance matching application for multi-terminal systems is not addressed in the thesis. Also, for single-point active power modulation, damping from VSC-HVDC connected offshore wind power plants can also be investigated. Moreover, to apply the impedance matching for SVC damping controller, what has been done in the thesis is based on the empirical investigation. It can be extended by the analytical studies also. Again for the SVC case, when switching occurs in a power system at transmission line connection or disconnection, then the voltage at the middle of the line changes. The impact of this switching on the impedance matching based gain selection approach for the SVC damping controller is not addressed in the thesis.
63

64
References
[1] http://www.greatachievements.org/ accessed on: 2017-12-05.
[2] K. J. Aström, P. Albertos, M. Blanke, A. Isidori, W. Schaufelberger, R. Sanz, Control of Complex systems, Springer-Verlag London, 2001.
[3] J. D. Glover, M. S. Sarma, T. J. Overbye, Power System Analysis and Design, Cengage Learning, 2011.
[4] O. Zinaman et al., “Power systems of the future,” 2015.
[5] http://www.independent.co.uk/news/world/europe/sweden-renewable-energy-target-2040-country-on-track-a7381686.html/ accessed on: 2017-12-05.
[6] https://www.theguardian.com/environment/2017/feb/09/new-energy-europe-renewable-sources-2016/ accessed on: 2017-12-05.
[7] F. Blaabjerg, Y. Yang, K. Ma, and X. Wang, “Power electronics-the key technology for renewable energy system integration,” in 2015 International Conference on Renewable Energy Research and Applications (ICRERA), 2015, pp. 1618–1626.
[8] H. R. Chamorro, C. A. Ordonez, J. C. Peng, and M. Ghandhari, “Non-synchronous generation impact on power systems coherency,” IET Gener. Transm. Distrib., vol. 10, no. 10, pp. 2443–2453, 2016.
[9] J. Björnstedt, “Integration of non-synchronous generation-frequency dynamics,” PhD thesis, Lund University, 2012.
[10] F. Sulla, “Fault behavior of wind turbines,” PhD thesis, Lund University, 2012.
[11] A. Korompili, Q. Wu, and H. Zhao, “Review of VSC HVDC connection for offshore wind power integration,” Renew. Sustain. Energy Rev., vol. 59, pp. 1405–1414, 2016.
[12] H. S. M. Ramadan, “Non-linear control and stabilization of VSC-HVDC transmission systems,” PhD thesis, Supelec Systems Sciences, 2012.
[13] http://new.abb.com/systems/hvdc/references/gotland-hvdc-light/ accessed on: 2017-12-05.
64

65
[14] F. Wang et al., “An overview introduction of VSC-HVDC: state-of-art and potential applications in electric power systems,” in CIGRE , Bologna, Paris, 2011, pp. 1–10.
[15] https://www.svk.se/en/grid-development/grid-projects/the-south-west-link/ accessed on: 2017-12-05.
[16] G. Pinares, L. B. Tjernberg, L. A. Tuan, C. Breitholtz, and A. Edris, “On the analysis of the dc dynamics of multi-terminal VSC-HVDC systems using small signal modeling,” in 2013 IEEE Grenoble Conference, 2013, pp. 1–6.
[17] J. Beerten, S. Cole, and R. Belmans, “Modeling of multi-terminal VSC HVDC systems with distributed DC voltage control,” IEEE Trans. Power Syst., vol. 29, no. 1, pp. 34–42, Jan. 2014.
[18] P. Rodriguez and K. Rouzbehi, “Multi-terminal DC grids: challenges and prospects,” J. Mod. Power Syst. Clean Energy, vol. 5, no. 4, pp. 515–523, 2017.
[19] G. Erbach, “Understanding electricity markets in the EU,” 2016.
[20] International energy agency, “Large-scale electricity interconnection- technology and prospects for cross-regional networks,” 2016.
[21] F. Aminifar, M. Fotuhi-Firuzabad, A. Safdarian, A. Davoudi, and M. Shahidehpour, “Synchrophasor measurement technology in power systems: panorama and state-of-the-art,” IEEE Access, vol. 2, pp. 1607–1628, 2014.
[22] R. Kearsley, “Restoration in Sweden and experience gained from the blackout of 1983,” IEEE Trans. Power Syst., vol. 2, no. 2, pp. 422–428, 1987.
[23] S. Larsson and A. Danell, “The black-out in southern Sweden and eastern Denmark, September 23, 2003.,” in 2006 IEEE PES Power Systems Conference and Exposition, 2006, pp. 309–313.
[24] E. Agneholm, “The restoration process following a major break-down in a power system,” Licentiate thesis, Chalmers University of Technology, 1996.
[25] http://www.svk.se/.
[26] M. R. S. Tirtashi, “Control of reactive shunts-voltage stability and
65

66
restoration,” Licentiate thesis, Lund University, 2015.
[27] T. Van Cutsem, C. Vournas, Voltage Stability of Electric Power Systems, Springer US, 1998.
[28] M. R. S. Tirtashi, O. Samuelsson, and J. Svensson, “Dynamic and static analysis of the shunt capacitors control effect on the long-term voltage instability,” in 2016 IEEE Power and Energy Society General Meeting (PESGM), 2016, pp. 1–5.
[29] C. W. Taylor, Power System Voltage Stability, McGraw-Hill Ryerson, 1994.
[30] Power system dynamic performance committee, “Test systems for voltage stability analysis and security assessment,” 2015.
[31] Cigre task force 38-08-08, “Long term dynamics phase II, final report,” 1995.
[32] M. R. S. Tirtashi, J. Svensson, and O. Samuelsson, “VSC-HVDC application to improve the long-term voltage stability,” in 2017 IEEE Manchester PowerTech, 2017, pp. 1–6.
[33] G. Rogers, Power System Oscillations, Springer US, 2000.
[34] X. Wu, F. Dorfler, and M. R. Jovanovic, “Input-output analysis and decentralized optimal control of inter-area oscillations in power systems,” IEEE Trans. Power Syst., vol. 31, no. 3, pp. 2434–2444, May 2016.
[35] D. N. Kosterev, C. W. Taylor, and W. A. Mittelstadt, “Model validation for the August 10, 1996 WSCC system outage,” IEEE Trans. Power Syst., vol. 14, no. 3, pp. 967–979, 1999.
[36] M. R. S. Tirtashi, O. Samuelsson, and J. Svensson, “Impedance matching for VSC-HVDC and energy storage damping controllers,” IEEE Trans. Power Deliv., pp. 1–1, 2017.
[37] R. Preece, J. V. Milanović, A. M. Almutairi, and O. Marjanovic, “Probabilistic evaluation of damping controller in networks with multiple VSC-HVDC lines,” IEEE Trans. Power Syst., vol. 28, no. 1, pp. 367–376, 2013.
[38] L. Shi, K. Y. Lee, and F. Wu, “Robust ESS-based stabilizer design for damping inter-area oscillations in multimachine power systems,” IEEE
66

67
Trans. Power Syst., vol. 31, no. 2, pp. 1395–1406, 2016.
[39] A. Heniche and I. Kamwa, “Assessment of two methods to select wide-area signals for power system damping control,” IEEE Trans. Power Syst., vol. 23, no. 2, pp. 572–581, 2008.
[40] C. Lu et al., “Wide-area coordinated and adaptive damping control of multiple HVDC links in China southern power grid,” 2010, pp. 1–7.
[41] C. Sturk, “Structured model reduction and its application to power systems,” Licentiate thesis, KTH, 2012.
[42] G. Fusco, M. Russo, Adaptive Voltage Control in Power Systems, Springer London, 2007.
[43] R. Rajbongshi and L. C. Saikia, “Combined control of voltage and frequency of multi-area multisource system incorporating solar thermal power plant using LSA optimised classical controllers,” IET Gener. Transm. Distrib., vol. 11, no. 10, pp. 2489–2498, Jul. 2017.
[44] W. Du, X. Chen, J. Cao, and H. Wang, “Stable tending control of complex power systems-an example of localized design of power system stabilizers,” in 2015 IEEE 2nd International Future Energy Electronics Conference (IFEEC), 2015, pp. 1–5.
[45] P. E. Troncoso, R. J. Mantz, and P. E. Battaiotto, “Active and reactive power centralized control for wind energy conversion systems via VSS,” in 2015 XVI Workshop on Information Processing and Control (RPIC), 2015, pp. 1–6.
[46] Y. Mishra, S. Mishra, M. Tripathy, N. Senroy, and Z. Y. Dong, “Improving stability of a DFIG-based wind power system with tuned damping controller,” IEEE Trans. Energy Convers., vol. 24, no. 3, pp. 650–660, Sep. 2009.
[47] G. R. Yousefi, H. Haes Alhelou, and M. Hajiakbari Fini, “Comparative study on the performance of many-objective and single-objective optimisation algorithms in tuning load frequency controllers of multi-area power systems,” IET Gener. Transm. Distrib., vol. 10, no. 12, pp. 2915–2923, Sep. 2016.
[48] T. Chaiyatham and I. Ngamroo, “Improvement of power system transient stability by PV farm with fuzzy gain scheduling of PID controller,” IEEE Syst. J., vol. 11, no. 3, pp. 1684–1691, Sep. 2017.
67

68
[49] J. Q. Tortos and V. Terzija, “A smart power system restoration based on the merger of two different strategies,” in 3rd IEEE PES Int. Conf. Exhib. Innov. Smart Grid Technol. (ISGT Eur), pp. 1–8, 2012.
[50] A. Petersson, C. Bergstrand, “Reactive power control during power system restoration and HVDC investigation,” Master thesis, Lund University, 2014.
[51] J. W. Pierre et al., “Probing signal design for power system identification,” IEEE Trans. Power Syst., vol. 25, no. 2, pp. 835–843, May 2010.
[52] P. Kundur, Power System Stability and Control, McGraw-Hill Education, 1994.
[53] T. Van Cutsem, “Voltage instability: phenomena, countermeasures, and analysis methods,” Proc. IEEE, vol. 88, no. 2, pp. 208–227, Feb. 2000.
[54] B. Cui and Z. Wang, “Voltage stability assessment based on improved coupled single-port method,” IET Gener. Transm. Distrib., vol. 11, no. 10, pp. 2703–2711, Jul. 2017.
[55] H. Omidi, B. Mozafari, A. Parastar, M. A. Kaburi “Voltage stability margin improvement using shunt capacitors and active and reactive power management,” 2009.
[56] O. A. Urquidez and L. Xie, “Singular value sensitivity based optimal control of embedded VSC-HVDC for steady-state voltage stability enhancement,” IEEE Trans. Power Syst., vol. 31, no. 1, pp. 216–225, 2016.
[57] H. F. Latorre and M. Ghandhari, “Improvement of voltage stability by using VSC-HVdc,” Transm. Distrib. Conf. Expo. Asia and Pacific, pp. 1–4, 2009.
[58] M. R. S. Tirtashi, O. Samuelsson, and J. Svensson, “Control strategies for reactive shunts to improve long-term voltage stability,” in 2013 48th International Universities’ Power Engineering Conference (UPEC), 2013, pp. 1–5.
[59] J. W. Stahlhut, G. T. Heydt, and E. Kyriakides, “A comparison of local vs. sensory, input-driven, wide area reactive power control,” in 2007 IEEE Power Eng. Soc. Gen. Meet., pp. 1–7, 2007.
[60] L. Zeni et al., “Influence of current limitation on voltage stability with voltage sourced converter HVDC,” in 2013 4th IEEE/PES Innov. Smart
68

69
Grid Technol. Eur. pp. 1–5.
[61] S. Elenius, “Methods for damping inter-area oscillations in the Nordic power system,” PhD thesis, Aalto University, 2017.
[62] P. K. M. Klein, G.J. Rogers, “A fundamental study of inter-area oscillations in power systems,” IEEE Trans. Power Syst., vol. 6, pp. 914–921, 1991.
[63] M. V. L. Pottonen, R. Hirvonen, K. Jaaskelainen, “Network interaction tests of the Fenno-Skan HVDC link,” in International Conference on AC and DC Power Transmission, 1991.
[64] B. J. Pierre et al., “Open-loop testing results for the pacific DC intertie wide area damping controller,” in PowerTech 2017.
[65] P. Agnihotri, A. M. Kulkarni, A. M. Gole, B. A. Archer, and T. Weekes, “A robust wide-area measurement-based damping controller for networks with embedded multiterminal and multiinfeed HVDC links,” IEEE Trans. Power Syst., vol. 32, no. 5, pp. 3884–3892, Sep. 2017.
[66] A. L. B. Do Bomfim, G. N. Taranto, and D. M. Falcao, “Simultaneous tuning of power system damping controllers using genetic algorithms,” IEEE Trans. Power Syst., vol. 15, no. 1, pp. 163–169, 2000.
[67] R. A. Jabr, B. C. Pal, and N. Martins, “A sequential conic programming approach for the coordinated and robust design of power system stabilizers,” IEEE Trans. Power Syst., vol. 25, no. 3, pp. 1627–1637, 2010.
[68] O. Samuelsson, “Power system damping structural aspects of controlling active power,” PhD thesis, Lund University, 1997.
[69] S. Datta, D. Chakraborty, and B. Chaudhuri, “Partial pole placement with controller optimization,” IEEE Trans. Automat. Contr., vol. 57, no. 4, pp. 1051–1056, 2012.
[70] M. R. Alrashidi and M. E. El-hawary, “A survey of particle swarm optimization applications in electric power systems,” IEEE Trans. Evol. Comput., vol. 13, no. 4, pp. 913–918, 2009.
[71] P. J. Lagacé, “Network voltage profile correction by discrete shunt compensation,” Math. Comput. Simul., vol. 63, pp. 461–469, 2003.
[72] S. Torseng, “Shunt-connected reactors and capacitors controlled by
69

70
thyristors,” 1981.
[73] C. D. Tsirekis and N. D. Hatziargyriou, “Control of shunt capacitors and shunt reactors energization transients,” Int. Confererence Power Syst. Transients System, vol. 1, no. 1, pp. 1–6, 2003.
[74] K. Walve and A. Edstrom, “The training simulator ARISTO-design and experiences,” in IEEE Power Engineering Society. 1999 Winter Meeting, 1999, pp. 545–547.
[75] DIgSILENT PowerFactory version 14. URL. <http://www.digsilent.de/>.
[76] K. Amarasekara, L. G. Meegahapola, A. P. Agalgaonkar, and S. Perera, “Characterisation of long-term voltage stability with variable-speed wind power generation,” IET Gener. Transm. Distrib., vol. 11, no. 7, pp. 1848–1855, 2017.
[77] J. Kim et al., “Development of long-term simulator for the large-scaled power system,” Transm. Distrib. Conf. Expo. Asia and Pacific, 2009, pp. 1–4.
[78] R. Leelaruji and L. Vanfretti, “Detailed modelling, implementation and simulation of an ‘all-in-one’ stability test system including power system protective devices,” Simul. Model. Pract. Theory, vol. 23, pp. 36–59, Apr. 2012.
[79] D. Karlsson and D. J. Hill, “Modelling and identification of nonlinear dynamic loads in power systems,” IEEE Trans. Power Syst., vol. 9, no. 1, pp. 157–166, 1994.
[80] S. Y. Ruan, G. J. Li, X. H. Jiao, Y. Z. Sun, and T. T. Lie, “Adaptive control design for VSC-HVDC systems based on backstepping method,” Electr. Power Syst. Res., vol. 77, pp. 559–565, 2007.
[81] Y. Guo et al., “Enhanced voltage control of VSC-HVDC-connected offshore wind farms based on model predictive control,” IEEE Trans. Sustain. Energy, vol. 9, no. 1, pp. 474–487, Jan. 2018.
[82] S. G. Johansson, G. Asplund, E. Jansson, R. Rudervall “Power system stability benefits with VSC DC-transmission systems,” 2004, pp. 1–8.
[83] W. Yan, W. Cui, W. J. Lee, J. Yu, and X. Zhao, “Pilot-bus-centered automatic voltage control with high penetration level of wind generation,” IEEE Trans. Ind. Appl., vol. 52, no. 3, pp. 1962–1969, May 2016.
70
71
[84] I. Ngamroo, C. S. Ali Nanda, S. Dechanupaprittha, M. Watanabe, and Y. Mitani, “A robust SMES controller design for stabilization of inter-area oscillations based on wide area synchronized phasor measurements,” Electr. Power Syst. Res., vol. 79, no. 12, pp. 1738–1749, 2009.
[85] R. Eriksson and L. Söder, “Coordinated control design of multiple HVDC links based on model identification,” Comput. Math. with Appl., vol. 60, no. 4, pp. 944–953, 2010.
[86] M. Maurer, F. Gutekunst, and G. Scheffknecht, “Dynamic parameter estimation of inter-area oscillations in a power system by a combination of Kalman-filtering and wavelet transformation techniques,” IFAC Proc., pp. 8196–8201, 2014.
[87] Y. Yu et al., “Oscillation energy analysis of inter-area low-frequency oscillations in power systems,” IEEE Trans. Power Syst., vol. 31, no. 2, pp. 1195–1203, 2016.
[88] B. C. Pal, A. H. Coonick, and B. J. Cory, “Linear matrix inequality versus root-locus approach for damping inter-area oscillations in power systems,” Int. J. Electr. Power Energy Syst., vol. 23, no. 6, pp. 481–489, 2001.
[89] P. Agnihotri, “A robust wide area measurement based controller for networks with embedded HVDC links,” PhD thesis, University of Manitoba, 2016.
[90] K. R. Padiyar, FACTS Controllers in Power Transmission and Distribution, New Age International Publishers, 2007.
[91] D. Cai, P. Regulski, M. Osborne, and V. Terzija, “Wide area inter-area oscillation monitoring using fast nonlinear estimation algorithm,” IEEE Trans. Smart Grid, vol. 4, no. 3, pp. 1721–1731, Sep. 2013.
[92] D. A. Schoenwald, B. J. Pierre, F. Wilches-Bernal, and D. J. Trudnowski, “Design and implementation of a wide-area damping controller using high voltage DC modulation and synchrophasor feedback,” IFAC-papers onLine, vol. 50, no. 1, pp. 67–72, Jul. 2017.
[93] L. Zeni et al., “Power oscillation damping from VSC–HVDC connected offshore wind power plants,” IEEE Trans. Power Deliv., vol. 31, no. 2, pp. 829–838, Apr. 2016.
71

72
Summary of Appended Papers
Paper I– Adaptive tolerance band for shunt automatics to avoid reactor hunting during power system restoration M. Reza Safari Tirtashi, Olof Samuelsson and Jörgen Svensson “Adaptive tolerance band for shunt automatics to avoid reactor hunting during power system restoration” Submitted to international journal. This paper concerns the reactor hunting phenomenon which is a real problem that might happen during the power system restoration. This problem actually did occur during the 2003 Swedish/Danish blackout. In the paper, the reactor hunting problem is introduced and explained using a simple circuit model. The common practice used by Swedish TSO to avoid the reactor hunting is to turn off the shunt automatics during the power system restoration. This leaves the shunt reactor in manual operation which increases the restoration time. To keep the automatic operation while avoiding the reactor hunting, we propose adaptive tolerance band concept in the paper. The concept simply means that the shunt reactors relay tolerance band can be adaptive and changes based on the network strength. To implement this concept, two control schemes are proposed in the paper. The first one predicts the voltage change after reactor connection and adjusts the reactor tolerance band beforehand. The second scheme first connects the reactor and observes the voltage change then adjusts the tolerance band. Both schemes are applied to avoid the reactor hunting in different restoration scenarios. The simulation results show well performance of both schemes to avoid the reactor hunting while keeping the automatic operation during the power system restoration.
Paper II– Improved local control of reactive shunts to enhance post-disturbance voltage control M. Reza Safari Tirtashi, Olof Samuelsson and Jörgen Svensson “Improved local control of reactive shunts to enhance post-disturbance voltage control” Submitted to international journal. This paper concerns two different control algorithms, including the local and neighboring control schemes, for reactive shunts control to improve the voltage control and possibly avoiding the large scale blackouts in power systems. The local scheme switches the shunt when the voltage at the local bus is outside the tolerance band. In the proposed neighboring scheme, both the local voltage and the voltage at neighboring buses are considered. The performance of these control schemes are evaluated with dynamic simulations through many different disturbance scenarios. The simulation results show better performance for the
72
73
proposed neighboring scheme compared to the local scheme which is mainly used by TSOs around the world. The difference between the local and neighboring scheme is very small but still it gives better results for the proposed neighboring scheme. This scheme is communication free and can be implemented locally which is a great advantage. At the end of the paper, comprehensive static analysis is also investigated to find out why neighboring scheme gives better performance than the local one. It is shown that the neighboring scheme either leads to sooner action from shunt capacitors or connecting more shunt capacitors. In both cases, the neighboring scheme injects more reactive power to the AC system which is a great help during the stressed conditions.
Paper III –Local and neighboring schemes for shunt capacitors control M. Reza Safari Tirtashi, Olof Samuelsson and Jörgen Svensson “Dynamic and static analysis of the shunt capacitors control effect on the long-term voltage instability”. 2016 IEEE Power & Energy Society General Meeting, Boston, USA, 17-21 July, 2016. This paper investigates two different control strategies, local and neighboring schemes, for shunt capacitors to improve the voltage control and also long-term voltage stability. The two considered approaches are applied on a text book size version test system called N3area test system, explained thoroughly in chapter 3, to evaluate their performances. This test system is the small scale version of the NORDIC32 test system and it reflects the key voltage instability characteristics of NORDIC32. The dynamic simulations are carried out in PowerFactory for a long-term disturbance scenario and the results show better performance for the neighboring scheme than the local one. Then static analysis using PV curves and also modal analysis are carried out in the paper and explain why the neighboring scheme performs better than the local scheme. The conclusion from static analysis is that the neighboring scheme injects more reactive power to the system and that is why it performs better than the local scheme in the dynamic simulations.
Paper IV –VSC-HVDC application for long-term voltage stability M. Reza Safari Tirtashi, Jörgen Svensson and Olof Samuelsson “VSC-HVDC application to improve the long-term voltage stability” 12th IEEE PES PowerTech Conference, Manchester, UK, 18-22 June, 2017. In this paper, the VSC-HVDC is utilized to improve the long-term voltage stability. The main idea is that the VSC active power control mimics the AC line operation while the remaining converter capacity goes to the reactive power control. The performance of the considered approach is evaluated on the NORDIC32 test system while the installed DC link represents the South-West link in Sweden. Two long-term disturbance scenarios are considered in the paper to
73

74
show the effectiveness of the proposed method for VSC-HVDC control. The simulations carried out in PowerFactory support the capability of the considered control methodology to improve the long-term voltage stability.
Paper V –Impedance matching based gain selection for maximum damping M. Reza Safari Tirtashi, Olof Samuelsson and Jörgen Svensson “Impedance matching for VSC-HVDC and energy storage damping controllers” IEEE Transactions on Power Delivery, DOI: 10.1109/TPWRD.2017.2719578. This paper is a short-format paper, letter, which presents the impedance matching concept as a means to select the optimum gain which gives the maximum damping ratio for VSC-HVDC and energy storage damping controllers. The damping control is based on the control of active power in proportion to the local frequency. The aim is to damp out the inter-area oscillations. One important feature of the considered damping controller is that it utilizes the local frequency feedback signals. This is important because the local feedback signals are robust against the possible communication failure and network topology change compared to the wide-area based feedback signals. To apply the proposed approach, a transformation from small-signal stability model of power system to an equivalent circuit is provided in the paper. This transformation leads to an LC circuit. The damping controller in power system model corresponds to inserting a resistor in equivalent circuit model. Then impedance matching is applied to select the optimum resistor which corresponds to optimum gain to maximize the damping. The proposed approach can be implemented without the circuit model and using the relevant Bode magnitude plot as well. By exciting the system with probing signals, the relevant Bode plot can be obtained in closed-loop operation of damping controller. This means that the proposed method is appropriate for real-time application and can lead to a self-tuning controller.
Paper VI–Impedance matching for VSC-HVDC damping controller gain selection M. Reza Safari Tirtashi, Olof Samuelsson, Jörgen Svensson and Richard Pates “Impedance matching for VSC-HVDC damping controller gain selection” Submitted to international journal. This paper thoroughly explores the idea presented in paper V and focuses on the VSC-HVDC damping controller gain selection by applying the impedance matching concept. The proposed approach is comprehensively investigated and complemented by the eigenvalue analysis and also the non-linear time domain simulations for different operating conditions. An analytical proof is also provided in the paper to show how the proposed approach can be implemented without the circuit model. The results provided in the paper show that the proposed approach works very well to maximize the damping ratio of the targeted mode which depends on the VSC-HVDC link position. Also the non-targeted modes are not
74

75
negatively impacted. Moreover, the optimum gain obtained from the impedance matching concept application is robust against the network parameters change and also it is hardly affected by changes in power flow.
Paper VII– Impedance matching for gain selection of single-point active power modulation damping controller M. Reza Safari Tirtashi, Olof Samuelsson, Richard Pates, and Jörgen Svensson “Impedance matching for gain selection of single-point active power modulation damping controller” Submitted to international journal. This paper thoroughly explores the idea presented in paper V and concerns the application of impedance matching concept for optimum gain selection of single-point active power modulation damping controllers. The single-point active power control can be implemented using for example active load modulation, VSC-HVDC connecting offshore wind power plants to the main grid and using actuators like Energy Storage (ES). As a candidate, ES damping controller is considered in the paper for further investigation. The proposed approach is evaluated for different modes of operation. The results provided in the paper show that the proposed approach gives the optimum gain which nearly maximizes the damping ratio of the inter-area mode. The local modes are also not impacted negatively.
75

76
Author Contributions
Level of contribution in five different aspects of research work for the seven appended papers. Major=work carried out mainly by author, medium=work carried out mainly through cooperation between author and co-authors, minor=little involvement from author. Research
Idea Implementing
the Idea Obtaining the Results
Performing Analysis
Writing Paper
Paper I Medium Major Major Medium Major Paper II Medium Major Major Medium Major Paper III Major Major Major Major Major Paper IV Major Major Major Major Major Paper V Minor Major Major Medium Major Paper VI Medium Major Major Major Major Paper VII Medium Major Major Major Major
76

Paper I


Paper II


Paper III


Dynamic and Static Analysis of the Shunt Capacitors Control Effect on the Long-Term Voltage Instability
M. Reza Safari Tirtashi, Olof Samuelsson, Jörgen Svensson
IEA, Lund University [email protected], [email protected] , [email protected]
Abstract— This paper concerns the dynamic and static analysis of the effect of shunt capacitor control strategies on the long-term voltage instability. For this purpose a simplified test system called N3area, reflecting the key voltage instability characteristics of NORDIC32 is considered. Two different control strategies for shunt capacitors including the local and neighboring schemes are applied to improve the voltage control in the system. First the dynamic simulation results for a specified long-term voltage instability scenario are explained and discussed then the static investigation is conducted based on the PV curves and it is shown that the neighboring scheme injects more reactive power to the system. Afterward, based on the modal analysis technique and V-Q sensitivity analysis, it is demonstrated that the possibility of involving the most critical buses from voltage stability perspective in the capacitors connection decisions are much higher in the neighboring scheme compared to the local one. The two strategies are explained and compared in both dynamic and static analysis and it is shown that control using the voltage at neighboring buses gives better performance.
I. INTRODUCTION Voltage stability refers to the ability of a power system to
keep all the voltage buses within the acceptable limits during both normal and emergency conditions [1]. Two time frames are normally considered relating to dynamics in the time-scale of seconds and several minutes respectively [2]. In short term voltage stability, behavior of induction motors, air conditioning loads and HVDC links are important factors while in long-term voltage stability, tap changer actions, distributed voltage regulators and thermostatic loads play important roles [3]. To cope with short-term voltage instabilities, fast devices like Automatic Voltage Regulator (AVR), HVDC links and FACTS devices are applicable and they increase system stability in that sense. On the other hand, tap changers and shunt capacitors and reactors are the conventional and widespread means to regulate the voltage level and also coping with long-term voltage instability problem [2].
The use of shunt capacitors and reactors has increased because they are relatively economical, easy and quick to install in power systems [4]. During voltage instability conditions, usually lack of reactive power and under voltage are critical issues for power systems [5]. So shunt capacitors control is of interest. Capacitors are switched on/off either manually or automatically [6]. In the manual case, system
control engineers take a decision based on the system situation [7].
In the automatic case, shunt capacitors could be either mechanically switched or thyristor controlled. But usually in both cases, a local scheme is used for controlling shunt capacitors. It means, a shunt capacitor will connect to the system once the voltage is lower than the desired limit just at its own bus [5]. A new control strategy for shunt capacitors proposed by the authors is the neighboring scheme. By applying this scheme, a shunt capacitor will respond to voltage deviations both at its own bus as well as at neighboring buses. Generally very few publications concerned the shunt capacitors control in power systems [6, 8, 9].
In this paper the dynamic and static analysis are used to investigate the shunt capacitor switching strategies’ effect on the long-term voltage stability in a test system. The local and neighboring schemes are considered as two strategies for shunt capacitors. Dynamic simulation results for a specified long-term voltage instability scenario are presented and discussed. DigSILENT PowerFactory [10] is used for dynamic simulations. Then static analysis based on the PV curves [1] is conducted and finally modal analysis and V-Q sensitivity analysis [1] are applied for further study.
The remainder of the paper is organized as follows: Section II describes the test system. Dynamic simulation results are presented in section III. Static analysis is conducted in section IV. Finally, section V concludes this paper.
II. TEST SYSTEM N3area test system is a simplified version of NORDIC32
[11] proposed by the authors and shown in Fig.1. This test system has the main long-term voltage stability characteristics of the Swedish national grid.
Like NORDIC32, the main generation area is located in the Northern part, while the main load area is placed in the Southern part of the N3area test system. As it can be seen in Fig. 1, this test system is equipped with two parallel AC lines. Shunt capacitors, loads and generators are also shown in this figure. G1 and L1 represent the Northern part of the Swedish national grid which is an export area. G2 and L2 represent the Southern part of NORDIC32 which is an import area while G3 and L3 represent the Central part of NORDIC32 which is a mixture of load and generation areas. G3 at the midpoint can
978-1-5090-4168-8/16/$31.00 ©2016 IEEE
1

improve the voltage profile over the transmission lines. The two lines between the two areas 1 (North) and 2 (South) in Fig. 1 each have an impedance of Z=19+j190 and are evenly divided into four sections. The ratings of CA, CB and CC are 100, 200 and 150 Mvar respectively. The rating for the loads and generators are shown in Fig. 1. Together they give a power transfer from North down to South in N3area which is also a key characteristic of NORDIC32. Over Excitation Limiter (OXL) protection and load dynamics are important when studying the long-term voltage instability and are included in the N3area test system. The load model used in the paper is multiplicative generic dynamic load model [5]. Its details and the models of the generator OXLs are explained in [12]. During voltage instability conditions, mainly the generators at the midpoint of the Swedish power system (represented by G3 in N3area) reach their OXLs. It means their terminal buses will turn from PV to PQ buses.
1L
AL
BL
CL
2L
A
B
C
1G
2G
AC
BC
CC
3G
200 MW100 Mvar
100 MW50 Mvar
1500 MW550 Mvar
100 MW50 Mvar
125 MW75 Mvar
2000 MWSlack Bus
100 MWPV Bus
50 MWPV Bus
Figure. 1. N3area test system with dynamic loads given at nominal voltage.
III. DYNAMIC SIMULATION RESULTS
In this part, the simulation results for a specified long-term voltage instability scenario are presented and discussed. The dynamic load model and OXL protection are implemented with DIgSILENT Simulation Language (DSL). The studied scenario is increase of the active and reactive powers of the south load (L2). This starts at 125 s and lasts for 300 s. The load increment is 200% of active and reactive powers of the south load. Fig. 2, where capacitors are not used, shows voltage curves for the different buses. As it can be seen in this figure, before the load increase (125 s), the voltage level in intermediate buses is low so that the system is stressed. During the load increase, first the short-term dynamics drive the system then they disappear. After that the long-term dynamics which are the OXL action and load recovery take over the system and voltage goes down in all buses except the north bus which is mainly generating. Also, it is clear that voltage at the bus B (midpoint) is lowest.
To improve voltages, two different strategies for automatic switching of shunt capacitors are used in this paper. As mentioned in the introduction part, the first control strategy which has been used by the Transmission System Operators (TSOs) worldwide, called the local scheme, switches the shunt capacitor when the voltage at the local bus is outside the tolerance band (which is usually 0.95-1.05 pu). For the local action, the shunt capacitor waits 1 s and is then connected to the system if the voltage is still low. The reason for waiting time is that the voltage should be stabilized and then be measured. In the second control strategy, called neighboring scheme, local voltage as well as voltage at neighboring buses are used. The shunt capacitor connects to the system after 2 s if the voltage is low at the neighbor bus. It means the neighbor bus capacitors first wait 1 s for the local action and 1 s more to reach the stable voltage level and if the voltage level is still low, then it would be connected to improve the neighbor bus voltage. These two control strategies are implemented using DSL in PowerFactory.
Fig. 3 and 4 show the system voltage curves for different buses when the local and neighboring schemes are applied respectively.
By applying both schemes the voltage is stable. For the local scheme application, the voltage at bus B is not within the acceptable range (0.95-1.05 pu) while with the neighboring scheme application all voltages are within limits. Also the neighboring scheme application leads to higher voltage level for intermediate buses. It is because the neighboring scheme leads to connection of all capacitors while by local scheme the capacitor at bus C which is close to the south bus is never connected to the system. This means the neighboring scheme injects more reactive power to the system. This is an important factor to balance the reactive power and keep all the voltages within the acceptable limits. The capacitor connection instants at different buses are marked in the Fig. 3 and 4. Dynamic analysis of the local and neighboring schemes performances for bigger test system like NORDIC32 is conducted by the authors and is available in [13].
Figure. 2. Voltage at different buses of N3area test system.
125 400 600 800 1000 1200 14000.85
0.9
0.95
1
1.05
1.1
Time (s)
Vol
tage
(pu)
NorthABCSouth
978-1-5090-4168-8/16/$31.00 ©2016 IEEE
2

Figure. 3. Voltage for different buses by applying local scheme.
Figure. 4. Voltage for different buses by applying neighboring scheme
IV. STATIC ANALYSIS For the long-term voltage instability, the main contributing
dynamics including OXL action and load recovery are quite slow, so the static approaches are applicable to analyze the system behavior. The PV curve concept, Modal analysis technique and V-Q sensitivity are used in this paper as the static approaches to analyze more.
A. PV Curve
As mentioned in the dynamic simulation part, the neighboring scheme led to larger reactive power injection to the system. This part aims to explain, using the PV curves, why the neighboring scheme has this capability compared to the local one.
To produce the PV curves, the load in the southern area (L2) is increased in the N3area test system. The PV curves for the three buses A, B, C are plotted in Fig. 5 while there is no capacitor in operation. As mentioned, during voltage instability conditions, mainly the generators at the midpoint of the Swedish power system, represented by G3 in N3area, activate their OXL. It means its terminal bus turns from PV to PQ bus.
Figure. 5. PV curves without any capacitor connected; red line (bus A), green
line (bus B), and blue line (bus C). P here represents the active power consumed by the load at southern area, L2.
With 0.95 pu as the lowest acceptable voltage level, then it
means, below this level the capacitors will connect to the system. Based on Fig. 5, bus B has the lowest voltage and is the first bus which violates the lower voltage limit. So the first local action of the capacitors would be at bus B as in the dynamic simulation, followed by the second local action at bus A. If we follow the dynamic simulation, by bringing the capacitors at both buses B and A in operation, new PV curves are generated for these three buses as depicted in Fig. 6.
Figure. 6. PV curves with capacitor connections at bus B and A; red line (bus
A), green line (bus B), and blue line (bus C). P here represents the active power consumed by the load at southern area, L2.
If 0.95 pu is the lowest voltage level, then bus B is
violating the limit first. Since the capacitors at buses B and A are already connected to the system, then only the bus C capacitor is left. The bus C is violating the 0.95 pu at higher power which corresponds to later time compared to bus B based on the Fig. 6. Using the local scheme, the capacitor at bus C will be connected to the system once the voltage is below the lower limit at its own bus. By instead using the neighboring scheme, the capacitor at bus C will be switched on once the voltage either at its own bus or at the neighboring bus (bus B) violates the lower limit. It means once either blue
125 400 600 800 1000 1200 14000.85
0.9
0.95
1
1.05
Time (s)
Vol
tage
(pu)
North
A
BC
South
125 400 600 800 1000 1200 14000.85
0.9
0.95
1
1.05
1.1
Time (s)
Vol
tage
(pu)
NorthABCSouth
0 100 200 300 400 500 6000.75
0.8
0.85
0.9
0.95
1
1.05
1.1
1.15
Active Power (MW)
Vol
tage
(pu)
ABC
0 100 200 300 400 500 600 7000.75
0.8
0.85
0.9
0.95
1
1.05
1.1
1.15
Active Power (MW)
Vol
tage
(pu)
ABC
B A
B A C
978-1-5090-4168-8/16/$31.00 ©2016 IEEE
3

line or green line in Fig. 6 goes below 0.95 pu, the capacitor at bus C will be connected to the system. Based on Fig. 6, the green line (corresponding to bus B) is going below 0.95 pu at much lower active power value which corresponds to earlier time than the blue line. In the dynamic simulation for the neighboring scheme, the bus C capacitor is connected to the system and it is because of the voltage level at Bus B. But for the local scheme, the capacitor at bus C is never connected and it means the corresponding power in Fig. 6 for capacitor connection at bus C is never reached during the dynamic simulation. So the neighboring scheme injects more reactive power to the system. More reactive power injection from neighboring scheme led to better performance in the dynamic simulation in section III.
B. Modal Analysis
In the previous section, PV curves are used to explain why neighboring scheme led to injection of more reactive power to the system in the dynamic simulation compared to the local one. The aim of this part is to demonstrate based on the modal analysis and V-Q sensitivity that if the neighboring scheme is applied then the most critical bus voltages in the system would possibly be used for switching the shunt capacitors.
The linearized steady state system power voltage equations are as follows:
VQVJQJPVJPJ
Q
P
Where,
PPJ ,
V
PPVJ , Q
QJ , V
QQVJ
and
P = incremental change in bus active power Q = incremental change in bus reactive power
= incremental change in bus voltage angle V = incremental change in bus voltage magnitude
QVJQJPVJPJ
is the Jacobian matrix of the partial
derivatives. If the active power flow is kept constant then:
VQVJQJPVJPJ
Q
0
VRJQ Where JR is the reduced Jacobian matrix as follows:
PVJPJQJQVJRJ 1 Eigenvalues and eigenvectors of the reduced Jacobian
matrix show the voltage stability characteristics of the power system [1].
The reduced Jacobian matrix can be diagonalized as follows:
RJ
Where:
= left eigenvector matrix of JR = right eigenvector matrix of JR = diagonal eigenvalue matrix of JR Based on this [1], the corresponding ith modal voltage
variation can be determined as follows:
iqi
iv1
Where: is the eigenvalue of JR And q is the vector of modal reactive power variations
represented by:
Qq If i >0 for all i, then the system is voltage stable.
Otherwise it is unstable from voltage stability perspective. On the other hand, the magnitude of i determines the degree of stability of ith modal voltage. It means the smaller values for
i indicates the closer the ith modal voltage is to being unstable. So the smallest eigenvalues of JR are of interest for voltage stability analysis.
The following equation shows the relative participation of bus k in mode i:
ikkikiP The specified bus participation in a given mode indicates
the effectiveness of remedial actions applied at that bus to stabilize that mode [1]. In fact, once the smallest eigenvalues of JR which is corresponding to the specified modes in the system is known then it can be determined which bus has largest participation factor for that modes. Then the weak buses in the system from voltage stability perspective could be determined.
C. V-Q sensitivity analysis
By solving the equation (3), the V-Q sensitivities are calculated. At a specified bus, the V-Q sensitivity indicates the slope of the Q-V curve at the given operating point. If the V-Q sensitivity is positive, then it corresponds to stable operation. Moreover, the smaller values represent more stable operation. On the other hand, the negative value for V-Q sensitivity shows the unstable operation [1].
D. Results for Modal analysis and V-Q sensitivity analysis for N3area test system
In the following, the diagonal eigenvalue matrix of JR, different bus participations in the least stable mode also different buses voltage sensitivities are provided for the N3area test system. The first case is when there is no capacitor connected in the N3area test system. It actually represents the natural behavior of the system. Since the generators at middle area of the Swedish power system normally reach their OXL during the voltage instabilities, then bus B (middle bus) of N3area is assumed as PQ bus.
978-1-5090-4168-8/16/$31.00 ©2016 IEEE
4
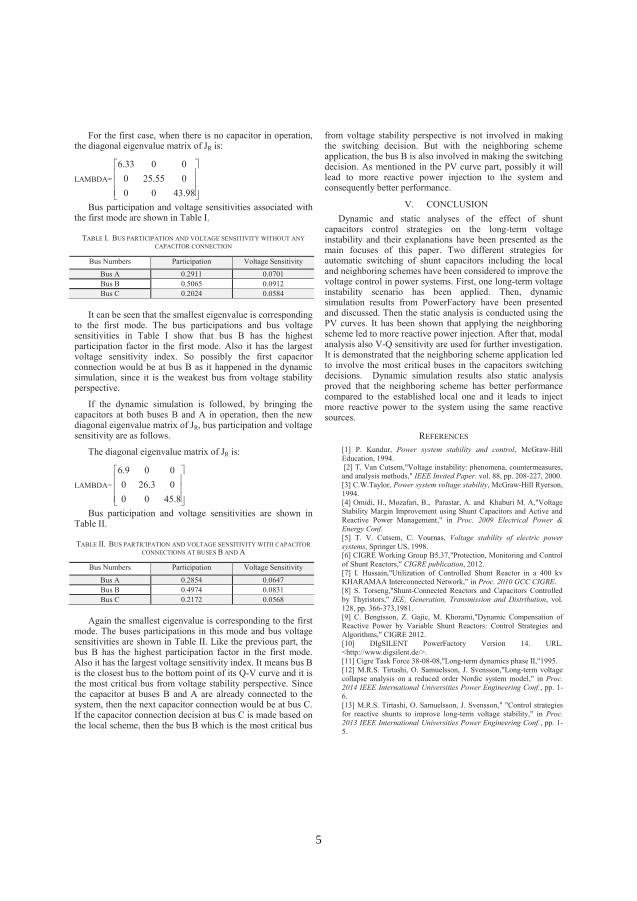
For the first case, when there is no capacitor in operation, the diagonal eigenvalue matrix of JR is:
LAMBDA=
98.4300055.2500033.6
Bus participation and voltage sensitivities associated with the first mode are shown in Table I.
TABLE I. BUS PARTICIPATION AND VOLTAGE SENSITIVITY WITHOUT ANY CAPACITOR CONNECTION
Bus Numbers Participation Voltage Sensitivity Bus A 0.2911 0.0701 Bus B 0.5065 0.0912 Bus C 0.2024 0.0584
It can be seen that the smallest eigenvalue is corresponding
to the first mode. The bus participations and bus voltage sensitivities in Table I show that bus B has the highest participation factor in the first mode. Also it has the largest voltage sensitivity index. So possibly the first capacitor connection would be at bus B as it happened in the dynamic simulation, since it is the weakest bus from voltage stability perspective.
If the dynamic simulation is followed, by bringing the capacitors at both buses B and A in operation, then the new diagonal eigenvalue matrix of JR, bus participation and voltage sensitivity are as follows.
The diagonal eigenvalue matrix of JR is:
LAMBDA=
8.450003.260009.6
Bus participation and voltage sensitivities are shown in Table II.
TABLE II. BUS PARTICIPATION AND VOLTAGE SENSITIVITY WITH CAPACITOR CONNECTIONS AT BUSES B AND A
Bus Numbers Participation Voltage Sensitivity
Bus A 0.2854 0.0647 Bus B 0.4974 0.0831 Bus C 0.2172 0.0568
Again the smallest eigenvalue is corresponding to the first
mode. The buses participations in this mode and bus voltage sensitivities are shown in Table II. Like the previous part, the bus B has the highest participation factor in the first mode. Also it has the largest voltage sensitivity index. It means bus B is the closest bus to the bottom point of its Q-V curve and it is the most critical bus from voltage stability perspective. Since the capacitor at buses B and A are already connected to the system, then the next capacitor connection would be at bus C. If the capacitor connection decision at bus C is made based on the local scheme, then the bus B which is the most critical bus
from voltage stability perspective is not involved in making the switching decision. But with the neighboring scheme application, the bus B is also involved in making the switching decision. As mentioned in the PV curve part, possibly it will lead to more reactive power injection to the system and consequently better performance.
V. CONCLUSION Dynamic and static analyses of the effect of shunt
capacitors control strategies on the long-term voltage instability and their explanations have been presented as the main focuses of this paper. Two different strategies for automatic switching of shunt capacitors including the local and neighboring schemes have been considered to improve the voltage control in power systems. First, one long-term voltage instability scenario has been applied. Then, dynamic simulation results from PowerFactory have been presented and discussed. Then the static analysis is conducted using the PV curves. It has been shown that applying the neighboring scheme led to more reactive power injection. After that, modal analysis also V-Q sensitivity are used for further investigation. It is demonstrated that the neighboring scheme application led to involve the most critical buses in the capacitors switching decisions. Dynamic simulation results also static analysis proved that the neighboring scheme has better performance compared to the established local one and it leads to inject more reactive power to the system using the same reactive sources.
REFERENCES [1] P. Kundur, Power system stability and control, McGraw-Hill Education, 1994. [2] T. Van Cutsem,"Voltage instability: phenomena, countermeasures, and analysis methods," IEEE Invited Paper. vol. 88, pp. 208-227, 2000. [3] C.W.Taylor, Power system voltage stability, McGraw-Hill Ryerson, 1994. [4] Omidi, H., Mozafari, B., Parastar, A. and Khaburi M. A,"Voltage Stability Margin Improvement using Shunt Capacitors and Active and Reactive Power Management," in Proc. 2009 Electrical Power & Energy Conf. [5] T. V. Cutsem, C. Vournas, Voltage stability of electric power systems, Springer US, 1998. [6] CIGRE Working Group B5.37,"Protection, Monitoring and Control of Shunt Reactors," CIGRE publication, 2012. [7] I. Hussain,"Utilization of Controlled Shunt Reactor in a 400 kv KHARAMAA Interconnected Network," in Proc. 2010 GCC CIGRE. [8] S. Torseng,"Shunt-Connected Reactors and Capacitors Controlled by Thyristors," IEE, Generation, Transmission and Distribution, vol. 128, pp. 366-373,1981. [9] C. Bengtsson, Z. Gajic, M. Khorami,"Dynamic Compensation of Reactive Power by Variable Shunt Reactors: Control Strategies and Algorithms," CIGRE 2012. [10] DIgSILENT PowerFactory Version 14. URL. <http://www.digsilent.de/>. [11] Cigre Task Force 38-08-08,"Long-term dynamics phase II,"1995. [12] M.R.S. Tirtashi, O. Samuelsson, J. Svensson,"Long-term voltage collapse analysis on a reduced order Nordic system model," in Proc. 2014 IEEE International Universities Power Engineering Conf., pp. 1-6. [13] M.R.S. Tirtashi, O. Samuelsson, J. Svensson," "Control strategies for reactive shunts to improve long-term voltage stability," in Proc. 2013 IEEE International Universities Power Engineering Conf., pp. 1-5.
978-1-5090-4168-8/16/$31.00 ©2016 IEEE
5


Paper IV


VSC-HVDC Application to Improve the Long-Term Voltage Stability
M. Reza Safari Tirtashi, Jörgen Svensson, Olof Samuelsson
IEA, Lund University [email protected], [email protected], [email protected]
Abstract— This paper concerns the VSC-HVDC application to improve the long-term voltage stability. For this purpose the NORDIC32 test system is considered. All necessary dynamics to study the long-term voltage stability are included in the test system. An appropriate control strategy for VSC-HVDC is proposed in the paper. The goal is to reach the best condition from long-term voltage stability perspective with respect to system configuration and also the VSC-HVDC capability curve. To show the capability of the proposed control methodology, two long-term voltage instability scenarios are considered. For the first scenario, VSC-HVDC can lead to a stable condition with its initial active-reactive power set points. In the second voltage instability scenario which is more severe, the proper power flow change in the system using VSC-HVDC is needed to avoid the voltage collapse. Otherwise the VSC-HVDC could buy some time and lead to later collapse which is still important. The simulation results are explained and thoroughly discussed. It is demonstrated that with the proper control of VSC-HVDC, long-term voltage stability could improve dramatically.
I. INTRODUCTION
Due to economical reasons, power systems today work closer to their operating limits and it makes the blackouts more likely to happen. Many of the recent large blackouts were the consequence of voltage collapses [1, 2]. So for the last decades voltage stability has been a big concern for power system planning and operation [3]. In general, voltage stability is the ability of power system to keep the voltage levels within acceptable limits during normal operating condition as well as when the system is subjected to faults [4].
Two time frames are normally considered relating to dynamics in the time-scale of seconds and several minutes respectively [5]. In short term voltage instability, behavior of induction motors, air conditioning loads and HVDC links are important factors while in long-term voltage instability, tap changer actions, distributed voltage regulators and thermostatic loads play important roles [6]. For short term instabilities, only fast devices such as Automatic Voltage Regulators (AVRs) of the generators, HVDC links and also FACTS devices can be used to improve the system stability. On the other hand, tap changers and shunt capacitors and reactors are the conventional and widespread means to regulate the voltage level and also coping with long-term voltage instability problem [5]. Furthermore, VSC-HVDC links are recently utilized to module the power flow in power systems to improve the long-term voltage stability [4, 7].
VSC-HVDC is considered as new flexible control technologies to improve power system performance [8]. Active and reactive powers of the VSC-HVDC can change rapidly within its capability curve and be controlled independently. This is a very interesting feature of this technology to modulate the power flow in the system and support the power system with the best mixture of active and reactive powers during stressed conditions to improve voltage stability [9].
The Swedish national transmission system is originally built to transfer hydro power from the northern part of Sweden which is mainly an export area towards the southern part which is mainly an import area. Although, there are some limited voltage supports in the intermediate region, but still since long transmission lines connect northern and central areas, the voltage collapse at the central or southern parts of Sweden is an inherent feature of the system and indeed central to the blackouts that occurred in 1983 and 2003 [10, 11]. To solve the problem of voltage collapse in the southern part of Sweden, the south-west link is currently being built from the central to the southern part of Sweden. It is a mixture of AC overhead line (the northern part) and DC underground cable (the southern part). The DC part consists of 250 km long DC connection with a transfer capacity of 1200 MW [12].
Considerable research efforts have been devoted to deal with VSC-HVDC links and voltage stability issues in power systems. In [13], VSC-HVDC capability to improve the long-term voltage stability once VSCs hit their current limit is investigated. The classical PV curves are used for investigation. In [8], singular value sensitivity is applied to reach the optimal control of embedded VSC-HVDC for improving the steady-state voltage stability. In both [8, 13], the dynamic simulation is not included which is important when performing realistic analysis of the voltage stability problem. In [9], a comparison study is conducted to investigate the long-term voltage stability improvement once either a new ac transmission line or a VSC-HVDC link is connected to the grid. The VSC-HVDC active-reactive power set points are always fixed regardless of the strength of the disturbances. This strategy is not the optimal solution for voltage stability problem as will be shown in the paper.
In this paper the VSC-HVDC application to improve the long-term voltage stability is investigated. First the
1
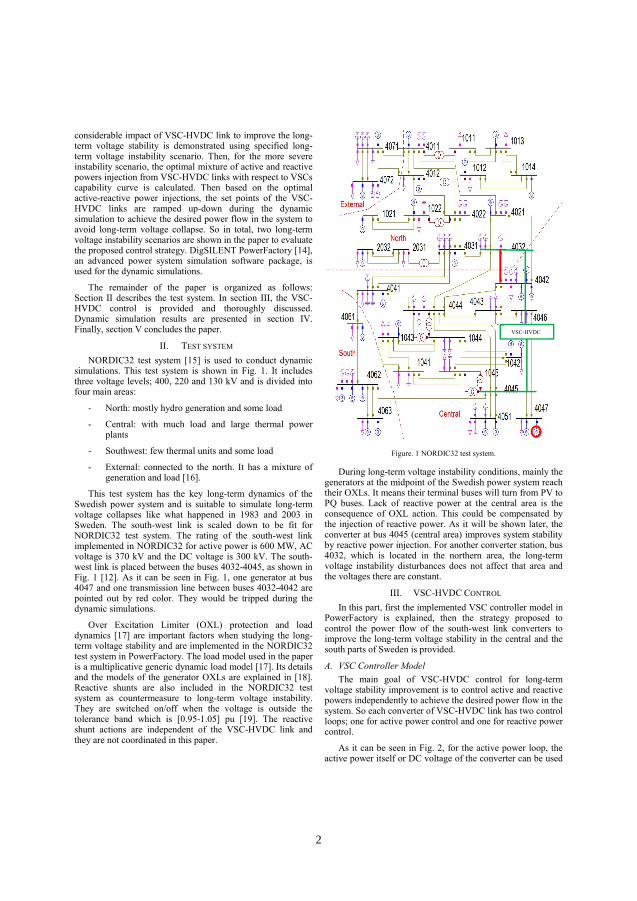
considerable impact of VSC-HVDC link to improve the long-term voltage stability is demonstrated using specified long-term voltage instability scenario. Then, for the more severe instability scenario, the optimal mixture of active and reactive powers injection from VSC-HVDC links with respect to VSCs capability curve is calculated. Then based on the optimal active-reactive power injections, the set points of the VSC-HVDC links are ramped up-down during the dynamic simulation to achieve the desired power flow in the system to avoid long-term voltage collapse. So in total, two long-term voltage instability scenarios are shown in the paper to evaluate the proposed control strategy. DigSILENT PowerFactory [14], an advanced power system simulation software package, is used for the dynamic simulations.
The remainder of the paper is organized as follows: Section II describes the test system. In section III, the VSC-HVDC control is provided and thoroughly discussed. Dynamic simulation results are presented in section IV. Finally, section V concludes the paper.
II. TEST SYSTEM
NORDIC32 test system [15] is used to conduct dynamic simulations. This test system is shown in Fig. 1. It includes three voltage levels; 400, 220 and 130 kV and is divided into four main areas:
- North: mostly hydro generation and some load
- Central: with much load and large thermal power plants
- Southwest: few thermal units and some load
- External: connected to the north. It has a mixture of generation and load [16].
This test system has the key long-term dynamics of the Swedish power system and is suitable to simulate long-term voltage collapses like what happened in 1983 and 2003 in Sweden. The south-west link is scaled down to be fit for NORDIC32 test system. The rating of the south-west link implemented in NORDIC32 for active power is 600 MW, AC voltage is 370 kV and the DC voltage is 300 kV. The south-west link is placed between the buses 4032-4045, as shown in Fig. 1 [12]. As it can be seen in Fig. 1, one generator at bus 4047 and one transmission line between buses 4032-4042 are pointed out by red color. They would be tripped during the dynamic simulations.
Over Excitation Limiter (OXL) protection and load dynamics [17] are important factors when studying the long-term voltage stability and are implemented in the NORDIC32 test system in PowerFactory. The load model used in the paper is a multiplicative generic dynamic load model [17]. Its details and the models of the generator OXLs are explained in [18]. Reactive shunts are also included in the NORDIC32 test system as countermeasure to long-term voltage instability. They are switched on/off when the voltage is outside the tolerance band which is [0.95-1.05] pu [19]. The reactive shunt actions are independent of the VSC-HVDC link and they are not coordinated in this paper.
Figure. 1 NORDIC32 test system.
During long-term voltage instability conditions, mainly the
generators at the midpoint of the Swedish power system reach their OXLs. It means their terminal buses will turn from PV to PQ buses. Lack of reactive power at the central area is the consequence of OXL action. This could be compensated by the injection of reactive power. As it will be shown later, the converter at bus 4045 (central area) improves system stability by reactive power injection. For another converter station, bus 4032, which is located in the northern area, the long-term voltage instability disturbances does not affect that area and the voltages there are constant.
III. VSC-HVDC CONTROL
In this part, first the implemented VSC controller model in PowerFactory is explained, then the strategy proposed to control the power flow of the south-west link converters to improve the long-term voltage stability in the central and the south parts of Sweden is provided.
A. VSC Controller Model
The main goal of VSC-HVDC control for long-term voltage stability improvement is to control active and reactive powers independently to achieve the desired power flow in the system. So each converter of VSC-HVDC link has two control loops; one for active power control and one for reactive power control.
As it can be seen in Fig. 2, for the active power loop, the active power itself or DC voltage of the converter can be used
VSCVVVVVSC-HVDC
2

to construct the desired d-axis current reference signal. The real values for active power also DC voltage first are passed through a filter then are compared to the reference signal. As it can be seen, the active power reference is passed through a ramp function. This function can be used once the active power of the converter is intended to change during the dynamic simulation to achieve the desired power flow in the system. The ramp up-down rate for active power change is set to 30 MW per minute [12]. This rate seems to be slow, but this is because the Swedish TSO wants to be sure that the ramp action will not lead to push further transients on the system. When the real signal is compared to reference signal, it will pass the PI controller. The selection of active power or DC voltage in each converter is done manually. Here for the converter placed at bus 4032, the active power is selected and for the converter placed at bus 4045, the DC voltage is selected to be controlled. Finally the constructed signal will pass a controller to make the d-axis current reference signal.
The same explanation holds for the reactive power loop. In this loop instead of active power, the reactive power is controlled and instead of DC voltage the AC voltage is controlled. Like the active power loop, the reactive power reference is passed through a ramp function. The ramp up-down rate for reactive power change is 50 Mvar per minute. This rate is a bit faster than the active power change. The final goal of reactive power loop is to determine the q-axis current reference signal. The d and q axis current reference signals are used to make control signals for the IGBTs of the converters.
As mentioned, the northern area of the Swedish power system is unaffected following the long-term voltage instability disturbances. So for the converter placed at bus 4032, controlling the AC voltage or reactive power makes no difference. Moreover, the lack of reactive power at the central area happens during the long-term voltage instability. As mentioned, this could be compensated by the reactive power injection by the converter at bus 4045. Here, for this converter also the converter located at bus 4032, the reactive power is selected to be controlled.
The parameters of the VSC controllers used in the paper for both the converters placed at buses 4032 and 4045 are: T1=T2=T3=T4=0.005,T5=0.02,T6=0.03,Kp1=2,Kp2=7,Kp3=Kp4=1,Ki1=Ki2=Ki3=Ki4=0.
B. Power Flow Control of South-West Link Converters
As mentioned, one interesting feature of VSC-HVDC links is that it can rapidly change its working point as far as it lies within the capability curve of converters. This property is very interesting to change the power flow in the system during stressed conditions to improve the long-term voltage stability.
The VSC-HVDC can control the power flow either from operator’s order seated in the converter station or in the automatic way from local or remote information obtained from the power system. In the automatic way, the VSC-HVDC will change the power flow in the system after disturbances to have better stability margin [9]. It will be shown in the simulation results that the proper control of active and reactive powers from VSC-HVDC link could lead to avoidance of voltage collapses and large scale blackouts in the system.
Figure. 2 VSC controller model [14].
To trigger the power flow controller of the VSC-HVDC link, the stressed condition should be detected first then the command signal should be sent to the VSC converters to modify the power flow in the AC system. The method used in this paper to detect the stressed condition is based on the central bus voltages measurement. Actually the transmission level buses at the central area (buses 4041, 4042, 4043, 4044, 4045, 4046, 4047 and 4051 in Fig. 1) are monitored continually and once the voltage for the majority of them is below 0.95 pu, then the power flow controller detects the stressed condition and after that changes the power flow of the VSC-HVDC link to improve the long-term voltage stability of the AC system.
When the VSC-HVDC power flow controller detects that it should change the active and reactive power set points based on the central area voltages measurement, then the next step is to determine how much they should change to reach the optimal mixture of active and reactive powers to improve the long-term voltage stability as much as possible. Actually, the best power factor for the VSC-HVDC link should be decided to have the best impact on the AC power flow to reach the best situation from long-term voltage stability perspective. It is really important to improve the AC power system operation during stressed situation [20]. The way to get the optimal mixture of active and reactive power injections from the VSC-HVDC link to improve the long-term voltage stability is explained in [20]. The best power factor is reached when the following active and reactive powers are injected from VSC-HVDC link to AC system:
)δ(δ.VitIdcP 21sin2lim −= (1)
)δ(δ.VitIdcQ 21cos2lim −= (2)
As shown in Fig. 1, the VSC-HVDC link is placed between bus 4032 (which is considered bus 1) and 4045 (which is considered bus 2). Ilimit is the maximum steady state current allowed in the converter, V2 is the AC voltage
3

magnitude at bus 2 (4045) and 1δ is the AC voltage angle at
bus 1 (4032) and 2δ is the AC voltage angle at bus 2 (4045).
The equations (1) and (2) are used to determine the new set points for active and reactive powers of the VSC-HVDC link during stressed conditions. In fact based on these two equations and with respect to the AC power system configuration the ramp up-down function of the south-west link can change the power flow in the system to reach the best possible situation.
IV. SIMULATION RESULTS
To evaluate the capability of the VSC-HVDC link to improve the long-term voltage stability, the simulation results for two long-term voltage instability scenarios are presented and discussed.
The first disturbance applied on the NORDIC32 test system is the tripping of one generator at bus 4047 which is indicated by the red circle in Fig. 1 at 150 s. When the generator is tripped at the central area, then lack of the reactive power is one important problem that shows up in the central and south areas. To improve the long-term voltage stability, the south-west link is placed between buses 4032-4045 in the NORDIC32 test system. At this point, the set points for active and reactive powers are the nominal values and are fixed during the whole simulation [12]. Fig. 3 shows the voltages at different buses of the south part of NORDIC32. As it can be seen in this figure, the VSC-HVDC link could compensate the lack of the reactive power and the voltages are stable in the south area.
To push further stress on the system, the second long-term voltage instability scenario is considered at this point. This scenario is the combination of transmission line and generator outages. In fact in this scenario, the transmission line placed between buses 4032-4042 which is indicated by the red color in Fig. 1 is out of service from the beginning of the simulation, then the generator at bus 4047 is tripped at 150 s during the simulation.
Fig. 4 shows the voltages in the southern part of NORDIC32 for the second scenario. As it can be seen, even the VSC-HVDC link is in place, but still the long-term voltage collapse happens. The collapse also happens for the central area but in the paper the voltages at south part are presented as representative of the system behavior.
After the short-term transients following the disturbances, the system is stable. Then long-term dynamics like tap changer actions, OXL actions also load dynamics take over the system. At this time, some of the generators in the central area reach their over excitation limits and their OXL act to return the field currents to the rated values. Lack of reactive power in the central and south areas is the consequence of OXL action. Meanwhile, to counteract the disturbances effect and compensate the lack of the reactive power, there are some connections and disconnections of the shunt elements in the system but the voltage collapse cannot be avoided as it is shown in Fig. 4. So it could be said that the evolution of the long-term variables lead to voltage collapse in the south and central parts of the NORDIC32 test system.
Figure. 3. Voltage at different buses of the southern part of NORDIC32
test system when the VSC-HVDC link is in place and for scenario 1.
Figure. 4. Voltage at different buses of the southern part of NORDIC32
test system when the VSC-HVDC link is in place and for scenario 2 without active reactive powers ramp function.
To further improve the long-term voltage stability, the ramp functions in Fig. 2 comes to operation to change the reference values for active and reactive powers of the VSC-HVDC link based on the explanations provided in section III, B. The goal is to change the power factor of the south-west link to reach the best possible situation from long-term voltage stability perspective. In fact by changing the power factor of the south-west link, the active and reactive powers injection from the VSC-HVDC link will change, consequently the power flow in the system will also change.
Fig. 5 shows the generated d and q axis current references for buses 4032 and 4045 converters. As it can be seen, once the ramp function comes into operation, the reference currents are changed accordingly to modify the power flow in the system.
The modified power flow in the system is shown in Fig. 6. This figure actually shows the active power transferred by the transmission lines placed between the northern and central areas also the active power of the converter placed at bus 4032 and reactive power of the converter placed at bus 4045. As it can be seen, the active power transferred by the VSC-HVDC link is decreased and on the other hand the reactive power of
0 500 1000 1500 2000 2500 30000.94
0.95
0.96
0.97
0.98
0.99
1
1.01
Time (s)
Vol
tage
(pu
)
4061
4062
4063
0 500 1000 1500 2000 25000.7
0.75
0.8
0.85
0.9
0.95
1
1.05
Time (s)
Vol
tage
(pu
)
4061
4062
4063
4

Figure. 5. d and q axis current references for buses 4032 and 4045
converters when the optimal control and ramp functions come to operation.
Figure. 6. Active powers for the transmission lines connecting the
northern and central areas and for the converter at bus 4032 and also reactive power of the converter at bus 4045.
Figure. 7. Voltage at different buses of the southern part of NORDIC32
test system when the VSC-HVDC link is in place and for scenario 2 with active reactive powers ramp function.
the DC link is increased based on the Eq. 1 and 2. So the power flow in the system is changed to reach the best possible situation from a long-term voltage stability perspective. As it can be seen in Fig. 7, this power flow change leads to total voltage collapse avoidance at southern part of NORDIC32 test
system. It also happens for the voltages at the central part of the system.
So based on Fig. 6 and 7, it can be said that with optimal control of power flow of VSC-HVDC link, the system could withstand such a heavy disturbance and voltage collapse could be avoided totally.
V. CONCLUSION
The VSC-HVDC application to improve the long-term voltage stability is investigated in this paper. An appropriate control strategy is proposed to control the power flow of the VSC-HVDC link to improve the AC system stability as much as possible. The NORDIC32 test system is utilized to investigate the performance of VSC-HVDC link. Two long-term voltage instability scenarios are considered to show the capability of the VSC-HVDC link to enhance the AC power system performance and improve the long-term voltage stability. Simulation results show that the optimal control of VSC-HVDC link leads to voltage collapse avoidance in the system. Many other voltage instability scenarios have been conducted to verify the proposed control method but are not shown in the paper due to space limit. In all other cases, having VSC-HVDC with optimal control leads to long-term voltage stability improvement.
REFERENCES [1] S. Larsson and E. Ek, "The black-out in southern Sweden and eastern Denmark, September 23, 2003," in Proc. 2003 IEEE PES Conf., pp. 1-5. [2] G. Andersson, P. Donalek, R. Farmer, N. Hatziargyriou, I. Kamwa, P. Kundur, N. Martins, J. Paserba, P. Pourbeik, J. Sanchez-Gasca, R. Schulz, A. Stankovic, C. Taylor, and V. Vittal , " Causes of the 2003 Major Grid Blackouts in North America and Europe, and Recommended Meansto Improve System Dynamic Performance," IEEE Trans. Power Systems, vol. 20, pp. 1922-1928, Nov. 2005. [3] A.K. Sinha and D. Hazarika, "A comparative study of voltage stability indices in a power system," Elec. Power and Energy Systems, vol. 22, pp. 589-596, Nov. 2000. [4] P. Kundur, Power System Stability and Control, New York: McGraw-Hill, 1994, p. 1200. [5] T. Van Cutsem, "Voltage instability: phenomena, countermeasures, and analysis methods," in Proc. 2000 IEEE Invited Paper., pp. 208-227. [6] C.W.Taylor, Power system voltage stability, McGraw-Hill, 1994, p. 273. [7] G. Cai, Y. Zhang, R. Chen, and Z. Cai, "A Fast Corrective Load Shedding Control Scheme to Prevent AC/DC Systems Voltage Collapses," European Transaction on Electrical Power, vol. 19, pp. 869-879, Sep. 2009. [8] O. A. Urquidez and L. Xie, "Singular Value Sensitivity Based Optimal Control of Embedded VSC-HVDC for Steady-State Voltage Stability Enhacement," IEEE Trans. Power Systems, vol. 31, pp. 216-225, Jan. 2015. [9] H.F. Latorre and M. Ghandhari, "Improvement of Voltage Stability by Using VSC-HVDC," in Proc. 2009 Transmission & Distribution Conference & Exposition: Asia and Pacific., pp. 1-4. [10] R. Kearsley, "Restoration in Sweden and Experience Gained from the Blackout of 1983," IEEE Trans. Power Systems, vol. 2, pp. 422-428, May 1987. [11] S. Larsson and A. Danell, "The black-out in southern Sweden and eastern Denmark, September 23, 2003," in Proc. 2006 IEEE PES Conf., pp. 309-313. [12] http://www.svk.se/. [13] L. Zeni, H. Johannsson, A.D. Hansen, P.E. Sørensen, B. Hesselbæk and P.C. Kjær, "Influence of Current Limitation on Voltage Stability with Voltage Sourced Converter HVDC," in Proc. 2013 4th
0 500 1000 1500 2000 2500 3000
-1
-0.5
0
0.5
1
Time(s)
Id,q
-ref
(pu
)
4032-qref
4032-dref
4045-qref
4045-dref
0 500 1000 1500 2000 2500 30000
100
200
300
400
500
600
700
800
Time(s)
Act
ive-
Rea
ctiv
e P
ower
s(M
W,
Mva
r)
Line 4021-4042
Converter 4032
Converter 4045
Line 4032-4044
Line 4031-4041
0 500 1000 1500 2000 2500 30000.94
0.95
0.96
0.97
0.98
0.99
1
1.01
Time(s)
Vol
tage
(pu)
4061
4062
4063
5

IEEE PES Innovative Smart Grid Technologies Europe (ISGT Europe) Conf., pp. 1-5. [14] DIgSILENT PowerFactory Version 14. URL. <http://www.digsilent.de/>. [15] CIGRE Task Force 38-02-08, "Long Term Dynamics Phase II, Final Report," CIGRE publication, March 1995. [16] K. Walve and A. Edström, "The Training Simulator ARISTO-Design and Experiences," in Proc. 1999 IEEE PES Winter Meeting Conf., pp. 545-547. [17] T. V. Cutsem, C. Vournas, Voltage stability of electric power systems, Springer US, 1998, p. 378.
[18] M.R.S. Tirtashi, O. Samuelsson and J. Svensson, "Long-term voltage collapse analysis on a reduced order Nordic system model," in Proc. 2014 IEEE International Universities Power Engineering Conf., pp. 1-6. [19] M.R.S. Tirtashi, O. Samuelsson and J. Svensson, "Control strategies for reactive shunts to improve long-term voltage stability," in Proc. 2013 IEEE International Universities Power Engineering Conf., pp. 1-5. [20] S. G. Johansson, G. Asplund, E. Jansson and R. Rudervall, "Power System Stability Benefits with VSC DC-Transmission Systems," in Proc. 2004 Cigre, pp. 1-8.
6

Paper V


0885-8977 (c) 2016 IEEE. Personal use is permitted, but republication/redistribution requires IEEE permission. See http://www.ieee.org/publications_standards/publications/rights/index.html for more information.
This article has been accepted for publication in a future issue of this journal, but has not been fully edited. Content may change prior to final publication. Citation information: DOI 10.1109/TPWRD.2017.2719578, IEEETransactions on Power Delivery
1
Abstract—The small-disturbance electro-mechanical dynamics of a power system can be translated to an equivalent circuit model with inductances and capacitances. Damping control of active power in proportion to local frequency as with a VSC-HVDC link or an energy storage then corresponds to introducing a resistor in the circuit model. This letter shows that impedance matching can be used to select resistor value, and equivalently damping controller gain, that gives maximum damping ratio. It is also shown how the concept is employed without a circuit model.
Index Terms— Damping, VSC-HVDC, energy storage
I. INTRODUCTION
AMPING of electro-mechanical oscillations is essentially about affecting active power flow between participating
generators. Actuators that directly modulate active power, such as VSC-HVDC and Energy Storage (ES) are attractive since they have great leverage on oscillations, largely independent of power flow situation. Proportional control with local frequency as input is used for HVDC today [1]. It is efficient for a large span of proportional gains, but there is a certain gain that maximizes damping. This letter shows that this corresponds to impedance matching. Impedance matching has previously been applied to PSS gain selection [2], control of active power at one point [3] and [4], where the latter is based on a continuum model of the power system. Application of impedance matching to VSC-HVDC is new.
II. CIRCUIT MODEL OF TWO-AREA SYSTEM
To introduce impedance matching, we use a circuit model equivalent to the small-disturbance electro-mechanical dynamics of a power system. Using an exact version of the method in [5], we translate the linearized classic second order generator model to an LC-circuit and the line to an inductance. Fig. 1 shows a generic two-area power system with one inter-area mode and its equivalent circuit model. The circuit model has RHVDC and RES representing damping control of the DC link and energy storage seen in the power system. Both these controllers can be formulated as fKP ∆=∆ where ∆P is a supplementary signal added to the active power set-point, K is the gain corresponding to 1/RHVDC or 1/RES and f∆ is the difference in local frequency at VSC-HVDC converters or the deviation in local frequency from nominal frequency at the energy storage. We let the VSC-HVDC case exemplify the
All authors are with Div. of Industrial Electrical Engineering and Automation, Lund University, SE-221 00 Lund, Sweden (e-mail: [email protected]).
1G 2GES1P
A C
D C
D C
A C
DCP
2P
A CPT 1d 11 XX 'X += T2d22 XX 'X +=3X1E
1V 2V2E1 d
1 θ 2 θ2 d
1L 3L
HVDCR
2L
2C1C 1i 2i+
− 1V 2V+
−ESR
Fig. 1. Two-area system with VSC-HVDC or energy storage (top) and equivalent circuit-model with RHVDC or RES that reproduces the small-disturbance electro-mechanical dynamics (bottom). M1=9.26 MJ/MVA and M2=8 MJ/MVA. With p.u. magnitudes: X1=X2=0.25, X3=0.35, P1=P2=1.5, PAC=0.9, PDC=0.6, E1∠δ1=1.07∠0°, E2∠δ2=1.07∠-60°, V1∠θ1=1∠-21°, V2∠θ2=1∠-40°. Equivalently: C1=0.0295, C2=0.0255, L1=L2=0.2690, L3=0.3688.
translation to circuit model: Using the angle separations
111z θ−d= , 212z θ−θ= and speed deviations as states ( 22 θd − depends on 1z and is not needed) yields the state vector
[ ]T2121 zzx ∆∆ω∆ω∆=∆ and the system matrix in Table I, where ωs is the synchronous rotor speed, K1, K2 and K3 are linearization constants and KHVDC is the gain. With
[ ]T2121 iivvx ∆∆∆∆=∆ as state vector for the circuit model the state matrices have the same structure, and with parameters chosen as C1=M1/ωs, C2=M2/ωs, L1=X1/K1, L2=X2/K2, L3=X3/K3 and RHVDC=1/KHVDC they are equal.
III. IMPEDANCE MATCHING
Without damping control (K=1/RHVDC=1/RES=0), the systems in Fig. 1 are both undamped and when the swing mode is excited, energy will oscillate between the two areas or between the two capacitances. When damping control is introduced with a low value of the gain K=1/R (HVDC or ES), swing energy will be dissipated in R and the oscillation is damped as oscillatory eigenvalues move left, see HVDC case in Fig. 2 (left). With too high gain the eigenvalues move to undamped zeroes, corresponding to R being (close to) a short-circuit leaving the circuit again without R. To select R, we propose the impedance matching concept, which states that
TABLE I State matrix of VSC-HVDC Power System and Circuit model State Matrix Power System Equivalent Circuit
=
4443
34333231
23
13
00
000
000
aaaaaa
aa
A
a13=–ωs/M1 a23=ωs/M2
a31=1/(X1/K1+X2/K2)=–a32 a33=–a31/KHVDC=–a34
a43=1/(KHVDCX3/K3)=–a44
a13=–1/C1 a23=1/C2
a31=1/(L1+L2)=–a32
a33=–RHVDCa31=–a34
a43=RHVDC/L3=–a44
M. R. Safari Tirtashi, Student Member, IEEE, O. Samuelsson, Senior Member, IEEE, and J. Svensson
Impedance Matching for VSC-HVDC and Energy Storage Damping Controllers
D

0885-8977 (c) 2016 IEEE. Personal use is permitted, but republication/redistribution requires IEEE permission. See http://www.ieee.org/publications_standards/publications/rights/index.html for more information.
This article has been accepted for publication in a future issue of this journal, but has not been fully edited. Content may change prior to final publication. Citation information: DOI 10.1109/TPWRD.2017.2719578, IEEETransactions on Power Delivery
2
Fig. 2. Root locus of oscillatory mode when changing KHVDC=1/RHVDC (left) and KES=1/RES (right) with pole locations corresponding to no control (x), zeros (o) and impedance matching (*) indicated as well as lines through * and the origin. Plots for circuit model and power system coincide.
maximum energy will be dissipated in R when R=ROPT=|Z| where Z is the complex impedance of the circuit model seen from the terminals of R evaluated at the resonance frequency (e.g. using an iterative procedure). Using L and C values in Fig. 1 gives RHVDC=2.91 at ω OPT=10.2 rad/s, where ωOPT is the absolute value of the relevant eigenvalue. The resulting poles in Fig. 2 show that impedance matching indeed gives pole locations ωσ j± where damping ratio 22/ ωσσς +−= is maximized. Many TSOs use damping ratio to specify minimum damping; usually 3 or 5%. The circuit and power system model in Fig. 1 are equivalent. This makes the root locus in Fig. 2 for changing RHVDC valid also for KHVDC in the power system model and KHVDC=1/RHVDC=0.344 gives maximum ζ. The method is robust: Changing AC power flow from 0.9 to 0 or -0.9 or mechanical damping from 0 to +2 or –2 changes the gain first in the third digit. Setting KHVDC=1/RHVDC=0 and changing RES gives a considerably different root locus, see Fig. 2. Despite this, impedance matching gives maximum ζ (at RES=1.17 and ωOPT=8.41 rad/s) and since models are equivalent KES=1/RES also maximizes ζ.
IV. GAIN SELECTION WITHOUT CIRCUIT MODEL
In a circuit, impedance matching can be based on a measurement at the terminals of R. A voltage ( )tu ωsinˆ is then applied, the current amplitude i is measured and R is set to |Z|= iu ˆ/ˆ . In a power system context this corresponds to modulating active power output of the VSC-HVDC link or ES to excite the electro-mechanical dynamics in open-loop and measuring the resulting frequency deviations, defined as above. Doing this for a range of frequencies gives the Bode magnitude plot of the transfer function from active power input to frequency deviation output; see Fig. 3 for the VSC-HVDC case. The question is at which frequency to read the amplitude. It can be shown (omitted here for brevity) that the relevant frequency is the geometric mean ωOPT= ZPωω of the open-loop pole frequency ωP and the frequency of the corresponding zero ωZ, which are the frequencies at maximum and minimum amplitudes of the Bode magnitude plot. At ωOPT the Bode-diagram reads 9.29 dB=1/0.343. This means a gain KHVDC=0.343 which agrees well with the circuit model value. The Bode-diagram can be obtained from a linearized power system model, but also from repeated time simulations of a model that may be non-linear. Fig. 4 shows simulation of the (linearized) power system model with sinusoidal modulation of VSC-HVDC link active power with amplitude 0.01 p.u. and frequency ωOPT. The output and input signal amplitudes differ
Fig. 3. Gain plot of Bode-diagram of power system in Fig. 1 with VSC-HVDC active power as input and difference in frequency at the converters as output. Damping control is off but mechanical damping D=2 is introduced to avoid infinite and zero amplitude gains.
Fig. 4. Simulation of two-area system in open-loop with VSC-HVDC link active power modulation (left) and response in active power on the parallel AC line to impulse disturbance in G1 mechanical power (5% for 100 ms) for closed-loop system with gain KHVDC=0 and 0.347 (right).
by a factor 0.347, again in agreement with the circuit model. The performance of damping control with optimum gain is shown in Fig. 4 (right). In a real system, sinusoidal excitation should be avoided due to the large gain near the resonance frequency and the resulting excessive mode activity. To be investigated is therefore a non-sinusoidal, low-level, probing signal and use of system identification methods to extract the relevant gain information, possibly permitting self-tuning.
V. CONCLUSIONS
This letter shows that impedance matching can be used as criterion for the gain that gives maximum damping ratio for damping controllers where active power is modulated in proportion to local frequency. The optimum gain is obtained from an equivalent circuit model, from a linearized power system model or from time simulations. The concept also provides valuable intuitive understanding. The results presented here are based on a linearized model of a two-area system, but preliminary results from analysis of a non-linear multi-machine model show that the method is applicable also there and that non-targeted modes are not negatively impacted.
VI. REFERENCES [1] C. Lu, Y. D. Han, J. B. He, X. C. Wu, P. Li, L. C. Li, J. T. Wu, J. H. Shi
and J. Hu, "Wide-area coordinated and adaptive damping control of multiple HVDC links in China southern power grid," in Proc.2010 CIGRE, pp. 1-7.
[2] C. Ivanov, O. Samuelsson, K. Gerasimov, "Selection of PSS gain based on impedance matching," in Proc.2005 ELMA.
[3] O. Samuelsson, "Load modulation at two locations for damping of electro-mechanical oscillations in a multi-machine system," in Proc.2000 IEEE PES Summer Meeting., pp. 1912-1917.
[4] B.C. Lesieutre, E. Scholtz, G.C. Verghese, “Impedance matching controllers to extinguish electromechanical waves in power networks”, in Proc. 2002 IEEE Intl Conf. on Control Applications, pp 25-30.
[5] P. Agnihotri, A. M. Kulkarni, A. M. Gole, "Robust global control strategies for improvement of angular stability using FACTS and HVDC devices," Int J. of Emerging Electric Power Systems, vol. 14, pp 95-104, Jan. 2013.
-2 -1 0 1 2
8.5
9.5
10.5
11.5
Real
Ima
g
-3 -2 -1 0 1
7.5
8.5
9.5
10.5
11.5
Real
Imag
10 15
-10
0
10
20
30
Mag
nitu
de (d
B)
(rad/s)
50 51 52 53 54 55-0.03
-0.01
0.01
0.03
Time (s)
Frequency deviation (pu)Active power (pu)
0 5 10 15 20-0.02
-0.01
0
0.01
0.02
Time (s)
K=0.347K=0
ωP ωOPT ωZ

Paper VI


Paper VII


mo
ha
mm
ad
rez
a sa
far
i tirta
shi
C
ontrol of Voltage and D
amping in B
ulk Power System
s 2018
978
9188
9348
71
Faculty of EngineeringDivision of Industrial Electrical Engineering and Automation
Department of Biomedical EngineeringISBN 978-91-88934-87-1 (print)ISBN 978-91-88934-86-4 (pdf)
CODEN: LUTEDX/(TEIE-1086)/1-165/(2018)
Control of Voltage and Damping in Bulk Power Systemsmohammad reza safari tirtashi
faculty of engineering | lund university
Prin
ted
by M
edia
-Try
ck, L
und
2018
N
ORD
IC S
WA
N E
CO
LABE
L 3
041
0903
mohammad reza safari tirtashi has been a PhD student at the Division of Industrial Electrical Engineering and Automation, Lund University, Sweden. He has a Master’s degree in Electrical Engine-ering (Power) from Zanjan University, Iran.
His PhD research is focused on power system dynamics and stability. Particularly he did work on voltage and damping controls in bulk power systems.