controllable synthesis, shape evolution, and luminescence properties of uniform and well-dispersed...
TRANSCRIPT

Materials Research Bulletin 48 (2013) 2797–2803
Controllable synthesis, shape evolution, and luminescence properties of uniformand well-dispersed NaEuF4 microcrystals through hydrothermal route
Zhenhe Xu *, Qian Zhao, Fu Ding, Yaguang Sun **
Laboratory of Coordination Chemistry, College of Applied Chemistry, Shenyang University of Chemical Technology, Shenyang 100142, PR China
A R T I C L E I N F O
Article history:
Received 22 November 2012
Received in revised form 24 March 2013
Accepted 2 April 2013
Available online 17 April 2013
Keywords:
Chemical synthesis
Microstructure
Optical properties
Fluorides
Inorganic compounds
A B S T R A C T
Sodium europium fluorides NaEuF4 microcrystals with uniform and well-dispersed shapes and
dimensions have been prepared via a facile hydrothermal route using Na3Cit as the chelating ligand and
shape modifier. X-ray diffraction (XRD), scanning electron microscopy (SEM), transmission electron
microscopy (TEM), high-resolution transmission electron microscopy (HRTEM), selected-area electron
diffraction (SAED), energy-dispersive X-ray (EDX) and photoluminescence spectra (PL) were taken to
characterize the samples. A series of controlled experiments reveal that the trisodium citrate (Na3Cit)
content, pH value of the initial solution, and reaction time have an indispensable role on the phase, size,
and morphology of the as-prepared microcrystals. Based on the experimental results, the possible
growth mechanism of the microcrystals prepared under different conditions was proposed. Moreover,
we systematically investigated the luminescent properties of the as-prepared microcrystals with
different morphologies obtained under different amounts of Na3Cit, which have potential application in
the fields of color display, UV laser and biomedicine.
� 2013 Elsevier Ltd. All rights reserved.
Contents lists available at SciVerse ScienceDirect
Materials Research Bulletin
jo u rn al h om ep age: ww w.els evier .c o m/lo c ate /mat res b u
1. Introduction
In recent years, inorganic nano- or microscale materials withwell-defined shapes and accurately tunable sizes are becomingmore and more important in the development of modernchemistry and materials science areas because the electronicstructure, bonding, surface energy, and chemical reactivity aredirectly related to their surface shape [1]. Many syntheticmethodologies including hydro-/solvothermal method [2], sol–gel process [3], solution combustion synthesis [4], microemulsion[5], coprecipitation reaction [6] have been explored widely for thesynthesis of a large range of nanostructures. Among thesefabrications, the hydrothermal route has been proved to be oneof the most effective and convenient approaches in preparingvarious inorganic materials with high crystallinity and diversecontrollable morphologies due to its gentle synthetic conditions,ease of operation, precise manipulation, and tunable reactionparameters [7–13]. Furthermore, the shape and phase of the finalproduct are determined by the selection of appropriate organicadditives and synthetic conditions, such as the contents of organicadditives, pH value of the initial solution and reaction time during
* Corresponding author. Tel.: +86 024-89389359.
** Corresponding author.
E-mail addresses: [email protected] (Z. Xu), [email protected] (Y.
Sun).
0025-5408/$ – see front matter � 2013 Elsevier Ltd. All rights reserved.
http://dx.doi.org/10.1016/j.materresbull.2013.04.023
the hydrothermal process [14–16]. Particularly, different kinds oforganic additives have been used extensively in order to achievemorphology and size control, the surface energies of the crystalscan be changed effectively and the kinetics of the crystal growthcan be modulated because of the preferentially adheres on certaincrystal surfaces of the functional groups of the organic additives,which lead to the morphological modification of the crystals [17–19]. As one of the most common and important stabilizer agent andshape modifier, Na3Cit are used widely to control the nucleation,growth, and alignment of crystals due to its high thermal stabilityand a powerful ability to form complexes with diverse metal ions[20–22]. Wang’s group have synthesized Yb3+, Ho3+ co-dopedBaGdF5 solid-solution with different morphologies by using Na3Citas chelating agent [23]. A series of parallel experiments werecarried out in the presence of Na3Cit by Li and co-workers, whichsubstantiates the important influence of Na3Cit on the shapeevolution of NaLuF4 product [24].
On the other hand, as a group of important luminescentmaterials, the field of rare earth materials has received muchresearch attention because they have many promising applicationsdue to their excellent electronic and luminescence propertiesresulting from their 4f electrons [25]. Among different types of rareearth phosphors, NaREF4 has several advantages over other rareearth materials owing to their unique applications such as opticaltelecommunication [26,27], lasers [28], biochemical probes[29,30], and low-intensity IR imaging [31] and sensing [32]. Oneexample of fluoride compounds is NaEuF4, which is an excellent

Z. Xu et al. / Materials Research Bulletin 48 (2013) 2797–28032798
matrix light-emitting material. Until now, some strategies havebeen explored to selectively prepare the NaEuF4 nano- andmicrocrystals with diverse morphologies and sizes. For instance,Wang et al. [33] have achieved NaEuF4 submicron disks withEu(NO3)3, NaF and citric acid as starting materials under stirringconditions and at the temperature of 80 8C. A hydrothermalmethodology provided by Xun’s group was used to synthesis thefluorite type NaEuF4 [34]. NaEuF4 nanocrystals with orderedstructures and emissions were prepared though a facile method byWang and co-workers [35]. Despite these endeavors, it is stillsignificant and urgent to develop more facile, efficient, and lowcost techniques to fabricate large-scale and well-crystallizedNaEuF4 nano- or microstructures.
In this paper, we used Na3Cit as the structure-directing agentfor the synthesis of NaEuF4 nano- or microcrystals by a facile andefficient hydrothermal route. The influences of diverse parameters,such as the Na3Cit content, pH value of the initial solution, andreaction time on the phase, shape and dimension of the finalproducts have been investigated. A possible formation mechanismof these samples has also been proposed. Additionally, thephotoluminescence properties of the as-prepared samples withdifferent phases and morphologies, which are prepared underdifferent content of Na3Cit are also discussed in detail.
2. Experimental
2.1. Materials
The Europium oxides Eu2O3 (99.99%) were purchased fromScience and Technology Parent Company of Changchun Institute ofApplied Chemistry, and other chemicals including analytical gradeNaBF4, Na3Cit, and NaOH were purchased from SinopharmChemical Reagent Co., Ltd. All chemicals are of analytical gradereagents and used directly without further purification. Europiumchloride stock solutions of 0.2 M were prepared by dissolving thecorresponding metal oxide in hydrochloric acid at elevatedtemperature.
2.2. Preparation of NaEuF4 microcrystals
In a typical procedure for the synthesis of NaEuF4, 5 mL of EuCl3
(0.2 mol L�1) was added into 10 mL of aqueous solution containing0.8 g of Na3Cit to form the Eu3+–Cit3� complex. After vigorousstirring for 30 min, 0.35 g NaBF4 was introduced into the abovesolution. The pH of the mixture was measured to be 6.0. Afteradditional agitation for 15 min, the as-obtained mixing solution
Fig. 1. XRD patterns of the as-prepared microcrystals prepared at 180 8C for 24 h with dif
Na3Cit (B), and the standard data for orthorhombic EuF3 (JCPDS 33-0542) and hexagon
was transferred into a Teflon bottle held in a stainless steelautoclave, sealed, and maintained at 180 8C for 24 h. As theautoclave cooled to room temperature naturally, the precipitatesat the bottom were separated by centrifugation, washed withdeionized water and ethanol in sequence, and then dried in air at80 8C for 12 h.
Different contents of Na3Cit (0, 0.2 and 0.6 g), different pHvalues (5, 8, and 10) and different reaction times (0.5 h, 3 h and12 h) were selected to investigate the effects of these factors on themorphologies and dimension of the as-prepared samples, whileother reaction parameters remained unchanged.
2.3. Characterizations
Powder X-ray diffraction (XRD) measurements were performedon a Rigaku-Dmax 2500 diffractometer with Cu Ka radiation(l = 0.15405 nm). The morphologies and composition of the as-prepared samples were inspected on a field emission scanningelectron microscope (FESEM, S4800, Hitachi) equipped with anenergy-dispersive X-ray spectrum (EDX, JEOL JXA-840). Low- andhigh-resolution transmission electron microscopy (TEM) wasperformed using FEI Tecnai G2 S-Twin with a field emission gunoperating at 200 kV. Images were acquired digitally on a Gatanmultiople CCD camera. The PL excitation and emission spectrawere recorded with a Hitachi F-7000 spectrophotometer equippedwith a 150 W xenon lamp as the excitation source. All measure-ments were performed at room temperature.
3. Results and discussion
3.1. Phase, structure, and morphology
In our current system to prepare the NaEuF4, it is found that thecrystal structures, shapes and morphologies of the products areinfluenced by the content of Na3Cit and pH value of the initialsolution [36]. Fig. 1A exhibits the XRD patterns of the productsobtained using different amounts of Na3Cit (a = 0, b = 0.2, c = 0.6and d = 0.8 g) with the pH value of 6 at 180 8C for 24 h. It can beobserved that the diffraction peaks of sample a and b can be wellindexed to the orthorhombic EuF3 phase, which coincide well withthe literature values (JCPDS 33-0542). By increasing the Na3Citamount to 0.6 g (sample c) and 0.8 g (sample d), we can see that thestrong peaks of the hexagonal NaEuF4 phase appear (JCPDS 49-1897) and the diffraction peaks of EuF3 phase disappear. Fig. 1Bshows the XRD patterns of the as-prepared samples synthesizedwith 0.8 g Na3Cit at 180 8C for 24 h under the various pH values
ferent contents of Na3Cit under pH value of 6 (A) and different pH values under 0.8 g
al NaEuF4 (JCPDS 49-1897) as a reference.

Fig. 2. SEM (A and B), TEM (C), HRTEM (D) images, and EDX (E) spectrum of the as-
prepared NaEuF4 erythrocyte-like spheres. The inset of (D) is the corresponding
SAED pattern taken from a single microcrystal.
Z. Xu et al. / Materials Research Bulletin 48 (2013) 2797–2803 2799
(e = 5, f = 6, g = 8, h = 10) conditions. Vertical bars show thestandard hexagonal NaEuF4 (JCPDS 49-1897) for comparison. Thediffraction peaks of these samples are very strong and sharp,implying that the products with high crystallinity can besynthesized by this method. This is important for phosphors,because high crystallinity generally means less traps and strongerluminescence.
The morphologies features and composition of the hexagonalNaEuF4 microcrystals prepared with 0.8 g Na3Cit at 180 8C for 24 hunder pH value of 6 were examined by FE-SEM, TEM, HRTEM, SEADimages and EDX spectrum. From Fig. 2A, a large scale of uniformerythrocyte-like NaEuF4 microstructures with well-dispersed andnarrow size distribution are observed. As shown in the high-magnification SEM image (Fig. 2B), each particle has a roundconcave in the center and a rough surface. The erythrocyte-likemicrospheres have an average diameter of 1.30 mm and thethickness of the edge is about 600 nm. In Fig. 2C, the TEM imageexhibits a similar shape and size to the SEM image. It should benoted that the fringe of microstructures is much thicker than thecenter. The HRTEM image (Fig. 2D) reveals that the interplanardistance between the adjacent lattice fringes is determined to be0.296 nm and it is agrees well with the standard value of d1 0 1
spacing in hexagonal NaEuF4 phase (JCPDS 49-1897). In the SAEDimage (inset in Fig. 2D), the strong concentric ring patterns candemonstrate its polycrystalline nature. Additionally, the chemicalcomposition of the NaEuF4 microstructures is further investigatedwith EDX and it is indicates that the product is made of Na, Eu and Felements (Fig. 2E).
3.2. Effect of factors on dimension and morphology
In previous reports, the phase, size and morphology of the as-prepared samples were strongly affected by different reactionparameters in various synthesis process [37–39]. In this paper, wefocus our attention on the influence of Na3Cit content, pH value ofthe initial solution and reaction time on the phase, size andmorphology of final products. The results indicate that productswith various phases and morphologies can be obtained by tuningthe conditions mentioned above. Furthermore, we presented apossible growth mechanism for the as-prepared microcrystalswith various morphologies.
Fig. 3. SEM images of the samples obtained at 180 8C for 24 h with dif
3.2.1. Effect of sodium citrate content
It is well known that the Na3Cit is a strong chelating agent withthree carboxylate groups for metal ions. In this experiment, itreacts with Eu3+ ions to form stable Eu3+–Cit3� complexes throughstronger coordination interaction and the controlled release ofEu3+ ions from an Eu3+–Cit3� complex helps to separate thenucleation and growth process, and the capping of Cit3� on thesurface of prepared microcrystals prevents further aggregation[40]. In our current system, the samples were prepared with pH
ferent Na3Cit (A: 0 g; B: 0.2 g; C: 0.6 g; D: 0.8 g) at pH value of 6.

Z. Xu et al. / Materials Research Bulletin 48 (2013) 2797–28032800
value of 6 at 180 8C for 24 h under the different amounts of Na3Cit(0, 0.2, 0.6 and 0.8 g). For the sample prepared without Na3Cit(Fig. 3A), the microcrystals tend to aggregate into layered sheet-like EuF3 aggregation with roughly surfaces and they have anaverage size of about 700 nm. However, when a small quantity ofNa3Cit (0.2 g) was introduced into the reaction system, some EuF3
oblate spheroids with a size of 1.70 mm can be found in Fig. 3B.Obviously, their surface is more smoothy and their dimension islarger compared with that prepared without Na3Cit. This indicatesthat the structure and morphology of EuF3 products are stronglyinfluenced by citrate anions. Fig. 3C shows the SEM image of thesample prepared with 0.6 g Na3Cit, much more relative regularNaEuF4 oblate spheroids are found compared with the former one.Moreover, some concave centers began to appear on the top of thesamples. By further addition of the Na3Cit (0.8 g), the as-preparedmicrocrystals (Fig. 3D) were assembled with uniform erythrocyte-like microcrystals and exhibit considerable monodispersity.
3.2.2. Effect of the pH values
In order to investigate effect of pH values on the morphology ofNaEuF4 microspheres, a series of contrast experiments wereconducted. The SEM images of the products prepared with 0.8 gNa3Cit at 180 8C for 24 h under different pH values are shown inFig. 4. When the pH value is 5, the product is composed of a largescale of regular sheet-like microcrystals with the average size ofaround 600 nm (Fig. 4A). When the pH value was manipulated to 6,the morphology of sample transforms remarkably. As shown inFig. 4B, many monodisperse erythrocyte-like microcrystals withobvious concave centers on the top surfaces and the average lengthof them is calculated to about 1.30 mm. When the pH value isincreased to 8, the product still exhibits oblate spheroidmorphology with a size of 800 nm (Fig. 4C). Obviously, theconcave centers of these microcrystals are smaller than that of thesample prepared at pH 6. Further increasing the pH value to 10, thehierarchical oblate spheroids become the dominant morphology ofthe product (Fig. 4D). Moreover, careful observation indicates thatthe microparticles assembly increases gradually in size (1.00 mm)with the pH increasing. Additionally, the microcrystals with grownsize and sheet structure are assembled along the radial direction ofspheroids.
Fig. 4. SEM images of the samples obtained at 180 8C for 24 h with
3.2.3. Effect of the reaction time
To further understand the morphology evolution and speculatethe possible growth mechanism of the NaEuF4 microcrystals, time-dependent experiments were carried out with 0.8 g Na3Cit bykeeping the pH value of 6 at 180 8C (Fig. 5). At the initial stage of0.5 h, a mass of smooth and regular oblate particles with 650 nm indiameter are discovered in Fig. 5A. When the reaction time isprolonged to 3 h, these microstructures evolve into erythrocyte-like particles with a size of about 800 nm. It is should be noted thatthe top of some crystals have obvious concave centers, as shown inFig. 5B. When the reaction time is increased to 12 h, the as-prepared layered sheet-like microcrystals with a diameter of750 nm and a thickness of 280 nm show relatively rough surface(Fig. 5C). By increasing the reaction time to 24 h, uniform andmonodisperse erythrocyte-like spheres was obtained (Fig. 5D). But,careful observations of the magnified images imply that thearchitecture aggregates increase gradually in size with the reactionproceeding, and the corresponding diameter and thickness is about1.30 mm and 650 nm, respectively. According to the above process,the growth and directed attachment of the NaEuF4 microparticlescan be distinctly observed, which visually demonstrate the crystalgrowth and self-assembly process.
3.3. Formation mechanism for the NaEuF4 microcrystals
Based on the above analysis, it can be concluded that Na3Citaffect drastically the phases and morphologies of the finalproducts. The effect of Cit3� ions on the crystal phase can bediscussed as follows: Eu3+ ions react with Cit3� ions to produceEu3+–Cit3� complexes in the solution (Eq. (1)) [41,42]. When thereis a small amount of Na3Cit (or Na3Cit = 0 g) exist in the initialsolution, this situation is not favorable for the formation of theEu3+–Cit3� from the reaction equilibrium. As a result, the Eu3+ orEu3+–Cit3 in the solution react with F�which is released from BF4
�.And it promotes the formation of the EuF3. On the contrary, themolar amounts of F� and Na+ ions will gradually turn equal withthe improvement of the amount of Na3Cit in the reaction system. Inthis case, Eu3+ released from the Eu3+–Cit3� complexes react withabundant F� and Na+–Cit3� to form the crystal nuclei of NaEuF4. Ascan be seen from the reaction, corresponding Eu3+–Cit3� are
0.8 g Na3Cit under different pH values (A: 5; B: 6; C: 8; D: 10).
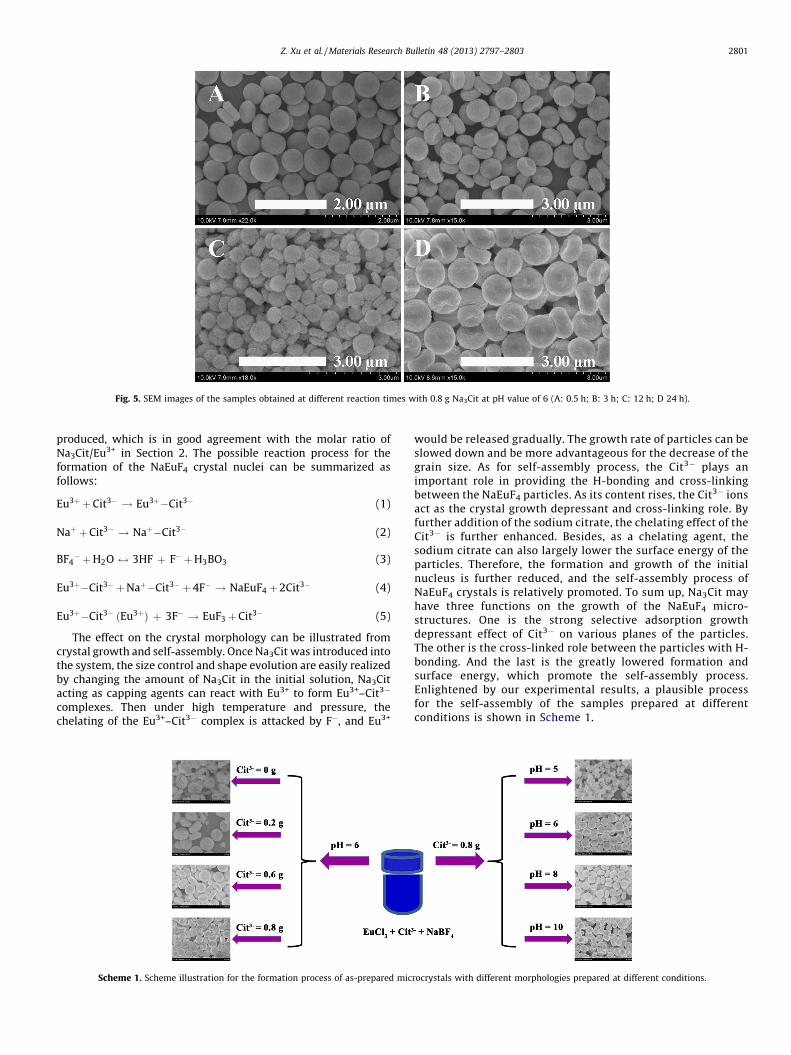
Fig. 5. SEM images of the samples obtained at different reaction times with 0.8 g Na3Cit at pH value of 6 (A: 0.5 h; B: 3 h; C: 12 h; D 24 h).
Z. Xu et al. / Materials Research Bulletin 48 (2013) 2797–2803 2801
produced, which is in good agreement with the molar ratio ofNa3Cit/Eu3+ in Section 2. The possible reaction process for theformation of the NaEuF4 crystal nuclei can be summarized asfollows:
Eu3þ þ Cit3� ! Eu3þ�Cit3� (1)
Naþ þ Cit3� ! Naþ�Cit3� (2)
BF4� þ H2O $ 3HF þ F� þ H3BO3 (3)
Eu3þ�Cit3� þ Naþ�Cit3� þ 4F� ! NaEuF4þ 2Cit3� (4)
Eu3þ�Cit3� ðEu3þÞ þ 3F� ! EuF3þ Cit3� (5)
The effect on the crystal morphology can be illustrated fromcrystal growth and self-assembly. Once Na3Cit was introduced intothe system, the size control and shape evolution are easily realizedby changing the amount of Na3Cit in the initial solution, Na3Citacting as capping agents can react with Eu3+ to form Eu3+–Cit3�
complexes. Then under high temperature and pressure, thechelating of the Eu3+–Cit3� complex is attacked by F�, and Eu3+
Scheme 1. Scheme illustration for the formation process of as-prepared mic
would be released gradually. The growth rate of particles can beslowed down and be more advantageous for the decrease of thegrain size. As for self-assembly process, the Cit3� plays animportant role in providing the H-bonding and cross-linkingbetween the NaEuF4 particles. As its content rises, the Cit3� ionsact as the crystal growth depressant and cross-linking role. Byfurther addition of the sodium citrate, the chelating effect of theCit3� is further enhanced. Besides, as a chelating agent, thesodium citrate can also largely lower the surface energy of theparticles. Therefore, the formation and growth of the initialnucleus is further reduced, and the self-assembly process ofNaEuF4 crystals is relatively promoted. To sum up, Na3Cit mayhave three functions on the growth of the NaEuF4 micro-structures. One is the strong selective adsorption growthdepressant effect of Cit3� on various planes of the particles.The other is the cross-linked role between the particles with H-bonding. And the last is the greatly lowered formation andsurface energy, which promote the self-assembly process.Enlightened by our experimental results, a plausible processfor the self-assembly of the samples prepared at differentconditions is shown in Scheme 1.
rocrystals with different morphologies prepared at different conditions.

Fig. 7. Emission spectra of (A) NaEuF4 prepared with 0.6 g Na3Cit (the bottom line)
Z. Xu et al. / Materials Research Bulletin 48 (2013) 2797–28032802
3.4. Photoluminescence properties of as-prepared microcrystals
Because different phases and morphologies of the samplesgreatly affect the emission intensity and the shapes of the spectra,samples prepared with different amounts of Na3Cit at 180 8C for24 h by keeping pH value of 6 were selected to investigate theluminescence properties of NaEuF4 and EuF3 microcrystals.
The room-temperature excitation and emission spectra ofNaEuF4 and EuF3 microcrystals are shown in Fig. 6. By monitoringat 617 nm, the excitation spectra of NaEuF4 microcrystals preparedwith 0.8 g Na3Cit (Fig. 6A, left) consists of many sharp peaks, whichdue to the characteristic 4f ! 4f transitions of Eu3+ from theground state 7F0 to the excited levels and the maximum peak at394 nm is attributed to 7F0! 5L6 transition. Upon excitation at394 nm, the emission spectrum of NaEuF4 sample (Fig. 6A, right) iscomposed of a group of lines at about 594, 617, 651, and 692 nm,which can attributed to 5D0! 7FJ (J = 1, 2, 3 and 4) transition linesof Eu3+ ions, respectively. The emission spectrum is dominated bythe red 5D0! 7F2 (616 nm) transition of Eu3+. The excitationspectrum of EuF3 microcrystals prepared with 0.2 g Na3Cit (Fig. 6B,left), which is similar with that of NaEuF4, is achieved at 594 nm.For emission spectrum of the sample EuF3 (Fig. 6B, right), whichwas also obtained at 394 nm, it exhibits five groups of emissionlines, which are ascribed to the 5D0–7FJ (J = 0, 1, 2, 3 and 4)transitions of the Eu3+ ions, respectively. However, the emissionspectrum is dominated by the orange-red 5D0! 7F1 (594 nm)transition of Eu3+. This is because the ratio of the 5D0! 7F1 and5D0! 7F2 transition is determined by the symmetry of thecoordination environment for Eu3+ ions. When Eu3+ are locatedin a site with inversion symmetry, the emission is dominanted by
Fig. 6. Excitation (left) and emission spectra (right) of NaEuF4 (A) and EuF3 (B)
microcrystals prepared at 180 8C for 24 h with different contents of Na3Cit at PH
value of 6.
and 0.8 g Na3Cit (the top line), (B) EuF3 prepared with 0 g Na3Cit (the bottom line)
and 0.2 g Na3Cit (the top line).
5D0! 7F1 transition, while in a site without inversion symmetry,the 5D0! 7F2 transition is dominanted. As a result, the differencebetween emission spectra of NaEuF4 and EuF3 are affected by theirdifferent phases.
Fig. 7A shows the emission spectra of NaEuF4 products preparedwith 0.6 g Na3Cit (blank line) and 0.8 g Na3Cit (red line). Fig. 7Bexhibits the emission spectra of EuF3 products prepared with 0 gNa3Cit (blank line) and 0.2 g Na3Cit (red line). It can be seen clearlythat the emission spectra of samples with the same phase aresimilar in shape, the possibly reason for this is that the emission ofEu3+ resulting from f ! f transitions are strongly shielded by theoutside 5s and 5p electrons. However, the bands of these emissionspectra differ greatly in their intensities. The main reason is thatthe smaller microcrystals (blank line) have the lower relativeemission intensity, while the larger microspheres (red line) showthe higher intensity. It is well-known that the surface area ofmaterials increases along with a decrease in size. The large surfacearea introduces a large number of defects into the phosphorcrystal. If the surface area is greatly reduced, which results fromincreased crystallite size, a phosphor with fewer defects wouldshow great improvement in the PL intensity [43,44].
4. Conclusions
In conclusion, we have demonstrated a facile and mildhydrothermal method for the synthesis of uniform and well-dispersed NaEuF4 microcrystals. The crystal structure, shape, andluminescence properties were characterized by XRD, FT-IR, SEM,TEM, and PL. The results indicate that the phase, size and shape arestrongly influenced by adjusting the sodium citrate content, pHvalue, and reaction time. The possible formation mechanism wasproposed to explain the crystal growth and self-assembly process

Z. Xu et al. / Materials Research Bulletin 48 (2013) 2797–2803 2803
of as-prepared products. In addition, we also investigated theluminescent properties of the as-prepared products with diversephases and various shapes, which have potential application in thefields of color display, UV laser and biomedicine. More importantly,the results not only expand the knowledge of the properties of rareearth fluorides luminescence, but also contribute to the principlesof the crystal growth and dimension transition of these kinds ofinorganic materials.
Acknowledgments
This work was conducted in the framework of a project sponsoredby the Natural Science Foundation of China (No. 21071100), SRF forROCS, SEM, Liaoning BaiQianWan Talents Program and the DoctorFoundation of Liaoning Province (No. 20071016).
References
[1] F. Caruso, R.A. Caruso, H. Mohwald, Science 282 (1998) 1111.[2] H. Wu, H.F. Xu, Q. Su, T.H. Chen, M.M. Wu, J. Mater. Chem. 13 (2003) 1223.[3] M. Yu, J. Lin, Z. Wang, J. Fu, S. Wang, H.J. Zhang, Y.C. Han, Chem. Mater. 14 (2002)
2224.[4] S. Ekambaram, K.C. Patil, J. Alloys Compd. 217 (1995) 104.[5] L.D. Sun, Y.X. Zhang, J. Zhang, C.H. Yan, C.S. Liao, Y.Q. Lu, Solid State Commun. 124
(2002) 35.[6] Y.H. Li, G.Y. Hong, J. Solid State Chem. 178 (2005) 645.[7] L.Y. Wang, Y.D. Li, Chem. Mater. 19 (2007) 727.[8] Y. Huang, H. You, G. Jia, Y. Zheng, Y. Song, M. Yang, K. Liu, L. Zhang, J. Phys. Chem. C
113 (2009) 16962.[9] W.W. Wang, J.L. Yao, J. Phys. Chem. C 113 (2009) 3070.
[10] G. Wang, Q. Peng, Y. Li, Acc. Chem. Res. 44 (2011) 322.[11] X. Hu, G. Li, J.C. Yu, Langmuir 26 (2009) 3031.[12] V. Polshettiwar, B. Baruwati, R.S. Varma, ACS Nano 3 (2009) 728.[13] K. Liu, H.G. Fu, K.Y. Shi, F.S. Xiao, L.Q. Jing, B.F. Xin, J. Phys. Chem. B 109 (2005)
18719.[14] Y. Sun, Y. Xia, Adv. Mater. 14 (2002) 833.[15] Y.L. Hou, H. Kondoh, T. Ohta, Chem. Mater. 17 (2005) 3994.
[16] L. Guo, F. Liang, X.G. Wen, S.L. Yang, L. He, W.Z. Zheng, C.P. Chen, Q.P. Zhong, Adv.Funct. Mater. 17 (2007) 425.
[17] R.Q. Song, A.W. Xu, S.H. Yu, J. Am. Chem. Soc. 129 (2007) 4152.[18] Y.D. Yin, A.P. Alivisatos, Nature 437 (2005) 664.[19] Z.J. Luo, H.M. Li, H. Shu, K. Wang, J.X. Xia, Y.S. Yan, Cryst. Growth Des. 8 (2008)
2275.[20] J.Q. Hu, Q. Chen, Z.X. Xie, G.B. Han, R.H. Wang, B. Ren, Y. Zhang, Z.L. Yang, Z.Q. Tian,
Adv. Funct. Mater. 14 (2004) 183.[21] X.H. Ji, X.N. Song, J. Li, Y.B. Bai, W.S. Yang, X.G. Peng, J. Am. Chem. Soc. 129 (2007)
13939.[22] Z.R. Tian, J.A. Voigt, J. Liu, B. Mckenzie, M.J. Mcdermott, M.A. Podriguez, H. Konishi,
H. Xu, Nat. Mater. 2 (2003) 821.[23] L.N. Guo, Y.Z. Wang, Y.H. Wang, J. Zhang, P.Y. Dong, CrystEngComm 14 (2012) 3131.[24] C.X. Li, J. Yang, P.P. Yang, X.M. Zhang, H.Z. Lian, J. Lin, Cryst. Growth Des. 8 (2008)
923.[25] S. Ghosh, T.F. Rosenbaum, G. Aeppli, S.N. Coppersmith, Nature 425 (2003) 48.[26] E. Downing, L. Hesselimk, J. Ralston, R. Macfarlane, Science 273 (1996) 1185.[27] X. Sun, Y.W. Zhang, Y.P. Du, Z.G. Yan, R. Si, L.P. You, C.H. Yan, Chem. Eur. J. 13
(2007) 2320.[28] T.-C. Liu, B.-M. Cheng, S.-F. Hu, R.-S. Liu, Chem. Mater. 23 (2011) 3698.[29] G. Yi, H. Lu, S. Zhao, G. Yue, W. Yang, D. Chen, L. Guo, Nano Lett. 4 (2004) 2191.[30] L. Wang, Y. Li, Chem. Commun. 24 (2006) 2557.[31] Z.Y. Hou, C.X. Li, P.G. Ma, G.G. Li, Z.Y. Cheng, C. Peng, D.M. Yang, P.P. Yang, J. Lin,
Adv. Funct. Mater. 21 (2011) 2356.[32] F. Vetrone, R. Naccache, A. Zamarron, A.J.D.L. Fuente, F.S. Rodrıguez, L.M. Maestro,
E.M. Rodriguez, D. Jaque, J.G. Sole, J.A. Capobianco, ACS Nano 4 (2010) 3254.[33] Z.L. Wang, J.H. Hao, H.L.W. Chan, CrystEngComm 12 (2010) 1373.[34] X.M. Xun, S.H. Feng, J.Z. Wang, R.R. Xu, Chem. Mater. 9 (1997) 2966.[35] Z.Y. Wang, L.M. Wang, Z.Q. Li, Mater. Lett. 65 (2011) 3516.[36] F. He, P.P. Yang, D. Wang, N. Niu, S.L. Gai, X.B. Li, Inorg. Chem. 50 (2011) 4116.[37] L.Y. Wang, Y.D. Li, Nano Lett. 6 (2006) 1645.[38] Y. Wu, C.X. Li, D.M. Yang, J. Lin, J. Colloid Interface Sci. 354 (2011) 429.[39] F. He, P.P. Yang, D. Wang, N. Niu, S.L. Gai, X.B. Li, M.L. Zhang, Dalton Trans. 40
(2011) 11023.[40] M.Q. Tan, Z.Q. Ye, G.L. Wang, J.L. Yuan, Chem. Mater. 16 (2004) 2494.[41] Q.H. Liang, Y. Shi, W.J. Ma, Z. Li, X.M. Yang, RSC Adv. 2 (2012) 5403.[42] D.M. Yang, G.G. Li, X.J. Kang, Z.Y. Cheng, P.A. Ma, C. Peng, H.Z. Lian, C.X. Li, J. Lin,
Nanoscale 4 (2012) 3450.[43] J. Yang, X.M. Liu, C.X. Li, Z.W. Quan, D.Y. Kong, J. Lin, J. Cryst. Growth 303 (2007)
480.[44] J. Yang, C.X. Li, Z.Y. Cheng, X.M. Zhang, Z.W. Quan, C.M. Zhang, J. Lin, J. Phys. Chem.
C 111 (2007) 18148.