controlling internal phosphorus loading in barr lake...
TRANSCRIPT
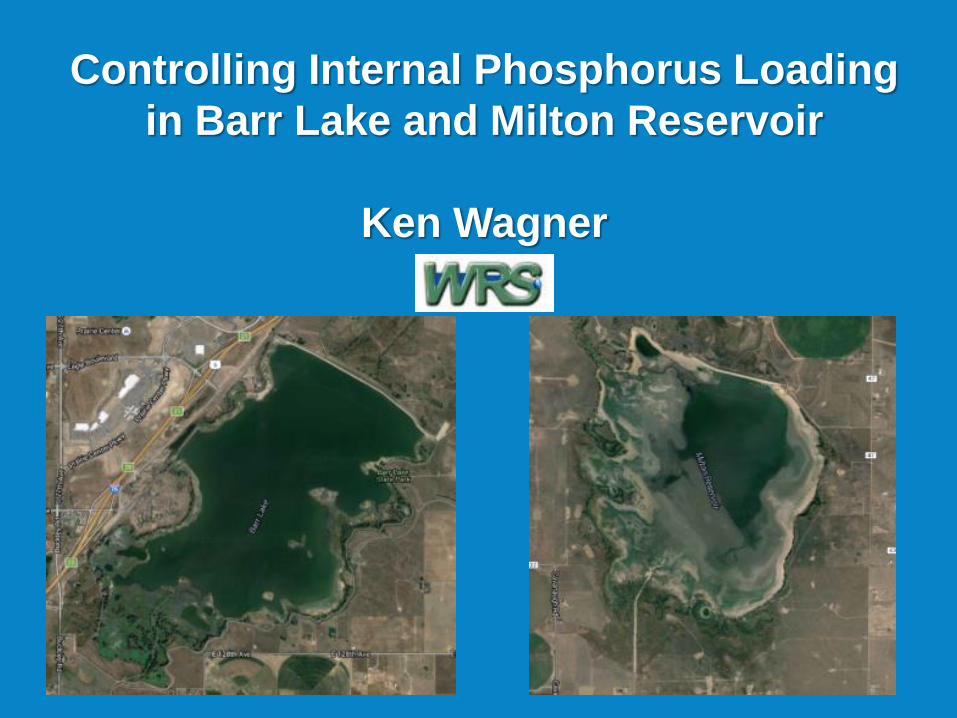
Controlling Internal Phosphorus Loading
in Barr Lake and Milton Reservoir
Ken Wagner
Middle
Fo
rk
South Fork
Tarryall Creek
South Platt e North Fork
Bear Creek
Clear Creek
Big
Dry
Cre
ek
Ch
err
y C
ree
k
South
Pla
tte R
iver
Denver
Ü0 10 20 305
Miles
J:\Water\ProjectFiles\P120\12309_BMW\GIS\Whole_Watershed\Whole_Watershed.mxd
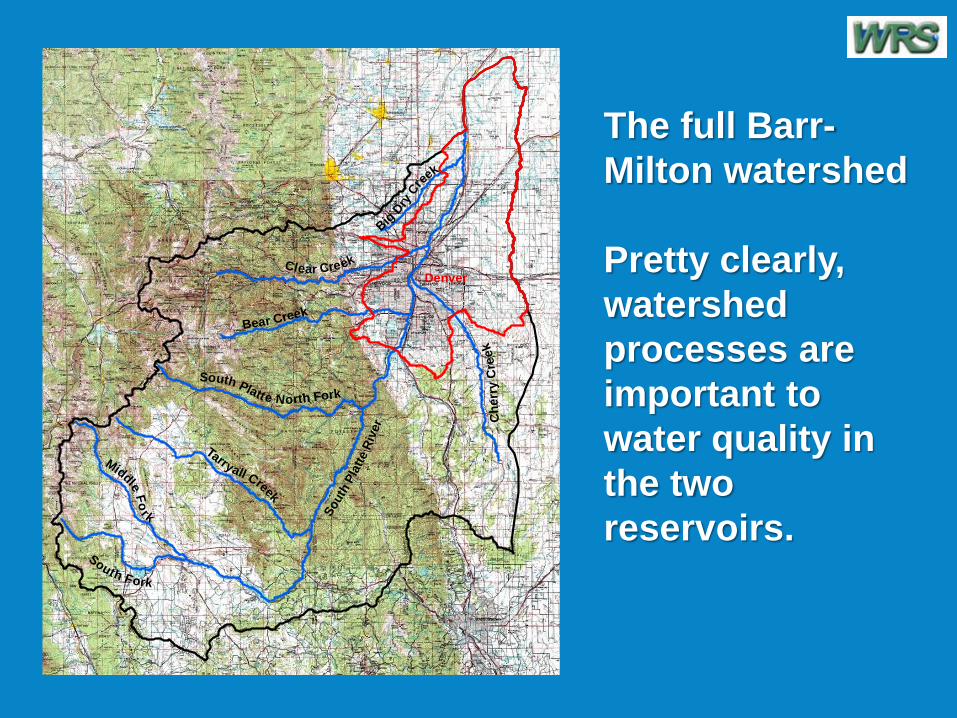
Map of Barr-Milton Watershedin North-Central Colorado
Datashed
Whole_Watershed
The full Barr-
Milton watershed
Pretty clearly,
watershed
processes are
important to
water quality in
the two
reservoirs.
Beebe C
an
al
Third CreekSecond Creek
First Creek
Pla
tte V
alle
y Canal
Fulton D
itch
Sou
th P
latte R
iver
Sand Creek
Cherry CreekBear Creek
BarrLake
MiltonReservoir
Ü0 10 205
Miles
J:\Water\ProjectFiles\P120\12309_BMW\GIS\Whole_Watershed\Datashed.mxd
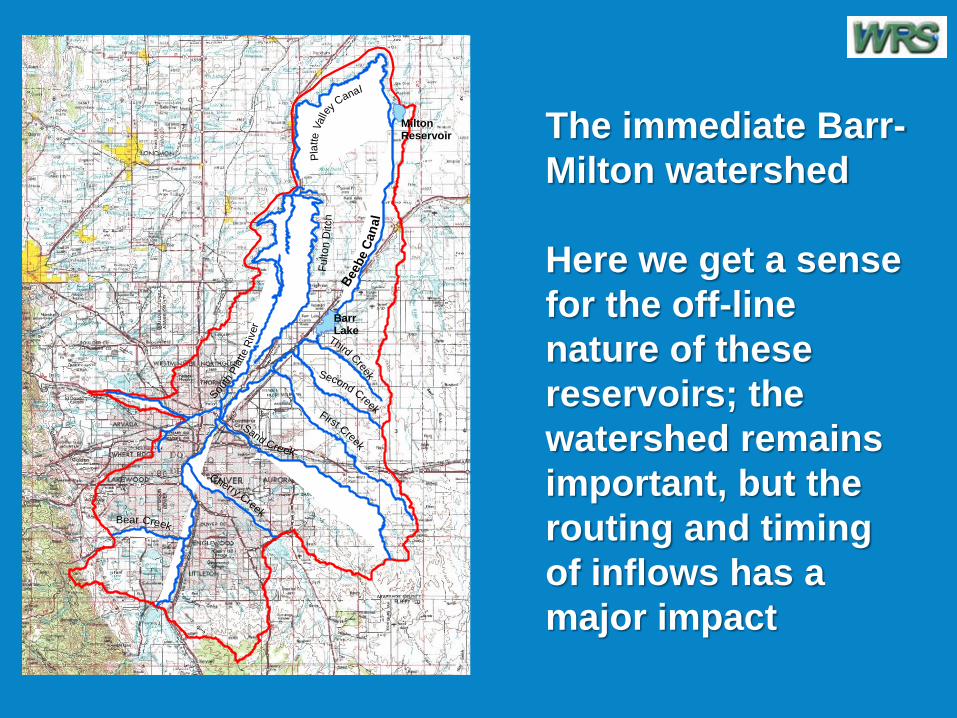
Map of Barr-Milton Datashedin North-Central Colorado
Reaches
Datashed
The immediate Barr-
Milton watershed
Here we get a sense
for the off-line
nature of these
reservoirs; the
watershed remains
important, but the
routing and timing
of inflows has a
major impact
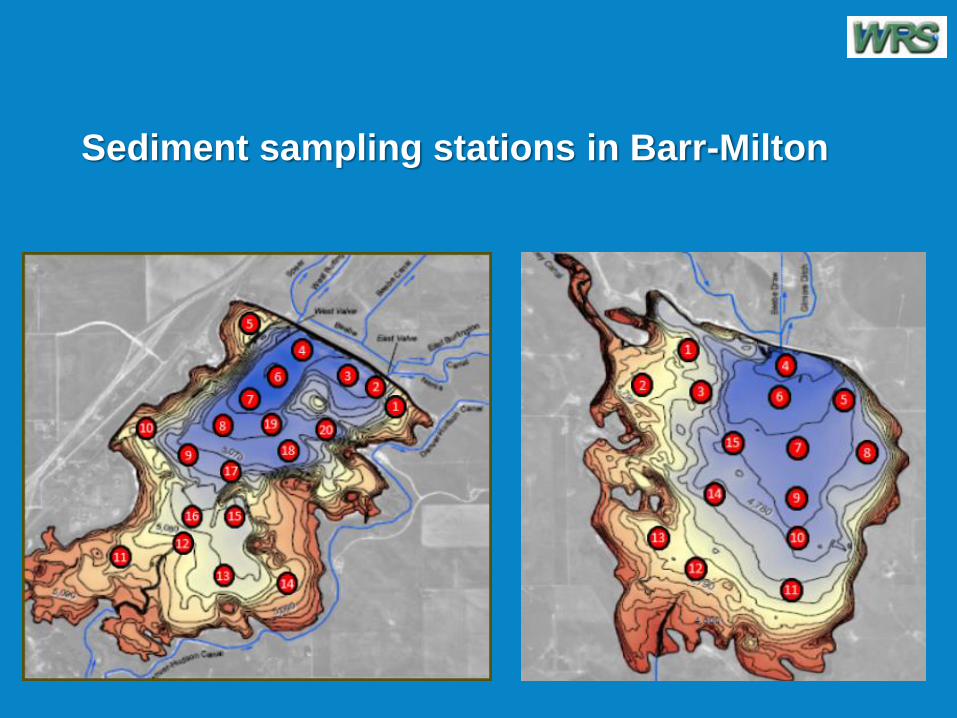
Sediment sampling stations in Barr-Milton
0.00
0.50
1.00
1.50
2.00
2.50
3.00
3.50
4.00
4/10/12 4/25/12 4/24/13 5/15/13 4/8/14 4/23/14 4/13/15 4/29/15
Oxy
gen
De
man
d (
g/m
2/d
ay)
Date
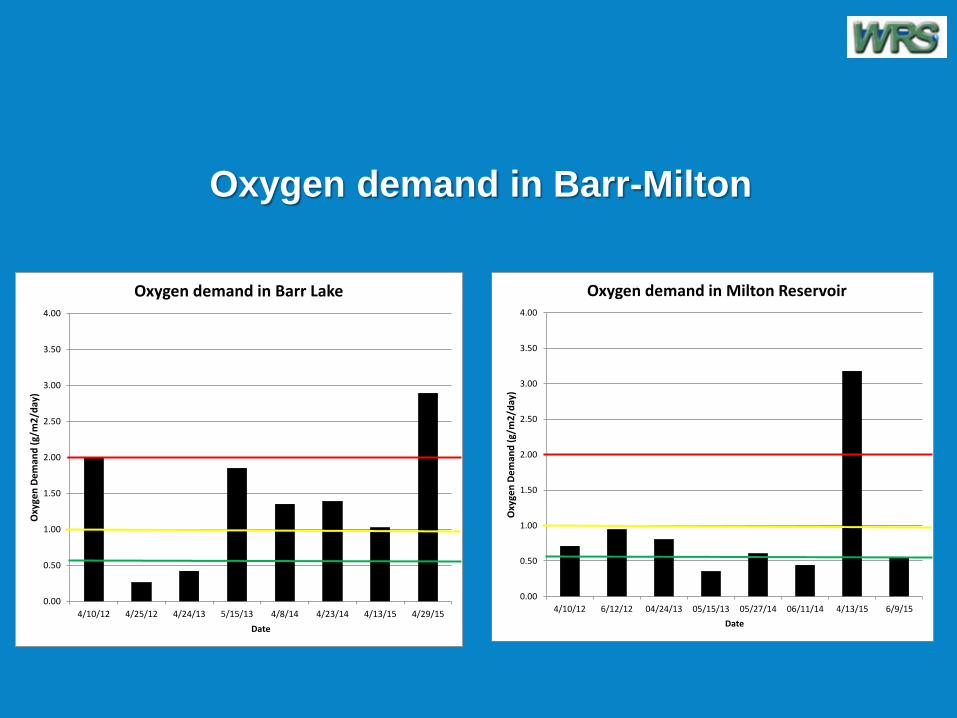
Oxygen demand in Barr Lake
0.00
0.50
1.00
1.50
2.00
2.50
3.00
3.50
4.00
4/10/12 6/12/12 04/24/13 05/15/13 05/27/14 06/11/14 4/13/15 6/9/15
Oxy
gen
De
man
d (
g/m
2/d
ay)
Date
Oxygen demand in Milton Reservoir
Oxygen demand in Barr-Milton
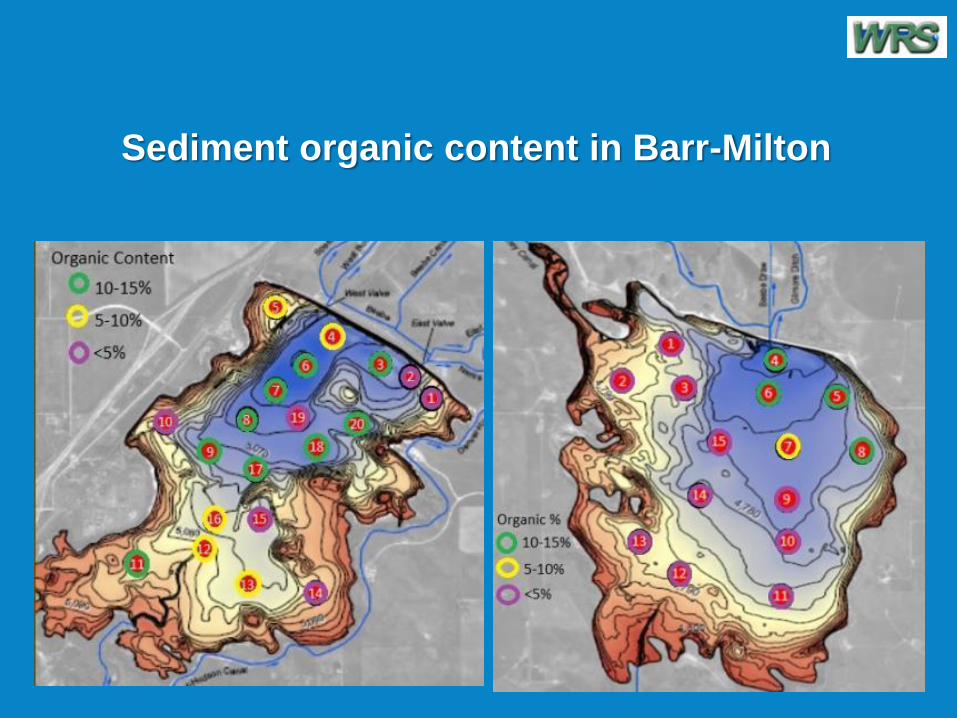
Sediment organic content in Barr-Milton

Fe-P concentration in Barr-Milton
Potential Internal Loading
Based on the Fe-P concentrations in areas
potentially exposed to anoxia and probable
release of organic P through decomposition,
the internal P load to Barr or Milton is <5% of
current external loading and would be <25%
of the load if the TMDL was met through
external load control.

Potential Internal Load Controls
• Dredging – Sets waterbody back in time,
improves multiple aspects of reservoirs, but
very expensive ($20 M for Barr, $36 M for
Milton)
• Phosphorus Inactivation – Can bind P in
sediment (done once per decade or 2) or in
water column (annual maintenance treatment)
• Oxygenation – Relieves demand, limits Fe-P
availability, but may release more organic P
• Artificial Circulation – Mixes water column,
oxygenates, homogenizes, tends to shift algae
• Hybrid Circulation and Inactivation System
Hybrid Circulation and Inactivation System
Circulation:
• Provides oxygenation and CO2 equilibration – will
lower pH even without any algal effect
• Will lower internal load, but may make nutrients more
available
• Will not reduce algae biomass in shallow system, but
may shift algae away from buoyant cyanobacteria
Inactivation:
• Counters P availability, reduces overall fertility
• Coagulant properties settle many solids as well
Combination can manage in-reservoir water quality in
support or in place of more expensive watershed
controls
Recommendation
If watershed management continues and a
phosphorus inactivation system is built on
the canal leading to Barr Lake, no action may
be needed.
If more immediate improvement is desired,
installation of a combination circulation and P
inactivation system in each waterbody would
be the least expensive way to meet water
quality goals and can substitute for more
expensive watershed management needs.

Questions?
I think I’m
gonna need
another
one…