controlling shareholders, managerial ownership and firm value
TRANSCRIPT

Controlling Shareholders, ManagerialOwnership and Firm value
— Disentangling Entrenchment from Incentive Effectsand Blockholding from Managerial Effects∗
Jon Enqvist†
September 20, 2006
Abstract
Using Swedish data I examine the relation between firm value, mea-sured by Tobin’s Q, and the existence of large controlling shareholders andtheir equity ownership. Since a large part of the controlling shareholdersin Sweden also serve as CEOs in their respective firm, I also study whatinfluences managerial ownership might have on the relation between firmvalue and controlling shareholders. I disentangle the negative entrench-ment effect — as measured as the existence of a controlling shareholder —from the positive incentive effect — as measured as the controlling share-holders equity ownership — of controlling shareholders on firm value andfind that these effects increase when the controlling shareholder serve asCEO in the firm. The findings of this study suggest that the use of dual-class shares gives large shareholders incentives to expropriate the firm atthe cost of the small shareholders and that the opportunity to expropriatethe firm is bigger when the controlling shareholder also is the CEO.
Keywords: Firm Value; Ownership structure; Incentive effect; Entrenchmenteffect; Dual-class shares
JEL-Classification: G32, G34∗I would like to thank Martin Holmén for all the useful discussions, comments and remarks.
I would also like to thank Jan Södersten for valuable comments. I am greatful to AndersAnderson for comments at the 2004 Arne Ryde Workshop on Finance on an erarlier version ofthis paper. I have also benefited from the remarks and suggestions of David Hillier, StefanoCaselli, Tim Loughran, Loriana Pelizzon and Huainan Zhao at the 2005 Merton H. MillerDoctorate Seminar and González Eleuterio Vallelado at the EFMA 2005 Annual Conference.
†Department of Economics, Uppsala University, Box 513, SE-751 20 Uppsala, Sweden, Fax:+46 18 471 1478, E-mail: [email protected]
1 IntroductionSeveral papers have empirically studied the relation between the ownershipstructure of a firm and its value.1 Anglo-American studies have mainly fo-cused on managerial ownership and its diverging interest to that of shareholders,whereas in the rest of the world, the focus has been on controlling shareholders(CS)2 and their conflicts with smaller shareholders.3 A plausible explanationfor this division is the role of the firm’s management in the different countries.For example, in the U.S. and the U.K., the CEO is a hired professional ex-ecutive without majority ownership in the firm. Since ownership is dispersed,it is difficult to replace the CEO unless there is a takeover. In the rest of theworld however, the CEO is often identical to the controlling shareholder or easilyreplaced by the controlling shareholder.Non-linear relations between managerial ownership and firm value have been
established on U.S. data by e.g. Morck et al. (1988) and McConnell and Servaes(1990). However, as far as I know little is known about the effect of managerialownership in countries such as Sweden, where large controlling shareholdersare common. This paper focuses on the relation between firm value and theownership of CSs. It also explores the connection between managerial and CSownership. Common for CSs and CEOs is that they have a possibility to affectfirm value - CEOs in their positions as insiders4 and CSs by being in control ofthe firm’s board of directors.In the literature, insider ownership and ownership by large blockholders are
said to have two major effects on firm value; the positive incentive effect [Jensenand Meckling (1976)] and the negative entrenchment effect [Stulz (1988) andShleifer and Vishny (1989)]. The idea of the incentive effect is that the largeris the insider’s capital in the firm, the more aligned is his interest with that ofother shareholders. And since he is an insider he also has the ability to makethe firm function well. However, the more the insider owns the more entrenchedhe becomes. And with entrenchment comes the opportunity to exploit thefirm.5 Hence, an insider with a high voting fraction in the firm — which secureshis position as the largest shareholder — should have a negative effect on firmvalue.6
1See for example Demsetz and Lehn (1985), Morck et al. (1988), McConnell and Servaes(1990), Himmelberg et al. (1999), Holderness et al. (1999), La Porta et al. (1999), Claessenset al. (2000) and Demsetz and Villalonga (2001).
2The expression "controlling shareholder" has many synonyms and similarly expressionsin the literature, e.g. blockholder, controlling minority shareholder and large shareholder.
3 See for example Morck et al. (1988) and McConnell and Servaes (1990) for US resultson managerial ownership, Claessens et al. (2002) for corporate control in Asia and Cronqvistand Nilsson (2003) for results on blockholders in Europe.
4 In the rest of the paper, I refer to executives within the firm when I use the term insider.5The exploitation may take various forms, e.g. inoptimal operating strategies and financial
decisions [Myers and Majluf (1984), Shleifer and Vishny (1989), Burkart et al. (1997) ],expensive perquisites [Jensen and Meckling (1976)], opposing of hostile takeovers that wouldincrease shareholders’ wealth [Stulz (1988)] or tunneling of the firm’s resources [Johnson etal. (2000)].
6 It must be pointed out that it is not the entrenchment per se that has a negative effect
1
This paper explores what happens when the cash-flow rights are separatedfrom the control rights through dual-class shares7 and how this separation affectsthe incentive effect and the entrenchment effect. Since most of the firms inSweden use dual-class shares with different voting rights, it is an exceptionallygood country for trying to disentangle the entrenchment effect from the incentiveeffect.8
These two counteracting effects could result in a non-linear relation betweenownership level and firm value. Morck et al. (1988) found a piecewise linearrelation where firm value increased with managerial ownership from 0 percentto 5 percent, and decreased between 5 percent and 25 percent. After 25 percent,firm value increased with managerial ownership. McConnell and Servaes (1990)found a non-linear relation where the relation first increased and then decreasedafter approximately 40% to 50%. At these levels of ownership the manager hasbecome the CS. Hence, an interesting question given these two results is whetherthey capture the effects of managerial ownership or the effects of having a CS.As mentioned above, this paper will try to separate the effects of these twoforms of ownership.It is important to make a distinction between CS ownership and managerial
ownership and the effects of the two. CS ownership implies that the owner hasa sufficiently large stake in the firm to be in control of the board of directors.However, it does not always imply that he is an insider with the ability to affectthe current business of the firm. Studies of managerial ownership, on the otherhand, examine the effects of the ownership of an insider, who has the executivepower to directly affect firm behavior, but who does not always own a sufficientlylarge stake in the firm to control the board of directors. In this paper, I comparethe effects of CSs with those of CSs who are also the CEO of the firm. In the restof the paper, these will be refered to as controlling managers (CMs). Swedenis a suitable country for studying these effects; not only does most of the firmshave a CS but, in addition, a large share of those are also a CM; 80 percent ofthe firms in the data have a CS and 18 percent a CM. Thus, almost 25 percentof the CSs are also the CEO.To explore these issues panel data consisting of 203 publicly traded Swedish
firms are used. The data stretch from 1985 to 2000, even though they arenot completely balanced since all firms have not been listed during the entireperiod. In total, the data consist of 1754 firm-year observations and includeboth accounting data and ownership data. An advantage in doing this study inSweden is the good reliability of the accounting data. In La Porta et al. (1998),Sweden gets the highest rating on the accouting standards among 49 examinedcountries.
on firm performance, but the opportunity the owner gets to exploit the firm. The more securethe owner is in his position as largest shareholder, the greater is the opportunity to maximizehis own utility at the cost of outside shareholders.
7Cash flow rights and control rights can also be separated through pyramid ownership orcross-holdings. See e.g. Bebchuk et al. (2000) for an exposition of these mechanisms.
8 78 percent of the firms in the data use dual class shares. Also, according to La Porta etal. (1999), Sweden has the largest deviation from one-vote-one-share in the world.
2
The ownership data give us both the voting rights and the equity share heldby the largest shareholder and the CEO. It also gives us the opportunity todistinguish the type of the largest shareholder — whether it is a foundation,family, institution, etc.I first document a negative relation between firm value — measured by an
approximation of Tobin’s Q — and the existence of a CS by using a dummy thatequals one if there exists a CS and zero otherwise. In this paper, I define a CSas the largest shareholder owning more than 25 percent9 of the firm’s votingrights. This negative relation diminishes with his equity share, however. Myinterpretation is that the existence of a CS captures the negative entrenchmenteffect since it tells us that there exists a shareholder with a secure position inthe firm with the possibility to expropriate the firm. Furthermore, I interpretthe positive relation between firm value and the CS’s equity ownership as apositive incentive effect, since the more capital the CS has invested in the firm,the higher are his incentives to make the firm perform well.Then, I establish that there exist a relation between firm value and CEO
ownership.10 This result suggests that managerial ownership also has effects11
on firm value in a country such as Sweden where large blockholders are frequent.This relation between firm value and CEO ownership raises the question whetherthe relation between firm value and CSs to some extent is not affected by thelarge part of CSs that also serve as CEOs (CMs). By separating the CMsand their equity fraction from the CSs and their equity fraction I also confirmthat the relation between firm value and CSs seems to stem from managerialownership effects.Despite the fact that this subject field has been studied in several papers over
the last decades, I believe this paper to have some contributions to the insightinto how ownership structure relates to firm value. There are two papers closelyrelated to this paper; Cronqvist and Nilsson (2003) and Claessens et al. (2002).The crucial difference from Cronqvist and Nilsson (2003) is that the dummyeffect of having a CS has been separated from the continuous ownership levelvariable. Thus, it is possible to distinguish two effects from ownership. Thedummy and the continuous variables are obviously strongly correlated but nev-ertheless, they are interpreted to explain two contradicting effects; the entrench-ment effect and the incentive effect discussed above. The dummy is supposedto absorb the entrenchment effect since it is the variable explaining whetherthe owner is a CS and hence, an entrenched owner. The shareholder’s equityfraction, on the other hand, provides the information about in what grade his
9The 25 percent limit is used simply because Swedish tax regulation define a "main owner"(huvuddelägare) as someone who alone or together with family ownes more than 25 percentof the control rights. And as such, you are treated differently according to the law. Cronqvistand Nilsson (2003), which my paper to large extent is closely related to, also use the 25 percentlimit.10The result holds when either equity or vote fraction is used as a measure of ownership.11The word effect should be used with some care, since fixed effects regressions cannot say
anything about the causality - they only establish whether there is a relation. Whether theownership level affects firm performance or vice versa is purely speculation. That is why I saythat the result only suggest an effect.
3
interests are converged with those of other shareholders and hence, it absorbsthe incentive effect.This way of using the equity fraction to capture the incentive effect was also
used in Claessens et al. (2002) when they separated the incentive effect from theentrenchment effect. However, in their paper they did not include a CS dummyto capture the entrenchment effect. Instead they used the largest shareholder’sdifference between control rights and cash-flow rights. They also used a samplecut-off point at 10 percent. My belief, however, is that the 25 percent levelused in this paper and earlier in Cronqvist and Nilsson (2003) is better suitedwhen looking at CSs in Sweden. A more complete review of Claessens et al.(2002) and Cronqvist and Nilsson (2003) is given in Section 2 along with someother important papers. As a robustness test, I also try to replicate some of theregressions in Claessens et al. (2002) and Cronqvist and Nilsson (2003). Theseresults are presented in Section 6.The rest of the paper is organized as follows. The second chapter gives a
literature review on some of what is written about managerial ownership andCSs. Then, my hypotheses are given in Section 3, followed by a section de-scribing the data, variables and empirical framework. The results are presentedand discussed in Section 5 followed by Section 6, where I conduct a number ofrobustness tests on my results. Section 7 ends this paper with a summary andconcluding discussion.
2 Literature ReviewSince Berle and Means (1932) enlightened the problems with the separation ofcontrol and ownership in a firm, several papers have been written on the subject.Common for these studies is that they look at how ownership structure affectsfirm behavior. The focus has mainly been on two separate forms of ownership,managerial ownership and the ownership of CSs.12 In this section, some of themost essential papers in these areas are discussed. I have chosen to first look atthe literature on managerial ownership and then that on CSs.
2.1 Managerial Ownership
2.1.1 Theory
The agency problem induced by the separation of ownership and managementof the firm was enlightened by Berle and Means (1932) and has since thenconstituted the basis of most research in this field. In their book, they arguedthat when control is separated from ownership, there is a divergence of interestbetween the two. Corporate stockholders want to maximize the corporate profit,whereas the manager aims at maximizing his personal profit. They also conclude
12Other forms of ownership centered upon in the literature that are worth mentioning is e.g.family or founder ownership [Anderson and Reeb (2001), Faccio and Lang (2002) and Burkartet. al. (2003)]. These forms of ownership are connected to both controlling and managerialownership.
4

that "the interests of control are different from and often radically opposed tothose of ownership".Jensen and Meckling (1976) based a theory on this principal-agent problem;
the agent (manager) does not always behave in the principal’s (shareholder’s)interest, which induces agency costs in a firm. Their idea was that the valueof the firm depends on the relative amount of shares owned by insiders andoutsiders13 in the firm. Their theory was that if the agent also becomes theprincipal — if the manager owns 100 percent of the firm — he will also get theincentives for profit-maximizing behavior. Hence there is a positive incentiveeffect of managerial ownership; the higher share the manager owns in the firm,the better is the firm value.Stulz (1988) studied the relation between firm value and managerial own-
ership from another perspective and therefore came to another conclusion. Heargued that the only reason for managers to own voting rights is to "affect thebehavior of potential bidders and hence the probability of losing control". Byincreasing their fraction of voting rights, managers reduce the risk of a hostiletakeover which decreases the value of the firm. However, an increase in theirowned fraction also increases the premium offered in case of a takeover. Takingthese two effects together, it should be possible to find a fraction owned by themanagement that maximizes the firm value.Shleifer and Vishny (1989) shed light on the entrenchment effect showing
that there are not only positive effects of managerial ownership. Like Berleand Means (1932) and Jensen and Meckling (1976), they based their modelon the principal-agent problem between owners and managers. In their model,managers take measures to make them hard to replace. By e.g. making implicitrather than explicit contracts and doing manager-specific investments, the man-ager makes himself too valuable and costly for the firm to replace.
2.1.2 Empirics
The theory of Berle and Means (1932) was called in question when Demsetzand Lehn (1985) examined the relation between ownership structure and theprofitability of the firm. Their main idea was that ownership structure is anendogenous outcome of the maximizing process. They argued that in everydecision concerning a change in the ownership level, the shareholder has toconsider its consequences on the profit rate, i.e. every change in ownershiplevel is made to maximize the shareholders’ profit. Consequently, ownershipconcentration and profit rate should be unrelated.The counteracting forces of the incentive effect and the entrenchment effect
constituted the main theme of the piecewise linear OLS regressions tested byMorck et al. (1988). On 371 of the Fortune 500 firms they found a piecewiselinear relation between managerial ownership and Tobin’s Q, where firm valueincreased with managerial ownership from 0 percent to 5 percent, decreasedbetween 5 percent to 25 percent and after 25 percent, the firm value increased
13They defined insiders as management and outsiders as investors with no direct role in themanagement of the firm.
5
with managerial ownership. Their interpretation was that the negative entrench-ment effect becomes significant at 5 percent managerial ownership, but that themarginal effect after 25 percent ownership is on a large scale zero whereas, incontrast, the positive incentive effect operates throughout the whole range ofownership.Moreover, McConnell and Servaes (1990) used Tobin’s Q as a measure of
firm value. They used data of around 1000 American firms in two different yearsto establish a relation between the managerial equity fraction owned in firmsand Tobin’s Q. Consistent with the theories of the relation between managerialownership and firm value of Stulz (1988), the results showed a curve-linearrelation with a maximum at 40 to 50 percent. McConnell and Servaes testedthe regressions used by Morck et al. (1988) on their data, but were not able toreplicate their results.In later years, the focus in this field has been on enhancing the econometric
methods to study the relation between managerial ownership and firm value.Himmelberg et al. (1999) re-examined the cross-sectional results of Demsetzand Lehn (1985), Morck et al. (1988) and McConnell and Servaes (1990) usingpanel data. They argue that the fixed effect must be used when examining theimpact of managerial ownership on firm value to get hold of unobserved firmheterogeneity. Using fixed effect and also including a number of firm charac-teristic control variables, they find no exogenous effect in the regressions usedby Demsetz and Lehn (1985), Morck et al. (1988) and McConnell and Servaes(1990). Their conclusion was that the results of these previous studies comefrom a spurious correlation between managerial ownership and firm value.As a response to Himmelberg et al. (1999), Zhou (2001) argued and showed
the year-to-year changes in managerial ownership to be small and that theyshould not affect within-year changes in firm value. If the contracting environ-ment in a firm is relatively constant over time, there should not be any reasonfor the manager to change his effort. Therefore, Zhou argues that when "Re-lying on within variation, fixed effects estimators may not detect an effect ofownership on value even if one exists".To understand what forces drive the changes in managerial ownership, Hold-
erness et al. (1999) compared the ownership level by officers and directors in1935 and 1995. This long-term comparison also gave them the opportunity toexamine the relation between firm value and managerial ownership by replicat-ing the piecewise linear regression by Morck et al. (1988). Even though averagemanagerial ownership has increased from 13 percent in 1935 to 21 percent in1995, they found no evidence of this being explained by the relation betweenfirm value and managerial ownership.
2.2 Controlling Shareholders
A CS does not necessarily mean a majority shareholder. It could also be ashareholder with a sufficiently large share in the firm to secure his position asthe largest shareholder. According to Weston (1979), the chances of a hostiletakeover becomes impracticable at 30 percent insider ownership and most liter-
6
ature refers to a CS as 10-30 percent ownership.14 As a CS, one also controlsthe board of directors and therefore has indirect control of the firm. Hence, aCS may generate both positive and negative effects in a firm.
2.2.1 Theory
Fama and Jensen (1983a) connected the theories of managerial ownership andownership of CSs. They concluded that if a concentrated group of individuals— especially if these are managers — own a high fraction of the firm, these haveboth the possibility and the incentive to expropriate the firm at the expenseof the other shareholders. Hence, by concentrating control and management toa few agents, the residual claims also become restricted to these agents, whichimplies there to be a negative effect of CSs, and CMs in particular.With a dispersed ownership in a firm it is unlikely that a single shareholder
would have the incentive to monitor the management. Shleifer and Vishny(1986) argued that a large shareholder was a possible solution to this free-riderproblem [Grossman and Hart (1980)]. With a high residual claim in the firm,the large shareholder may have both the incentives and means to monitor thefirm and to initiate a takeover of the management if displeased with the presentone.Zingales (1994) studied the phenomenon of the large premium attributed to
voting shares. His conclusion was that the magnitude of the premium must beexplained by potential private benefits from being in control of a firm; there isno reason to be a large blockholder unless there is a personal benefit from it.The consequence of this conclusion is that CSs are associated with a negativeeffect on the profitability of the firm.
2.2.2 Empirics
Holderness and Sheehan (1988) made a comparison between firms with majorityshareholders (50.1 percent ownership or more) and firms with dispersed own-ership (defined as firms with no shareholders owning more than 20 percent ofthe shares) and their effect on Tobin’s Q. Among firms traded on NYSE andAMEX over the years 1978-1984 they selected 114 majority owned firms andfound no difference in Tobin’s Q between those firms and those with dispersedownership. They found this result to be inconsistent with the proposition thatmajority shareholders use their position to expropriate firm resources [Fama andJensen (1983a)]. In their paper, they also raised the possibility that differenttypes of majority owners might have different motivations for their ownership.With the starting point that families are an important and prevalent investor
group in the U.S., Anderson and Reeb (2001) examine the effects of founding-family ownership on ROA and Tobin’s Q, using Standard & Poor’s 500 firmsduring the period 1992-1999. In their regression analysis, they used a two-wayfixed effects model. Inconsistently with Holderness and Sheehan (1988), theirresult show that firms perform better (using ROA as the dependent variable)
14A relevant fact is that in Sweden, it only takes a ten-percent ownership to stop a takeover.
7

or at least as well (using Tobin’s Q as the dependent variable) when familymembers serve as CEO as when an outsider is hired as CEO.Claessens et al. (2002) was the first paper empirically trying to disentangle
the incentive effect from the entrenchment effect. They used a data consistingof 1301 firms in eight different East Asian economies in the year 1996. The twomain independent variables in their regressions were the largest shareholder’s15
share of cash-flow rights, Ownership, and the share of voting rights minus theshare of cash-flow rights, Control minus ownership. The first variable is sup-posed to capture the incentive effect, since the owner’s interests converge withthose of the firm, the higher is the share of cash-flow rights in the firm. Thesecond variable shows to what degree the largest owner uses high-voting sharesto gain control of the firm. Hence this variable should capture the entrenchmenteffect.As I can see, there are some minor weaknesses in Claessens et al.´s empirical
model. The first is that even though the Control minus ownership variable onlycaptures the entrenchment effect, the variable Ownership does not only capturethe incentive effect, but also some of the entrenchment effect. The entrenchmenteffect does not only depend on to what degree high voting shares are used to gaincontrol, but also on what level of ownership is held by the largest shareholder.This could lead to an under-estimation of the incentive effect.Like Claessens et al. (2002), Cronqvist and Nilsson (2003) looked at the
effects of the largest shareholder’s ownership in the firm and the separationbetween ownership and control. More explicitly, Cronqvist and Nilsson lookedat how the CS’s16 vote ownership and his excess votes17 affect Tobin’s Q. Usingfixed firm effects regressions on a panel of 309 Swedish firms during 1991—1997,they found the agency costs associated with CSs to rather be due to the CS’scontrol rights than his excess votes. They also pointed out that families havemore negative effect on Tobin’s Q than other ownership categories and thatthey are more likely to use dual-class shares to gain control over the firm witha minority equity ownership.More comments on Claessens et al. (2002) and Cronqvist and Nilsson (2003)
are made in Section 6, where some of their empirical models are replicated.
3 HypothesesBased on the theories and empirical results of the papers discussed in the previ-ous section, I will now outline my hypotheses regarding the connection betweenCS ownership and managerial ownership and their relation to firm value.My first hypothesis concerns the connection between firm value and CSs.
Corporations in Sweden are often run by a large shareholder controlling the
15They used a cut-off point at ten percent of the voting rights.16Cronqvist and Nilsson also used 25 percent ownership of the control rights as definition
of a CS. However, they used the term Controlling Minority Shareholder since they wanted tofocus on the CSs that only own a minority of the cash flow rights.17Excess votes calculated as (vote ownership/equity ownership - 1).
8
firm and setting the agenda for its business. By definition, a CS has a secureposition in the firm — having a high fraction of control rights in the firm, theshareholder entrenches himself. This entrenchment gives him the opportunityof expropriating the firm [Stulz (1988), Shleifer and Vishny (1989) and Burkartet al. (1997), Gompers et al. (2003)]. Hence, my first hypothesis is:
Hypothesis 1 : The existence of a controlling shareholder is neg-atively related to firm value.
It should be stressed that it is not the entrenchment in itself that is supposedto have a negative effect on firm value but rather the opportunity given forexpropriation of the firm.The second hypothesis also concerns the connection between firm value and
CSs. But when the first hypothesis is based on the existence of a CS — which,in turn, is based on the largest shareholder’s control rights — this hypothesisconcerns the CSs cash-flow rights. As pointed out by Shleifer and Vishny (1986),the larger are the CS’s cash-flow rights in the firm, the higher a share of thecosts does he pay and hence, the larger are his incentives to maximize firm value.From this argument, I state my next hypothesis:
Hypothesis 2 : Given the existence of a CS, his equity fraction ispositively related to firm value.
It is important to make the distinction between Hypotheses 1 and 2; thefirst hypothesis is based on a certain level of control rights which is supposedto capture the negative entrenchment effect whereas the second hypothesis isbased on cash-flow rights which is supposed to capture the positive incentiveeffect.Unlike the first two hypotheses the third hypothesis is not solely about the
connection between CSs and firm value but also about the connection betweenmanagerial ownership and CS ownership.In a country such as Sweden where firms are, to a large extent, dominated
and controlled by large shareholders, it is called into question whether studyingmanagerial ownership and its influence on firm value is useful. However, sincealmost 25 percent of the CSs also act as CEOs in their firms and that, in theirrole as insiders, CEOs have greater opportunities to affect firm value than othershareholders [La Porta et al. (1999)], it must also be of interest to study therelation between firm value and managerial ownership in Sweden. Whetherthe relation between firm value and managerial ownership is positive [Jensenand Meckling (1976)], negative [Stulz (1988) and Shleifer and Vishny (1989)],quadratic [Stulz (1988) and McConnell and Servaes (1990)], piecewise linear[Morck et al. (1988)] or in the form of a double humped curve [Davies et al.(2005)] in Sweden is not for this paper to establish, but a task for future research.
9

In this paper I will only confirm that there is a relation between the two beforelooking at the connection between managerial ownership and CS ownership andtheir relation to firm value.So, what then happens if the CS is also CEO in the firm? A CM has more
insights into the firm and direct power than other CSs to run the firm in thedirection he wants. Hence, he is likely to have a stronger effect on the value ofthe firm, whether it is a negative or positive effect. This leads us to the finalhypothesis:
Hypothesis 3 : The magnitude of Hypotheses 1 and 2 increases ifthe CS is a CEO.
My hypothesis is hence that if there exists a CS in a firm, this should benegatively related to firm value but if this CS is also a CEO, this negativerelation should be even larger. Moreover, given the existence of a CS, his equityshare in the firm is positively related to firm value — the more capital investedin the firm, the more positive is the relation — and if the CS also is a CEO, thispositive relation between firm value and equity share should be even bigger.
4 Construction of Data, Variables and Empiri-cal Framework
4.1 Construction of Data
The sample consists of accounting data as well as ownership structure dataof 203 large Swedish non-financial firms over the period 1985-2000. Due tobankruptcies, mergers, takeovers and the fact that some of the corporationsbecome listed after 1985, the panel data are not balanced; some firms onlyhave three observations while other firms are included in all 16 year observa-tions. In total, the data consist of 1754 firm-year observations. The data arefrom two sources; the accounting data from "Findata Trust" whereas the own-ership structure data are collected from "Owners and Power in Sweden’s ListedCompanies" by DN Ägarservice [Sundqvist (1986-93) and Sundqvist and Sundin(1994-2001)]. The ownership structure data report the 25 largest holders of con-trol rights and therefore, the ownership of a possible CS. If the CEO is amongthe 25 largest shareholders, his ownership is also given. A small, yet factualproblem is that the ownership of managers with a smaller ownership than the25th largest shareholder is not available and hence, is approximated to zero.18
A great advantage of the data is that they include both the equity fractionand the vote fraction. Since so many firms in Sweden use dual-class shares,the equity fraction and the vote fraction differ most of the time.19 Hence, it18This is not a severe problem since it never happens that the actual ownership level of the
26th largest shareholder exceeds one percent.19 In our data, 78.3 percent of the firm-year observations use dual-class shares.
10

does not only give us the opportunity to study both the relation between firmvalue and CS ownership and managerial ownership, respectively, but also thedistinction between the relation between firm value and equity ownership andvote ownership, respectively. In this paper I will use these relations to separatethe entrenchment effect from the incentive effect.A problematic issue when constructing the ownership data is how to define
the owner. An owner need not be an individual but could also be for exampleanother corporation, a union or other organization. In this paper I will alsotreat families as a single unit, e.g. if there are three family members owning tenpercent each of a firm’s cash-flow rights they will be treated as a single ownerwith 30 percent of the cash-flow rights in the firm.Another problem when constructing the data is how to deal with cross-
holdings and pyramid ownership. In this paper, I will not consider these meansof separating votes from capital. Instead, I will focus on dual-class shares since itis the easiest way of separating votes from capital [Holmén and Högfeldt (2004)].In these data, I will treat a person A who is the CS of a firm B who, in
turn, is the CS of firm C as the CS of firm C. For example, in 1997, the Paulsonfamily owned 59.6 percent of the votes in the firm Peab, which makes it the CSof Peab. Peab, in turn, owned 34.1 percent of the votes in the firm BPA, whichmakes the Paulson family the CS of BPA since it is the CS of Peab which, inturn, is the CS of BPA.However, the results could be biased by not considering pyramid ownership.
In the above example, the Paulson family owns 18.9 percent of the equity inPeab and Peab owns 21.6 percent of BPA. In reality, the Paulson family thereforeowns 18.9% ·21.6% ≈ 4.1% of the equity whereas the data will make it seem likethe controlling owner of BPA owns 21.6 percent of the equity, i.e. if there is apositive incentive effect the data will make it look smaller. The entrenchmenteffect will not be biased, however. The Paulson family only owns 34.1%·59.6% ≈20.3% < 25% which would not make it CS of BPA. However, since it is in controlof Peab which, in turn, is in control of BPA, the Paulson family is still in effectivecontrol of BPA.
4.2 Variables
Empirical papers on ownership structure and its influence on firm value almostexclusively use Tobin’s Q as the dependent variable. An alternative measure isthe return on assets (ROA). In this paper I use an approximation of Tobin’sQ as a measure of firm value, measured as the ratio between the book value oftotal debt plus the market value of equity and the book value of total assets.20
However, as a robustness test, all regressions in Section 4.3.1 will also be madeusing ROA as the dependent variable. These results will be discussed in Section6, Robustness Tests.The use of Tobin’s Q is not entirely unproblematic. Even though it is almost
indisputable as a measure of firm value, there might arise severe measurement20See e.g. Adams and Santos (2004) and Cronqvist and Nilsson (2003) for similar approxi-
mations of Tobin’s Q.
11
errors in constructing the variable. Perfect and Wiles (1994) showed that boththe mean and the variance are very sensitive to the method used when approx-imating Tobin’s Q. However, they also pointed out that if changes in Tobin’s Qare studied — which is the case in my paper — there is no significant divergencebetween the different estimates.Furthermore, as seen in Table 1, there is an obvious skewness in Tobin’s Q;
the mean is 1.51 whereas the median is 1.13.21 To deal with this problem, Iwill use the natural logarithm of Q as my measure of firm value [Allayanis andWeston (2001)].As expected, the CSs have a much higher vote share (mean 54.1%) than
equity share (mean 35.6%), which tells us that CSs, to a large extent, use A-shares to gain control of the firms. An interesting fact is also that CMs areeven more eager to use A-shares than other CSs — the average CM has a vote toequity ration of 1.62 (median 1.85) whereas the ratio for all CSs is 1.52 (median1.54).A number of firm characteristics will be included as control variables in all
regressions to capture observable firm heterogeneity. These control variablesare similar to those used in e.g. Claessens et al. (2002) and Cronqvist andNilsson (2003). The included control variables are ln(Firm size), Leverage,Sales to total assets ratio, PPE to total assets ratio, Investments to total assetsratio and ln(Age).22 Firm size is measured as the book value of total assets.Leverage is the book value of debt to book value of total assets ratio. Thevariables leverage, sales to total assets ratio and PPE to total assets ratio arethe same as those used by Cronqvist and Nilsson (2003) and since my data arepartly the same as theirs, it is not surprising that my descriptive statistics lookssimilar to theirs. Investment to total assets ratio is supposed to correspond toCronqvist’s and Nilsson’s CAPEX/Total assets. ln(Firm size) and ln(Age) areused as control variables in e.g. Claessens et al. (2002).To see if there is a difference in mean or median between the sample with
CSs and that without CSs, t-tests and Wilcoxon tests are made on each variable.In the Descriptive Statistics table below, it can be seen that ln(Firm size) andInvestments to total assets ratio are the only two variables where no significantdifferences between the two sub-samples are established. This gives even moreincentives to study the CS phenomenon in Sweden.
[Insert Table 1 about here]
21Moreover, a Bowman-Shelton test for normality strongly indicate a skewness in Tobin’sQ.22As a robustness test I also included a dummy that equals one if there exist a shareholder
beside the CS who owns more than 10 percent. This variable would capture the effects ofhaving a shareholder threatening the CS’s controlling position. However this variable doesnot affect the results to any appreciable extent and in order to use the control variables usedin Cronqvist and Nilsson (2003) as much as possible I have chosen not to include it in thereported regressions.
12

4.3 Empirical Framework
In this part of the paper the empirical frameworks are given for the hypothesesstated in Section 3. The empirical frameworks used in this paper are mainlybased on the papers discussed in the literature review.As stated above, similar to most modern studies of the relation between
ownership structure and firm value, an approximation of Tobin’s Q will be usedto represent firm value [Morck et al. (1988), Holderness and Sheehan (1988),McConnell and Servaes(1990), Himmelberg et al. (1999), Anderson and Reeb(2001), Claessens et al. (2002) and Cronqvist and Nilsson (2003)].The major problem when considering the relation between firm value and
ownership structure is how to deal with endogeneity problems. Since Demsetz(1983), the exogeneity of the ownership variable has been in question when con-sidering regressions with firm value as the dependent variable and ownershipas the explanatory variable. Endogeneity problems may appear in the form ofreverse causality or unobservable variables affecting both firm value and owner-ship structure. Himmelberg et al. (1999) emphasized the problem of unobservedheterogeneity generating endogeneity problems in the form of spurious correla-tion between ownership and Tobin’s Q. Unobserved heterogeneity comes in theform of firm characteristics in the firm’s contracting environment which are un-observable for the econometrician. However, Himmelberg et al. argue that since"unobserved sources of firm heterogeneity are relatively constant over time, wecan treat these unobservable variables as fixed firm effects, and use panel datatechniques to obtain consistent estimates of the parameter coefficients". There-fore, I will — analogously to e.g. Himmelberg et al. (1999) — use fixed firm effectsestimations on the panel data, allowing each firm to have its own intercept inthe regressions. Each intercept will then absorb unobserved heterogeneities.Year dummies will be included in the fixed firm effects regressions to allow timevariations within firms [Zhou (2001)].To confirm that there is correlation between the regressors and the firm-
specific effects, Hausman tests are made on all regressions. As seen in Tables2-4 presented in Section 5, tests on all regressions reject the null-hypothesisof zero correlation between regressors and firm-specific effects. I also run aF-test on all regressions, which confirms that the fixed firm effects are jointlysignificant.An alternative and probably better method for dealing with the endogeneity
problems would be to use the instrumental variables (IV) method [Adams etal. 2003)]. The IV method would not only consider the unobservable variablesthat create spurious correlation between Tobin’s Q and the ownership variables,it would also consider reversed causality. However, due to lack of good instru-ments, the IV method is not suitable for this study.If e.g. OLS had been used, I could only have seen how different levels of
ownership were related to firm value. But by using fixed firm effects with yeardummies, I get the opportunity of studying how ownership structure changes ineach firm are related to firm value. An alternative method could have been usingOLS and including industry dummies [Claessens et al. (2002)]. However, then
13

I would still have looked at how different levels of ownership are related to firmvalue and not how changes in ownership are related to firm value. However,fixed firm effects regressions contain more information since the firm specificeffects not only include the same information as the industry dummies but alsoother firm heterogeneities not included as independent variables.There are some problems though, using fixed effects regressions. One of
the problems is that — even though unlike OLS, it deals with the problem ofomitted variables affecting both Tobin’s Q and the explanatory variables — itdoes not deal with the problem of reverse causality. Therefore, I cannot drawany conclusions on whether it is the ownership structure that affects Tobin’s Qor if it is Tobin’s Q that affects the ownership structure. When the fixed effectmethod is used, I can only establish a relation without being able to determineits causality. Obviously, this will make the conclusions of this paper somewhatweaker than they would have been using e.g. the IV method.Using a simultaneous regression model on American data, Cho (1998) showed
that firm value affects managerial ownership, rather than the opposite. However,reverse causality is less likely in my study compared to e.g. studies on managerialownership in the U.S. In contrast to Swedish CSs and CMs, the U.S. manager’sequity ownership is often earned as compensation to converge the manager’sinterests with those of the shareholders. Therefore Tobin’s Q could have apositive effect on managerial ownership in the U.S. Moreover, this argument isconsistent with the results of Kvist et al. (2004). Using Granger tests theyfind no significant effect of block ownership on firm value in Anglo-Americaneconomies, but a significant negative effect of block ownership on firm value inContinental Europe.
4.3.1 Regressions
The first hypothesis to be tested is that the existence of a CS is negativelyrelated to firm value. My definition of a CS is “the largest shareholder thatowns more than 25 % of the control rights”. Hence, I construct a dummythat equals one if there exists a shareholder owning more than 25% of thecontrol rights and that equals zero otherwise. Since this dummy is supposedto capture the entrenchment effect I simply call the dummy entrenchmentcsit .Beside the dummy, the control variables discussed above as well as year dummiesare included in the regression. Thus, Hypothesis 1 is tested using the followingregression:
ln(Qit) = β1entrenchmentcsit + β2−7controlsit + ui + εit (1)
i = 1, ..., 203, t = 1, ..., Ti
In this regression and those that follow, ui is the fixed firm effects, i.e.the firm-specific intercepts which is supposed to capture the unobserved firmheterogenity. εit is the error term. If my hypothesis is correct β1 is supposedto be negative since the dummy, entrenchmentcsit , is supposed to capture thenegative entrenchment effect of having a CS in the firm.
14
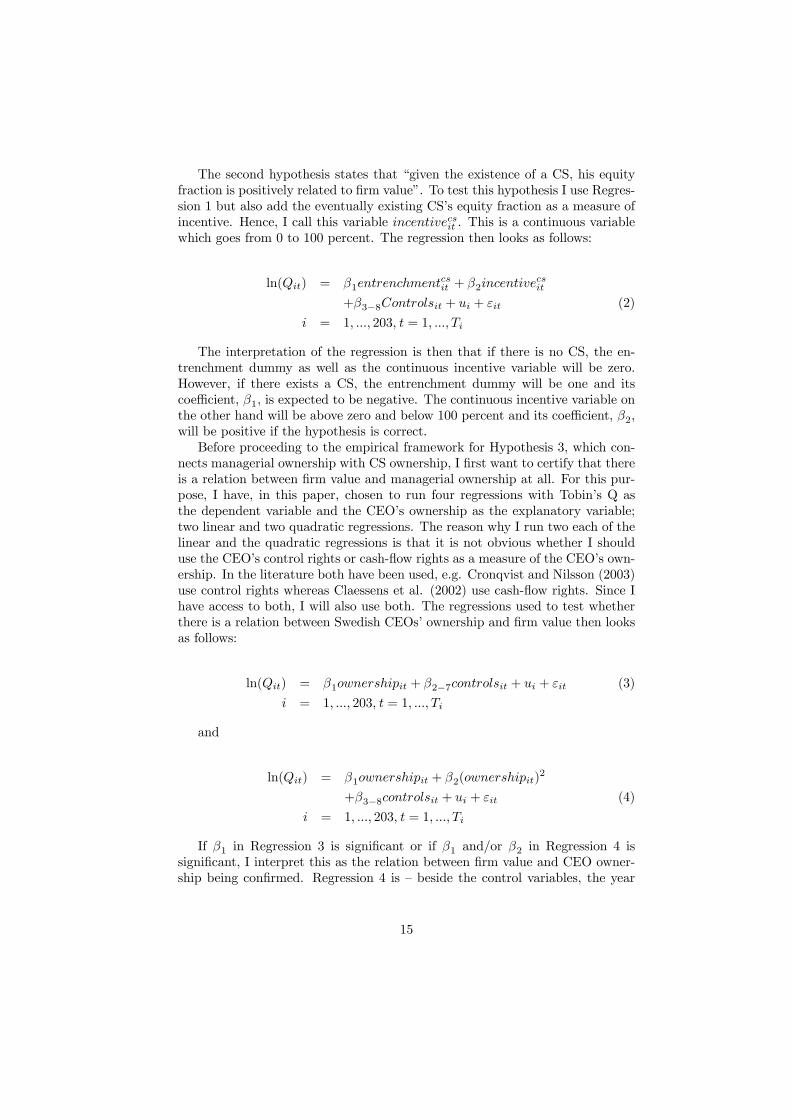
The second hypothesis states that “given the existence of a CS, his equityfraction is positively related to firm value”. To test this hypothesis I use Regres-sion 1 but also add the eventually existing CS’s equity fraction as a measure ofincentive. Hence, I call this variable incentivecsit . This is a continuous variablewhich goes from 0 to 100 percent. The regression then looks as follows:
ln(Qit) = β1entrenchmentcsit + β2incentivecsit
+β3−8Controlsit + ui + εit (2)
i = 1, ..., 203, t = 1, ..., Ti
The interpretation of the regression is then that if there is no CS, the en-trenchment dummy as well as the continuous incentive variable will be zero.However, if there exists a CS, the entrenchment dummy will be one and itscoefficient, β1, is expected to be negative. The continuous incentive variable onthe other hand will be above zero and below 100 percent and its coefficient, β2,will be positive if the hypothesis is correct.Before proceeding to the empirical framework for Hypothesis 3, which con-
nects managerial ownership with CS ownership, I first want to certify that thereis a relation between firm value and managerial ownership at all. For this pur-pose, I have, in this paper, chosen to run four regressions with Tobin’s Q asthe dependent variable and the CEO’s ownership as the explanatory variable;two linear and two quadratic regressions. The reason why I run two each of thelinear and the quadratic regressions is that it is not obvious whether I shoulduse the CEO’s control rights or cash-flow rights as a measure of the CEO’s own-ership. In the literature both have been used, e.g. Cronqvist and Nilsson (2003)use control rights whereas Claessens et al. (2002) use cash-flow rights. Since Ihave access to both, I will also use both. The regressions used to test whetherthere is a relation between Swedish CEOs’ ownership and firm value then looksas follows:
ln(Qit) = β1ownershipit + β2−7controlsit + ui + εit (3)
i = 1, ..., 203, t = 1, ..., Ti
and
ln(Qit) = β1ownershipit + β2(ownershipit)2
+β3−8controlsit + ui + εit (4)
i = 1, ..., 203, t = 1, ..., Ti
If β1 in Regression 3 is significant or if β1 and/or β2 in Regression 4 issignificant, I interpret this as the relation between firm value and CEO owner-ship being confirmed. Regression 4 is — beside the control variables, the year
15

dummies and the fixed firm effects — the very same regression as that used in Mc-Connell and Servaes (1990). They found a reversed U-shaped relation betweenfirm value and managerial ownership. However, they looked at the ownershipof the board of directors and not at the ownership of the single CEO, which isthe case here.Now that the framework for both CSs and managerial ownership is con-
structed I will turn to the last hypothesis, Hypothesis 3, which connects CSownership with managerial ownership. The third hypothesis is that the mag-nitude of Hypotheses 1 and 2 increases if the CS is a CEO. So, besides thevariables included in Regression 2, I also include a dummy, entrencmentcmit ,which equals one if there exists a CM, i.e. a CS that is also the CEO of thefirm, and this CM’s equity fraction, incentivecmit :
ln(Qit) = β1entrenchmentcsit + β2entrencmentcmit + β3incentivecsit
+β4incentivecmit + β5−10controlsit + ui + εit (5)
i = 1, ..., 203, t = 1, ..., Ti
If Hypothesis 3 is correct, β1 will be negative but β2 even more negative.β3 will be positive, but β4 even more positive. When the dummies are equal toone, the shareholder has entrenched himself and become a CS. This gives him orthe opportunity to consume corporate wealth without stigmatization, therebyreducing the firm value and hence, Tobin’s Q. If the controlling owner is alsoa manager, he is supposed to put in more human capital in the firm, therebyaugmenting the entrenchment effect. This implies an even stronger negativeentrenchment effect on Tobin’s Q.The shareholders’ equity percentage is supposed to have a positive sign to
support the hypothesis, however. As the CS’s equity fraction increases, hisinterest converges with those of the firm. If the controlling owner is a manager,he is also supposed to have the executive power to run the firm closer to hispreferences. Therefore, a CM’s equity ownership should increase firm value evenmore than an outsider CS’s equity fraction.The dummy variable of the owner’s voting rights and the continuous variable
of the owner’s equity share are, of course, highly correlated. If the voting rightsincrease, so does the equity share. This multicollinearity could induce someproblems with inefficient estimates. These problems appear in the form of highR2-values but insignificant t-ratios. However, as seen in Tables 2-4 in Section5, there seem to be no noticeable problems with multicollinearity.
5 ResultsIn this section I present and discuss the results of all regressions presented inSection 4.3.1. I start by presenting the results of Regression 1 which testsHypothesis 1. Table 2 shows Tobin’s Q to be significantly lower when a firm hasa CS. The table also shows the drop to be of economic significance; the value
16

of Swedish firms drops by 7.0 percent when the firm is controlled by a largeshareholder. These findings are consistent with e.g. Holderness and Sheehan(1988).The next regression to be tested is Regression 2 which looks like Regres-
sion 1 but the CS’s equity fraction has also been included. Regression 2 testsHypothesis 2, i.e. given the existence of a CS, his equity fraction is positivelyrelated to firm value, i.e. the CS dummy is supposed to capture the negativeentrenchment effect whereas his equity fraction is supposed to capture the pos-itive incentive effect. And as seen in Table 2, the results support hypothesis 2.For every additional percent of the firm’s equity fraction owned by the CS, firmvalue increases by 0.2 percent which is quite substantial. It is also noteworthythat when adding the CS’s equity fraction into the regression, β2 goes from -7.0percent in Regression 1 to -12.4 percent in Regression 2.My revision of the regressions used in Cronqvist and Nilsson (2003) has
confirmed the negative effect of having a CS found by them. But by separatingthe existence of a CS from his equity fraction owned, I have also shown thatthere might be a positive effect of CS ownership. Moreover, at a first glance,these results might seem to differ from those of Holderness and Sheehan (1988),i.e. that majority owners do not have a different effect on firm value than firmswith dispersed ownership. It must be considered, though, that they consideredmajority owned firms (50.1 percent or more), excluding those firms with ownersthat have the most negative effect on Tobin’s Q; those with enough shares tocontrol the firm (25 percent ownership), but yet not any considerable cash-flowrights which would give them incentives to make the firm perform well.
[Insert Table 2 about here]
Comments on Regressions 1’ and 2’ in Table 2 will be made in Section 6,Robustness Tests.Now that I have looked at the relation between firm value and CSs and
their ownership, I turn to see whether there is a relation between firm valueand managerial ownership. I am interested in whether firm value is in somewayrelated to CEOs’ ownership in Swedish firms. If this is the case, it is also likelythat the large part of the CSs that are also CEOs in some way has effects onthe results when studying the relation between firm value and CSs. Regressions3 and 4 are used to establish whether there is any relation between firm valueand managerial ownership.As shown by Table 3, I get significant beta values in both Regressions 3
and 4 using both the CEO’s equity share and vote share. The linear regressionshows a negative relation between firm value and managerial ownership. Asexpected the relation is more negative when the manager’s vote fraction is used,which is consistent with the idea that the entrenchment effect is better absorbedin the vote fraction than in the equity fraction, and the incentive effect betterabsorbed in the equity fraction than in the vote fraction.The quadratic regression suggests a U-shaped relation between firm value
and managerial ownership. This is the reversed relation suggested by Stulz
17
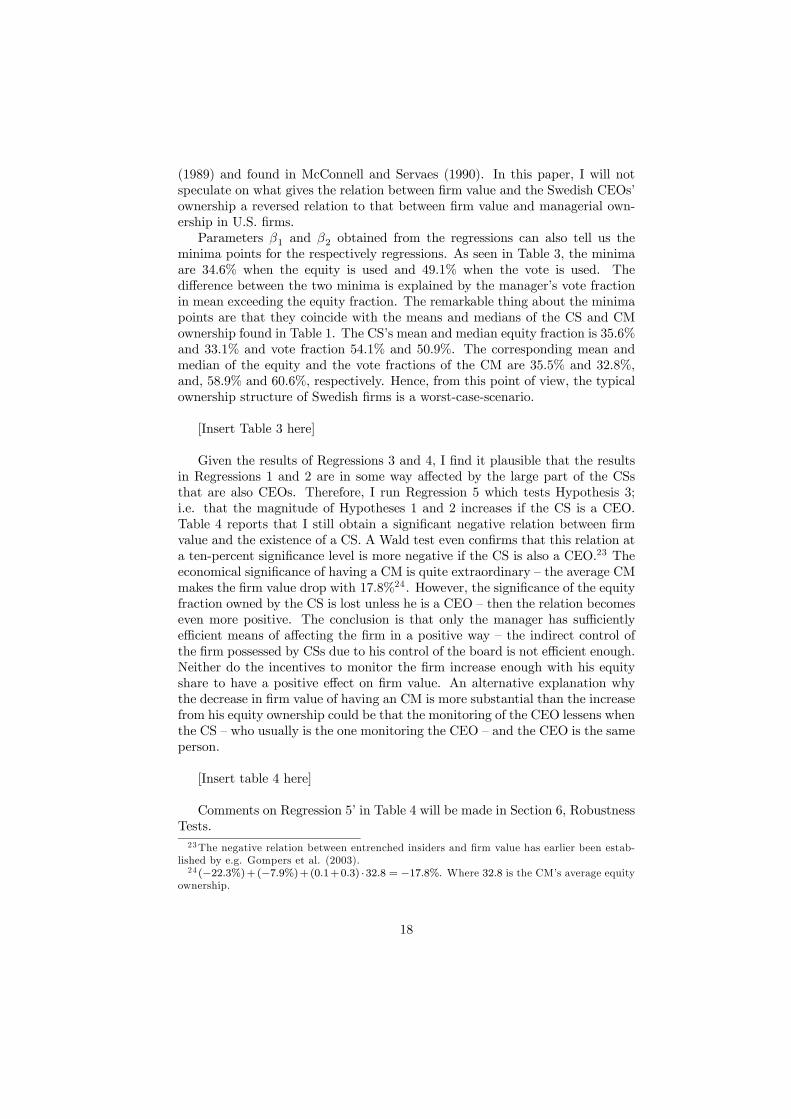
(1989) and found in McConnell and Servaes (1990). In this paper, I will notspeculate on what gives the relation between firm value and the Swedish CEOs’ownership a reversed relation to that between firm value and managerial own-ership in U.S. firms.Parameters β1 and β2 obtained from the regressions can also tell us the
minima points for the respectively regressions. As seen in Table 3, the minimaare 34.6% when the equity is used and 49.1% when the vote is used. Thedifference between the two minima is explained by the manager’s vote fractionin mean exceeding the equity fraction. The remarkable thing about the minimapoints are that they coincide with the means and medians of the CS and CMownership found in Table 1. The CS’s mean and median equity fraction is 35.6%and 33.1% and vote fraction 54.1% and 50.9%. The corresponding mean andmedian of the equity and the vote fractions of the CM are 35.5% and 32.8%,and, 58.9% and 60.6%, respectively. Hence, from this point of view, the typicalownership structure of Swedish firms is a worst-case-scenario.
[Insert Table 3 here]
Given the results of Regressions 3 and 4, I find it plausible that the resultsin Regressions 1 and 2 are in some way affected by the large part of the CSsthat are also CEOs. Therefore, I run Regression 5 which tests Hypothesis 3;i.e. that the magnitude of Hypotheses 1 and 2 increases if the CS is a CEO.Table 4 reports that I still obtain a significant negative relation between firmvalue and the existence of a CS. A Wald test even confirms that this relation ata ten-percent significance level is more negative if the CS is also a CEO.23 Theeconomical significance of having a CM is quite extraordinary — the average CMmakes the firm value drop with 17.8%24. However, the significance of the equityfraction owned by the CS is lost unless he is a CEO — then the relation becomeseven more positive. The conclusion is that only the manager has sufficientlyefficient means of affecting the firm in a positive way — the indirect control ofthe firm possessed by CSs due to his control of the board is not efficient enough.Neither do the incentives to monitor the firm increase enough with his equityshare to have a positive effect on firm value. An alternative explanation whythe decrease in firm value of having an CM is more substantial than the increasefrom his equity ownership could be that the monitoring of the CEO lessens whenthe CS — who usually is the one monitoring the CEO — and the CEO is the sameperson.
[Insert table 4 here]
Comments on Regression 5’ in Table 4 will be made in Section 6, RobustnessTests.23The negative relation between entrenched insiders and firm value has earlier been estab-
lished by e.g. Gompers et al. (2003).24 (−22.3%)+(−7.9%)+(0.1+0.3) ·32.8 = −17.8%. Where 32.8 is the CM’s average equity
ownership.
18

A notable deduction from the results of Regression 5 is that it takes morethan 88.7 percent equity ownership by the CS for the net effect of his presenceas a CS to have a positive effect on Tobin’s Q. Correspondingly, for the CM77.4 percent equity ownership is required for a positive net effect.
6 Robustness TestsIt is not obvious what method should be used when considering the relationbetween firm value and ownership. Therefore I will present the results of somealternative models and methods to those presented earlier in this paper as arobustness test of my paper. I will also try to replicate some of the relevantregressions of two closely related papers; Claessens et al. (2002) and Cronqvistand Nilsson (2003). These regressions will be performed using the same controlvariables that have been used earlier in this paper. Both Claessens et al. (2002)and Cronqvist and Nilsson (2003) have looked at large shareholders’ ownershipand the effects of using dual-class shares and they have, to some extent, usedmethods similar to mine.Since there are many regressions in these robustness tests, I have chosen to
only report some of the more interesting results in tables. Whether the resultsare reported or not is mentioned in the text.
6.1 Alternative Models
In Section 5 I first found a relation between Tobin’s Q and the existence of CSsand their equity ownership in Regressions 1 and 2. When I had also establisheda relation between Tobin’s Q and CEO ownership in Regressions 3 and 4, I foundin Regression 5 that a large part of the relation between Tobin’s Q and havinga CS stems from the large part of CSs that also are CEOs. An additionalway of confirming this conclusion is to see what happens when all CEOs areexcluded from the CS group when running Regressions 1 and 2.25 In that way,all eventual influence from the CMs on Tobin’s Q is excluded from the relationbetween Tobin’s Q and the existence of CSs and their equity fraction. Theseregressions are called 1’ and 2’ and their outcomes are presented in Table 2. Asreported in the table, the significance of the CS dummy and his equity fractionis lost in Regressions 1’ and 2’, which strengthens the conclusion that there isno relation between firm value and CSs, unless the CS also serves as the CEO.In Regression 5, I looked at the difference between CSs and CMs where,
per definition, CMs are individuals, whereas CSs cannot only be individualsor families, but also foundations, institutions, other corporations and so on.Therefore, the question is whether it is not more relevant to look at the dif-ference between CMs and other individuals being CSs. Hence, I exclude thenon-individuals from the CS sample and rerun Regression 5. This regression iscalled Regression 5’ and the result is presented in Table 4. The regression shows
25The sample size remains the same, 1754, since the CEOs are only excluded from the groupof CSs, i.e. they are not excluded from the sample.
19

no significant relation between firm value and CSs when non-individuals are ex-cluded. That is, Tobin’s Q does not have any relation to an individual beingin control per se. The relation between firm value and having a CM remains,however, and even grows as compared to Regression 5. Hence, I conclude thatboth the entrenchment effect and the incentive effect of having a CS are not atall effects of having a CS as such, but that the relation stems from a managerialeffect.
6.2 OLS
I have argued that fixed firm effects constitute a better method than OLS whentesting Regressions 1-5. However, I have chosen to run the regressions using OLSwith robust standard errors on all 1754 firm-year observations as a robustnesstest. These results are not reported in any table, however. Using OLS withrobust standard errors, the ownership variables in Regressions 2, 4 and 5 becomeinsignificant. Otherwise the results correspond to those using the fixed effectmethod. These results are the same whether year dummies are included or not.A significant fixed effect result but an insignificant OLS result suggests thereto be unobserved heterogeneities, captured by the fixed firm effects, explainingwhy CSs and CMs exist more often in firms with a low rather than a highTobin’s Q. Not surprisingly, some of the significance in Regressions 2, 4 and 5is re-established if industrial dummies are included in the regressions.
6.3 Q, not ln(Q)
In my paper, I have chosen to use the natural logarithm of Tobin’s Q due to theskewness. To test the solidity of my results, I have also chosen to test Regressions1-5 using an "unlogged" Tobin’s Q. The results then basically become the same,except the loss of significance in Regression 1, in Regression 3 when equity isused and also the CEOs equity fraction in Regression 5 becomes insignificant.These results are not reported in any table. One explanation to the insignificantresults could be that outliers in the data give more extreme values when Tobin’sQ is not logged
6.4 ROA
Even though Tobin’s Q is probably the most commonly used measure of firmvalue, it is not the only one. Another popular measurement is return on assets(ROA). The major difference between the two is that whereas Tobin’s Q isforward looking, ROA is backward looking. To test the solidity of the results ofRegressions 1-5, I have chosen to run the regressions using ROA as the dependentvariable.26 These regressions are not presented in any table. Even though thesigns are the same, all significance in the regressions is lost, except Regression 2and the continuous equity ownership variables in Regression 5 where the results
26When ROA is calculated the observations drop from 1754 to 1458 due to lack of informa-tion in the data.
20
remain the same as before. Even though these results are somewhat unfortunatefor the robustness of my results, it is also interesting that they are significantfor a forward looking measurement such as Tobin’s Q but not for a backwardlooking measurement such as ROA. However, it is not for this paper to explainwhy, but a task for future research.
6.5 Claessens et al. (2002)
In their paper Claessens et al. disentangled the incentive effect from the en-trenchment effect using a regression looking roughly like:
Q = β1 + β2(Ownership)i + β3(Control −Ownership)i
+β4−7(Control variables)i + εi (6)
where (Ownership)i is the cash-flow rights held by the largest shareholderand (Control −Ownership)i is the difference between control rights and cash-flow rights held by the largest shareholder. I test this regression using bothOLS regressions with robust standard errors on the 1996 data like they did, andthereafter with fixed firm effects during the period 1986-2001. Unlike Claessenset al. (2002), none of the regressions give any significant results. Since noneof the results are significant, I have chosen not to report them in a table. Oneplausible reason for the insignificant results using OLS, could be the lack ofobservations (only 128 observations). Another possible explanation for the in-significant results could be that I have more extensive data which allows meto include more relevant control variables, i.e. the results from Claessens et al.(2002), to some extent, might be explained by firm characteristics, not includedin their regressions, but in mine.
6.6 Cronqvist and Nilsson (2003)
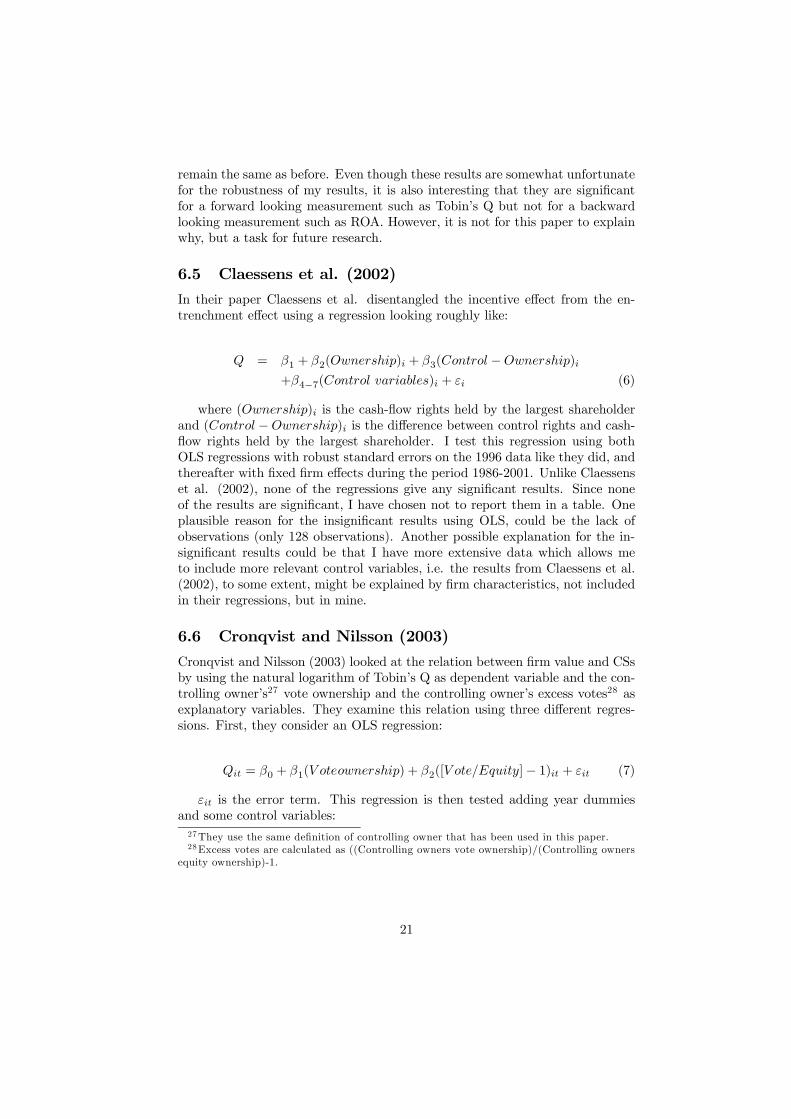
Cronqvist and Nilsson (2003) looked at the relation between firm value and CSsby using the natural logarithm of Tobin’s Q as dependent variable and the con-trolling owner’s27 vote ownership and the controlling owner’s excess votes28 asexplanatory variables. They examine this relation using three different regres-sions. First, they consider an OLS regression:
Qit = β0 + β1(V oteownership) + β2([V ote/Equity]− 1)it + εit (7)
εit is the error term. This regression is then tested adding year dummiesand some control variables:27They use the same definition of controlling owner that has been used in this paper.28Excess votes are calculated as ((Controlling owners vote ownership)/(Controlling owners
equity ownership)-1.
21
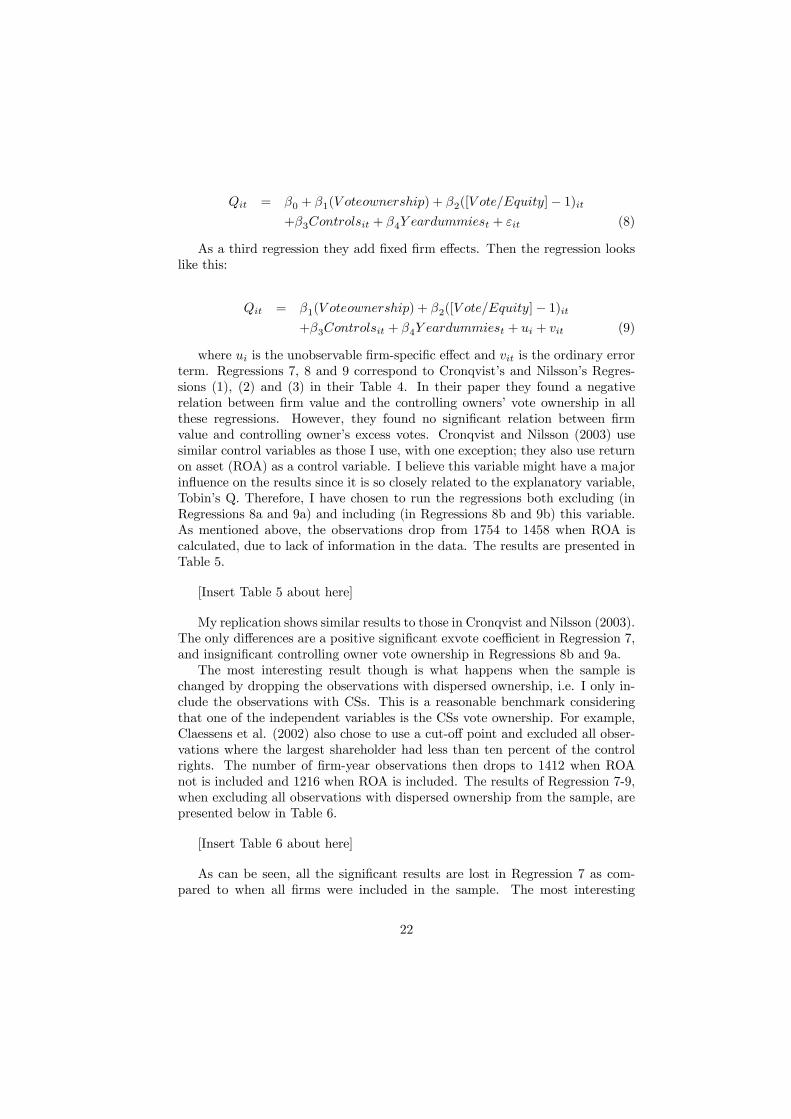
Qit = β0 + β1(V oteownership) + β2([V ote/Equity]− 1)it+β3Controlsit + β4Y eardummiest + εit (8)
As a third regression they add fixed firm effects. Then the regression lookslike this:
Qit = β1(V oteownership) + β2([V ote/Equity]− 1)it+β3Controlsit + β4Y eardummiest + ui + vit (9)
where ui is the unobservable firm-specific effect and vit is the ordinary errorterm. Regressions 7, 8 and 9 correspond to Cronqvist’s and Nilsson’s Regres-sions (1), (2) and (3) in their Table 4. In their paper they found a negativerelation between firm value and the controlling owners’ vote ownership in allthese regressions. However, they found no significant relation between firmvalue and controlling owner’s excess votes. Cronqvist and Nilsson (2003) usesimilar control variables as those I use, with one exception; they also use returnon asset (ROA) as a control variable. I believe this variable might have a majorinfluence on the results since it is so closely related to the explanatory variable,Tobin’s Q. Therefore, I have chosen to run the regressions both excluding (inRegressions 8a and 9a) and including (in Regressions 8b and 9b) this variable.As mentioned above, the observations drop from 1754 to 1458 when ROA iscalculated, due to lack of information in the data. The results are presented inTable 5.
[Insert Table 5 about here]
My replication shows similar results to those in Cronqvist and Nilsson (2003).The only differences are a positive significant exvote coefficient in Regression 7,and insignificant controlling owner vote ownership in Regressions 8b and 9a.The most interesting result though is what happens when the sample is
changed by dropping the observations with dispersed ownership, i.e. I only in-clude the observations with CSs. This is a reasonable benchmark consideringthat one of the independent variables is the CSs vote ownership. For example,Claessens et al. (2002) also chose to use a cut-off point and excluded all obser-vations where the largest shareholder had less than ten percent of the controlrights. The number of firm-year observations then drops to 1412 when ROAnot is included and 1216 when ROA is included. The results of Regression 7-9,when excluding all observations with dispersed ownership from the sample, arepresented below in Table 6.
[Insert Table 6 about here]
As can be seen, all the significant results are lost in Regression 7 as com-pared to when all firms were included in the sample. The most interesting
22

result, though, is that the CS vote ownership coefficient, β1, changes signs fromnegative to positive in Regressions 8 and 9, even though it is only in Regression9a that it is significant. My conclusion is that the negative relation found inCronqvist and Nilsson (2003) probably captures the effect of having a CS per serather than the CS’s ownership level in the firm. This result is consistent withthe idea of there being a negative relation between firm value and the existenceof a CS, but that the CS’s ownership in the firm is positively related to firmvalue.
7 Summary and ConclusionIn this paper I study the relation between controlling shareholders and the valueof the firm. Just like Claessens et al. (2002) I disentangle the entrenchmenteffect and the incentive effect of controlling shareholders. But in this paper Ialso disentangle the managerial effects from the effects of having a controllingshareholder.The major conclusion of this study is that expropriation of minority share-
holders occurs in such degree that the disadvantages for a firm to have a con-trolling shareholder by far exceed its benefits. Primarily this depends on theseparation between equity and control through extensive use of dual-class shares.Dual-class shares makes it possible to gain control of a firm without getting theright economical incentives, which leads to expropriation of the firm at the costof the smaller shareholders. Furthermore, the expropriation seem to be evenlarger when the controlling shareholder also act as CEO of the firm.Dual-class shares are used extensively among Swedish firms which in turn has
contributed to that the vast majority of the Swedish firms are dominated by asingle controlling shareholder. This corporate ownership structure has also beenencouraged by Swedish government, in fact, individuals and families who ownmore than 25 percent of the control rights in a firm even get tax advantages inSweden. However, the results of this study — among others — should indicate thatthe Swedish corporate governance policy ought to be revised. The circumstancethat non of the top 50 largest firms in year 2000 were founded after 1970 isan additional indication of an unhealthy corporate climate in Sweden [Högfeldt2004].The main idea with dual-class shares is to give entrepreneurs the opportunity
to get funding without for that matter loosing control of their firm. The majordrawback with this system is that when the firm no longer is controlled by theyoung enthusiastic founder — but rather an heir, another firm, institution etc. —dual-class shares instead seem to destroy firm value. Hence a good alternativesystem to the one used today could be... [Morck forthcoming 2006].
23
8 ReferencesAdams, R.B., Almeida, H. and Ferreira, D., 2003. "Understanding the Rela-tionship between Founder-CEOs and Firm Performance". Working paper.Adams, R.B. and Santos, J.A.C., 2004. "Identifying the Effect of Managerial
Control on Firm Performance". Working paper.Allayannis, G. and Weston, J.P., 2001. "The Use of Foreign Currency
Derivatives and Firm Market Value". The Review of Financial Studies 14,243-276.Bebchuk, L.A., Kraakman, R. and Triantis, G, 2000. "Stock Pyramids,
Cross-ownership, and Dual Class Equity: The Creation and Agency Costs ofSeparating Control from Cash-Flow rights". In Morck, R. ed. ConcentratedCorporate Ownership, National Bureau of Economic Research Conference Vol-ume, University of Chicago Press.Berle, A.A. and Means, G.C., 1932. "The Modern Corporation and Private
Property". New York, MacMillan Publishing CO.Burkart, M., Gromb, D. and Panunzi, F., 1997. "Large Shareholders, Mon-
itoring, and the Value of the Firm". The Quarterly Journal of Economics 112,693-728.Burkart, M., Panunzi, F. and Shleifer, A., 2003. "Family Firms". The
Journal of Finance 58, 2173-2201.Cho, M., 1998. "Ownership Structure, Investmant, and the Corporate Value:
An Empirical Analysis". Journal of Financial Economics 47, 103-121.Claessens, S., Djankov, S. and Lang, L.H.P., 2000. "The Separation of Own-
ership and Control in East Asian Corporations". Journal of Financial Economics58, 81-112.Claessens, S., Djankov, S., Fan, J.P.H. and Lang, L.H.P., 2002. "Disen-
tangling the Incentive and Entrenchment Effects of Large Shareholdings". TheJournal of Finance 57, 2741-2771.Cronqvist, H. and Nilsson, M., 2003. "Agency Costs of Controlling Minority
Shareholders". Journal of Financial and Quantitative Analysis 38, 695-719.Davies, J.R., Hillier, D. and McColgan, P., 2005. "Ownership Structure,
Managerial Behavior and Corporate Value". Journal of Corporate Finance 11,645-660.Demsetz, H., 1983. "The Structure of Ownership and the Theory of the
Firm". Journal of Law and Economics 26, 375-394.Demsetz, H. and Lehn, K., 1985. "The Structure of Corporate Ownership:
Causes and Consequences". Journal of Political Economy 93, 1155-1177.Demsetz, H. and Villalonga, 2001. "Ownership Structure and Corporate
Performance". Journal of Corporate Finance 7, 209-233.Denis, D.J. and Denis, K.D., 1994. "Majority Owner-Manager and Organi-
zational Efficiency". Journal of Corporate Finance 1, 91-118.Faccio, M. and Lang, L.H.P., 2002. "The Ultimate Ownership of Western
European Corporations". Journal of Financial Economics 65, 365-395.Fama, E.F. and Jensen, M.C., 1983a. "Separation of Ownership and Con-
trol". Journal of Law & Economics 26, 301-325.
24
Fama, E.F. and Jensen, M.C., 1983b. "Agency Problems and ResidualClaims". Journal of Law & Economics 26, 327-349.Grossman, S.J. and Hart, O.D., 1980. "Disclosure Laws and Takeover Bids".
The Journal of Finance 35, 323-334.Hausman, J, 1978. "Specification Tests in Econometrics". Econometrica,
46, 1251-1271.Himmelberg, C.P., Hubbart, R.G. and Palia, D., 1999. "Understanding the
Determinants of Managerial Ownership and the Link Between Ownership andPerformance". Journal of Financial Economics 53, 333-384.Holderness, C.G. and Sheehan, D.P., 1988. "The Role of Majority Share-
holders in Publicly Held Corporations". Journal of Financial Economics 20,317-346.Holderness, C.G., Kroszner, R.S. and Sheehan, D.P., 1999. "Were the Good
Old Days That Good? Changes in Managerial Stock Ownership Since the GreatDepression". The Journal of Finance 54, 435-469.Holmén, M. and Högfeldt, P., 2004. "A Law and Finance Analysis of Initial
Public Offerings". Journal of Financial Intermediation 13, 324-358.Högfeldt, P., 2004. "The History and Politics of Corporate Ownership in
Sweden". NBER Working paper #10641.Jensen, M.C. and Meckling, W.H., 1976. "Theory of the Firm: Manage-
rial Behavior, Agency Costs and Ownership Structure". Journal of FinancialEconomics 3, 305-360.Johnson, S., La Porta, R., Lopez-de-Silanes, F. and Shleifer, A., 2000. "Tun-
neling". The American Economic Review 90, 22-27.Kvist, H.K., Pedersen, T. and Thomsen, S., 2006. "Blockholder Ownership:
Effects on Firm Value In Market and Control Based Governance Systems".Journal of Corporate Finance 12, 246-269.La Porta, R., Lopez-de-Silanes, F. and Shleifer, A., 1998. "Law and Fi-
nance". Journal of Financial Economics 106, 1113-1155.La Porta, R., Lopez-de-Silanes, F. and Shleifer, A., 1999. "Corporate Own-
ership Around the World". Journal of Finance 54, 471-517.McConnell, J.J. and Servaes, H., 1990. "Additional Evidence on Equity
Ownership and Corporate Value". Journal of Financial Economics 27, 595-612.Morck, R., Shleifer, A. and Vishny, R.W., 1988. "Management Ownership
and the Market Valuation". Journal of Financial Economics 20, 293-315.Myers, S.C. and N.S. Majluf, 1984. "Corporate Finance and Investment De-
cisions when firms have information investors do not have". Journal of FinancialEconomics 13, 187-221.Perfect, S.B. and Wiles, K.W., 1994. "Alternative Construction of Tobin’s
Q: An Empirical Comparison". Journal of Empirical Finance 1, 313-341.Shleifer, A. and Vishny, R.W., 1986. "Large Shareholders and Corporate
Control". Journal of Political Economy 94, 461-488.Shleifer, A. and Vishny, R.W., 1989. "Management Entrenchment: The
Case of Manager-Specific Investments". Journal of Financial Economics 25,123-139.
25
Shleifer, A. and Vishny, R.W., 1997. "A Survey of Corporate Governance".The Journal of Finance 52, 737-783.Stulz, R.M., 1988. "Managerial Control of Voting Rights: Financing Policies
and the Market for Corporate Control". Journal of Financial Economics 20, 25-54.Weston, J.F., 1979. "The Tender Takeover". Mergers and Acquisitions,
74-82.Zhou, X., 2001. "Understanding the Determination of Managerial Owner-
ship and Its Relationship to Firm Performance". Journal of Financial Economics62, 559-571.Zingales, L., 1994. "The Value of the Voting Right: A Study of Milan Stock
Exchange Experience". The Review of Financial Studies 7, 125-148.
26

Table 1: Descriptive StatisticsCS No CS Diff.
Mean Median Mean Median t-test Wilcoxon
Q 1.45 1.13 1.97 1.29 (0.000) (0.000)CS equity 35.6% 33.1% - -CS vote 54.1% 50.9% - -CS v/e 1.52 1.54 - -CM equity 35.5% 32.8% - -CM vote 58.9% 60.6% - -CM v/e 1.66 1.85 - -CEO equity 9.2% 0% 2.1% 0% (0.000) (0.000)CEO vote 14.9% 0% 3.8% 0% (0.000) (0.003)CEO v/e 1.62 - 1.81 - (0.000) (0.000)ln(Size) 7.48 7.30 7.48 7.23 (0.958) (0.550)Leverage 0.66 0.31 0.57 0.60 (0.000) (0.000)Sales/Total assets 1.01 1.07 1.16 1.18 (0.000) (0.000)PPE/Total assets 0.47 0.45 0.43 0.40 (0.001) (0.000)Inv./Total assets 0.11 0.09 0.11 0.08 (0.258) (0.144)ln(Age) 3.60 3.87 3.37 3.51 (0.000) (0.000)n 1405 349
This table reports descriptive statistics of the 203 Swedish firms over the years
1985-2000, used in the regressions of this paper. The sample is divided into
two sub-samples; one where there is a CS in the observed firm and one where
there is not. In the last two columns, a t-test and a Wilcoxon test are made to
see whether the mean or the median differs between the two samples. An
approximation of Tobin’s Q is reported followed by both the equity fraction and
the vote fraction owned by the CS, CM and of the CEO in the observed firm.
Moreover, the v/e ratios ( the ratios between the vote share and the equity
share) are included to give an insight in to what degree the CS, CM and CEO
uses dual-class shares. Finally, the statistics of the control variables
are reported. The numbers in parentheses are the p-values of the t-test
and the Wilcoxon-test.
27

Table 2: Fixed effect regressions on the relation between Tobin’s Q and CSsand their equity ownership
Dependent variable: ln(Tobin’s Q)Regression: 1 2 1’ (No CEOs) 2’ (No CEOs)
Constant 0.966 0.970 0.901 0.903(0.000) (0.000) (0.000) (0.000)
entrenchmentcsit -0.070 -0.124 0.014 -0.013(0.008) (0.001) (0.518) (0.721)
incentivecsit - 0.002 - 0.001(0.036) (0.352)
ln(Firm size) -0.012 -0.011 -0.008 -0.008(0.530) (0.563) (0.664) (0.682)
Leverage -0.522 -0.536 -0.531 0.537(0.000) (0.000) (0.000) (0.000)
Sales/Total assets 0.027 0.026 0.030 0.029(0.366) (0.379) (0.313) (0.330)
PPE/Total assets -0.179 -0.170 -0.173 -0.170(0.007) (0.010) (0.009) (0.010)
Inv./Total assets 0.250 0.248 0.254 0.251(0.001) (0.001) (0.001) (0.001)
ln(Age) -0.068 -0.072 -0.075 -0.076(0.056) (0.043) (0.034) (0.032)
Year dummies yes yes yes yesN 203 203 203 203n 1754 1754 1754 1754Hausman-test 51.69 63.63 76.80 64.13
(0.000) (0.000) (0.000) (0.000)F-test 17.31 16.80 16.96 16.26
(0.000) (0.000) (0.000) (0.000)R2 0.230 0.218 0.220 0.217Table 2 reports the estimated relation between the existence of a CS and the CS’s
ownership on the natural logarithm of Tobin’s Q. entrenchmentcsit is a dummy thatequals one if there exists a CS and zero otherwise. incentivecsit is the CS’s equityfraction in the firm. In Regressions 1’ and 2’ however, the CEOs are excluded from the
CS group; i.e. when a CS also is a CEO, the dummy equals zero. After
entrenchmentcsit and incentivecsit the results of the control variables are
reported. Year dummies for the years 1986-2000 are used in the regressions.
N is the number of firms, whereas n is the number of total observations of the 203
firms over the years 1985-2000. The Hausman-test is madeunder the null-hypothesis
of no correlation between regressors and firm-specific effects. The F-test is made to
test whether the fixed firm effects are jointly significant.
p-values are reported in parentheses.
28
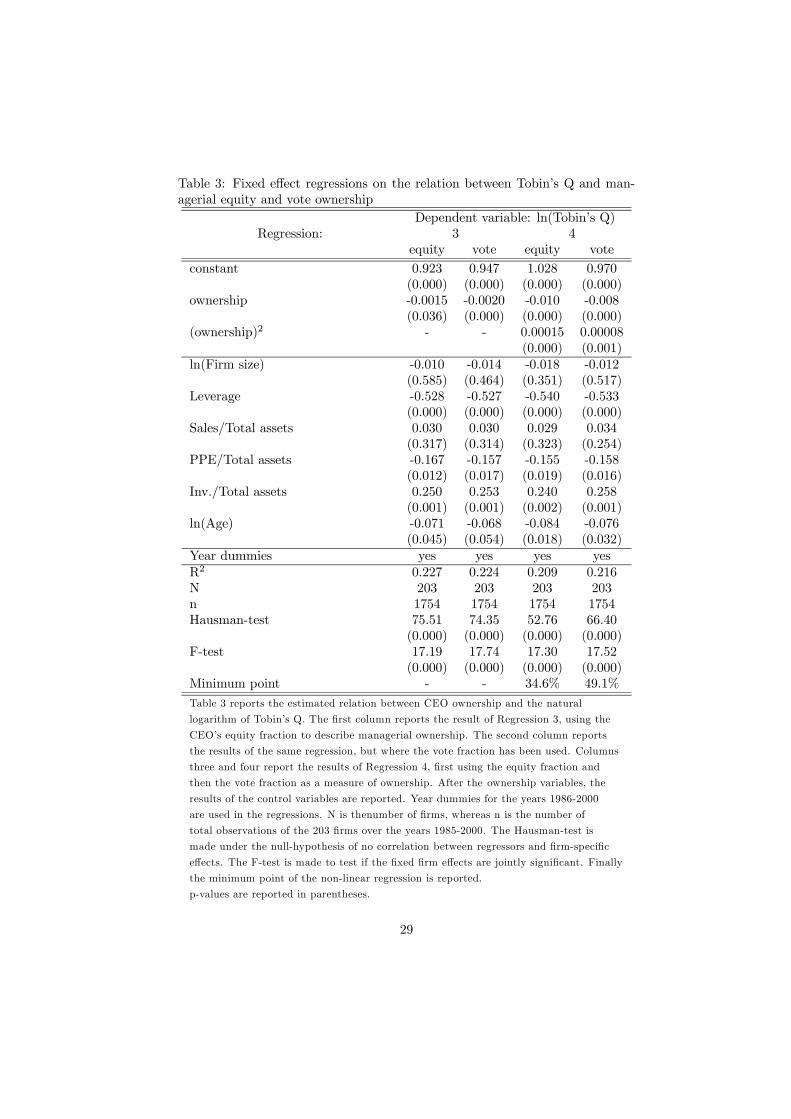
Table 3: Fixed effect regressions on the relation between Tobin’s Q and man-agerial equity and vote ownership
Dependent variable: ln(Tobin’s Q)Regression: 3 4
equity vote equity voteconstant 0.923 0.947 1.028 0.970
(0.000) (0.000) (0.000) (0.000)ownership -0.0015 -0.0020 -0.010 -0.008
(0.036) (0.000) (0.000) (0.000)(ownership)2 - - 0.00015 0.00008
(0.000) (0.001)ln(Firm size) -0.010 -0.014 -0.018 -0.012
(0.585) (0.464) (0.351) (0.517)Leverage -0.528 -0.527 -0.540 -0.533
(0.000) (0.000) (0.000) (0.000)Sales/Total assets 0.030 0.030 0.029 0.034
(0.317) (0.314) (0.323) (0.254)PPE/Total assets -0.167 -0.157 -0.155 -0.158
(0.012) (0.017) (0.019) (0.016)Inv./Total assets 0.250 0.253 0.240 0.258
(0.001) (0.001) (0.002) (0.001)ln(Age) -0.071 -0.068 -0.084 -0.076
(0.045) (0.054) (0.018) (0.032)Year dummies yes yes yes yesR2 0.227 0.224 0.209 0.216N 203 203 203 203n 1754 1754 1754 1754Hausman-test 75.51 74.35 52.76 66.40
(0.000) (0.000) (0.000) (0.000)F-test 17.19 17.74 17.30 17.52
(0.000) (0.000) (0.000) (0.000)Minimum point - - 34.6% 49.1%Table 3 reports the estimated relation between CEO ownership and the natural
logarithm of Tobin’s Q. The first column reports the result of Regression 3, using the
CEO’s equity fraction to describe managerial ownership. The second column reports
the results of the same regression, but where the vote fraction has been used. Columns
three and four report the results of Regression 4, first using the equity fraction and
then the vote fraction as a measure of ownership. After the ownership variables, the
results of the control variables are reported. Year dummies for the years 1986-2000
are used in the regressions. N is thenumber of firms, whereas n is the number of
total observations of the 203 firms over the years 1985-2000. The Hausman-test is
made under the null-hypothesis of no correlation between regressors and firm-specific
effects. The F-test is made to test if the fixed firm effects are jointly significant. Finally
the minimum point of the non-linear regression is reported.
p-values are reported in parentheses.
29
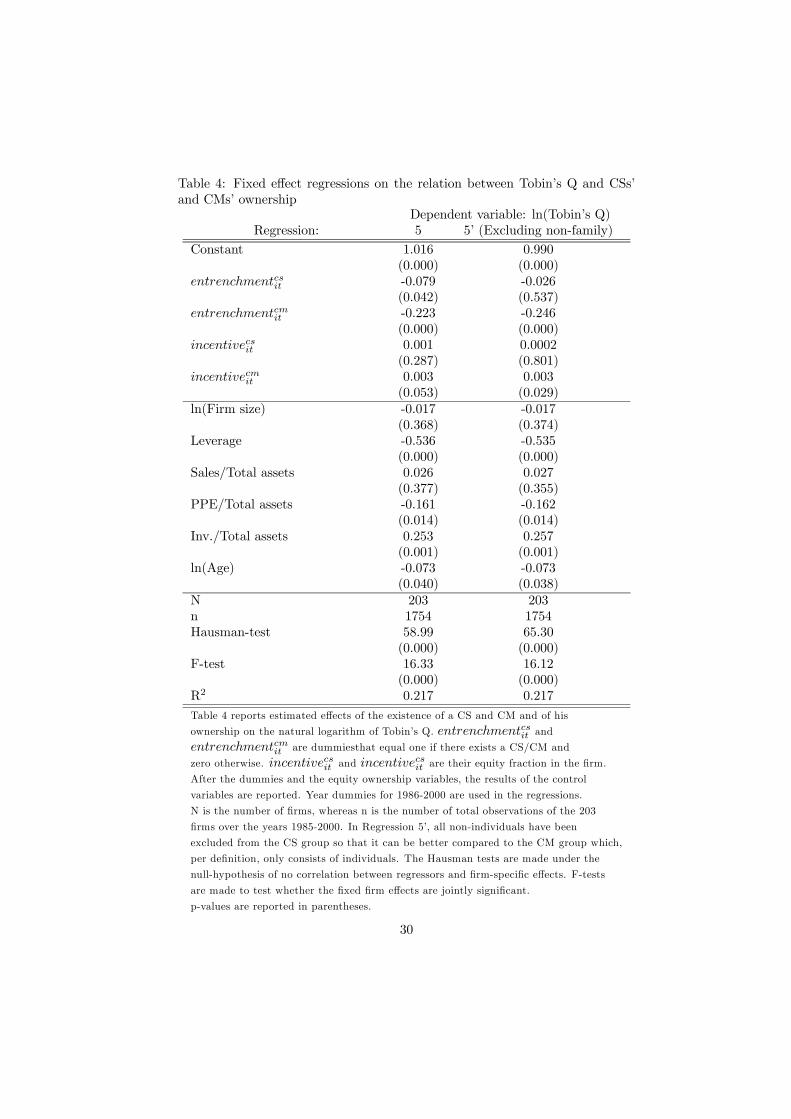
Table 4: Fixed effect regressions on the relation between Tobin’s Q and CSs’and CMs’ ownership
Dependent variable: ln(Tobin’s Q)Regression: 5 5’ (Excluding non-family)
Constant 1.016 0.990(0.000) (0.000)
entrenchmentcsit -0.079 -0.026(0.042) (0.537)
entrenchmentcmit -0.223 -0.246(0.000) (0.000)
incentivecsit 0.001 0.0002(0.287) (0.801)
incentivecmit 0.003 0.003(0.053) (0.029)
ln(Firm size) -0.017 -0.017(0.368) (0.374)
Leverage -0.536 -0.535(0.000) (0.000)
Sales/Total assets 0.026 0.027(0.377) (0.355)
PPE/Total assets -0.161 -0.162(0.014) (0.014)
Inv./Total assets 0.253 0.257(0.001) (0.001)
ln(Age) -0.073 -0.073(0.040) (0.038)
N 203 203n 1754 1754Hausman-test 58.99 65.30
(0.000) (0.000)F-test 16.33 16.12
(0.000) (0.000)R2 0.217 0.217Table 4 reports estimated effects of the existence of a CS and CM and of his
ownership on the natural logarithm of Tobin’s Q. entrenchmentcsit andentrenchmentcmit are dummiesthat equal one if there exists a CS/CM and
zero otherwise. incentivecsit and incentivecsit are their equity fraction in the firm.
After the dummies and the equity ownership variables, the results of the control
variables are reported. Year dummies for 1986-2000 are used in the regressions.
N is the number of firms, whereas n is the number of total observations of the 203
firms over the years 1985-2000. In Regression 5’, all non-individuals have been
excluded from the CS group so that it can be better compared to the CM group which,
per definition, only consists of individuals. The Hausman tests are made under the
null-hypothesis of no correlation between regressors and firm-specific effects. F-tests
are made to test whether the fixed firm effects are jointly significant.
p-values are reported in parentheses.
30
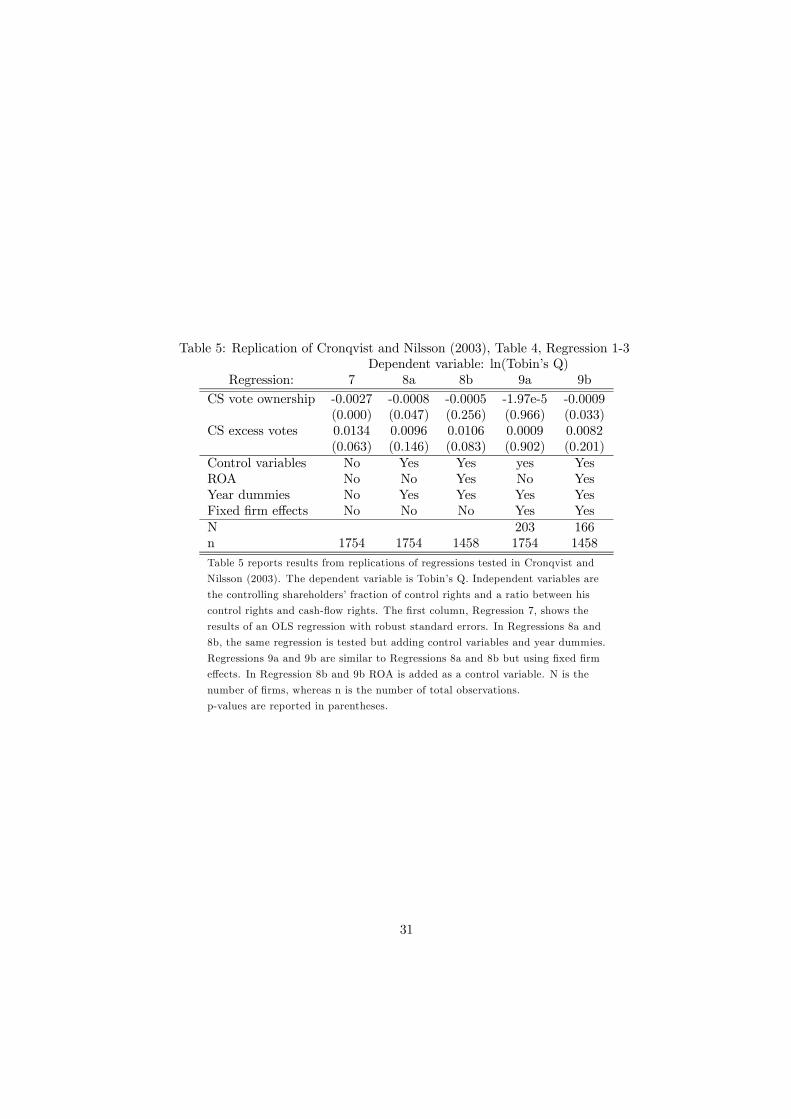
Table 5: Replication of Cronqvist and Nilsson (2003), Table 4, Regression 1-3Dependent variable: ln(Tobin’s Q)
Regression: 7 8a 8b 9a 9b
CS vote ownership -0.0027 -0.0008 -0.0005 -1.97e-5 -0.0009(0.000) (0.047) (0.256) (0.966) (0.033)
CS excess votes 0.0134 0.0096 0.0106 0.0009 0.0082(0.063) (0.146) (0.083) (0.902) (0.201)
Control variables No Yes Yes yes YesROA No No Yes No YesYear dummies No Yes Yes Yes YesFixed firm effects No No No Yes YesN 203 166n 1754 1754 1458 1754 1458Table 5 reports results from replications of regressions tested in Cronqvist and
Nilsson (2003). The dependent variable is Tobin’s Q. Independent variables are
the controlling shareholders’ fraction of control rights and a ratio between his
control rights and cash-flow rights. The first column, Regression 7, shows the
results of an OLS regression with robust standard errors. In Regressions 8a and
8b, the same regression is tested but adding control variables and year dummies.
Regressions 9a and 9b are similar to Regressions 8a and 8b but using fixed firm
effects. In Regression 8b and 9b ROA is added as a control variable. N is the
number of firms, whereas n is the number of total observations.
p-values are reported in parentheses.
31

Table 6: Replication of Cronqvist and Nilsson (2003), Table 4, Regression 1-3.Firms with dispersed ownership excluded from sample.
Dependent variable: ln(Tobin’s Q)Regression: 7 8a 8b 9a 9b
CS vote ownership -0.005 0.0004 0.0007 0.003 0.001(0.402) (0.501) (0.222) (0.000) (0.233)
CS excess votes 0.006 0.003 0.003 0.003 0.005(0.341) (0.622) (0.581) (0.655) (0.462)
Control variables No Yes Yes yes YesROA No No Yes No YesYear dummies No Yes Yes Yes YesFixed firm effects No No No Yes YesN 182 154n 1412 1412 1216 1412 1216Table 6 reports results from replications of regressions tested in Cronqvist and
Nilsson (2003). The difference from Table 5 is that all firms with dispersed
ownership have been excluded from the sample. The dependent variable is
Tobin’s Q. Independent variables are the controlling shareholders’ fraction of
control rights and a ratio between his control rights and cash-flow rights.
The first column, Regression 7, shows the results of an OLS regression
with robust standard errors. In Regressions 8a and 8b, the same
regression is tested but adding control variables and year dummies.
Regressions 9a and 9b are similar to Regressions 8a and 8b, but using
fixed firm effects. In Regression 8b and 9b ROA is added as control variable.
N is the number of firms, whereas n is the number of total observations.
p-values are reported in parentheses.
32