controlling the thermoelectric properties of polymers
TRANSCRIPT

15140 | Phys. Chem. Chem. Phys., 2015, 17, 15140--15145 This journal is© the Owner Societies 2015
Cite this:Phys.Chem.Chem.Phys.,
2015, 17, 15140
Controlling the thermoelectric properties ofpolymers: application to PEDOT and polypyrrole
Mario Culebras, Belen Uriol, Clara M. Gomez and Andres Cantarero*
Poly(3,4-ethylenedioxythiophene) (PEDOT) and polypyrrole (PPy) films have been prepared by an
electrochemical method in a three electrode cell. The films have been obtained at different oxidation
levels regarded as bipolaron, polaron and neutral states by varying the voltage, as is usually done in
conjugated heterocyclic polymers. The voltage (�0.2 o V o 1.0 V) has been applied versus a Ag/AgCl
reference electrode, producing a variation of one order of magnitude in the electrical conductivity and
the Seebeck coefficient of the films. In the voltage range explored, the electrical conductivity increases
from 80 to 766 S cm�1 in PEDOT and from 15 to 160 S cm�1 in PPy, while the Seebeck coefficient
decreases from 37.0 to 9.6 mV K�1 for PEDOT and from 51.0 to 6.7 mV K�1 for PPy. The thermal
conductivity remains unchanged with the oxidation state of the film, k E 0.35 � 0.02 W m�1 K�1 for
PEDOT and 0.17 � 0.02 W m�1 K�1 for PPy. A maximum thermoelectric efficiency of 1.4 � 10�2 for PEDOT
and 6.8 � 10�3 for PPy has been achieved. These changes are related to the doping level of the polymer
films and they can be accurately controlled by the applied voltage. In this work, we provide a very simple
method to control and optimize the power factor or the figure of merit of conducting polymers.
1 Introduction
The lack of energy resources is a global problem. On one side,the oil reservoirs are limited, while on the other the energydemand is increasing over the years not only in developedcountries, but also due to new demands which came into themarket from countries like China and India with a growth rateof 5–8%. Water will also become a problem in the future, thusprobably hydraulic plants will provide energy for a short periodof time difficult to evaluate. With this panorama in mind, newenergy resources must be in operation soon at least to com-pensate the growth of the energy market. The most plausiblealternative at the moment is nuclear plants; being pragmaticthey must be used at least for a few decades until enoughenergy can be supplied by photovoltaics, mill farms, biomass,and other clean/green energy production processes compatiblewith the sustainability of our planet. In the last few years,thermoelectricity has arisen as a promising alternative to trans-form waste heat into electricity, via the Seebeck effect, or tocomplement photovoltaic cells, to keep them working at maxi-mum efficiency.1 Unfortunately, the efficiency of thermoelectricdevices has not been improved much in the last few decades.But in a few years from now, the scientific community will startto work hard on thermoelectricity and we can expect substantialgrowth of the efficiency in the next few years. How good a
thermoelectric material is can be quantitatively written in termsof the dimensionless figure of merit ZT, which is defined as:
ZT ¼ S2sk
T ; (1)
where S is the Seebeck coefficient, s the isothermal electricalconductivity, k the thermal conductivity and T the absolutetemperature. Since the Seebeck coefficient goes to the square,it seems more important to increase S, even if s decreases by areasonable amount. Actually, many times, when we work withsimilar materials, it is enough to use the power factor PF � S2sto know if the thermoelectric efficiency is being improved.
Nowadays, the best thermoelectric materials in terms of ZTare semiconductors. For instance, Bi2Sb3 is a good thermoelectricmaterial used in low temperature applications,2 while Bi2Te3 andPbTe can be used for room temperature applications3–7 andSi1�xGex alloys8 and half-Heusler compounds9 in high tempera-ture applications, and skutterudites in medium-temperaturethermoelectric modules.10 The figure of merit was around one formany years, until the beginning of the 90’s of the last century. Afterthe seminal work of Hicks and Dresselhaus11 it was clear that byreducing the dimensionality (for instance by building a super-lattice) of the semiconductor, the figure of merit would increase,whenever the Fermi energy can be located in a maximum of thedensity of electronic states. Unfortunately, in more than 20 years ofresearch, ZT has increased only by a factor of 3.
In the last 10–15 years, organic materials have become importantin optoelectronics,12,13 both in solar cells and light emitting diodes,
Materials Science Institute, University of Valencia, PO Box 22085, 46071 Valencia,
Spain. E-mail: [email protected]; Fax: +34 963543633; Tel: +34 963544713
Received 2nd April 2015,Accepted 24th April 2015
DOI: 10.1039/c5cp01940k
www.rsc.org/pccp
PCCP
PAPER
Ope
n A
cces
s A
rtic
le. P
ublis
hed
on 2
8 A
pril
2015
. Dow
nloa
ded
on 4
/9/2
022
4:49
:36
AM
. T
his
artic
le is
lice
nsed
und
er a
Cre
ativ
e C
omm
ons
Attr
ibut
ion
3.0
Unp
orte
d L
icen
ce.
View Article OnlineView Journal | View Issue

This journal is© the Owner Societies 2015 Phys. Chem. Chem. Phys., 2015, 17, 15140--15145 | 15141
and more recently in thermoelectricity,14,15 especially in thinfilms, where the polymer chains remain basically in two dimen-sions.16,17 Several intrinsically conducting polymers (ICPs) havebeen successfully used, increasing the figure of merit by severalorders of magnitude,15,18 until the values were very close tothose of inorganic materials. Polymers present, in addition,many advantages over inorganic materials: nonscarcity ofraw materials, lack of toxicity, lower cost of production andmany others. In the case of inorganic compounds, one of thebarriers which does not allow the improvement of ZT is theirhigh thermal conductivity, which is mainly produced by theheat transported by phonons. Polymers have a thermal con-ductivity at least one order of magnitude smaller than anysemiconductor. In the next few years, we need to work on theimprovement of the Seebeck coefficient and the electrical con-ductivity of ICPs.
The efficiency of thermoelectric polymers is largely dependenton the doping level of the material since it modifies both S and s.These parameters are actually not completely independent.Thus, by increasing the doping level the electrical conductivityincreases but the Seebeck coefficient decreases making itnecessary to find a balance between them in order to obtainthe optimum value of ZT, which is actually given by the powerfactor PF.19–23 One of the methods more commonly used tocontrol the doping level of polymers is chemical de-doping.19–21
This method changes the doping level by using reducingagents such as hydrazine or tetrakis(dimethylamino)ethylene(TDAE).19–21 Another procedure to control the doping level iselectrochemical doping/de-doping,22,23 which offers certainadvantages. The first one is that the oxidation state (dopinglevel) can be easily controlled by using an electrochemical cell.The second advantage is the absence of purification steps,required in other methods, which again simplifies the process.Finally, it produces a free standing film, which is moreover anovelty, indicating that it does not need an electrode in orderto work.
In this work, we have synthesized free-standing films byelectrochemical deposition of two conducting polymers, poly-(3,4-ethylenedioxythiophene) (PEDOT) and polypyrrole (PPy).The electrochemical cell has been employed to change thedoping level of the polymers in order to control the thermo-electric properties. We describe a new methodology able to controlthe thermoelectric properties of conducting polymers, such asPEDOT and PPy, and able to supply the required properties fora given application. This is of great importance in futureapplications as for instance the use of polymer matrices inthermoelectric nanocomposites or as sensitive elements intemperature sensors.
2 Experimental2.1 Materials
The reactants used in this work, pyrrole, 3,4-ethylenedioxy-thiophene (EDOT), lithium perchlorate (LiClO4), ethanol andacetonitrile, were purchased from Sigma-Aldrich.
2.2 Synthesis of PEDOT
The electrochemical synthesis of PEDOT was carried out at roomtemperature in a three electrode cell following the proceduredescribed in a previous work.19 The working electrode was a goldcoated PET surface for SEM and transport measurements, while anITO coated glass was used for cyclic voltammetry and absorbancemeasurements. A platinum grid acted as the counter electrode andthe Ag/AgCl electrode acted as the reference electrode. PEDOT waspolymerized from a 0.01 M solution of EDOT and LiClO4 0.1 M inacetonitrile. Electrochemical polymerization was performed at adeposition intensity of 3 mA for 1.5 min over the working electrodesurface. Films of 120–130 nm thickness were obtained. The goldlayer of the corresponding working electrode was removed with anacid solution (HNO3 : HCl ratio 1 : 3) after film deposition. Finally,the deposited PEDOT films were rinsed several times with waterand ethanol to remove the untreated monomer and then dried inair at room temperature.
2.3 Synthesis of polypyrrole
Polypyrrole films were also prepared at room temperature bythe electrochemical polymerization method in a conventionalthree electrode system. The working electrode was a stainlesssteel electrode for SEM and transport measurements while anITO electrode was used for voltamperometry and absorbancemeasurements. A platinum grid acted as the counter-electrodeand the Ag/AgCl electrode was used as reference. Polypyrrolewas polymerized from a 0.01 M solution of pyrrole and LiClO4
0.1 M in acetonitrile. Electrochemical polymerization was per-formed at a deposition intensity of 3 mA. The films, grown onthe ITO electrode for 1.5 min, were 120–130 nm thick, whereasthose obtained on stainless steel electrodes for 4 h were 100 mm.Finally, the deposited PPy films were rinsed several times withwater and ethanol to remove the untreated monomer and thendried in air at room temperature. The layer of PPy was detachedfrom the steel surface and transferred onto a glass substrate formeasurement purposes.
2.4 Electrochemical reduction of polymers
The electrochemical reduction of polymer samples was carriedout in an Ivium-n-Stat: multi-channel electrochemical worksta-tion under computer control. The three electrode cell was formedby the ITO coated by the polymer (PEDOT or PPy) as the workingelectrode, the platinum grid as the counter-electrode, and theAg/AgCl electrode as the reference electrode in a 0.1 M of LiClO4
in acetonitrile solution. The polymer samples were subjected toseveral voltages vs. the Ag/AgCl reference electrode, in order todetermine the absorbance and the transport properties (electricalconductivity and Seebeck coefficient) at different reduction states.
2.5 Characterization
The thickness of the polymer films was determined using aDektak profilometer. The morphology of the polymers was deter-mined by scanning electron microscopy using a Hitachi 4800 Smicroscope at an acceleration voltage of 20 kV and at a workingdistance of 14 mm for gold-coated surfaces. Cyclic voltammetry
Paper PCCP
Ope
n A
cces
s A
rtic
le. P
ublis
hed
on 2
8 A
pril
2015
. Dow
nloa
ded
on 4
/9/2
022
4:49
:36
AM
. T
his
artic
le is
lice
nsed
und
er a
Cre
ativ
e C
omm
ons
Attr
ibut
ion
3.0
Unp
orte
d L
icen
ce.
View Article Online
15142 | Phys. Chem. Chem. Phys., 2015, 17, 15140--15145 This journal is© the Owner Societies 2015
was performed using an Ivium-n-Stat: multi-channel electro-chemical workstation under computer control. The three electrodecell was the same as that for polymerization. The films wereequilibrated at �2.0 V and �3.0 V for 2 min for PEDOT andPPy, respectively, before cyclic voltammetric measurements at20 mV s�1. The absorbance measurements were performedusing a Shimadzu UV-2501PC UV-Vis spectrophotometer from1100 to 300 nm. Thermal conductivity was determined with theaid of modulated differential scanning calorimetry (MDSC)according to the ASTM E1952-11 standard test method. Thismethod is valid to measure thermal conductivities of polymericmaterials with values within the range 0.1–1 W m�1 K�1. TheMDSC measurements were performed using DSC Q-20 TA Instru-ments calibrated with indium and sapphire. All MDSC measure-ments were carried out at 300 K under modulated conditions witha period of 80 s and a temperature amplitude of �1 K.
The electrical conductivity was determined by the van der Pauwmethod.24 A Keithley 2400 multimeter was used as a driving sourceand a voltmeter. The conductivity of the sample is obtained bysolving the van der Pauw equation:
e�pdR1s + e�pdR2s = 1, (2)
where d is the sample thickness, R1 and R2 are the resistancesbetween two different contacts, and s is the electrical conductivity.The Seebeck coefficient was determined using a home-madeapparatus composed of a Lakeshore 340 temperature controllerand a Keithley 2750 Multimeter/Switching System. The Seebeckcoefficient is obtained as the ratio of the electrical potential,DV, to the temperature difference, DT, which is:
S ¼ DVDT
: (3)
3 Results and discussion
Scanning electron microscopy (SEM) images of the PEDOT andPPy films obtained after electrochemical polymerization aredepicted in Fig. 1. The surface morphology of PEDOT (Fig. 1a)shows a homogeneous and compact surface with a certain degreeof roughness of nearly interconnected polymer chains and voids inbetween.19,25 The SEM surface image of PPy (Fig. 1b) shows typicalgranular (cauliflower) morphologies distributed over the substratesurface and densely packed.26,27 The differences between themorphology found in the SEM images can be attributed to the
different interaction between the polymers and the solvent,in our case acetonitrile.28
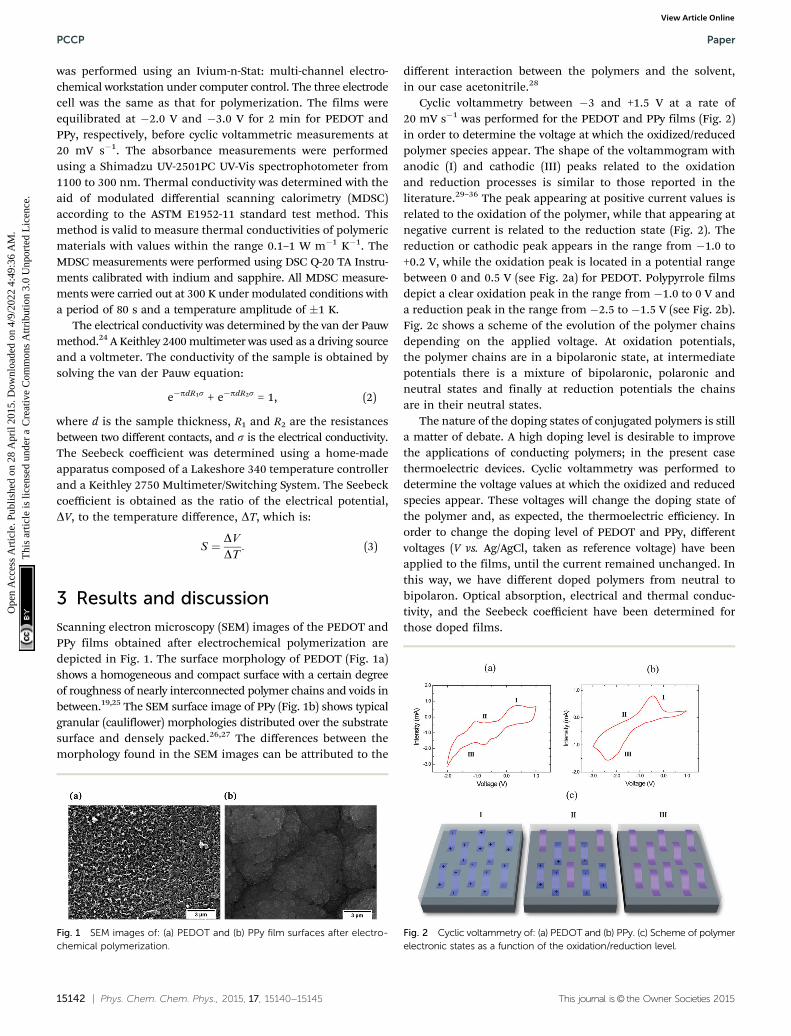
Cyclic voltammetry between �3 and +1.5 V at a rate of20 mV s�1 was performed for the PEDOT and PPy films (Fig. 2)in order to determine the voltage at which the oxidized/reducedpolymer species appear. The shape of the voltammogram withanodic (I) and cathodic (III) peaks related to the oxidationand reduction processes is similar to those reported in theliterature.29–36 The peak appearing at positive current values isrelated to the oxidation of the polymer, while that appearing atnegative current is related to the reduction state (Fig. 2). Thereduction or cathodic peak appears in the range from �1.0 to+0.2 V, while the oxidation peak is located in a potential rangebetween 0 and 0.5 V (see Fig. 2a) for PEDOT. Polypyrrole filmsdepict a clear oxidation peak in the range from �1.0 to 0 V anda reduction peak in the range from �2.5 to �1.5 V (see Fig. 2b).Fig. 2c shows a scheme of the evolution of the polymer chainsdepending on the applied voltage. At oxidation potentials,the polymer chains are in a bipolaronic state, at intermediatepotentials there is a mixture of bipolaronic, polaronic andneutral states and finally at reduction potentials the chainsare in their neutral states.
The nature of the doping states of conjugated polymers is stilla matter of debate. A high doping level is desirable to improvethe applications of conducting polymers; in the present casethermoelectric devices. Cyclic voltammetry was performed todetermine the voltage values at which the oxidized and reducedspecies appear. These voltages will change the doping state ofthe polymer and, as expected, the thermoelectric efficiency. Inorder to change the doping level of PEDOT and PPy, differentvoltages (V vs. Ag/AgCl, taken as reference voltage) have beenapplied to the films, until the current remained unchanged. Inthis way, we have different doped polymers from neutral tobipolaron. Optical absorption, electrical and thermal conduc-tivity, and the Seebeck coefficient have been determined forthose doped films.
Fig. 1 SEM images of: (a) PEDOT and (b) PPy film surfaces after electro-chemical polymerization.
Fig. 2 Cyclic voltammetry of: (a) PEDOT and (b) PPy. (c) Scheme of polymerelectronic states as a function of the oxidation/reduction level.
PCCP Paper
Ope
n A
cces
s A
rtic
le. P
ublis
hed
on 2
8 A
pril
2015
. Dow
nloa
ded
on 4
/9/2
022
4:49
:36
AM
. T
his
artic
le is
lice
nsed
und
er a
Cre
ativ
e C
omm
ons
Attr
ibut
ion
3.0
Unp
orte
d L
icen
ce.
View Article Online

This journal is© the Owner Societies 2015 Phys. Chem. Chem. Phys., 2015, 17, 15140--15145 | 15143
Ultraviolet-visible (UV-Vis) spectrochemical curves are shownin Fig. 3 for PEDOT and PPy films deposited on an indium tinoxide (ITO) coated glass. The spectra depict different bandsrelated to different oxidation states due to electrochemical dop-ing. A broad absorption band centered at 900 nm related to theoxidized PEDOT state (0.0 o V o 1.0 V) appears during thedoping process and it is related to polaron and bipolaron states.36
However, an absorption band centered at 600 nm appears in thePEDOT reduced state (V = �1.0 V), which decreases its intensityas the applied voltage increases, that is, as the polymer changesfrom a reduced to an oxidized state, related to the p–p* transi-tion.33–38 Thus, changing the doping states of the PEDOT chainsfrom bipolarons/polarons to neutral states results in changes inthe optical properties of the polymer. The colour of the polymerchanges from dark blue in the reduced state to light blue in theoxidized (bipolaron) state. Fig. 3b shows the UV-Vis spectrum ofPPy films obtained at different doping levels. The absorptionband between 500–900 nm at high applied voltages is related tothe polaronic and bipolaronic (oxidized) states of PPy.35 The bandat 300–500 nm, related to the absorption of the neutral orreduced state of PPy,35 cannot be observed since it overlaps withthe substrate signal (PET-ITO). The colour of PPy changes from
a neutral yellow form to blue-green for the fully oxidized,bipolaron state.
Fig. 4 shows the electrical conductivity, the Seebeck coeffi-cient and the power factor of PEDOT (Fig. 4a) and PPy (Fig. 4b)films as a function of the applied voltage (vs. Ag/AgCl). In bothcases, the electrical conductivity increases with the appliedvoltage or the oxidation state of the polymers. As the appliedvoltage changes from negative to positive, the polymers changefrom the reduced to the neutral and to the oxidized state, i.e. abipolaron state as corroborated by cyclic voltammetry and UV-Vismeasurements. The electrical conductivity of PEDOT changes from80 S cm�1 at�1.0 V to 766 S cm�1 at +1.0 V. These values are of thesame order of magnitude as those found in the literature. Forexample PEDOT:PSS (PEDOT:poly(styrenesulfonate)) doped withdimethyl sulfoxide (DMSO) has an electrical conductivity between500 and 1000 S cm�1.20,25,39,40 The electrical conductivity of PPyincreases from 15 S cm�1 at �2.0 V to 160 S cm�1 at +1.0 V. Thesmall depth present at 0.5 V is probably due to the existence ofsome oscillation in the oxidation process. At the highest oxida-tion level, we obtain similar values to that reported for PPy:PF6
(100–600 S cm�1),41 but higher than those obtained for PPycomposites such as PPy/MWCNTs, 70 S cm�1,42 or PPy/graphenenanosheets, 40 S cm�1.43 The opposite trend has been observedin the variation of the Seebeck coefficient (Fig. 4). The Seebeckcoefficient of PEDOT decreases from 37.0 mV K�1 at �1.0 V to9.6 mV K�1 at +1.0 V, whereas the Seebeck coefficient of PPy
Fig. 3 UV-Vis spectra of: (a) PEDOT and (b) polypyrrole as a function ofdifferent applied voltages vs. Ag/AgCl on ITO coated glass electrodepositedpolymer films.
Fig. 4 Electrical conductivity, Seebeck coefficient and power factor of(a) PEDOT and (b) PPy as a function of voltage referred to the Ag/AgClelectrode.
Paper PCCP
Ope
n A
cces
s A
rtic
le. P
ublis
hed
on 2
8 A
pril
2015
. Dow
nloa
ded
on 4
/9/2
022
4:49
:36
AM
. T
his
artic
le is
lice
nsed
und
er a
Cre
ativ
e C
omm
ons
Attr
ibut
ion
3.0
Unp
orte
d L
icen
ce.
View Article Online

15144 | Phys. Chem. Chem. Phys., 2015, 17, 15140--15145 This journal is© the Owner Societies 2015
changes from 51.0 mV K�1 at �2.0 V to 6.7 mV K�1 at +1.0 V(always referenced to the Ag/AgCl reference electrode). The valuesof S obtained for the PEDOT films are similar to those reported inref. 19. However, the values of the Seebeck coefficient obtained inthis work for PPy are the highest values ever measured.18
The PF corresponding to PEDOT and PPy has also been plottedin Fig. 4. The maximum PF is 16.3 mV K�1 m�2 for PEDOT at 0.01 V,while for the case of PPy the maximum value has been reached at�2.0 V, 3.9 mV K�1 m�2. These values are related to an intermediatepolaron structure for PEDOT and a reduced, neutral state for PPydue to the relationship between the Seebeck coefficient and theelectrical conductivity.
In order to obtain the values of ZT, thermal conductivity wasdetermined for the different samples, being independent of thedoping level of the samples. The values obtained at 300 K were0.35 � 0.02 W m�1 K�1 for PEDOT and 0.17 � 0.02 W m�1 K�1
for PPy. We have checked that the thermal conductivity does notchange with the applied voltage. Two recent papers reported asmall anisotropy in the thermal conductivity of PEDOT44,45 and acertain dependence on the electrical conductivity. The in-planethermal conductivity increases with increasing s, while theperpendicular thermal conductivity remains constant. This canbe interpreted from the configuration of the polymeric chains(the amount of chains in-plane as compared to off-plane). In avery thin film, as it is the case here, the chains remain in planeand the thermal conductivity actually corresponds to the inplane conductivity, even if we produce a pellet crashing the film.The values measured in the present work using a DSC are inagreement with previous literature results.19,21,46
The efficiency of a thermoelectric device, ZT, calculated fromeqn (1) has been plotted in Fig. 5 for the different samples. Thehighest values of ZT were 6.8 � 10�3 for PPy and 1.4 � 10�2 forPEDOT, using the values of thermal conductivity obtained fromour DSC measurements. These results are of the same orderof magnitude as other recently reported results on conductingpolymers.15,18
4 Conclusions
In conclusion, free-standing films of PEDOT and PPy with highelectrical conductivity have been prepared by electrochemical
polymerization in a three electrode cell using a Ag/AgCl refer-ence electrode. The electrical conductivity and the Seebeckcoefficient of the polymer films can be controlled by applyingdifferent potential differences to the films. The electrical con-ductivity is maximum at oxidation potentials of 0.5–1.0 V forPEDOT and 0.0–1.0 V for PPy, while the Seebeck coefficient ismaximum at reduction potentials of �1.0 V for PEDOT and�2.0 V for PPy. The maximum thermoelectric efficiency hasbeen obtained at 0.01 V for PEDOT and at �2.0 V for PPy. Theresults show a very simple method to control and optimize theZT of conducting polymers.
References
1 R. Ahiska and H. Mamur, Int. J. Renew. Energy Res., 2014, 4,128–136.
2 D.-H. Lee, J.-U. Lee, S.-J. Jung, S.-H. Baek, J.-H. Kim,D.-I. Kim, D.-B. Hyun and J.-S. Kim, J. Electron. Mater.,2014, 43, 2255–2261.
3 Y. Gelbstein and J. Davidow, Phys. Chem. Chem. Phys., 2014,16, 20120–20126.
4 T. C. Hasapis, S. N. Girard, E. Hatzikraniotis, K. M.Paraskevopoulos and M. G. Kanatzidis, J. Nano Res., 2012,17, 165–174.
5 P. H. Le, C.-N. Liao, C. W. Luo and J. Leu, J. Alloys Compd.,2014, 615, 546–552.
6 B. Poudel, Q. Hao, Y. Ma, Y. Lan, A. Minnich, B. Yu, X. Yan,D. Wang, A. Muto, D. Vashaee, X. Chen, J. Liu, M. S. Dresselhaus,G. Chen and Z. Ren, Science, 2008, 320, 634–638.
7 R. Venkatasubramanian, E. Siivola, T. Colpitts and B. O’Quinn,Nature, 2001, 413, 597–602.
8 N. Stein, N. Petermann, R. Theissmann, G. Schierning,R. Schmechel and H. Wiggers, J. Mater. Res., 2011, 26,1872–1878.
9 E. Rausch, B. Balke, S. Ouardi and C. Felser, Phys. Chem.Chem. Phys., 2014, 16, 25258–25262.
10 J. R. Salvador, J. Y. Cho, Z. Ye, J. E. Moczygemba, A. J.Thompson, J. W. Sharp, J. D. Koenig, R. Maloney, T. Thompson,J. Sakamoto, H. Wang and A. A. Wereszczak, Phys. Chem. Chem.Phys., 2014, 16, 12510–12520.
11 L. D. Hicks and M. S. Dresselhaus, Phys. Rev. B: Condens.Matter Mater. Phys., 1993, 47, 12727–12731.
12 Z. Guo, D. Lee, Y. Liu, F. Sun, A. Sliwinski, H. Gao,P. C. Burns, L. Huang and T. Luo, Phys. Chem. Chem. Phys.,2014, 16, 7764–7771.
13 R. C. Chiechi and J. C. Hummelen, ACS Macro Lett., 2012, 1,1180–1183.
14 S. K. Yee, N. E. Coates, A. Majumdar, J. J. Urban andR. A. Segalman, Phys. Chem. Chem. Phys., 2013, 15, 4024–4032.
15 M. Culebras, C. M. Gomez and A. Cantarero, Materials,2014, 7, 6701–6732.
16 Q. Wei, M. Mukaida, K. Kirihara and T. Ishida, ACS MacroLett., 2014, 3, 948–952.
17 D. Wang, W. Shi, J. Chen, J. Xi and Z. Shuai, Phys. Chem.Chem. Phys., 2012, 14, 16505–16520.
Fig. 5 ZT of PEDOT and PPy as a function of applied potential at 300 K.
PCCP Paper
Ope
n A
cces
s A
rtic
le. P
ublis
hed
on 2
8 A
pril
2015
. Dow
nloa
ded
on 4
/9/2
022
4:49
:36
AM
. T
his
artic
le is
lice
nsed
und
er a
Cre
ativ
e C
omm
ons
Attr
ibut
ion
3.0
Unp
orte
d L
icen
ce.
View Article Online

This journal is© the Owner Societies 2015 Phys. Chem. Chem. Phys., 2015, 17, 15140--15145 | 15145
18 Y. Du, S. Z. Shen, K. Cai and P. S. Casey, Prog. Polym. Sci.,2012, 37, 820–841.
19 M. Culebras, A. Cantarero and C. M. Gomez, J. Mater.Chem. A, 2014, 2, 10109–10115.
20 S. H. Lee, H. Park, S. Kim, W. Son, I. W. Cheong andJ. H. Kim, J. Mater. Chem. A, 2014, 2, 7288–7294.
21 O. Bubnova, Z. U. Khan, A. Malti, S. Braun, M. Fahlman,M. Berggren and X. Crispin, Nat. Mater., 2011, 10, 429–433.
22 T. Park, C. Park, B. Kim, H. Shin and E. Kim, Energy Environ.Sci., 2013, 6, 788–792.
23 O. Bubnova, M. Berggren and X. Crispin, J. Am. Chem. Soc.,2012, 134, 16456–16459.
24 L. J. Van Der Pauw, Philips Tech. Rev., 1958, 20, 220–224.25 J. Feng-Xing, X. Jing-Kun, L. Bao-Yang, X. Yu, H. Rong-Jin
and L. Lai-Feng, Chin. Phys. Lett., 2008, 25, 2202–2205.26 D. Ge, J. Mu, S. Huang, P. Liang, O. U. Gcilitshana, S. Ji,
V. Linkov and W. Shi, Synth. Met., 2011, 161, 166–172.27 J. V. Thombare, M. C. Rath, S. H. Han and V. J. Fulari,
J. Semicond., 2013, 34, 103002.28 E. Poverenov, M. Li, A. Bitler and M. Bendikov, Chem.
Mater., 2010, 22, 4019–4025.29 H. Randriamahazaka, J. Phys. Chem. C, 2007, 111,
4553–4560.30 A. Aydin and I. Kaya, Org. Electron., 2013, 14, 730–743.31 P. Anjaneyulu, V. Varade, C. S. S. Sangeeth, K. P. Ramesh
and R. Menon, J. Phys. D: Appl. Phys., 2014, 47, 505106.32 A. Diaz, K. Kanazawa and G. Gardini, J. Chem. Soc., Chem.
Commun., 1979, 635–636.
33 S. Garreau, G. Louarn, J. Buisson, G. Froyer and S. Lefrant,Macromolecules, 1999, 32, 6807–6812.
34 H. Ahonen, J. Lukkari and J. Kankare, Macromolecules, 2000,33, 6787–6793.
35 P. Rapta, A. Neudeck, A. Petr and L. Dunsch, J. Chem. Soc.,Faraday Trans., 1998, 94, 3625–3630.
36 S. Garreau, J. Duvail and G. Louarn, Synth. Met., 2001, 125,325–329.
37 X. Chen and O. Inganas, J. Phys. Chem., 1996, 100, 15202–15206.38 J. Wang, K. Cai and S. Shen, Org. Electron., 2015, 17, 151–158.39 G.-H. Kim, L. Shao, K. Zhang and K. P. Pipe, Nat. Mater.,
2013, 12, 719–723.40 K.-C. Chang, M.-S. Jeng, C.-C. Yang, Y.-W. Chou, S.-K. Wu,
M. A. Thomas and Y.-C. Peng, J. Electron. Mater., 2009, 38,1182–1188.
41 K. Sato, M. Yamaura, T. Hagiwara, K. Murata and M. Tokumoto,Synth. Met., 1991, 40, 35–48.
42 J. Wang, K. Cai, S. Shen and J. Yin, Synth. Met., 2014, 195,132–136.
43 S. Han, W. Zhai, G. Chen and X. Wang, RSC Adv., 2014, 4,29281–29285.
44 A. Weathers, Z. U. Khan, R. Brooke, D. Evans, M. T. Pettes,J. W. Andreasen, X. Crispin and L. Shi, Adv. Mater., 2015, 27,2101–2106.
45 J. Liu, X. Wang, D. Li, N. E. Coates, R. A. Segalman andD. G. Cahill, Macromolecules, 2015, 48, 585–591.
46 J. Wu, Y. Sun, W. B. Pei, L. Muang, W. Xu and Q. Zhang,Synth. Met., 2014, 196, 173–177.
Paper PCCP
Ope
n A
cces
s A
rtic
le. P
ublis
hed
on 2
8 A
pril
2015
. Dow
nloa
ded
on 4
/9/2
022
4:49
:36
AM
. T
his
artic
le is
lice
nsed
und
er a
Cre
ativ
e C
omm
ons
Attr
ibut
ion
3.0
Unp
orte
d L
icen
ce.
View Article Online