controls on mesopelagic particle fluxes in the sub-antarctic and
TRANSCRIPT

Deep-Sea Research II 58 (2011) 2260–2276
Contents lists available at ScienceDirect
Deep-Sea Research II
0967-06
doi:10.1
n Corr
(GLOMA
Researc
E-m
journal homepage: www.elsevier.com/locate/dsr2
Controls on mesopelagic particle fluxes in the Sub-Antarctic and PolarFrontal Zones in the Southern Ocean south of Australia insummer—Perspectives from free-drifting sediment traps
Friederike Ebersbach a,b,n, Thomas W. Trull b,c,d, Diana M. Davies b, Stephen G. Bray b
a International Graduate School for Marine Science (GLOMAR), University of Bremen, Alfred Wegener Institute for Polar and Marine Research, Am Handelshafen 12, 27570
Bremerhaven, Germanyb Antarctic Climate and Ecosystems Cooperative Research Centre, Hobart, Tasmania 7001, Australiac Centre for Australian Weather and Climate Research—A partnership of the Bureau of Meteorology and the Commonwealth Scientific and Industrial Research Organisation, Hobart,
Tasmania 7001, Australiad Institute for Marine and Antarctic Studies, University of Tasmania, Hobart, Tasmania 7001, Australia
a r t i c l e i n f o
Available online 30 May 2011
Keywords:
Sinking particles
Export flux
Mesopelagic
Southern Ocean
SAZ
PFZ
45/$ - see front matter & 2011 Elsevier Ltd. A
016/j.dsr2.2011.05.025
esponding author at: International Graduat
R), University of Bremen, Alfred Wegener In
h, Am Handelshafen 12, 27570 Bremerhaven
ail address: [email protected] (F. E
a b s t r a c t
The SAZ-Sense project examined ecosystem controls on Southern Ocean carbon export during austral
summer (January–February 2007) at three locations: P1 in the low biomass Subantarctic Zone (SAZ)
west of Tasmania, P3 in a region of elevated biomass in the SAZ east of Tasmania fuelled by enhanced
iron supply, and P2 in High-Nutrient/Low Chlorophyll (HNLC) Polar Frontal Zone (PFZ) waters south of
P1 and P3. Sinking particles were collected using (i) a cylindrical time-series (PPS3/3) trap for bulk
geochemical fluxes, (ii) indented rotating sphere (IRS) traps operated as in-situ settling columns to
determine the flux distribution across sinking-rate fractions, and (iii) cylindrical traps filled with
polyacrylamide gels to obtain intact particles for image analysis.
Particulate organic carbon (POC) flux at 150 m (PPS3/3 trap) was highest at P1, lower at P2, and
lowest at P3 (3.371.8, 2.170.9, and 0.970.4 mmol m�2 d�1, respectively). Biogenic silica (BSi) flux
was very low in the SAZ (0.270.2 and 0.0270.005 mmol m�2 d�1 at P1 and P3, respectively) and
much higher in the PFZ (2.370.5 mmol m�2 d�1 at P2). Hence, the high biomass site P3 did not exhibit
a correspondingly high flux of either POC or BSi. Separation of sinking-rate fractions with the IRS traps
(at 170 and 320 m depth) was only successful at the PFZ site P2, where a relatively uniform distribution
of flux was observed with �1/3 of the POC sinking faster than 100 m d�1 and 1/3 sinking slower than
10 m d�1.
Analysis of thousands of particles collected with the gel traps (at 140, 190, 240, and 290 m depth)
enabled us to identify 5 different categories: fluff-aggregates (low-density porous or amorphous
aggregates), faecal-aggregates (denser aggregates composed of different types of particles), cylindrical
and ovoid faecal pellets, and isolated phyto-cells (chains and single cells). Faecal-aggregates dominated
the flux at all sites, and were larger in size at P1 in comparison to P3. The PFZ site P2 differed strongly
from both SAZ sites in having a much higher abundance of diatoms and relatively small-sized faecal-
aggregates. Overall, the particle images suggest that grazing was an important influence on vertical
export at all three sites, with differences in the extents of large aggregate formation and direct diatom
export further influencing the differences among the sites.
& 2011 Elsevier Ltd. All rights reserved.
1. Introduction
The downward transfer of particulate organic carbon within thesea by biological processes, known as the biological pump, had astrong influence in maintaining low pre-industrial atmospheric CO2
ll rights reserved.
e School for Marine Science
stitute for Polar and Marine
, Germany.
bersbach).
levels (Volk and Hoffert, 1985). Its response to industrial CO2
emissions is uncertain, and is expected to be relatively moderate,but merits consideration in assessing the magnitude of emissionsreductions required for stabilisation of atmospheric CO2 (Sarmientoand Le Quere, 1996; Matear and Hirst, 1999; Falkowski et al., 2000).The overall strength of the biological pump can be thought of asconsisting of three steps: (i) primary production of organic matter byphotosynthesis, (ii) export of a fraction of this production from theeuphotic zone as sinking particles, and (iii) attenuation of this sinkingflux by mesopelagic processes that limit the depth to which it is

Fig. 1. Map of SAZ-Sense cruise track and station locations, superimposed on the
surface chlorophyll distribution (MERIS ocean colour 1-km resolution composite
image for 5–11 February 2007 courtesy of the Plymouth Marine Laboratory
Remote Sensing Group; colour-scale is logarithmic from 0.01 to 60 mg Chl a L�1).
Process Station P1, west of Tasmania in low-biomass Subantarctic waters was
visited first, followed by P2 in the Polar Frontal Zone, and finally P3 in the high
biomass SAZ east of Tasmania. Each Process Station was occupied for approxi-
mately 6 d. The image corresponds to the time of the transect from P2 to P3.
F. Ebersbach et al. / Deep-Sea Research II 58 (2011) 2260–2276 2261
transferred and thus the duration over which it remains isolated fromthe atmosphere. Each of these steps exhibits similar variance and thushas similar potential importance in the control of the pump efficiency(Boyd and Trull, 2007; Kwon et al., 2009), but the factors controllingthese steps are still under debate (Boyd and Trull, 2007; Buesseler andBoyd, 2009).
Attempts to predict the organic carbon export flux from primaryproduction or phytoplankton biomass accumulation have not beenvery successful, because primary and export production are oftendecoupled by other aspects of ecosystem structure (e.g. Bishop,1989; Buesseler, 1991; Boyd and Newton, 1995, 1999; Buesseler andBoyd, 2009). Of particular interest is determining the conditionsunder which phytoplankton can be directly exported via physicalflocculation and sinking, without passing through higher trophiclevels that engender respiration losses of POC (Michaels and Silver,1988; Alldredge and Jackson, 1995; Turner, 2002).
Globally distributed deep ocean sediment trap programs haverevealed some of the factors that correlate with high POC flux,including the presence of ballast minerals (primarily autochtho-nous biogenic carbonates and silica, and secondarily allochtho-nous lithogenic particles) and the occurrence of strong seasonality(Lampitt and Antia, 1997; Armstrong et al., 2002; Francois et al.,2002; Klaas and Archer, 2002; Lutz et al., 2002, 2007). Howeverthe importance of minerals is less clear at mesopelagic depths,where POC dominates particle contents to a much greater degree,particle size, and porosity are strong influences on sinking rates(Alldredge and Gotschalk, 1988; Alldredge, 1998; Passow, 2004;Stemmann et al., 2004; De La Rocha and Passow, 2007), andwhere the vast majority of flux attenuation occurs (Martin et al.,1987; Buesseler et al., 2007a).
In this context of uncertainty regarding the controls on particleexport and attenuation, particularly at mesopelagic depths,methods that directly examine the forms and compositions ofsinking particles are useful. In this study, we used three differenttypes of mesopelagic free-drifting sediment traps to determine (i)POC and mineral ballast fluxes, (ii) particle sinking rates, and (iii)particle sizes and shapes. These methods let us examine severalcurrently debated aspects of the controls on POC flux, includingthe roles of phytoplankton flocs, zooplankton faecal pellets,ballast minerals, and particle aggregation processes.
2. Material and methods
2.1. Study area
The SAZ-Sense study took place in the Australian sector of theSouthern Ocean and was carried out during midsummer (17January–20 February 2007). Three process stations were studiedin detail: P1 in the SAZ west of Tasmania, P3 in the SAZ east ofTasmania and P2 in the PFZ further south (Fig. 1), with a muchmore limited set of measurements carried out at interveningtransect stations (see Bowie et al., 2011, for an overview). Thispaper focuses exclusively on the process stations, which wereeach occupied for approximately 6 d. Sites P1 and P2 have beenexamined previously, including a process study (overview byTrull et al., 2001a), but this was the first process study at P3.
Site P1 is representative of a large proportion of the circum-polar SAZ, in terms of exhibiting iron limitation, seasonally lowsilicate levels, non-limiting nitrate and phosphate levels, low tomoderate biomass throughout much of the year, and a mixedphytoplankton community that includes cyanobacteria, cocco-lithophores, small diatoms, and flagellates (Sedwick et al., 1999,2008; Trull et al., 2001b; Rintoul and Trull, 2001; Wang et al.,2003). Site P2 is also representative of circumpolar conditionsfor the PFZ. It has very low dissolved iron levels, non-limiting
macro-nutrient concentrations year-round, lower biomass with apronounced summer maximum, and a phytoplankton communitydominated by diatoms. These differences in surface water com-munities are also reflected in the composition of sinking particlesreaching the deep sea, with carbonates dominating sediment trapcollections at P1 and silica dominating P2 (Trull et al., 2001b).
Site P3 differs from the circumpolar conditions that prevailat P1 and P2, in that it receives inputs of southward flowingoligotrophic waters from eddies generated by the East AustralianCurrent—an influence that has been increasing strongly in recentdecades (Hill et al., 2008). Increased iron supply is observed inthis region of the SAZ (Bowie et al., 2009), as are surface biomasslevels as observed by satellite remote sensing (Mongin et al.,2011). Thus, this site offers the opportunity to observe theresponse of export to natural iron inputs to the SubantarcticZone, which can be compared to other Southern Ocean naturaliron fertilisation studies such as CROZEX (Pollard et al., 2007) andKEOPS (Blain et al., 2007).
In the absence of sustained observations, the main indication ofthe seasonal context of the SAZ-Sense study comes from satelliteobservations. Ocean colour observations show the development ofseasonal blooms with biomass accumulation starting in December2006 at P1 and P2, and in February 2007 at P3 (Mongin et al.,2011). Based on those satellite ocean colour observations, thebloom at P3 was still growing, while the peak at P1 was alreadyover and at P2 the bloom was strongly declining. Prior to the cruise,surface Chl a levels based on SeaWiFS images were highest at P3,
F. Ebersbach et al. / Deep-Sea Research II 58 (2011) 2260–22762262
somewhat lower at P1 and lowest at P2 (�0.4, �0.3, and�0.25 mg m�3, respectively; Mongin et al., 2011).
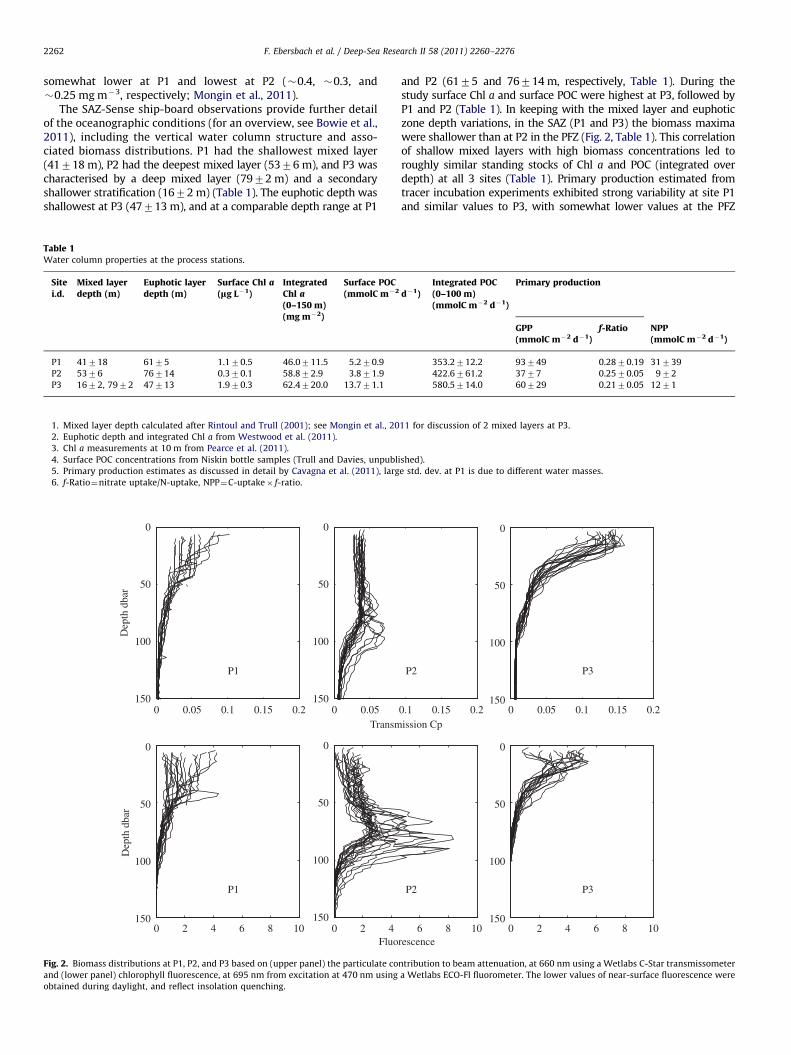
The SAZ-Sense ship-board observations provide further detailof the oceanographic conditions (for an overview, see Bowie et al.,2011), including the vertical water column structure and asso-ciated biomass distributions. P1 had the shallowest mixed layer(41718 m), P2 had the deepest mixed layer (5376 m), and P3 wascharacterised by a deep mixed layer (7972 m) and a secondaryshallower stratification (1672 m) (Table 1). The euphotic depth wasshallowest at P3 (47713 m), and at a comparable depth range at P1
Table 1Water column properties at the process stations.
Sitei.d.
Mixed layerdepth (m)
Euphotic layerdepth (m)
Surface Chl a(lg L�1)
IntegratedChl a(0–150 m)(mg m�2)
Surface POC(mmolC m�2
P1 41718 6175 1.170.5 46.0711.5 5.270.9
P2 5376 76714 0.370.1 58.872.9 3.871.9
P3 1672, 7972 47713 1.970.3 62.4720.0 13.771.1
1. Mixed layer depth calculated after Rintoul and Trull (2001); see Mongin et al., 20
2. Euphotic depth and integrated Chl a from Westwood et al. (2011).
3. Chl a measurements at 10 m from Pearce et al. (2011).
4. Surface POC concentrations from Niskin bottle samples (Trull and Davies, unpubl
5. Primary production estimates as discussed in detail by Cavagna et al. (2011), larg
6. f-Ratio¼nitrate uptake/N-uptake, NPP¼C-uptake� f-ratio.
0 0.05 0.1 0.15 0.2
0
50
100
150
Dep
th d
bar
P1
0 0.05
0
50
100
150
Transm
0 2 4 6 8 10
0
50
100
150
Dep
th d
bar
P1
0 2 4
0
50
100
150
Fluo
Fig. 2. Biomass distributions at P1, P2, and P3 based on (upper panel) the particulate co
and (lower panel) chlorophyll fluorescence, at 695 nm from excitation at 470 nm using
obtained during daylight, and reflect insolation quenching.
and P2 (6175 and 76714 m, respectively, Table 1). During thestudy surface Chl a and surface POC were highest at P3, followed byP1 and P2 (Table 1). In keeping with the mixed layer and euphoticzone depth variations, in the SAZ (P1 and P3) the biomass maximawere shallower than at P2 in the PFZ (Fig. 2, Table 1). This correlationof shallow mixed layers with high biomass concentrations led toroughly similar standing stocks of Chl a and POC (integrated overdepth) at all 3 sites (Table 1). Primary production estimated fromtracer incubation experiments exhibited strong variability at site P1and similar values to P3, with somewhat lower values at the PFZ
d�1)Integrated POC(0–100 m)(mmolC m�2 d�1)
Primary production
GPP(mmolC m�2 d�1)
f-Ratio NPP(mmolC m�2 d�1)
353.2712.2 93749 0.2870.19 31739
422.6761.2 3777 0.2570.05 972
580.5714.0 60729 0.2170.05 1271
11 for discussion of 2 mixed layers at P3.
ished).
e std. dev. at P1 is due to different water masses.
0.1 0.15 0.2ission Cp
P2
0 0.05 0.1 0.15 0.2
0
50
100
150
P3
6 8 10rescence
P2
0 2 4 6 8 10
0
50
100
150
P3
ntribution to beam attenuation, at 660 nm using a Wetlabs C-Star transmissometer
a Wetlabs ECO-Fl fluorometer. The lower values of near-surface fluorescence were

F. Ebersbach et al. / Deep-Sea Research II 58 (2011) 2260–2276 2263
site P2 (Table 1). Low f-ratios (o0.3) at all stations indicate thatregenerated production dominated over new production (Cavagnaet al., 2011, Table 1). Similarly, net community production estimatesfrom O2/Ar supersaturations indicated higher values in the SAZ thanthe PFZ (Cassar et al., 2011).
There was some evidence for varying bottom-up controls onphytoplankton production among the three sites. At all three processstations mixed layer nitrate and phosphate were sufficient to notlimit phytoplankton growth (nitrate: 5.5, 24.3, and 5.0 mM, phos-phate: 0.22, 1.58, and 0.52 mM, at P1, P2, and P3, respectively) butsilicate concentrations were low enough to affect diatom growth(0.29, 0.77, and 0.71 mM, at P1, P2, and P3, respectively, Bowie et al.,2011). At P1, Fv/Fm values were low (o0.5, Cheah et al., 2011; Petrouet al., 2011), and primary production was likely to have been limitedby Fe, and possibly also silicic acid. At P2, Fv/Fm values were higher(0.58), but iron/phosphate ratios were suggestive of iron limitation(Lannuzel et al., 2011), and the deep mixed layer suggestive of lightlimitation (Doblin et al., 2011). At P3, there was no indication of Felimitation from iron/phosphate ratios or Fv/Fm values (0.58; Cheahet al., 2011; Lannuzel et al., 2011; Petrou et al., 2011).
Plankton communities also differed among the three sites inseveral ways. In the SAZ (P1 and P3) the biomass generally consistedof non-diatoms (de Salas et al., 2011), although at P1 besidenanoflagellates a lightly silicified Thalassiosira sp. was also abundant.P3 was dominated by cyanobacteria and heterotrophic dinoflagellates(de Salas et al., 2011). At the PFZ site P2 a deep chlorophyll maximumoccurred just below the euphotic depth but above the mixed layer(compare Table 1, Fig. 2 and Westwood et al., 2011) and wascharacterised mainly of heavily silicified diatoms and nanoflagellates(de Salas et al., 2011). Bacterial and viral abundances were higher inthe SAZ than the PFZ and highest at P3 (Evans et al., 2011). Therewere no mesozooplankton population studies carried out during SAZ-Sense, but grazing clearance rates from deckboard incubationssuggest high micro-zooplankton grazing pressure, sufficient toremove 82%, 67%, and 42% of primary production at P1, P3, and P2,respectively (Pearce et al., 2011).
2.2. Collection of sinking particles using free-drifting sediment traps
Three types of sediment traps were deployed, on separatearrays, as shown in Table 2. All three arrays were similar in theiroverall design and consisted of a surface float beneath which the
Table 2Deployment schedules for the free-drifting sediment trap arrays.
Site Array Trap depths (m) Event Time (UTC)
P1 Gel traps 140, 190, 240, 290 Deploy 22-Jan-07 04
Recover 23-Jan-07 06
PPS3/3 trap 150 Deploy 22-Jan-07 00
Recover 28-Jan-07 21
IRS traps 170, 320 Technical problems
Precluded deployment
P2 Gel traps 140, 190, 240, 290 Deploy 31-Jan-07 16
Recover 1-Feb-07 19:
PPS3/3 trap 150 Deploy 31-Jan-07 14
Recover 5-Feb-07 22:
IRS traps 170, 320 Deploy 31-Jan-07 19
Recover 6-Feb-04 04:
P3 Gel traps 140, 190, 240, 290 Deploy 10-Feb-07 23
Recover 11-Feb-07 22
PPS3/3 trap 150 Deploy 10-Feb-07 20
Recover 16-Feb-07 23
IRS traps 170, 320 Deploy 10-Feb-07 21
Recover 16-Feb-07 15
1. Trap depths were constant within the 4 m depth and 50 time resolutions of the sens
respective traps were suspended by an elastic link that dampenswave motions. Details of the array design and evidence of its abilityto isolate wave motions during rough weather are available byTrull et al. (2008), although the SAZ-Sense deployments differedslightly by not including drogues at depth, because the trapsthemselves act in this capacity. Weather conditions for the P1and P2 deployments were rough, although more benign at P3.Pressure sensors mounted on the deepest trap on each arrayindicated that the traps remained at fixed depth, within the�4 m, 5 min resolution of the pressure sensor records. Drift ofthe traps was slow (o10 cm s�1) at P1 and P3 in the SAZ, andhigher at P2 in the Antarctic Circumpolar Current (up to23 cm s�1). These drift rates were similar to water velocitiesestimated from the shipboard acoustic Doppler current metre,and suggest very low water velocities relative to the traps (of theorder of a few cm s�1), and thus large hydrodynamic artefacts inthe particle collections were not expected (Buesseler et al., 2007b).
To obtain bulk component fluxes (particulate organic carbon,biogenic silica, and biogenic carbonates), we deployed at eachstation a single cylindrical trap with an internal conical funnel atits base (Technicap, La Turbie, France, model PPS3/3) at 150 mdepth with a collection area of 0.125 m2 that collected samplesinto a carousel of 12 cups over a period of 6 d. All cups were filledwith brine with salinity of �52 psu, made by freezing filtered(0.2 mm pore size) surface seawater. Some cups were also pre-served with mercuric chloride (1 g L�1) as a biocide (Table 3).Most cups were analysed for component fluxes, with some cupsused separately for trace metal studies (no poison added).
To estimate particle sinking rates, we deployed at each stationtwo indented rotating sphere (IRS) traps (described in detail byPeterson et al., 2005, 2009; Trull et al., 2008) at 170 and 320 mdepth on a second separate array. The IRS traps (Prime Focus, Inc.Seattle, WA, USA), have cylindrical tubes (0.018 m2 collectionarea) that collect particles onto dimpled spheres, which thenrotate to transfer the particles into a settling tube for separationinto 11 fractions based on their sinking velocities (as shown inTable 4). The sum of these fractions also provides a measurementof the total flux. The IRS traps collected particles for a total of 5 d.As in previous deployments, we programmed the IRS traps tocollect the 11th sample in a way that checks the functioning ofthe trap (Trull et al., 2008), and filled the cups with the same brineand mercuric chloride concentrations as for the PPS3/3 trap.
Latitude Longitude Duration (d) Drift (km)
:30 46120.500S 140134.600E 1.08 13
:29 46127.350S 140132.230E
:57 46125.380S 140129.670E 6.34 22
:15 46136.800S 140125.650E
:15 54159.900S 145156.900E 1.14 16
37 54103.450S 146110.440E
:48 54100.030S 145158.050E 6.13 121
40 54134.960S 147132.940E
:33 53159.850S 145154.500E 5.75 93
24 541 26.600S 147106.620E
:26 45132.100S 153111.480E 0.97 9
:45 45129.440S 153117.520E
:01 45129.990S 153111.940E 6.06 49
:39 45124.520S 153148.820E
:41 45131.040S 153111.870E 5.89 47
:21 45135.340S 153147.090E
or on the deepest trap on each array.

Table 3Particle fluxes at 150 m depth from the 6-d free-drifting deployments of the 12-cup-carousel cylindrical PPS3/3-trap.
Cupi.d. no.
Cupopeningdate
Cupopeningtime
Cup durationhours
Cuppoisontype
POC flux percup
PON flux percup
BSi flux percup
PIC flux percup
POC/PONratio
POC/BSiratio
POC/PICratio
lmol m�2 d�1 lmol m�2 d�1 lmol m�2 d�1 lmol m�2 d�1 mol/mol mol/mol mol/mol
P 13 23 Jan 07:00 12 None 1921 269 141 109 7.1 14 18
4 23 Jan 19:00 12 None 2589 380 108 138 6.8 24 19
5 24 Jan 07:00 12 Merc.
chlor.
1842 301 98 80 6.1 19 23
6 24 Jan 19:00 12 Merc.
chlor.
1648 227 56 95 7.3 29 17
9 26 Jan 07:00 12 None 4201 603 267 410 7.0 16 10
10 26 Jan 19:00 12 None 6145 959 662 1318 6.4 9 5
11 27 Jan 07:00 12 Merc.
chlor.
2587 382 169 301 6.8 15 9
12 27 Jan 19:00 12 Merc.
chlor.
5777 2219 128 423 2.6 45 14
Mean 3339 667 204 359 5.0 16 9Std. dev. 1805 671 196 412 1.5 11 6
P 23 23 Jan 07:00 12 None 2385 378 3154 360 6.3 0.76 7
4 23 Jan 19:00 12 None 1897 281 1945 165 6.7 0.98 11
5 24 Jan 07:00 12 Merc.
chlor.
1238 187 2220 223 6.6 0.56 6
6 24 Jan 19:00 12 Merc.
chlor.
1765 253 2516 260 7.0 0.70 7
9 26 Jan 07:00 12 None 3751 535 1866 436 7.0 2.01 9
10 26 Jan 19:00 12 Merc.
chlor.
1649 240 2299 266 6.9 0.72 6
Mean 2114 312 2333 285 6.8 0.91 7Std. dev. 884 126 467 98 0.3 0.53 2
P 33 23 Jan 07:00 12 Merc.
chlor.
1708 296 25 105 5.8 69 16
4 23 Jan 19:00 12 Merc.
chlor.
685 132 18 44 5.2 39 15
5 24 Jan 07:00 12 None 553 86 14 23 6.4 40 24
6 24 Jan 19:00 12 None 680 119 13 43 5.7 52 16
9 26 Jan 07:00 12 Merc.
chlor.
880 127 19 43 6.9 47 20
10 26 Jan 19:00 12 Merc.
chlor.
688 104 11 44 6.6 61 15
11 27 Jan 07:00 12 None 1073 153 13 65 7.0 81 16
12 27 Jan 19:00 12 None 594 86 11 33 6.9 53 18
Mean 858 138 15 50 6.2 55 17Std. dev. 382 68 5 25 1 14 3
1. Times are UTC, local time was UTCþ11 h, and thus cups ran dusk to dawn (18:00–06:00) and dawn to dusk (06:00–18:00) daily.
2. Particles were washed through a 350 mm screen to remove zooplankton and collected on a 1 mm silver filter.
3. Trace metal fluxes were measured in cup nos. 1, 2, 7, and 8 for each trap, respectively, and additionally in cups 11 and 12 at P2 and are reported by Bowie et al. (2009).
F. Ebersbach et al. / Deep-Sea Research II 58 (2011) 2260–22762264
To collect intact particles for optical examination of their sizesand shapes, we deployed four individual cylindrical polyacryla-mide gel traps. The gel traps had a collection area of 0.011 m2 andwere deployed along a third separate array at each station at 140,190, 240, and 290 m depths. To avoid overloading the gels withparticles, these deployments were limited to a single day, duringthe first day of the deployments of the PPS3/3 and IRS traps. Thepreparation of the polyacrylamide traps and subsequent proces-sing has been previously described (Ebersbach and Trull, 2008).
2.3. Sample analyses
2.3.1. Chemical analysis
The PPS3/3 trap samples were washed through a 350 mmscreen to remove zooplankton, using 0.8 mm pore size GF/Ffiltered seawater, and the fraction passing the screen wascollected by low vacuum filtration onto 25 mm diameter 1 mm
pore size silver membrane filters (Sterlitech, Concord, MA, USA).The IRS trap samples were filtered in the same way withoutprevious screening (the IRS ball greatly reduces swimmer con-tamination), although swimmers (zooplankton) were subse-quently removed from the filters using forceps. For both the IRSand PPS3/3 trap samples, the filters (after being dried in a cleanoven at 60 1C) were sub-sampled in a flow-bench with a 5 mmdiameter pre-cleaned stainless steel punch to provide aliquots forbiogenic silica by alkaline digestion and spectrometry. The PPS3/3trap sample filters were then punched for POC and PON analysesby catalytic combustion elemental analysis after de-carbonation(20 mL of 2 M HCl followed by drying at 60 1C for 48 h) and theremainder of the filter was used for PIC determination byacidification in a closed module and coulometric CO2 titration.The IRS trap filters were encapsulated and de-carbonated with nofurther sub-sampling before elemental analysis because of thevery small amount of material collected. Methods are detailed by

Table 4Particle fluxes separated by sinking rate from the 5-d free-drifting deployments of the IRS traps at 170 and 320 m depth.
Trapdepth
Cup i.d.no.
Sinkingrate
Cupduration
POC flux percup
POC flux per cupduration
POC fluxfraction
POC fluxcumulative
corr-POC fluxfraction
corr-POC fluxcumulative
BSi flux percup
BSi flux per cupduration
BSi fluxfraction
BSi fluxcumulative
POC/BSiratio
m m d�1 min lmol m�2 d�1 lmol m�2 d�1 min�1 % % % % lmol m�2 d�1 lmol m�2 d�1 min�1 % % mol/mol
P2 Begin collection 31-Jan-07 21:00 End collection 4-Feb-07 21:00
170 m 1 4850 1 54 54 3 3 0 0 14 14 1 1 4.02 410 1 318 318 17 20 21 21 372 372 27 28 0.93 205 2 106 53 6 26 4 26 40 20 3 30 2.74 137 2 85 42 5 31 3 29 39 20 3 33 2.25 102 2 85 42 5 35 3 31 34 17 2 36 2.56 51 8 108 13 6 41 5 36 96 12 7 43 1.17 26 16 188 12 10 52 11 47 151 9.4 11 53 1.28 13 32 176 5.5 10 61 10 57 158 4.9 11 65 1.19 6 64 152 2.4 8 70 8 65 115 1.8 8 73 1.310 2.3 231 504 2.2 28 97 35 100 377 1.6 27 100 1.311 2.3 1 49 49 3 100 0 100 1 0.7 0 100 74Total 1826 1395 1.3
320 m 1 4850 1 77 77 7 7 4 4 3 2.8 0 0 282 410 1 106 106 9 16 10 13 36 36 6 6 3.03 205 2 138 69 12 28 16 29 68 34 11 18 2.04 137 2 76 38 7 35 4 33 18 9.1 3 21 4.25 102 2 94 47 8 43 7 40 40 20 7 27 2.36 51 8 93 12 8 51 7 47 87 11 14 42 1.17 26 16 118 7.4 10 61 12 59 57 3.5 9 51 2.18 13 32 85 2.7 7 69 5 64 57 1.8 9 60 1.59 6 64 128 2.0 11 80 14 78 68 1.1 11 72 1.910 2.3 231 170 0.7 15 95 22 100 166 0.7 27 99 1.011 2.3 1 58 58 5 100 0 100 7 6.6 1 100 8.7Total 1144 607 1.9
P3 Begin collection 10-Feb-07 23:00 End collection 15-Feb-07 23:00
170 m 1–11 42.3 360 864 2.4 100 100 11 0.03 100 100 76Total 864 11 76
320 m 1 4850 1 95 95 51 51 o1 o1 0 0 4952–11 2.3–850 359 90 0.3 49 100 5 0.01 100 100 20Total 185 5 37
1. Times are UTC, local time was UTCþ11 h.
2. All particles were collected on 1 mm silver filters, and the very few zooplankton present in a few fractions were removed manually.
3. Corr-POC flux and corr-POC cumulative flux are values corrected for possible carry-over of slow-sinking particles from one IRS cycle to the next—see Section 4.
F.E
bersb
ach
eta
l./
Deep
-SeaR
esearch
II5
8(2
01
1)
22
60
–2
27
62
26
5

F. Ebersbach et al. / Deep-Sea Research II 58 (2011) 2260–22762266
Trull et al. (2008). Sub-sampling introduces variability of 10–20%from inhomogeneous filter coverage that well exceeds the analy-tical uncertainties of these methods (Trull et al., 2008).
2.3.2. Particle properties from the polyacrylamide gels
Immediately after recovery, the gel cups were removed fromthe tubes. Within a few hours of recovery the gels were photo-graphed under low magnification (6.5–50) against an etched-glass grid of 36 cells (12.5�14 mm each). Gels were stored at 2 1Cuntil further investigations in the laboratory onshore. The lowmagnification images were processed using image analysis soft-ware to obtain statistics of particle abundances and forms(Ebersbach and Trull, 2008). We divided the particles into5 classes of particles: fluff-aggregates, faecal-aggregates, phyto-cells, cylindrical faecal pellets, and ovoid faecal pellets(see Table 5, Fig. 3). Assuming that particles were more or lessevenly distributed over the gel surface, 10 grid cells per gel were
Table 5Particle categories based on microscopic observations of the polyacrylamide gels.
Category Appearance
Aggregates
Fluff-aggregate (flu) Amorphous shapes, fluffy, br
Faecal-aggregate (fae) Composed of distinctly shap
faecal pellets. Brownish in c
Phytoplankton cells
phyto-cell (phy) Diatom chains or individual
Faecal pellets
cylindrical pellet (cyl) Intact cylindrically formed f
Ovoid pellet (ovo) Intact faecal pellet of oval fr
Fig. 3. Particle categories as defined from photo-microscopy of particles collected by th
aggregates (b, g, and m) cylindrical faecal pellets (a, f, and j), ovoid faecal pellets (e, h, a
(k) or feeding-structures (large particles in c), the faecal-aggregates appear to be comp
similar to a pellet (upper left particle in g) or they can be made of somewhat more deg
likely to originate from euphausiids (a and left pellet in j), whereas the smaller pellets pr
pellets show two size classes, the larger pellets (i and left pellet in e) versus the smaller o
analysed (16.8 cm2, which corresponds to one fifth of the collec-tion area) and projected to the gel area.
To allow size comparisons for particles of different shapes, wecalculated equivalent spherical diameters (esd) from the observedareas (esd¼2(area/p)0.5). We set a minimum particle size for analysisof 0.001 mm2 (36 mm esd), because few particles were smaller thanthis, and because this ensured that gel thickness and refractive indexvariations were not mis-interpreted as ‘particles’. For each particletype, volumes were estimated from the imaged areas using thegeometric approximations given by Ebersbach and Trull (2008), i.e.aggregates and phyto-cells were regarded as spheres, cylindricalpellets as cylinders, and ovoid pellets as ellipsoids.
To convert volume flux into carbon flux, we adopted carboncontents of 0.057 mg C mm�3 for faecal pellets (Gonzalez andSmetacek, 1994), and applied the parameterisation for carbonconversion factors used in our previous work (Ebersbach andTrull, 2008). That formulation is based on the fractal decrease ofcarbon contents with size observed for large coastal marine snow
Size range (mm3)
ownish in colour 1–5400
ed smaller particles, especially
olour
0.07–1000
diatom cells 0.07–1
aecal pellet, brown colour 0.04–1600
om, dark brown/black 0.06–100
e 24 h deployments of the free-drifting gel traps: Fluff-aggregates (c and k), faecal-
nd i), and phyto-cells (d and l). While the fluff-aggregates resemble phyto-detritus
osed of relatively compact material (b), and sometimes even have distinct shapes
raded faecal material (upper particle in m). The large cylindrical faecal pellets are
esumably are of copepod origin (f, and upper and right pellet in j). The ovoid faecal
nes (h and right pellet in e). Phyto-cells are in general the smallest particles found.

F. Ebersbach et al. / Deep-Sea Research II 58 (2011) 2260–2276 2267
aggregates (Alldredge, 1998), but scaled to match up with solidgeometry estimates for phytoplankton at lower sizes, where extra-polation of the large aggregate results would yield unrealisticallyhigh carbon contents. This scaled coastal aggregate relationshipyields values ranging from 0.014 mg C mm�3 for small aggrega-tes (0.004 mm3) to 0.0015 mg C mm�3 for very large aggregates(10 mm3). Because the phyto-cells were mostly provided by diatomswe used a power-law relation compiled for extant diatoms:log10 C¼ log10 aþb log10 V (with C¼carbon content in mg per celland V¼cell volume in mm3, estimated from images (see above)),with log10 a¼�0.541 and b¼0.881 (Menden-Deuer and Lessard,2000). This results in carbon contents that range from 0.035 to0.016 mg C mm�3 for our smallest (36 mm esd) to largest (300 mmesd) diatoms. For comparison we also calculated POC fluxes using anew algorithm based on correlating suspended particle sizedistributions with deep ocean sediment trap fluxes (Guidi et al.,2008). The correlation reflects the combined influence of particlesize on POC content and on sinking rate, and separating out thesinking rate dependence leads to a POC content as a function of sizethat can be applied to our gel trap particles (POC¼0.38 esd2.55 with
Fig. 4. Images of the gels (grid cells: 12.5�14 mm) from the gel traps showing the dif
station P1; images C and D from station P3) and the PFZ station at bottom (images E an
to small particles in the PFZ (E, F) is clear. Particle variations with depth were complex
trap at each station, as shown here from left to right (images A, C, E from 140 m; ima
POC in mg m�3 for esd in mm). This yields slightly lower POC fluxesat P1 and P2, and slightly higher estimates at P3 than our algorithm,but does not change the relative values of the fluxes among thethree process stations.
3. Results
3.1. Geochemical fluxes from the PPS3/3 and IRS traps
3.1.1. Flux magnitudes
POC fluxes at 150 m depth collected by the PPS3/3 trap were approximately
3000, 2000, and 1000 mmol m�2 d�1 at process stations P1, P2, and P3, respec-
tively (Table 3). At each station, the POC flux varied by a factor of 3 across the
individual 12-h samples. This variability was not correlated with the time of
collection (day versus night), or with the presence or absence of poison in the trap
cups. All the flux samples had POC/PON ratios close to the canonical Redfield ratio
for phytoplankton of 6.6, with the exception of sample 12 from process station P1
with a POC/PON of 2.6 despite displaying no conspicuous difference in its
macroscopic character. PIC fluxes were about one magnitude lower than POC
fluxes and decreased more strongly from P1 to P3 whereby the POC/PIC ratio at P3
was twice as high as at P1 and P2 (Table 3).
ference among the sites. The SAZ stations are shown at top (images A and B from
d F from station P2). The dominance of larger particles in the SAZ (A–D) in contrast
(see text), but abundance generally decreased from the shallowest to the deepest
ges B, D, F from 290 m).

F. Ebersbach et al. / Deep-Sea Research II 58 (2011) 2260–22762268
Biogenic silica fluxes varied more strongly between stations than those of POC,
with the highest flux occurring in the PFZ (averaging ca. 2000 mmol Si m�2 d�1 at
P2), much lower fluxes in the western SAZ and lowest values in the eastern SAZ
(less than one-tenth and one-hundredth of the PFZ flux at P1 and P3, respectively).
The high BSi flux at P2 was not accompanied by high POC, and this site exhibited
the lowest, POC/BSi ratio (Table 3). The low surface silicate at all sites (Cavagna
et al., 2011) together with high BSi fluxes at P2 underline the importance of
silicate and therefore diatoms for export controls at the PFZ-site. In contrast, the
low BSi fluxes and high POC/BSi ratios at the SAZ-sites P1 and P3 suggests that
diatoms were not important for POC flux in the SAZ, where CaCO3 dominated
biogenic mineral fluxes (Table 3). As for POC, BSi fluxes among the individual cups
varied strongly, �2-fold at P2 and P3, and more than 10-fold at P1, and no
correlations of BSi flux with time of collection or use of poison were evident.
The IRS trap total fluxes (obtained by summing all sinking-rate fractions,
Table 4) gave similar POC and BSi fluxes at 170 m depth to those obtained with the
much larger diameter PPS3/3 trap at 150 m depth. This provides considerable
encouragement that the fluxes were not strongly biased by flow past the traps,
because this hydrodynamic bias is thought to vary strongly with trap diameter
(Gust and Kozerski, 2000). It also suggests that potential biases from zooplankton
entering the traps were accounted for, given that sieving of zooplankton from the
poisoned and unpoisoned PPS3/3 trap cups gave similar results to the IRS trap in
which zooplankton were excluded by the indented rotating sphere and direct
removal using forceps.
3.1.2. Fluxes as a function of sinking rates from the IRS traps
Technical problems precluded deployment of the IRS traps at P1, and the low
flux at P3 only allowed estimation of the total flux by combining the fractions
(Table 4). Thus, separation of the particle flux into different sinking-rate fractions
was only possible at P2, where sufficient material was obtained in all 11 sinking
rate fractions to allow analysis of POC and BSi for both the 170 and 320 m depth
traps (but not PON or PIC, Table 4). These data suggest that the POC (and BSi) flux
was relatively evenly spread across the full range of sinking-rate fractions (with
each containing 11% or less of the flux), but with somewhat higher fluxes in two
fractions—a relatively fast sinking fraction (the 410–850 m d�1 fraction in the
170 m trap, and the 205–410 m d�1 fraction in the 320 m trap) and a relatively
slow sinking fraction (the 2.3–26 m d�1 fraction at both depths). For the 170 m
depth trap, this fast fraction contained 17% of the POC flux, and the slow fraction
28% of the POC flux. For the 320 m depth trap, the respective contributions were
somewhat smaller (12% and 15%, respectively), but still stood out as the two
largest fractions.
Fig. 5. Detailed photos of individual particles collected with the gel traps are reflect
particles, while in the PFZ (lower panel) phyto-cells and small aggregates are more abu
and cylindrical faecal pellet, degrading cylindrical faecal pellet and faecal-aggregate. PF
and small fluff-aggregates and fluffy faecal-aggregates (lower left image). Scale bar for
3.2. Particle characteristics from the gel traps
3.2.1. Classification of sinking particles
The single day deployments of the gels yielded even coverage of particles
across the gel surfaces, and sparse, well separated particle distributions optimal
for image analysis. Different particle types were identifiable (Fig. 3, Table 5),
including diatoms (mainly as chains but also a few individual cells), intact faecal
pellets, and aggregates of these and other more amorphous materials. Within the
faecal pellets cylindrical and ovoid pellets were distinguished. A wide range of
aggregates was present (Figs. 4 and 5) and reflects the large variety of components
that account for marine snow (Alldredge and Gotschalk, 1990). A minority of the
aggregates appeared to be rather fluffy and will be referred to as fluff-aggregates.
The others are either more compact or seem to be composed of smaller particles
and will be referred to as faecal-aggregates (Table 5, Fig. 3).
3.2.2. General characteristics of the particle fluxes
Small particles were most abundant at every site, with numerical fluxes
dropping by 4 orders of magnitude as size (esd) increased from 0.01 to 0.1 cm
(Fig. 6). Nonetheless, the volume and carbon fluxes were mainly carried by
mid-sized and larger particles (esd of 0.05 and 0.1 cm, Figs. 7 and 8). The carbon
flux was dominated by slightly smaller particles than the volume flux (compare
Figs. 7 and 8), because the larger particles were assumed to have lower carbon
densities (see Section 2.3.2). The overall importance of the large particles in
controlling the carbon flux is emphasised by the cumulative carbon flux (Fig. 9). It
clearly shows that the large particles that only make up 5–10% of the numerical
flux provide more than half of the carbon flux.
3.2.3. Differences in particle flux characteristics among the sites
Total volume flux of particles from the gel traps was highest at P1, followed by
P2 and P3 (Table 6). The carbon fluxes calculated from the images showed the same
trend, P14P24P3, and decreased from around 10,000 to 600 mmol C m�2 d�1
(Table 7). The sites also differed in the number and the nature of the particles
observed. In terms of particle numbers, P2 had the highest flux, followed by P1 and
P3 (Table 6). This was due to the very large number of very small particles (mainly
phytoplankton cells) at P2 (Table 6, Fig. 6). The larger, flux-dominating particles were
predominantly faecal-aggregates at all sites, followed by large cylindrical faecal
pellets, with rarer occurrences of ovoid faecal pellets (as is apparent from the images
in Fig. 4 and quantified in Table 6). Fluff-aggregates did not play a large role at any of
the sites (Tables 6 and 7), although it is of course possible that fluffy material, such as
phyto-detritus or feeding structures, were included within some of the less tightly
ing the difference in particles size: the SAZ (upper panel) is dominated by large
ndant. SAZ-particles represent (from left to right in the upper panel): intact ovoid
Z-particles are mainly phyto-cells (distributed over all images in the lower panel)
all photos: 1 mm.

Fig. 6. Number flux spectra from the Gel-traps, indicating the variations with
depth (140, 190, 240, and 290 m).
Fig. 7. Size fractioned volume flux spectra showing the greater importance of
large particles to the volume flux than to the numerical flux (compare Fig. 6).
Fig. 8. Estimated POC flux spectra from the piece-wise volume to POC conversion
function that incorporates carbon content estimates for phytoplankton, faecal
pellets, and aggregates (see Section 2.3.2). This function shifts the peak carbon flux
to somewhat smaller particle sizes than the peak volume flux (because of the
increasing porosity of large aggregates as modelled by fractal geometry).
F. Ebersbach et al. / Deep-Sea Research II 58 (2011) 2260–2276 2269
packed faecal-aggregates. Particle composition at P3 was similar to P1 in being
dominated by faecal-aggregates and having a dearth of phyto-cells, but the
dominance of the faecal-aggregates is somewhat reduced by the presence of
cylindrical faecal pellets (Table 7).
The sizes of the particles within the different particle classes also varied
among the sites. The faecal-aggregates were largest at P1, where their volumes
were almost twice that of the faecal-aggregates at P2 and P3 (Table 9). Fluff-
aggregates were four to ten times smaller than faecal-aggregates; they were larger
at P2 than P1, and absent at P3. The largest cylindrical pellets were found at P3,
followed by P1 (half the volume or length) and then P2 (circa one order of
magnitude smaller). Pellets at P2 were somewhat wider (lower aspect ratios) than
at P1 and P3. Within the category of ovoid faecal pellets, at least two size classes
can be distinguished (see particles labelled e, h, and i in Fig. 3) and at P1 more of
the larger ones were found (Table 8). Phyto-cells did not differ appreciably in size
between the sites.
3.3. Variations of flux and particle composition with depth
A decrease of the POC flux with increasing depth (from 170 to 320 m) was
recognisable in the IRS traps at P2 and P3: by almost half at P2, and even more
strongly to one-fifth at P3 (Table 4). The greater depth resolution of the gels as
compared to the IRS traps (Table 2) gives further insights into the flux variation
with depth. In particular, the shallowest gel trap revealed distinct differences
among the stations. At the SAZ-sites P1 and P3, the flux at 140 m was lower than
the flux at 190 m, which then decreased slightly by 290 m. Whereas P2 (PFZ)
showed a relatively high flux at 140 m in comparison to 190 m and then a
continuous strong decrease with depth.
Except at the shallowest depths at P1, the total volume flux decreased with
increasing depths (Fig. 7, Table 6). In regard to total carbon flux, variations with
depth were complex (Fig. 8, Table 7). At P2 the faecal-aggregate fluxes, and thus
the carbon fluxes, dropped by one half from the surface to 290 m depth, whereas
at P1 and P3 changes in the faecal-aggregate and carbon fluxes were much less
pronounced (Table 7). At P2, where phyto-cells were important, their carbon flux
declined with depth. For the faecal pellets no trends with depth were recognisable.
4. Discussion
4.1. Overview
We first discuss the sediment trap results, beginning withtechnical aspects of trap function, followed by comparisons of theflux magnitudes for the different trap types and the 3 processstations (Section 4.2). Next we examine the particle character-istics as observed in the gel traps (Section 4.3). Finally, weconsider the probable ecosystem controls on the particle fluxes,including comparing the SAZ-Sense results to other studies(Section 4.4).
4.2. Vertical export determined by sediment traps
4.2.1. Functioning of the sediment traps
Hydrodynamic effects can impair trapping efficiency (e.g. Gustand Kozerski, 2000; Buesseler et al., 2007b), but because of thevery low relative water velocities for all three sediment trap types(see Section 2.2), this influence is likely to have been minimal.This view is corroborated by the even coverage of particles acrossthe surface of the gels, and the fine structures preserved withinthem. It also appears that the entry of zooplankton into the trapsis unlikely to have strongly biased the flux results for tworeasons: (i) the PPS3/3 results were indistinguishable betweenpoisoned and unpoisoned cups, and (ii) the total fluxes from theIRS trap with its zooplankton excluding indented rotating sphere,

Fig. 9. Cumulative POC flux as a function of cumulative numerical flux indicating that more than half the flux is delivered by the largest 10% of the particles, even at the P2
site where small particles were abundant (see Fig. 4).
Table 6Particle number and volume fluxes and fractional contributions from different particle types.
Site Depth Numerical flux Fractional contributions (%) Volume flux Fractional contributions (%)
m #m�2 d�1 flu fae cyl ovo phy cm3 m�2 d�1 flu fae cyl ovo phy
P1 140 32 2 36 5 15 40 0.46 0 82 17 2 0
190 73 4 28 1 11 55 0.98 0 95 4 1 0
240 82 0 29 1 12 58 0.96 0 98 1 1 0
290 53 0 28 2 17 54 0.94 0 93 4 2 0
P2 140 177 0 17 2 7 74 0.92 0 93 6 0 0
190 183 – 15 5 9 71 0.29 – 91 7 1 0
240 139 1 16 2 7 74 0.34 0 65 32 2 0
290 151 0 17 1 7 74 0.27 0 81 17 1 0
P3 140 27 – 21 7 18 53 0.05 – 37 60 2 0
190 29 – 20 5 27 47 0.04 – 81 16 1 0
240 31 – 18 7 11 64 0.04 – 30 67 2 0
290 26 – 15 4 16 65 0.03 – 70 24 5 0
1. –: No particle of this type observed.
2. Particle types as defined in Table 5.
Table 7POC fluxes and fractional contributions from identified particle types, as estimated from imaged areas.
Sitei.d.
Depth Total flu fae cyl ovo phy
m POC flux POC flux Fraction POC flux Fraction POC flux Fraction POC flux Fraction POC flux Fractionlmol m�2 d�1 lmol m�2 d�1 % lmol m�2 d�1 % lmol m�2 d�1 % lmol m�2 d�1 % lmol m�2 d�1 %
P1 140 6141.9 8.9 0 5731.7 93 363.9 6 37.1 1 0.4 0
190 10,280.9 38.6 0 9991.6 97 187.8 2 61.9 1 1.0 0
240 10,567.2 5.1 0 10,482.0 99 33.0 0 45.5 1 1.3 0
290 8103.2 0.0 0 7907.0 97 133.0 2 62.1 1 0.8 0
P2 140 9508.2 2.5 0 9219.8 97 266.9 3 15.7 0 3.2 0
190 5928.5 – – 5815.1 98 96.9 2 13.7 0 2.9 0
240 5578.3 11.0 0 5008.3 90 528.5 9 28.3 1 2.2 0
290 5196.5 16.9 0 4936.1 95 226.3 5 14.5 0 2.7 0
P3 140 752.3 – – 611.1 81 136.5 18 4.2 1 0.5 0
190 988.9 – – 951.9 96 33.7 4 2.9 0 0.4 0
240 568.0 – – 434.7 77 128.5 23 4.3 1 0.5 0
290 549.1 – – 513.1 94 29.5 5 5.9 1 0.5 0
1. –: No particle of this type observed.
2. Particle types as defined in Table 5.
F. Ebersbach et al. / Deep-Sea Research II 58 (2011) 2260–22762270
were only slightly lower than the fluxes from the open-mouthedPPS3/3 trap, and within the uncertainties defined by the standarddeviations of the individual cups (Tables 3 and 4).
The fidelity of the separation of the sinking particles bysettling speed by the IRS trap requires careful evaluation. Ideally,
when operated in sinking-rate mode, it transfers particles fromthe indented-rotating-sphere into the settling tube, where theyenter successive cups in the carousel according to their sinkingrates (Peterson et al., 2005). For the IRS rotation interval andcarousel cycle duration of 6 h used here, this results in fractions

Table 8Median characteristics of the particle types.
Site i.d. Depth flu fae cyl ovo phy
vol esd ar vol esd ar vol l ar vol l ar vol esd arm lm3 mm % lm3 mm % lm3 mm % lm3 mm % lm3 mm %
P1 140 0.6 1.1 60 8.4 2.5 58 5.3 0.60 19 3.5 0.2 76 0.2 0.1 62
190 0.6 1.1 56 7.4 2.4 56 5.9 0.62 22 2.1 0.2 76 0.1 0.6 62
240 0.6 1.1 65 4.5 2.1 59 4.9 0.54 23 1.9 0.2 78 0.1 0.6 61
290 – – – 6.2 2.3 59 5.3 0.64 17 2.5 0.2 98 0.1 0.6 61
P2 140 1.0 1.2 50 4.1 2.0 63 0.5 0.23 24 1.4 0.1 77 0.1 0.6 59
190 – – – 4.3 2.0 60 0.2 0.15 28 0.9 0.1 76 0.1 0.6 59
240 0.6 1.1 56 3.9 2.0 62 0.3 0.17 27 1.1 0.1 76 0.1 0.6 59
290 0.8 1.1 54 3.5 1.9 62 0.3 0.18 25 1.4 0.1 77 0.1 0.6 60
P3 140 – – 2.8 1.8 56 13.9 0.90 13 0.6 0.1 79 0.1 0.6 63
190 – – 4.3 2.0 57 7.9 0.76 14 0.5 0.1 79 0.1 0.6 64
240 – – 3.0 1.8 54 9.1 0.73 14 1.1 0.1 78 0.1 0.6 63
290 – – 4.9 2.1 56 11.4 0.81 16 1.0 0.1 77 0.1 0.6 65
1. –: No particle of this type observed.
2. Particle types as defined in Table 5.
3. Volumes (vol), equivalent spherical diameters (esd), lengths (l), aspect ratios (ar)¼width/length.
F. Ebersbach et al. / Deep-Sea Research II 58 (2011) 2260–2276 2271
with sinking rates ranging from 4850 to �2.3 m d�1 (Table 3).The effectiveness of this separation requires evaluation. A parti-cular concern is the possibility that very slow-sinking particlesremain in the funnel beyond the duration of a full carouselrotation (6 h in this study and our previous work; Trull et al.,2008), and are thus transferred into the subsequent cycle wherethey could be erroneously collected into the carousel fractionsthat collect faster sinking particles. Programming the collectioninterval of the last cup in the cycle (#11) to have the same oneminute duration as the first cup in the subsequent cycle (#1)provides some quality control on this issue (Trull et al., 2008).
As shown in Table 3, for the IRS trap at P2, the POC fluxcollected in the 11th cup at 170 and 320 m depths were similarand these amounts are only slightly less than the POC fluxescollected by the first cups for these traps. This suggests that carry-over was significant. If so, the fluxes observed in the other cupsshould be reduced for this contribution. For example, the flux toeach cup could be considered to represent the sum of thecontribution from the most recent IRS rotation and a backgroundof a steady flux of slow sinking particles (Armstrong et al., 2009).However, there are aspects of the flux distribution over the 11fractions that suggest that this is an over-simplification. The POCflux per cup duration for many sinking rate fractions is less thanthe POC flux to the 11th cups (e.g. cups 6–10 for both the 170 and320 m deployments). Indeed, the POC flux per cup duration forthe 11th cups is much larger than that for the preceding 10thcups. This suggests that the high fluxes per cup duration in the11th cups may be induced by the carousel rotation, perhaps bycausing particles that have accumulated at the mouth of the cupto enter the cup. In our previous work, we found large colonialradiolaria in the 11th cups, and attributed the high fluxes per cupduration to their unusual presence (Trull et al., 2008). These orother unusual organisms were not discernable in the presentstudy, but the material in the 11th cups had high POC/BSi ratios incomparison to the preceding 10th cups, suggesting that thematerial entering the 11th cups was different in character. Oneway to rationalise these results is to consider that very slowlysinking material has not completely left the settling tube within6 h, and the motion of the carousel as it turns to cup #11 and thenagain to cup #1 causes some or all of the this material to bemoved further along the settling tube and into the cups. Thus thecarry-over quantity to subsequent cups would be an aliquot
related to the carousel motion, rather than a steady backgroundflux. In other words, correction for carry-over should be equal to(or less than) the 11th cup fluxes, rather than depending on theduration that the cups were open.
Correcting for carry-over in this way does not change theoverall character of the distribution of POC flux across thesinking-rate fractions, rather it emphasises the initial perspectivefrom the uncorrected data – that the flux is spread across the fullrange of sinking fractions, but with an elevated flux from twoclasses of particles – a relatively fast sinking fraction, and a veryslow sinking fraction (see corrected flux values in Table 4).
4.2.2. Flux characteristics of the three sites
In terms of POC flux, the same sequence was observed forall the trap types deployed (P14P24P3), although the fluxestimates vary in magnitude for the different trap types(Tables 3, 4, and 7). In comparison to the PPS3/3 and IRS traps,which tend to be similar, the gel traps gave the highest POC fluxvalues for each site, and also a wider range in relative fluxesamong the sites than for the measured POC fluxes in the PPS3/3and IRS traps. The POC fluxes from PPS3/3 and IRS traps weredetermined directly via geochemical analysis, while the gel trapflux estimates were based on converting particle volume asidentified through microscopic observations into units of carbon(see Section 2.3.2). Because most of the flux is carried by faecal-aggregates at all three sites, it is likely that the conversion factorfor this particle type is the cause of this difference. The fact thatthe faecal-aggregates are somewhat inhomogeneous as theymight originate from processed material (see Section 4.3)supports this conclusion. At P3 where faecal-aggregates contri-bute much less to total volume flux due to their overall smallersize and numbers (Tables 6 and 8), their relative contribution toPOC flux is still similar to the other stations (Table 7) suggestingthat carbon content of the larger faecal-aggregates might beoverestimated. This perspective is consistent with the smalldifferences between our estimates and those obtained with thealgorithm from Guidi et al. (2008). At P1, where large faecal-aggregates were dominant, our POC flux was higher than thatfrom the Guidi et al. algorithm, as it was to a lesser degree at P2.At P3, in contrast, our flux appears to be underestimated, whichmight be explained by the high abundance of small and relativelycompact particles.
F. Ebersbach et al. / Deep-Sea Research II 58 (2011) 2260–22762272
The complex flux variations with depth as estimated from thegel traps (see Section 3.3) could be affected by small scalevariations in time and space (notice also the relatively highstandard deviation of up to 1/3 of the mean for POC flux withPP3/3 traps, Table 3). In addition they could reflect the introduc-tion of biases from the volume-to-carbon algorithms used inestimates from the gel traps (discussed above).
Furthermore, when comparing fluxes among the three sites,we have to keep in mind, that the collected material is derivedfrom the mesopelagic (see Table 2 for trap deployment depths).The largest flux attenuation is often found higher up in the watercolumn (for instance at the pycnocline at 50–60 m depths(Reigstad et al., 2008)). Since the euphotic depth was between34 and 90 m (Table 1) during this study, the sinking particlesunderwent heavy processing before they reached the traps(140 m or deeper, Table 2). Certainly, some of the particulatematter was remineralised between the base of the mixed layerand 140 m (Cassar et al., 2011). Thus the collected particlesrepresent the mesopelagic flux and differ considerably fromsurface particles leaving the euphotic zone.
4.3. Composition of particles
The particle categories identified from the gel traps (see Section3.2.1, Fig. 3, and Table 5) provide some insights into the forms of thesinking material during SAZ-Sense. However, it is important to keepin mind that inferences based on these observations are uncertainbecause the formation pathways remain unknown. For example,since marine snow aggregates capture surrounding particles as theytravel through the water column (Alldredge and Silver, 1988) theidentification of the collected material cannot necessarily identifythe ecological pathways that initiated vertical export. Bacterialdegradation may also have altered particle composition and shape(Azam, 1998). Moreover, the sinking particles collected at 140 mdepth or deeper (Table 2) have already left the euphotic zone, wheremost of the flux alteration occurred.
Based on their structural appearance the aggregates were sepa-rated into fluff-aggregates and faecal-aggregates (Fig. 3, Table 5).Different fluff-aggregates resembled different types of aggregatesfound during earlier studies and might possibly include phyto-detritus, flocculent faecal pellets or larvacean houses (e.g. Fowlerand Knauer, 1986; Alldredge and Silver, 1988; Alldredge andGotschalk, 1989). Microscopic observations reveal that most of thefaecal-aggregates were composed of smaller particles with distinctcylindrical and ovoid shapes resembling individual faecal pellets, orat least tightly packed and optically opaque sub-units similar tothose detected by Alldredge and Gotschalk (1990). However, withinthis particle type a large variety of shapes and forms occurred(Figs. 4 and 5): some were relatively compact and consisted ofagglomerated faecal pellets, while others contained less distinctmaterial, such as loose faecal matter, phyto detritus, or feedingstructures or exopolymeric polysaccharide particles. Our observa-tions are very similar to particles collected from the PFZ south ofNew Zealand using large volume in-situ filtration system (MULVFS)by Lam and Bishop (2007), who found intact faecal pellets as well asaggregates of faecal matter and marine snow. They concluded thatthe material was heavily processed by zooplankton—a view whichwe share based on our observations of large numbers of aggregatescontaining at least some faecal matter. Wexels Riser et al. (2008)studied the vertical flux regulation by zooplankton in the northernBarents Sea, where the importance of faecal pellets in terms ofcarbon flux below the euphotic layer was decreasing. They proposedthat faecal pellets were transferred into unidentifiable organicmatter that is to a large extent faecal pellet derived—whichresembles our faecal-aggregates. Since the particles of this classvary a lot, their origin might be due to several different formation
pathways. In addition to direct faecal material production as a resultof grazing, it is likely that the sinking material underwent otherprocesses, such as fragmentation of particles into smaller ones (Nojiet al., 1991; Dilling and Alldredge, 2000). According to Dilling andAlldredge (2000) large zooplankton such as euphausiids are capableof fragmenting marine snow and Noji et al. (1991) observedcopepods breaking up faecal pellets. This could explain some ofthe large size range and variety in shapes within the faecal-aggregates. Unfortunately, zooplankton data from SAZ-Sense arenot available for comparison. But the faecal pellets as preserved inthe gels and divided into cylindrical and ovoid pellets provide someindication of probable taxa (Fig. 3). The cylindrical faecal pelletswere probably derived from copepods and euphausiids, and theovoid faecal pellets may originate from small copepods or larva-ceans (Gonzalez, 1992; Turner, 2002; Wilson et al., 2008; WexelsRiser et al., 2008).
Phyto-cells were most important at the diatom dominated PFZsite P2 (Tables 6 and 7), where they were collected as chains andrarely also as individual cells (Fig. 6). These highly silicifieddiatom species (e.g. Fragilariopsis kerguelensis; de Salas et al.,2011) might have entered the gel trap individually, or withinaggregates which then fell apart in the traps. Since diatomaggregates have been collected in previous studies (e.g. Waiteand Nodder, 2001; Waite et al., 2005), it is quite possible that ourphyto-cells reached the traps within fluff- or faecal-aggregates.Indeed, our images of PFZ particles (Fig. 5) were very similar tothose of Waite et al. (2005) for aggregates in the SAZ east of NewZealand.
4.4. Ecosystem controls on the flux
4.4.1. Influence of particle types on vertical export
Gross primary production (GPP) and net primary production(NPP) at P1 were about twice as high as at P3 and three timeshigher than at P2 (Table 1). At P1 and P2 POC fluxes wereapproximately one magnitude lower than GPP, and at P3 almosttwo magnitudes. Considering these variations among all threesites implies that primary production and carbon flux were notcoupled in a linear way (Table 1). This is consistent with theperspective developed in earlier work. Boyd and Newton (1995,1999) suggested that details of ecosystem structure are asinfluential as primary production in the control of export. Theparticles identified in the gel traps make clear that zooplanktonwere an important regulator of export throughout the studyregion, contributing strongly to the flux either as faecal pelletsor faecal-aggregates (Figs. 4 and 5). This is in agreement with theestimated high importance of grazing from shipboard incubationexperiments which suggested that, in the eastern and westernSAZ, grazing removed on average 67 and 82% of the primaryproduction, respectively (Pearce et al., 2011). The smaller andmore compact faecal-aggregates at P2 and P3, in comparison tothe larger and fluffier faecal-aggregates at P1 (Table 8, Fig. 5),suggests that the impact of grazing is more pronounced in theeastern SAZ and the PFZ. This is supported by the relatively largecontribution of faecal pellets to the flux in the eastern SAZ(Table 7). In contrast, the higher abundance of fluff-aggregatesand the somewhat looser appearance of the faecal-aggregates inthe western SAZ suggest the possible importance of differentprocesses in the water column, e.g. coagulation of phytoplanktonand formation of phyto-detritus. Nevertheless, hardly any unpro-cessed phytoplankton material was found in the traps (Figs. 4 and 5).This in part probably reflects the distance between the biomassdistributions in shallow mixed layers and the traps (Fig. 2, Table 9),and emphasises the point that we measured mesopelagic fluxes(compare also Section 4.2.2), for which considerable degradation had

Table 9Comparison of POC fluxes and e-ratios.
Site i.d. PPS3/3 trap IRS trap Gel trap Ebersbach et al. algorithm Guidi et al.algorithm
Ebersbach:Guidi
Depth POC flux Depth POC flux Depth POC flux POC flux POC fluxratio
m mmolC m�2 d�1 e-Ratio m mmolC m�2 d�1 e-Ratio m mmolC m�2 d�1 e-Ratio mmolC m�2 d�1
P1 150 3.371.8 0.0470.04 – – – 140 6.1 0.09 5.1 1.2
– – – 190 10.3 0.16 8.7 1.2
240 10.6 0.16 6.3 1.7
290 8.1 0.12 4.9 1.6
P2 150 2.170.9 0.0670.04 170 1.8 0.05 140 9.5 0.27 7.2 1.3
320 1.1 0.03 190 5.9 0.17 5.3 1.1
240 5.6 0.16 4.7 1.2
290 5.2 0.15 4.6 1.1
P3 150 0.970.4 0.0170.1 170 0.9 0.02 140 0.8 0.02 1.4 0.6
320 0.2 0.00 190 1 0.02 1.2 0.9
240 0.6 0.01 1.2 0.5
290 0.6 0.01 0.8 0.8
1. e-Ratio¼POC flux/GPP (GPP in Table 1; data from Cavagna et al., 2011).
2. See Section 2 for discussion of algorithms for POC content of particles.
F. Ebersbach et al. / Deep-Sea Research II 58 (2011) 2260–2276 2273
already occurred during the transit out of the mixed layer and intothe traps.
4.4.2. Impact of particle sizes and structure on sinking rates and
export
According to Stokes law for spherical particle settling(ws¼(gDrd2)/(18Z)), the settling velocity, ws, is proportional toexcess density above seawater, Dr, to the square of the particlesize, d, and inversely proportional to the viscosity of thesurrounding seawater, Z. Particle size presumably influencedindividual particle sinking rates, because particle size varied morethan an order of magnitude (Fig. 7), although median particle sizevaried by less than 50% among the sites (Table 8) so that theinfluence of size on total flux may not have been particularlystrong. Particle excess density (partly controlled by porosity) mayhave been more important than size in terms of sinking rates, andthus in terms of degradation prior to reaching the traps, given thevariations between tightly packed and more fluffy or amorphousfaecal-aggregates (Figs. 4 and 5). This may have contributed to thehigh flux attenuation with depth that was found at P2. Regardingthe ballasting effect, the presence of calcium carbonate and silicaminerals have been demonstrated to influence POC export totraps in the ocean interior (Armstrong et al., 2002; Francois et al.,2002; Klaas and Archer, 2002), although their role may be lessrelevant closer to the ocean surface (Passow, 2004; Trull et al.,2008). Therefore, the highest CaCO3 flux at P1 might have enhancedexport as previously suggested for this region (Cardinal et al., 2005).
Biogenic silica only played a role at P2 (Table 3) and indicatesthe importance of diatoms for the export in the PFZ. However, theevenly distributed BSi content over particles sinking at differentrates as obtained from the IRS trap (Table 4) does not support theview that the mineral had the dominant impact on settling ratesof the sinking material. This would agree with the finding that theslow sinking and the fast sinking fraction at P2 (see Section 3.1.2and Table 4) appear to be composed of similar chemical composi-tion as far as POC and BSi are concerned. In general, POC/BSi ratiosshow no clear trend as a function of sinking rate across all thefractions. This suggests that sinking rates did not depend stronglyon mineral ballast contents (this perspective is likely to extend toall mineral contents, given that PIC contents at P2 were very low,less than 10% of BSi contents (Table 3) and based on historicaldata (Trull et al., 2001b), lithogenic fluxes at this site were
probably also very low). However, material without BSi, mayhave sunk extremely slowly. This is consistent with the very highPOC/BSi ratios in cup 11 for the fraction sinking at less than2.3 m d�1 in the IRS traps (Table 4).
The PFZ site P2 also shows the strongest attenuation with depth(Table 9). This might result from the high abundance of smallparticles (Table 8, Figs. 4 and 5) that could possibly be too small tosink, as generally for the same particle type sinking rates decreasewith decreasing particle size (Alldredge and Gotschalk, 1988; Plouget al., 2008). Therefore both phyto-cells and tiny faecal-aggregatescould contribute to the slow sinking fraction (2.3–6 m d�1)as collected in the IRS trap (Table 4). The fast sinking fraction(410–850 m d�1) may contain larger faecal-aggregates and/orfaecal pellets.
BSi export was high in the PFZ (P2), but low in the SAZ (P1 andP3). In agreement with literature (e.g. Cardinal et al., 2005), fluxesof BSi and POC were strongly decoupled at P2, and thus POC tobiomineral ratios were high in the SAZ and low in the PFZ. Basedon the findings of many empty diatoms in the gels (mainlyF. kerguelensis, Fig. 5), this might be a mechanism for the down-wards transport of silicate at this site.
4.4.3. Estimates of export efficiency
Export-ratios (e-ratios; e-ratio¼POC/NPP (Table 9) based on NPPfrom Cavagna et al. (2011)) and POC as collected in the traps(Tables 3, 4, and 7) were generally low: on average 0.13, 0.19, and0.02 at P1, P2, and P3, respectively (Table 9). Sequence andmagnitudes coincide with the e-ratio calculations based on exportproduction estimated from 234Th water column inventories fromJacquet et al. (2011), who concluded that low export efficiency inthe more productive eastern SAZ (P3) – in contrast to the higherexport in the less productive western SAZ (P1) – was somewhatunexpected. The high e-ratios at P2 may mirror the higher exportefficiency due to the post bloom situation or the impact of largediatoms on carbon flux as suggested by Boyd and Newton (1995).The observation that export at P3 was least efficient despite highestprimary production (Table 9) coincides with relatively small faecal-aggregates (Figs. 4 and 5, Table 8) and low ballast mineral content,suggesting that slow sinking may have influenced export flux. Thedistance between the shallow mixed layers, where biomass produc-tion and export occurred, and the deeper mesopelagic trapsinfluences our ability to assign the cause of the variations in the

F. Ebersbach et al. / Deep-Sea Research II 58 (2011) 2260–22762274
trap-based e-ratios among the sites. In particular, the greaterdistance at P3 than at P1 and P2 (Fig. 2) may have contributed toits lower apparent e-ratio.
Because export efficiency may of course vary seasonally(Wassmann, 1990; Honjo, 1996), it is important to take theseasonal context of the study into account. According to Monginet al. (2011), the bloom in the western SAZ (P1) had not reachedits peak. The large amount of relatively unprocessed and freshmaterial at P1 (see Section 4.4.1, Figs. 4 and 5), supports the ideathat we encountered a growing bloom. In the eastern SAZ (P3) theblooming event occurred over a longer time period without adistinct peak prior to the cruise, and in the PFZ (P2) the peakbiomass period had already passed (Mongin et al., 2011). This is inagreement with the more compact (and more processed) particlesat these sites (P2 and P3) if we assume that phytoplankton hasbeen grazed down and zooplankton mediated particles wereproduced. The large number of empty diatoms in the gel trapsat the P2 site (Fig. 5, Table 6) could be a result of bloomsenescence at the sampling time.
Recently, the term high biomass, low export condition (HBLE)has been suggested for settings like we found at P1 (Lam andBishop, 2007). According to these authors the most importantfactors determining POC export during the Southern Ocean IronExperiment (SOFeX) were biological processes that affected thefragmentation and remineralisation of large particles—coincidingwith the view that faecal-aggregates usually are the maincontributors to POC flux as previous studies have indicated(e.g. Bishop et al., 1977, 1987). This is in agreement with thedominance of more or less heavily processed particles (faecal-aggregates) during SAZ-Sense and also agrees with many otherstudies in Polar regions (e.g. Blain et al., 2007; Pollard et al., 2007;Wassmann et al., 2008).
The results of the project ‘Carbon flux and ecosystem feed backin the northern Barents Sea in an era of climate change’ (CABA-NERA; Wassmann et al., 2008) indicate that vertical carbon exportwas mainly driven by grazing and pelagic retention (Reigstadet al., 2008) and the production of fast sinking faecal pellets(Wexels Riser et al., 2008). This coincides with results from theKerguelen Ocean and Plateau compared Study (KEOPS) that wascarried out in PFZ waters (Blain et al., 2007), where most of theparticle flux originated from faecal matter (Ebersbach and Trull,2008). Similar to our dominating faecal-aggregates, KEOPSreported on aggregates of faecal matter that were responsiblefor downward POC export. A comparison of flux spectra fromSAZ-Sense (Fig. 6) and KEOPS (Ebersbach and Trull, 2008) vali-dates this. Compared with particle distribution during KEOPS, thePFZ site P2 shows a slight shift towards smaller particles. The SAZsites differ somewhat from each other: at P3 the range of particlesizes lies in the average distribution found during KEOPS, butlarge particles are not present at all, and at P1 the trend issomewhat shifted towards larger particles. Overall, the generallysimilar characteristics at KEOPS and SAZ-Sense indicate similarexport mechanisms.
In contrast, POC export during the Southern Ocean IronRelease Experiment SOIREE, that took place under similar condi-tions (HNLC and iron fertilised waters; Boyd et al., 2000) wasdriven by phyto-detrital aggregates (Waite and Nodder, 2001).Jackson et al. (2005) compared measured particle fluxes fromSOIREE with model estimates and yielded number flux spectra,which resemble our particle distribution in regard to overalltrends. However, the SOIREE particles in total were much smaller(as small as 0.8 mm in diameter), the abundance of the 10 mmsized particles (our smallest) was about one magnitude higherand the decrease towards larger particles was less steep (for the0.4 cm size class the difference exceeds two magnitudes), sug-gesting that during SOIREE the flux was carried by larger particles.
This agrees with the dominance of large marine-snow aggregatesentirely composed of diatoms observed in SOIREE gels (Waite andNodder, 2001) and is in opposite to the more tightly packedfaecal-aggregates responsible for POC flux during SAZ-Sense.Marine-snow aggregates have also been observed in many otherstudies, where aggregation of phytoplankton was pre-dominant(e.g. Alldredge and Gotschalk, 1989; Passow et al., 1994; Waiteet al., 2005; Pollard et al., 2007; Salter et al., 2007). The CROZetnatural iron bloom and EXport experiment (CROZEX), forinstance, also suggests an important role for the direct export ofa diverse range of diatoms (Salter et al., 2007).
Thus, the different export mechanisms and the subsequentlydifferent particle regimes highlight the importance of studyingflux composition in detail. As shown by various studies on particlesize distribution in different regions of the ocean (e.g. Jacksonet al., 2005; Ebersbach and Trull, 2008; Guidi et al., 2008;Stemmann et al., 2008; Jouandet et al., 2011), the approach ofdetermining particle size spectra provides insights in the contextof carbon transport from the surface ocean into the mesopelagiczone. This is an important step towards prediction of carbon fluxin response to changing environments.
5. Conclusions
The overall results are a clear reminder that simple indices,such as satellite estimates of phytoplankton biomass, are a poorguide to ecosystem function in general, or to export productionspecifically. The elevated biomass observed at P3, which ispresent throughout the year as indicated by satellite remotesensing (Mongin et al., 2011), was not accompanied by elevatedprimary or new production, and did not translate into increasedsinking flux, at least not during the short shipboard observationalperiod reported here. This provides a cautionary note, as haveother studies of natural iron fertilisation (Blain et al., 2007;Pollard et al., 2007), about the effectiveness of iron inputs (whichwere elevated at the P3 site; Bowie et al., 2009) to increasebiological pump strength. The clear influence of zooplanktongrazing in the control of particle production and export observedvia the use of the polyacrylamide gel traps emphasises theinfluence of higher trophic levels on biological pump responsesto stimulation of photosynthesis. This perspective, known as theecumenical iron hypothesis, considers the impact of grazers onprimary production in iron-limited ecosystems (Morel et al.,1991; Cullen, 1995). It was originally formulated based on generalecological principles, and has less commonly been directlydemonstrated. The combination of three trap types to obtaingeochemical flux measurements, particle sinking rate estimates,and images of intact particles is powerful and will benefit otherstudies in the future.
Acknowledgments
This research was in part supported by the Australian Govern-ment Cooperative Research Centres Programme through theAntarctic Climate and Ecosystems CRC (ACE CRC), Australian Ant-arctic Science projects #2720 and #1156, the Australian AntarcticDivision, CSIRO Marine and Atmospheric Research, and the captainand crew of R.S.V. Aurora Australis. The NERC Earth Observation DataAcquisition and Analysis Service (NEODAAS) supplied data for theocean colour image provided by the Plymouth Marine Laboratory.The Institute National des Sciences de l’Univers (INSU, France)provided the PPS3/3 trap, and F. Dehair (Vrije Universiteit Brussel,Belgium) provided one IRS trap. Thanks to D. Mclaughlin (mooringspreparation), C. Moy (gel preparation), M. Rosenberg (assistance

F. Ebersbach et al. / Deep-Sea Research II 58 (2011) 2260–2276 2275
with trap deployments), C. Bloomfield (biogenic silica analysis), andT. Rodemann (UTAS Central Science Laboratory, elemental analysis).U. Passow, U. Bathmann, E. Nothig, C. Klaas, D. Wolf-Gladrow and B.Griffiths are thanked for thoughtful discussions, as are two anon-ymous reviewers who helped to improve the manuscript. F. Ebers-bach was funded by GLOMAR (Ph.D. scholarship).
References
Alldredge, A.L., 1998. The carbon, nitrogen and mass content of marine snow as afunction of aggregate size. Deep-Sea Research I 45, 529–541.
Alldredge, A.L., Gotschalk, C., 1988. In situ settling behaviour of marine snow.Limnology and Oceanography 33, 330–351.
Alldredge, A.L., Gotschalk, C., 1989. Direct observations of the mass flocculation ofdiatom blooms: characteristics, settling velocities and formation of diatomaggregates. Deep-Sea Research 36, 159–171.
Alldredge, A.L., Gotschalk, C., 1990. The relative contribution of marine snow ofdifferent origins to biological processes in coastal waters. Continental ShelfResearch 10, 41–58.
Alldredge, A.L., Jackson, G.A., 1995. Aggregation in marine systems. Deep-SeaResearch II 42, 1–7.
Alldredge, A.L., Silver, M.W., 1988. Characteristics, dynamics and significance ofmarine snow. Progress in Oceanography 20, 41–82.
Armstrong, R.A., Lee, C., Hedges, J.I., Honjo, S., Wakeham, S.G., 2002. A new,mechanical model for organic carbon fluxes in the ocean based on thequantitative association of POC with ballast minerals. Deep-Sea Research II49, 219–236.
Armstrong, R.A., Peterson, M.L., Lee, C., Wakeham, S.G., 2009. Settling velocityspectra and the ballast ratio hypothesis. Deep-Sea Research II 56, 1470–1478.
Azam, F., 1998. Oceanography: microbial control of carbon flux: the plot thickens.Science 280, 694–696.
Bishop, J.K.B., 1989. Regional extremes in particulate matter composition and flux:effects on the chemistry of the ocean interior. In: Berger, W.H., Smetacek, V.,Wefer, G. (Eds.), Dahlem Workshop Life Science Report—Productivity of theOceans: Present and Past. John Wiley and Sons, New York, pp. 117–138.
Bishop, J.K.B., Edmond, J.M., Ketten, D.R., Bacon, M.P., Silker, W.B., 1977. Thechemistry, biology, and vertical flux of particulate matter from the upper400 m of the equatorial Atlantic Ocean. Deep-Sea Research 24, 511–548.
Bishop, J.K.B., Stepien, J.C., Wiebe, P.H., 1987. Particulate matter distributions,chemistry and flux in the Panama basin: response to environment forcing.Progress in Oceanography 17, 1–59.
Blain, S., Queguiner, B., Armand, L., Belviso, S., Bombled, B., Bopp, L., Bowie, A.,Brunet, C., Brussaard, C., Carlotti, F., Christaki, U., Corbiere, A., Durand, I.,Ebersbach, F., Fuda, J.-L., Garcia, N., Gerringa, L., Griffiths, B., Guige, C.,Guillerm, C., Jacquet, S.H.M., Jeandel, C., Laan, P., Lefevre, D., Lo Monaco, C.,Malits, A., Mosseri, J., Obernosterer, I., Park, Y.-H., Picheral, M., Pondaven, P.,Remenyi, T., Sandroni, V., Sarthou, G., Savoye, N., Scouarnec, L., Souhaut, M.,Thuiller, D., Timmermans, K., Trull, T., Uitz, J., van Beek, P., Veldhuis, M.,Vincent, D., Viollier, E., Vong, L., Wagener, T., 2007. Effect of natural ironfertilization on carbon sequestration in the Southern Ocean. Nature 446,1070–1075.
Bowie, A.R., Lannuzel, D., Remenyi, T.A., Wagener, T., Lam, P.J., Boyd, P.W., Guieu,C., Townsend, A.T., Trull, T.W., 2009. Biogeochemical iron budgets of theSouthern Ocean south of Australia demonstrate that summertime supplydecouples iron and nutrient cycles in the subantarctic zone. Global Biogeo-chemical Cycles 23, GB4034. doi:10.1029/2009GB003500.
Bowie, A.R., Griffiths, F.B., Dehairs, F., Trull, T., 2011. Oceanography of thesubantarctic and polar frontal zones south of Australia during summer: settingof the SAZ-Sense study. Deep-Sea Research II 58, 2059–2070.
Boyd, P., Newton, P., 1995. Evidence of the potential influence of planktoniccommunity structure on the interannual variability of particulate organiccarbon flux. Deep-Sea Research I 42, 619–639.
Boyd, P.W., Newton, P.P., 1999. Does planktonic community structure determinedownward particulate organic carbon flux in different oceanic provinces?Deep-Sea Research I 46, 63–91.
Boyd, P.W., Trull, T.W., 2007. Understanding the export of biogenic particles inoceanic waters: is there consensus? Progress in Oceanography 72, 276–312.
Boyd, P.W., Watson, A.J., Law, C.S., Abraham, E.R., Trull, T., Murdoch, R., Bakker,D.C.E., Bowie, A.R., Buesseler, K.O., Chang, H., Charette, M., Croot, P., Downing,K., Frew, R., Gall, M., Hadfield, M., Hall, J., Harvey, M., Jameson, G., LaRoche, J.,Liddicoat, M., Ling, R., Maldonado, M.T., McKay, R.M., Nodder, S., Pickmere, S.,Pridmore, R., Rintoul, S., Safi, K., Sutton, P., Strzepek, R., Tanneberger, K.,Turner, S., Waite, A., Zeldis, J., 2000. A mesoscale phytoplankton bloom in thepolar Southern Ocean stimulated by iron fertilization. Nature 407, 695–702.
Buesseler, K.O., 1991. Do upper-ocean sediment traps provide an accurate recordof particle flux? Nature 353, 420–423.
Buesseler, K.O., Boyd, P.W., 2009. Shedding light on processes that control particleexport and flux attenuation in the twilight zone of the open ocean. Limnologyand Oceanography 54, 1210–1232.
Buesseler, K.O., Lamborg, C., Boyd, P.W., Lam, P.J., Trull, T.W., Bidigare, R.R., Bishop,J.K.B., Casciotti, K.L., Dehairs, F., Elskens, M., Honda, M., Karl, D.M., Siegel, D.A.,Silver, M.W., Steinberg, D.K., Valdes, J., Van Mooy, B., Wilson, S., 2007a.
Revisiting carbon flux through the ocean’s twilight zone. Science 316,567–570.
Buesseler, K.O., Antia, A.V., Chen, M., Fowler, S.W., Gardner, W.D., Gustafsson, O.,Harada, K., Michaels, A.F., van der Loef, M.R., Sarin, M., Steinberg, D.K., Trull, T.,2007b. An assessment of the use of sediment traps for estimating upper oceanparticle fluxes. Journal of Marine Research 65, 345–416.
Cardinal, D., Savoye, N., Trull, T.W., Andre, L., Kopczynska, E.E., Dehairs, F., 2005.Variations of carbon remineralisation in the Southern Ocean illustrated by theBaxs proxy. Deep-Sea Research I 52, 355–370.
Cassar, N., DiFiore, P., Barnett, B.A., Bender, M.L., Bowie, A.R., Tilbrook, B., Petrou,K., Westwood, K.J., Wright, S.W., Lefevre, D., 2011. The influence of iron andlight on net community production in the Subantarctic and Polar FrontalZones. Biogeosciences 7, 5649–5674.
Cavagna, A.-J., Elskens, M., Griffiths, F.B., Fripiat, F., Jacquet, S.H.W., Westwood, K.J.,Dehairs, F., 2011. Contrasting regimes of production and potential for carbonexport in the Sub-Antarctic and Polar Frontal Zones south of Tasmania. Deep-Sea Research II 58, 2235–2247.
Cheah, W., McMinn, A., Griffiths, F.B., Westwood, K., Webb, J., Molina, E., Wright,S.W., van den Enden, R., 2011. Assessing Sub-Antarctic Zone primary produc-tivity from fast repetition rate fluorometry. Deep-Sea Research II 58,2179–2188.
Cullen, J.J., 1995. Status of the iron hypothesis after the Open-Ocean EnrichmentExperiment. Limnology and Oceanography 40, 1336–1343.
De La Rocha, C., Passow, U., 2007. Factors influencing the sinking of POC andthe efficiency of the biological carbon pump. Deep-Sea Research II 54,639–658.
de Salas, M.F., Eriksen, R., Davidson, A.T., Wright, S., 2011. Protistan communitiesin the Australian sector of the subantarctic zone during SAZ-Sense. Deep-SeaResearch II 58, 2135–2149.
Dilling, L., Alldredge, A.L., 2000. Fragmentation of marine snow by swimmingmacrozooplankton: a new process impacting carbon cycling in the sea. Deep-Sea Research I 47, 1227–1245.
Doblin, M.A., Ralph, P.J., Petrou, K.L., Shelly, K., Westwood, K., van den Enden, R.,Wright, S.W., Griffiths, F.B., 2011. Diel variation of chl-a fluorescence, phyto-plankton pigments and productivity in the Sub-Antarctic Zone. Deep-SeaResearch II 58, 2189–2199.
Ebersbach, F., Trull, T., 2008. Sinking particle properties from polyacrylamide gelsduring the KErguelen Ocean and Plateau compared Study (KEOPS): zooplank-ton control of carbon export in an area of persistent natural iron inputs in theSouthern Ocean. Limnology and Oceanography 53, 212–224.
Evans, C., Thomson, P.G., Davidson, A.T., Bowie, A.R., van den Enden, R., Witte, H.,Brussaard, C.P.D., 2011. Potential implications of climate change-inducedshifts in microbial distribution for carbon cycling in the Australian SouthernOcean. Deep-Sea Research II 58, 2150–2161.
Falkowski, P.G., Scholes, R.J., Boyle, E.A., Canadell, J., Canfield, D., Elser, J., Gruber,N., Hibbard, K., Hogberg, P., Linder, S., Mackenzie, F.T., Moore, B.I., Pedersen, T.,Rosenthal, Y., Seitzinger, S., Smetacek, V., Steffen, W., 2000. The global carboncycle: a test of our knowledge of earth as a system. Science 290, 291–296.
Fowler, S.W., Knauer, G.A., 1986. Role of large particles in the transport ofelements and organic compounds through the oceanic water column. Progressin Oceanography 16, 147–194.
Francois, R., Honjo, S., Krishfield, R., Manganini, S., 2002. Factors controlling theflux of the organic carbon to the bathypelagic zone of the ocean. GlobalBiogeochemical Cycles 16 (1087), 34 1–34 20. doi:10.1029/2001GB001722.
Gonzalez, H.E., 1992. The distribution and abundance of krill faecal material andoval pellets in the Scotia and Weddell Seas (Antarctica) and their role inparticulate flux. Polar Biology 12, 81–91.
Gonzalez, H.E., Smetacek, V., 1994. The possible role of the cyclopoid copepodOithona in retarding vertical flux of zooplankton faecal material. MarineEcology-Progress Series 113, 233–246.
Guidi, L., Jackson, G.A., Stemmann, L., Carlos Miquel, J., Picheral, M., Gorsky, G.,2008. Relationship between particle size distribution and flux in the mesope-lagic zone. Deep-Sea Research I 55, 1364–1374.
Gust, G., Kozerski, H.-P., 2000. In situ sinking-particle flux from collection rates ofcylindrical traps. Marine Ecology-Progress Series 208, 93–106.
Hill, K.S., Rintoul, S.R., Coleman, R., Ridgeway, K.R., 2008. Wind forced lowfrequency variability of the East Australia Current. Geophysical ResearchLetters 35 (L08602). doi:10.1029/2007GL032912.
Honjo, S., 1996. Fluxes of particles to the interior of the open ocean. In: Ittekkot, V.,Aschauffer, P., Honjo, S., Depetris, P. (Eds.), Particle Flux in the Oceans. SCOPE57. Wileys, New York, pp. 91–154.
Jackson, G.A., Waite, A.M., Boyd, P.W., 2005. Role of algal aggregation in verticalcarbon export during SOIREE and in other low biomass environments.Geophysical Research Letters 32 (L13507), 1–4. doi:10.1029/2005GL023180.
Jacquet, S.H.M., Lam, P., Trull, T., Buesseler, K., Dehairs, F., 2011. Carbon exportproduction in the Polar Front Zone and Subantarctic Zone south of Tasmania.Deep-Sea Research II 58, 2277–2292.
Jouandet, M.-P., Trull, T.W., Picharel, M., Guidi, L., Ebersbach, F., Stemmann, L.,Blain, S., 2011. Optical imaging of mesopelagic particles indicated deep carbonflux beneath a natural iron fertilized bloom in the Southern Ocean, Limnologyand Oceanography 56, 1130–1140. doi:10.4319/lo.2011.56.3.1130.
Klaas, C., Archer, D.E., 2002. Association of sinking organic matter with varioustypes of mineral ballast in the deep sea: implication for the rain ratio. GlobalBiogeochemical Cycles 16 (1116), 63 1–63 14. doi:10.1029/2001GB001765.
Kwon, E.Y., Primeau, F., Sarmiento, J.L., 2009. The impact of remineralization depthon the air–sea carbon balance. Nature Geoscience 2, 630–635.

F. Ebersbach et al. / Deep-Sea Research II 58 (2011) 2260–22762276
Lam, P.J., Bishop, J.K.B., 2007. High biomass, low export regimes in the SouthernOcean. Deep-Sea Research II 54, 601–638.
Lampitt, R.S., Antia, A.N., 1997. Particle flux in the deep seas: regional character-istics and temporal variability. Deep-Sea Research I 44, 1377–1403.
Lannuzel, D., Remenyi, T., Lam, P.J., Townsend, A., Ibisanmi, E., Butler, E., Wagener,T., Schoemann, V., Bowie, A.R., 2011. Distribution of dissolved and particulateiron in the sub-Antarctic and Polar Frontal Southern Ocean (Australian sector).Deep-Sea Research II 58, 2094–2112.
Lutz, M., Dunbar, R., Caldeira, K., 2002. Regional variability in the vertical flux ofparticulate organic carbon in the ocean interior. Global Biogeochemical Cycles16 (1037), 11 11–11 18. doi:10.1029/2000GB001383.
Lutz, M.J., Caldeira, K., Dunbar, R.B., Behrenfeld, M.J., 2007. Seasonal rhythms of netprimary production and particulate organic carbon flux to depth describe theefficiency of biological pump in the global ocean. Journal of GeophysicalResearch 112 (C10011), 1–26. doi:10.1029/2006JC003706.
Martin, J.H., Knauer, G.A., Karl, D.M., Broenkow, W.W., 1987. VERTEX: carboncycling in the northeast Pacific. Deep-Sea Research 34, 267–285.
Matear, R., Hirst, A.C., 1999. Climate change feedback on the future oceanic CO2
uptake. Tellus 51, 722–733.Menden-Deuer, S., Lessard, E.J., 2000. Carbon to volume relationship for dino-
flagellates, diatoms, and other protist plankton. Limnology and Oceanography45, 569–579.
Michaels, A.F., Silver, M.W., 1988. Primary production, sinking fluxes and themicrobial food web. Deep-Sea Research A 35, 473–490.
Mongin, M., Matear, R., Chamberlain, M., 2011. Seasonal and spatial variability ofremotely sensed chlorophyll and physical fields in the SAZ-Sense region.Deep-Sea Research II 58, 2082–2093.
Morel, F.M.M., Rueter, J.G., Price, N.M., 1991. Iron nutrition of phytoplankton andits possible importance in the ecology of ocean regions with high nutrientsand low biomass. Oceanography 4, 56–61.
Noji, T.T., Estep, K.W., MacIntyre, F., Norrrbin, F., 1991. Image analysis of faecalmaterial grazed upon by three species of copepods: evidence for coprorhexy,coprophagy, and coprochaly. Journal of the Marine Biological Association ofthe United Kingdom 71, 465–480.
Passow, U., 2004. Switching perspectives: do mineral fluxes determine particulateorganic carbon or vice versa? Geochemistry Geophysics Geosystems 5, 1–5.doi:10.1029/2003GC000670.
Passow, U., Alldredge, A.L., Logan, B.E., 1994. The role of particulate carbohydrateexudates in the floccolation of diatom blooms. Deep-Sea Research I 42,335–357.
Pearce, I., Davidson, A., Thomson, P., Wright, S., van den Enden, R., 2011. Marinemicrobial ecology in the Subantarctic Zone: rates of bacterial and phytoplank-ton growth and grazing by heterotrophic protists. Deep-Sea Research II 58,2248–2259.
Peterson, M.L., Wakeham, S.G., Lee, C., Askea, M.A., Miquel, J.C., 2005. Noveltechniques for collection of sinking particles in the ocean and determiningtheir settling rates. Limnology and Oceanography Methods 3, 520–532.
Peterson, M.L., Fabres, J., Wakeham, S.G., Lee, C., Miquel, J.C., 2009. Sampling thevertical particle flux in the upper water column using a large diameterfree-drifting Net-Trap adapted to an Indented Rotating Sphere sediment trap.Deep-Sea Research II 56, 1547–1557.
Petrou, K., Hassler, C.S., Doblin, M.A., Shelly, K., Schoemann, V., van den Enden, R.,Wright, S.W., Ralph, P.J., 2011. Iron limitation and high light stress onphytoplankton populations from the Australian sub-Antarctic zone (SAZ).Deep-Sea Research II 58, 2200–2211.
Ploug, H., Iversen, M.H., Fischer, G., 2008. Ballast, sinking velocity, and apparentdiffusivity within marine snow and zooplankton fecal pellets: implications forsubstrate turnover by attached bacteria. Limnology and Oceanography 52,1878–1886.
Pollard, R., Sanders, R., Lucas, M., Statham, P., 2007. The Crozet Natural Iron Bloomand Export Experiment (CROZEX). Deep-Sea Research II 54, 1905–1914.
Reigstad, M., Wexel Riser, C., Wassmann, P., Ratkova, T., 2008. Vertical export ofparticulate organic carbon: attenuation, composition and loss rates in thenorthern Barents Sea. Deep-Sea Research II 55, 2308–2319.
Rintoul, S., Trull, T.W., 2001. Seasonal evolution of the mixed layer in theSubantarctic Zone south of Australia. Journal of Geophysical Research 106(C12), 31 447–31 462. doi:10.1029/2000JC000329.
Salter, I., Lampitt, R.S., Sanders, S., Poulton, A.J., Kemp, A.E.S., Boorman, B., Saw, K.,Pearce, R., 2007. Estimating carbon, silica and diatom export from a naturallyfertilised phytoplankton bloom in the Southern Ocean using PELAGRA: a noveldrifting sediment trap. Deep-Sea Research II 54, 2223–2259.
Sarmiento, J.L., Le Quere, C., 1996. Oceanic Carbon Dioxide Uptake in a Model ofCentury-Scale Global Warming. Science 274, 1346–1350.
Sedwick, P.N., DiTullio, G.R., Hutchins, D.A., Boyd, P.W., Griffiths, B.F., Crossley, A.C.,Trull, T.W., Queguiner, B., 1999. Limitation of algal growth by iron deficiencyin the Australian Subantarctic region. Geophysical Research Letters 26,2865–2868. doi:10.1029/1998GL002284.
Sedwick, P.N., Bowie, A., Trull, T.W., 2008. Dissolved iron in the Australian sector ofthe Southern Ocean (CLIVAR SR3 section): meridional and seasonal trends.Deep-Sea Research I 55, 911–925.
Stemmann, L., Jackson, G.A., Ianson, D., 2004. A vertical model of particle sizedistributions and fluxes in the midwater column that includes biological andphysical processes—Part I: model formulation. Deep-Sea Research I 51,865–884.
Stemmann, L., Eloire, D., Sciandra, A., Jackson, G.A., Guidi, L., Picheral, M., Gorsky,G., 2008. Volume distribution for particles between 3.5 and 2000 mm in theupper 200 m region of the South Pacific Gyre. Biogeosciences 5, 299–310.
Turner, J.T., 2002. Zooplankton fecal pellets, marine snow and sinking phyto-plankton blooms. Aquatic Microbial Ecology 27, 57–102.
Trull, T.W., Bray, S.G., Buesseler, K.O., Lamborg, C.H., Manganini, S., Moy, C., Valdes,J., 2008. In situ measurement of mesopelagic particle sinking rates and thecontrol of carbon transfer to the ocean interior during the Vertical Flux in theGlobal Ocean (VERTIGO) voyages in the North Pacific. Deep-Sea Research II 55,1684–1695.
Trull, T.W., Sedwick, P.N., Griffiths, B.F., Rintoul, S.S., 2001a. Introduction to specialsection: SAZ project. Journal of Geophysical Research 106 (C12), 31/425–429.doi:10.1029/2001JC001008.
Trull, T.W., Bray, S.G., Manganini, S.J., Honjo, S., Francois, R., 2001b. Mooredsediment trap measurements of carbon export in the Subantarctic and PolarFrontal Zones of the Southern Ocean, south of Australia. Journal of GeophysicalResearch 106 (C12), 31/489–509. doi:10.1029/2000JC000308.
Volk, T., Hoffert, M.I., 1985. Ocean carbon pumps: analysis of relative strengthsand efficiencies in ocean-driven atmospheric CO2 changes. GeophysicalMonographs 32, 99–110.
Waite, A.M., Gustafsson, O., Lindahl, O., Tiselius, P., 2005. Linking ecosystemdynamics and biogeochemistry: sinking fractionation of organic carbon in aSwedish fjord. Limnology and Oceanography 50, 658–671.
Waite, A.M., Nodder, S.D., 2001. The effect of in situ iron addition on the sinkingrates and export flux of Southern Ocean diatoms. Deep-Sea Research II 48,2635–2654.
Wang, X., Matear, R., Trull, T.W., 2003. Nutrient utilization ratios in the PolarFrontal Zone in the Australian sector of the Southern Ocean: a model. GlobalBiogeochemical Cycles 17, 1009. doi:10.1029/2002GB001938.
Wassmann, P., 1990. Relationship between primary and export production in theboreal coastal zone of the North Atlantic. Limnology and Oceanography 35,464–471.
Wassmann, P., Carroll, J., Bellerby, R.G.J., 2008. Carbon flux and ecosystem feed-back in the northern Barents Sea in an area of climate change: an introduction.Deep-Sea Research II 55, 2143–2153.
Westwood, K.J., Griffiths, F.B., Webb, J., 2011. Primary production in the Sub-Antarctic and Polar Frontal zones south of Tasmania, Australia; SAZ-Sensesurvey, 2007. Deep-Sea Research II 58, 2162–2178.
Wexels Riser, C., Wassmann, P., Reigstad, M., Seuthe, L., 2008. Vertical fluxregulation by zooplankton in the northern Barents Sea during Arctic spring.Deep-Sea Research II 55, 2320–2329.
Wilson, S.E., Steinberg, D.K., Buesseler, K.O., 2008. Changes in fecal pelletcharacteristics with depth as indicators of zooplankton repackaging ofparticles in the mesopelagic zone of the subtropical and subarctic NorthPacific Ocean. Deep-Sea Research II 55, 1636–1647.