contura + alpha: transformative...
TRANSCRIPT
Contura + Alpha: Transformative Combination
April 2018
1

2
Disclaimer
This presentation is being made in respect of the proposed transaction involving Contura Energy, Inc. (“Contura”), Alpha Natural Resources Holdings, Inc.
(“Holdings”) and ANR, Inc. (“ANR” and together with Holdings, “Alpha”). This presentation does not constitute an offer to sell or the solicitation of an offer to buy
any securities, nor shall there be any sale of securities in any jurisdiction in which such offer, solicitation or sale would be unlawful prior to registration or
qualification under the securities laws of such jurisdiction. In connection with the proposed transaction, Contura will file with the Securities and Exchange
Commission (“SEC”) a registration statement on Form S-4 that will include a joint proxy statement of Holdings and ANR and a prospectus of Contura. Contura
and Alpha also plan to file other documents with the SEC regarding the proposed transaction and a joint proxy statement/prospectus will be mailed to
stockholders of Holdings and ANR. BEFORE MAKING ANY VOTING OR INVESTMENT DECISION, INVESTORS ARE URGED TO READ THE FORM S-4
AND THE JOINT PROXY STATEMENT/PROSPECTUS REGARDING THE PROPOSED TRANSACTION AND ANY OTHER RELEVANT DOCUMENTS
CAREFULLY IN THEIR ENTIRETY WHEN THEY BECOME AVAILABLE BECAUSE THEY WILL CONTAIN IMPORTANT INFORMATION ABOUT THE
PROPOSED TRANSACTION. The joint proxy statement/prospectus, as well as other filings containing information about Contura and Alpha will be available
without charge at the SEC’s Internet site (http://www.sec.gov). Copies of the joint proxy statement/prospectus can also be obtained, when available, without
charge, from Contura’s website at http://www.conturaenergy.com. Copies of the joint proxy statement can be obtained, when available, without charge, from
Alpha’s website at http:// http://www.alphanr.com.
This presentation contains forward-looking statements that involve substantial risks and uncertainties. All statements, other than statements of historical facts,
contained in this presentation, including statements regarding our strategy, future operations, future financial position, future revenues, projected costs,
synergies, prospects, plans and objectives of management, are forward-looking statements. The words “anticipate,” “believe,” “estimate,” “expect,” “intend,”
“may,” “plan,” “predict,” “project,” “target,” “potential,” “will,” “would,” “could,” “should,” “continue,” and similar expressions are intended to identify forward-looking
statements, although not all forward-looking statements contain these identifying words. We may not actually achieve the plans, intentions or expectations
disclosed in our forward-looking statements, and you should not place undue reliance on our forward-looking statements. Actual results or events could differ
materially from the plans, intentions and expectations disclosed in the forward-looking statements we make. The forward-looking statements contained in this
presentation reflect our current views with respect to future events, and we assume no obligation to update any forward-looking statements. Uncertainties and
risk factors that could affect future performance and cause results to differ from the forward-looking statements in this presentation include, but are not limited to:
(a) any substantial or extended decline in coal pricing, demand and other factors beyond the parties’ control; (b) hazards and operating risks associated with
coal mining and the dependence of coal mining upon many factors and conditions beyond the parties’ control; (c) significant competition, as well as changes in
foreign markets or economics; (d) the impact of current or future environmental, health and safety, transportation, labor and other laws and regulations on the
parties; (e) the parties’ ability to consummate the transaction or satisfy the conditions to the completion of the transaction, including the receipt of shareholder
approvals and the receipt of regulatory approvals required for the transaction on the terms expected or on the anticipated schedule; (f) the parties’ ability to
meet expectations regarding the timing, completion and accounting and tax treatments of the transaction; (g) the possibility that any of the anticipated benefits of
the proposed transaction will not be realized or will not be realized within the expected time period; (h) the risk that integration of the parties’ operations will be
materially delayed or will be more costly or difficult than expected; (i) the failure of the proposed transaction to close for any other reason; (j) the effect of the
announcement of the transaction on customer relationships and operating results (including, without limitation, difficulties in maintaining relationships with
employees or customers); (k) dilution caused by issuance by Contura of additional shares of common stock in connection with the transaction; (l) the possibility
that the proposed transaction may be more expensive to complete than anticipated, including as a result of unexpected factors or events; and (m) the diversion
of management time on transaction related issues.
3
Transaction Highlights
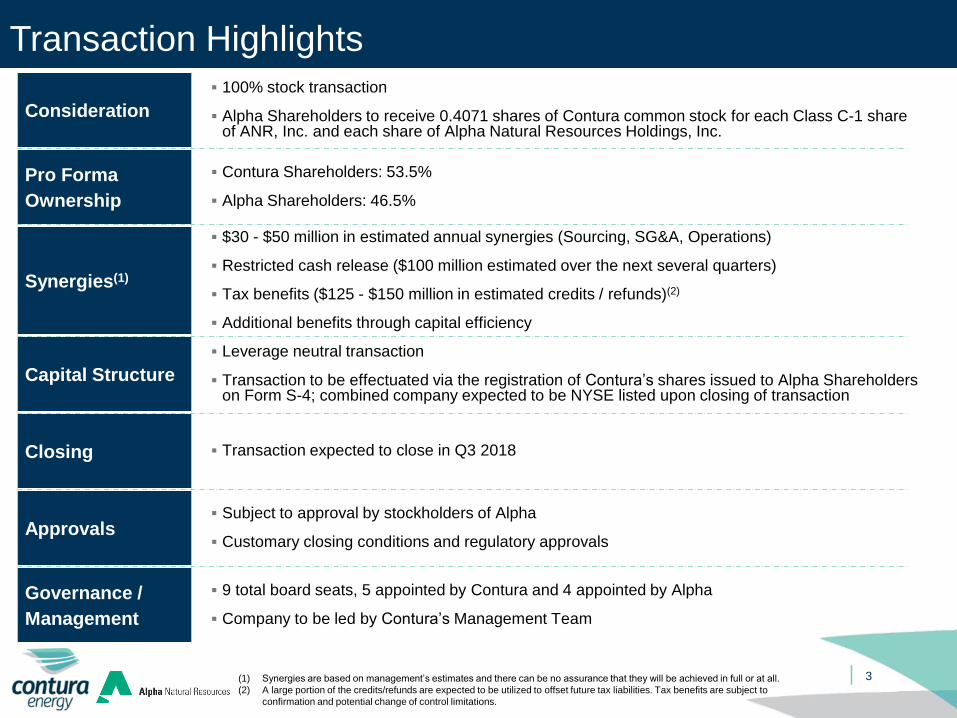
Consideration
▪ 100% stock transaction
▪ Alpha Shareholders to receive 0.4071 shares of Contura common stock for each Class C-1 share of ANR, Inc. and each share of Alpha Natural Resources Holdings, Inc.
Pro Forma
Ownership
▪ Contura Shareholders: 53.5%
▪ Alpha Shareholders: 46.5%
Synergies(1)
▪ $30 - $50 million in estimated annual synergies (Sourcing, SG&A, Operations)
▪ Restricted cash release ($100 million estimated over the next several quarters)
▪ Tax benefits ($125 - $150 million in estimated credits / refunds)(2)
▪ Additional benefits through capital efficiency
Capital Structure
▪ Leverage neutral transaction
▪ Transaction to be effectuated via the registration of Contura’s shares issued to Alpha Shareholders on Form S-4; combined company expected to be NYSE listed upon closing of transaction
Closing ▪ Transaction expected to close in Q3 2018
Approvals▪ Subject to approval by stockholders of Alpha
▪ Customary closing conditions and regulatory approvals
Governance /
Management
▪ 9 total board seats, 5 appointed by Contura and 4 appointed by Alpha
▪ Company to be led by Contura’s Management Team
(1) Synergies are based on management’s estimates and there can be no assurance that they will be achieved in full or at all.
(2) A large portion of the credits/refunds are expected to be utilized to offset future tax liabilities. Tax benefits are subject to
confirmation and potential change of control limitations.
4
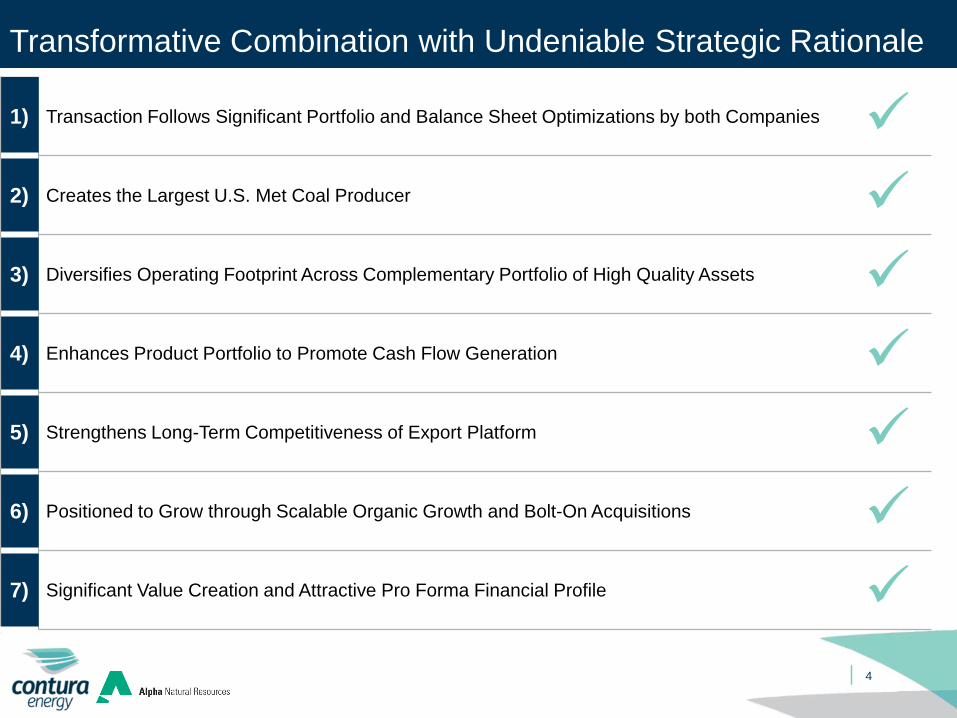
1) Transaction Follows Significant Portfolio and Balance Sheet Optimizations by both Companies
2) Creates the Largest U.S. Met Coal Producer
3) Diversifies Operating Footprint Across Complementary Portfolio of High Quality Assets
4) Enhances Product Portfolio to Promote Cash Flow Generation
5) Strengthens Long-Term Competitiveness of Export Platform
6) Positioned to Grow through Scalable Organic Growth and Bolt-On Acquisitions
7) Significant Value Creation and Attractive Pro Forma Financial Profile
Transformative Combination with Undeniable Strategic Rationale
✓
✓
✓
✓
✓
✓
✓

5
Contura / Alpha Timeline
2018 Footprint Map2015 Footprint Map
(1) See page 6 for transaction details.
ANR Files Chapter
11
(August ‘15)
Contura formed;
acquisition of select assets
completed (July ‘16)
ANR emerges
(July ‘16)
Contura acquires
majority stake in DTA
(March ‘17)
ANR divests majority
of idle/closed
properties to LCC
(October ‘17)(1)
Contura announces
ANR Transaction
(April ‘18)
2015 2016 2017 2018
Contura divests PRB
assets to Blackjewel
(December ‘17)(1)
6
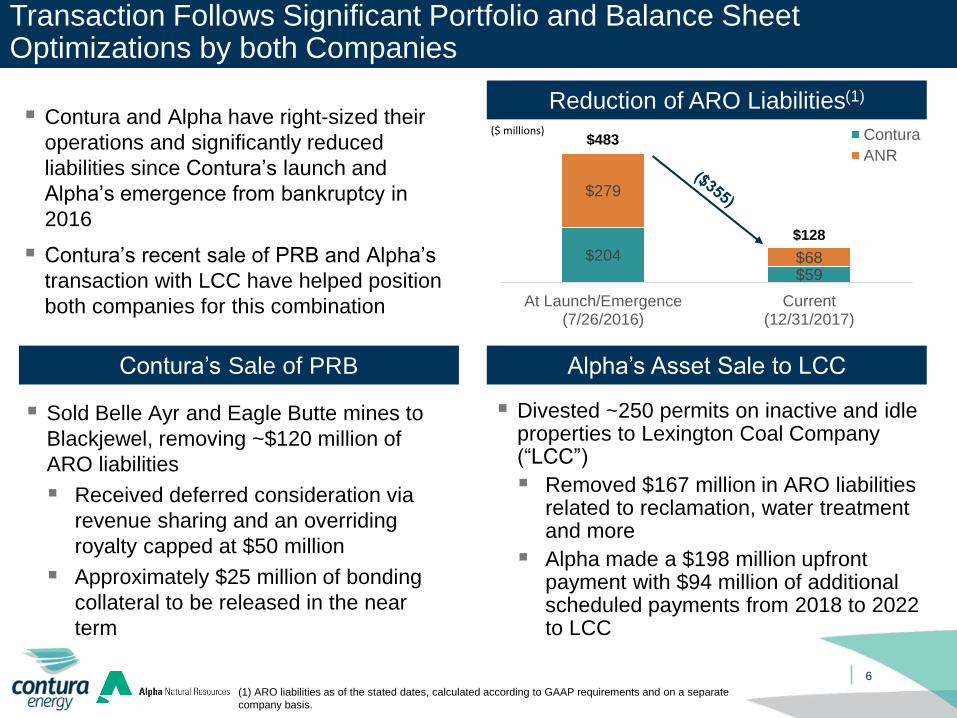
Transaction Follows Significant Portfolio and Balance Sheet Optimizations by both Companies
Alpha’s Asset Sale to LCCContura’s Sale of PRB
Reduction of ARO Liabilities(1)
$204
$59
$279
$68
At Launch/Emergence(7/26/2016)
Current(12/31/2017)
Contura
ANR
▪ Contura and Alpha have right-sized their
operations and significantly reduced
liabilities since Contura’s launch and
Alpha’s emergence from bankruptcy in
2016
▪ Contura’s recent sale of PRB and Alpha’s
transaction with LCC have helped position
both companies for this combination
▪ Sold Belle Ayr and Eagle Butte mines to
Blackjewel, removing ~$120 million of
ARO liabilities
▪ Received deferred consideration via
revenue sharing and an overriding
royalty capped at $50 million
▪ Approximately $25 million of bonding
collateral to be released in the near
term
▪ Divested ~250 permits on inactive and idle properties to Lexington Coal Company (“LCC”)
▪ Removed $167 million in ARO liabilities related to reclamation, water treatment and more
▪ Alpha made a $198 million upfront payment with $94 million of additional scheduled payments from 2018 to 2022 to LCC
$483
$128
($ millions)
(1) ARO liabilities as of the stated dates, calculated according to GAAP requirements and on a separate
company basis.

7
Creates a Premier U.S. Met Coal-Focused Company
2017A Met Coal Sales By U.S. Suppliers (million tons)
12.6
8.58.2
7.9
6.96.5
4.7
3.32.7
1.5
0.6
PFContura
Coronado Blackhawk Alpha Arch Warrior Contura MissionCoal
UnitedCoal
Corsa Ramaco
Source: Company Filings, Company Websites, SNL.
(1) Alpha’s reserves are currently being re-evaluated and may not comply with the SEC rules until the re-evaluation is complete.
(2) Alpha sales inclusive of 1.0 million of purchased coal.
(3) Contura’s 2017A Met Coal sales excludes Alpha’s contribution to the Trading & Logistics business.
▪ Post transaction Contura
will be the #1 U.S.
supplier of metallurgical
coal with over 12 million
tons of combined global
sales
▪ Contura and Alpha
combine to have one of
the world’s largest and
highest quality reserves
of metallurgical coal
▪ 1 billion tons of
combined
metallurgical coal
reserves(1)
(3)(2)

8
Diversifies Operating Footprint Across Complementary Portfolio of High Quality Assets
Toms Creek
McClure
Nicholas
Cumberland
DTA
Pennsylvania
Virginia
West VirginiaDelaware
Contura Complex
Export Terminal
Alpha Complex
▪ Merger substantially expands Contura’s scale adding 4 mining complexes in West Virginia, consisting of 20 highly-competitive mines
▪ Pro forma operating footprint of 8 mining complexes with 22 underground mines, 8 surface mines and 13 prep plants
▪ Operations strategically located in close proximity allowing for seamless combination
▪ Expands logistics platform to further strengthen strategic positioning and access to a broad mix of global customers
Mid WV Surface
Brooks Run South
Coal River East
Brooks Run West

22%
12%
8%
4%
27%
28%
12.4
6.2 4.8
2018 2019 2020
9
Enhances Product Portfolio to Promote Cash Flow Generation
Pro Forma Product Portfolio (2018E, tons sold)(1)
▪ Full suite of high-quality
metallurgical product
offerings
▪ Improves met coal
blending capabilities
▪ Provides flexibility to
respond to changes in
met coal product
demand
▪ Highly contracted steam
coal business
▪ Long-term steam coal
supply agreements
provide sales visibility
for several years
HVA
HVB
MV
LV
CAPP steam
Met: 46%
Highly Contracted Steam Position(2)
(1) Percentages may not add to 100% due to rounding.
(2) Assumes 100% of Contura CAPP is metallurgical and 100% of Contura NAPP is steam.
(3) Based on mid-point of guidance.
Committed and Priced (million tons)
(Contracted price/ton and priced volume as % of 2018E Sales)(3)
89%
$46.88
NAPP steam

10
Strengthens Long-Term Competitiveness of Export Platform
▪ Contura is among largest exporters of
metallurgical coal in the U.S.
▪ Increased export capacity through
incremental stake in DTA terminal
acquired in March 2017; currently own
65.0% interest in DTA
▪ Capability to blend captive and 3rd party
coal at DTA to achieve a broad portfolio of
coal qualities
▪ Cost synergies expected to give Contura
the ability to capture improved margins in
periods of elevated met coal pricing with
downside limited in lower pricing
environments
▪ Merger with Alpha bolsters future potential
of the export platform
Dominion Terminal Associates (DTA)
Attributable nameplate capacity of 14.3 mst provides
significant opportunity to expand export platform

Estimated
Annual
Production
(mm tons) Coal Quality
Contura
Freeport 2.5 – 3.5 Metallurgical
Deep Mine #42 1.0 – 1.5 Metallurgical
Alpha
Black Eagle 0.3 – 0.5 Metallurgical
Panther Eagle 0.3 – 0.5 Metallurgical
Road Fork 52 0.6 – 0.8 Metallurgical
Deep Mine #42
Freeport
Pennsylvania
Virginia
West Virginia
Toms Creek
McClure
Cumberland
11
Scalable Organic Growth and Bolt-On Acquisition Opportunities
Contura Development
Alpha Development
Overview of Organic Growth Projects
Acquisition Growth Opportunities
▪ Focus on current geographical footprint and growth of platform through bolt-on acquisitions which would
provide meaningful synergies
▪ Cash flow accretion is a priority for any acquisition
Road Fork 52
Black Eagle / Panther Eagle
Brooks Run South
Coal River East
Contura Current Asset
Alpha Current Asset

Significant Value Creation and Attractive Pro Forma Financial Position
▪ Increases size and scale with additional
metallurgical coal exposure
▪ Strategic alignment of export metallurgical
sales
▪ Balance sheet positioned to provide
flexibility around additional value creation
opportunities through organic growth or
returns to shareholders
▪ Additional liquidity in equity markets via
S-4 / uplist to NYSE
▪ $30 - $50 million in estimated annual
synergies(1)
Potential Value Uplift
3.4x 3.8x
4.8x
Contura Average MetProducer
Average CoalProducer
TEV / 2018E EBITDA
Illustrative
Pro Forma
TEV/EBITDA
Multiple
Implied Multiple
Uplift
Implied Change
In Pro Forma
Contura Stock
Price(4)
3.8x +0.4x 23%
4.4x +1.0x 48%
4.8x +1.4x 65%
Source: Capital IQ
Note: Market data is as of April 27, 2018 and Contura share price of $66.50 as of that date.
(1) Synergies are based on management’s estimates and there can be no assurance that they will be achieved in full or at all.
(2) Average Met Producers includes Arch Coal, Peabody Energy and Warrior Met Coal. Following Warrior Met Coal’s $350 million special dividend
paid April 20, 2018, the company’s capital structure is based on Q1 2018E capital structure as per Wall Street analyst estimates.
(3) Average Coal Producers defined as U.S. Coal Producers with Enterprise Value in excess of $500 million. Includes Arch Coal, Cloud Peak Energy,
Peabody Energy, Warrior Met Coal, Alliance Resource Partners, Foresight Energy and CONSOL Coal Resources.
(4) For illustrative purposes only. Based solely on Contura’s 2018E EBITDA of $274 million, as per Wall Street Research estimates, and Alpha’s
2017A adjusted EBITDA of $223 million plus illustrative $40 million of synergies, based on the mid-point of guidance.
(2) (3)
12

Industry Dynamics
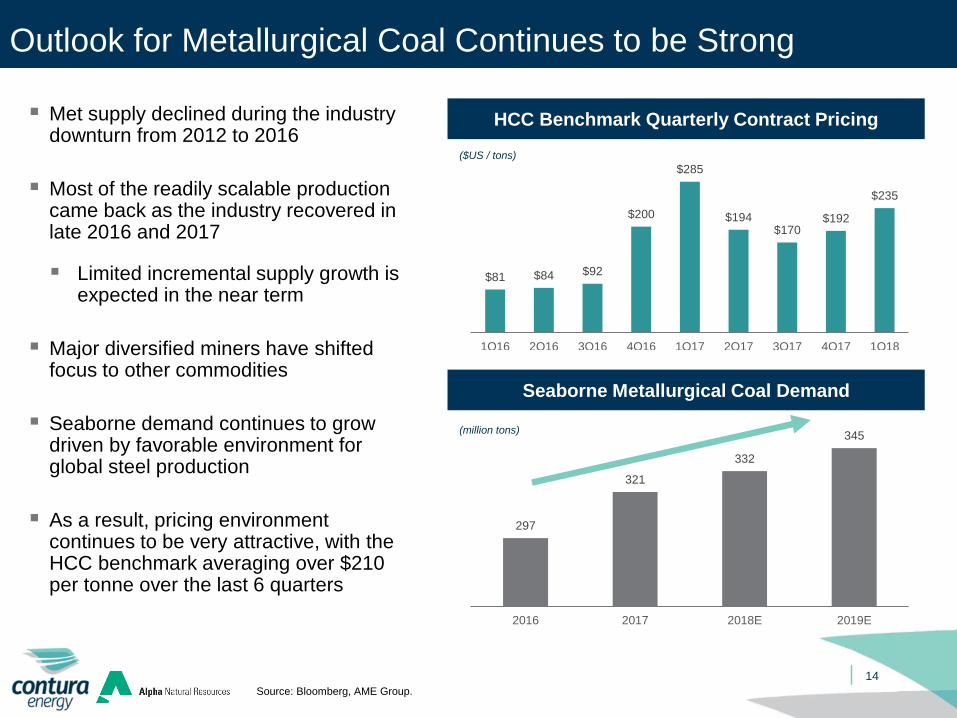
Outlook for Metallurgical Coal Continues to be Strong
Source: Bloomberg, AME Group.
($US / tons)
HCC Benchmark Quarterly Contract Pricing
14
$81 $84 $92
$200
$285
$194$170
$192
$235
1Q16 2Q16 3Q16 4Q16 1Q17 2Q17 3Q17 4Q17 1Q18
Seaborne Metallurgical Coal Demand
▪ Met supply declined during the industry downturn from 2012 to 2016
▪ Most of the readily scalable production came back as the industry recovered in late 2016 and 2017
▪ Limited incremental supply growth is expected in the near term
▪ Major diversified miners have shifted focus to other commodities
▪ Seaborne demand continues to grow driven by favorable environment for global steel production
▪ As a result, pricing environment continues to be very attractive, with the HCC benchmark averaging over $210 per tonne over the last 6 quarters
297
321
332
345
2016 2017 2018E 2019E
(million tons)

$40
$45
$50
$55
$60
Jan-16 May-16 Oct-16 Feb-17 Jul-17 Nov-17 Mar-18
Outlook for Steam Coal Improving
Source: SNL, Bloomberg, EIA.
(1) CAPP steam coal pricing based on NYMEX Big Sandy 12,000 1.67 Barge.
(2) NAPP steam coal pricing based on Pittsburgh Seam 13,000 3.00 Rail.
15
Henry Hub Natural Gas Pricing
(US$ / mmBTU)
▪ Political / regulatory environment in the
U.S. continues to be constructive as
the Trump administration has rolled
back a number of regulations and
taken some pressure off domestic coal
producers
▪ Steam coal is expected to remain a
key fuel source for the U.S. electric
power industry over the long-term, the
EIA projects that coal will represent
31% of energy source for the industry
over the next 10 years
▪ Natural gas prices have remained
above $2.50/mmBTU since mid-2016
U.S. Steam Coal Pricing
CAPP(1) NAPP(2)
$1
$2
$3
$4
Jan-16 May-16 Sep-16 Feb-17 Jun-17 Nov-17 Mar-18
(US$ / ton)
Financial Highlights
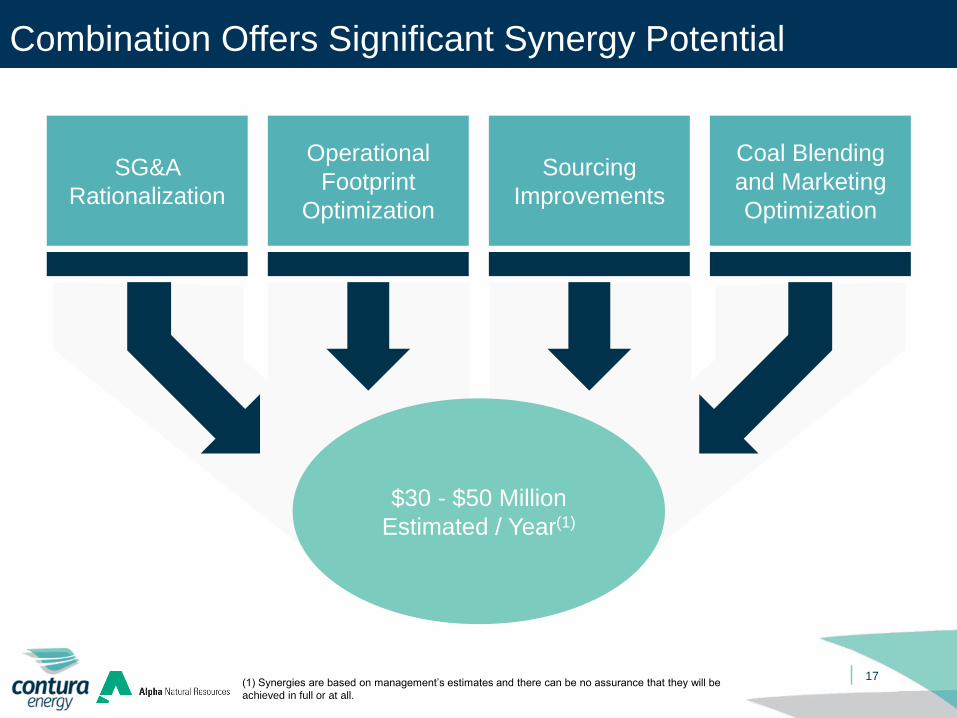
$30 - $50 Million
Estimated / Year(1)
17
Combination Offers Significant Synergy Potential
Operational
Footprint
Optimization
Sourcing
Improvements
SG&A
Rationalization
Coal Blending
and Marketing
Optimization
(1) Synergies are based on management’s estimates and there can be no assurance that they will be
achieved in full or at all.

18
Combined Financial Snapshot
(US$ millions)Contura
Energy(1) AlphaT&L
Eliminations(2) SynergiesCombined
Company(3)
Met Tons Sold (mm) 8.9 7.9 (4.2) 12.6
Total Tons Sold (mm) 15.7 14.9 (4.2) 26.4
Revenue (US$ millions) $1,650 $1,236 ($478) $2,408
Adjusted EBITDA (US$ millions) $258 $223 $30 - $50(4) $521(5)
CapEx (US$ millions) $73 $57 $130
2017A Performance
Source: Company Filings, Company Information.
(1) Contura performance excludes $42 million of EBITDA and $10 million of Capital Expenditures from Powder River Basin assets.
(2) Trading & Logistics business eliminations represent items that will become intercompany sales following the combination of Contura and
Alpha.
(3) Represents combined operations and not calculated on a pro forma basis in compliance with SEC rules.
(4) Does not include costs necessary to achieve synergies.
(5) Calculated using illustrative $40 million of synergies, based on the mid-point of guidance.

19
Combined Financial Outlook
(millions tons, unless noted) Low High
Shipments
CAPP – Metallurgical (Mt) 10.5 11.9
CAPP – Steam (Mt) 6.2 6.8
NAPP (Mt) 7.1 7.7
Total Captive 23.8 26.4
T+L – Metallurgical 0.5 1.5
Total Shipments 24.3 27.9
Cost per ton
CAPP $63.70 $67.53
NAPP $29.00 $33.00
Margin per ton
T&L $9.00 $15.00
(US$ millions, except taxes)
SG&A(1) $59.0 $65.0
Idle Operations Expense 19.5 22.5
Cash Interest Expense 36.5 39.5
Capital Expenditures 131.0 146.0
Cash Tax Rate 0% 5%
2018E Combined Outlook
Source: Company Press Releases.
Note: Figures represent combined operations and are not calculated on a pro forma basis in compliance with SEC rules.
(1) SG&A excludes impact of estimated synergies. SG&A does not include expenses related to non-cash stock
compensation and accrual of incentive bonuses.

20
Sustainable, Well Capitalized Balance Sheet
Improved Capital Structure, Strong Liquidity and Free Cash Flow
(US$ millions)Contura
EnergyAlpha Synergies
Combined
Company(1)
2017A Adjusted EBITDA $258(2) $223 $30 - $50(3) $521(4)
Total Debt(5) $391 $241 $632
Net Debt(5) $249 $195 $444
Total Debt / 2017A Adjusted EBITDA 1.5x 1.1x 1.2x
Net Debt / 2017A Adjusted EBITDA 1.0x 0.9x 0.9x
Legacy Liabilities(6) $119 $528 $647
Liquidity
Cash and Equivalents(7) $142 $46 $188
Available Revolver and A/R Securitization Facility $114 -- $114
Total Liquidity $256 $46 $302
Key Takeaways
▪ Strong balance sheet with limited debt, significant cash and liquidity, generating free cash flow
▪ Transaction will be leverage neutral following the combination
▪ Plan to further optimize capital structure in the near term
▪ Management strategy is to continue evaluating the return of capital to equity holders while maintaining a strong balance sheet
through the cycle
Source: Company Filings, Company Information.
Note: All balance sheet amounts are as of December 31, 2017.
(1) Represents combined operations and not calculated on a pro forma basis in compliance with SEC rules.
(2) Contura EBITDA excludes of $42 million of EBITDA from Powder River Basin assets.
(3) Does not include costs necessary to achieve synergies.
(4) Calculated using illustrative $40 million of synergies, based on the mid-point of guidance.
(5) Excludes debt discount, debt issuance costs and transaction costs. Net debt defined as Total Debt less Cash and Cash Equivalents.
(6) Legacy liabilities include Workers’ Compensation, Black Lung, Life Insurance, ARO, and Pension and OPEB liabilities. All amounts are stated in gross
terms and have not been adjusted to net-out related insurance receivables. Additionally, restricted cash and deposits of $67 million for Contura and
$297 million for Alpha, which back these liabilities, have not been netted from these amounts. Excludes liabilities on assets held for sale.
(7) Cash does not include any restricted cash releases or tax benefits.

Appendix

22
Net Income to Adjusted EBITDA Reconciliation
In addition to U.S. GAAP financials, this presentation includes certain non-GAAP financial measures. These non-GAAP measures are in addition to, not a substitute for or superior to, measures of financial performance prepared in accordance with U.S. GAAP. A reconciliation of non-GAAP measures to GAAP measures is provided below.
Year ended December 31, 2017 (US$ Thousands) Contura Energy Alpha
Net income (loss) $154,522 ($38,886)
(Loss) from discontinued operations (19,213) (156,076)
Net income from continuing operations $173,735 $117,190
Interest expense 35,977 14,504
Interest (income) (210) (2,788)
Income tax expense / (benefit) (67,979) 17,584
Depreciation, depletion and amortization 34,910 14,710
Mark-to-market adjustment - acquisition-related obligations 3,221 15,112
Gain on settlement of acquisition-related obligations (38,886) --
Secondary offering costs 4,491 --
Loss on early extinguishment of debt 38,701 16,348
Bargain purchase gain (1,011) --
Accretion expense 9,934 22,733
Amortization of acquired intangibles, net 59,007 7,684
Expenses related to dividend 6,367 --
Adjusted EBITDA $258,257 $223,077