convenience store merchandising study pt1 store... · znacs state of the industry report identified...
TRANSCRIPT
0
Gen
eric
Pre
sena
tion/
4-25
-05/
N:p
pt
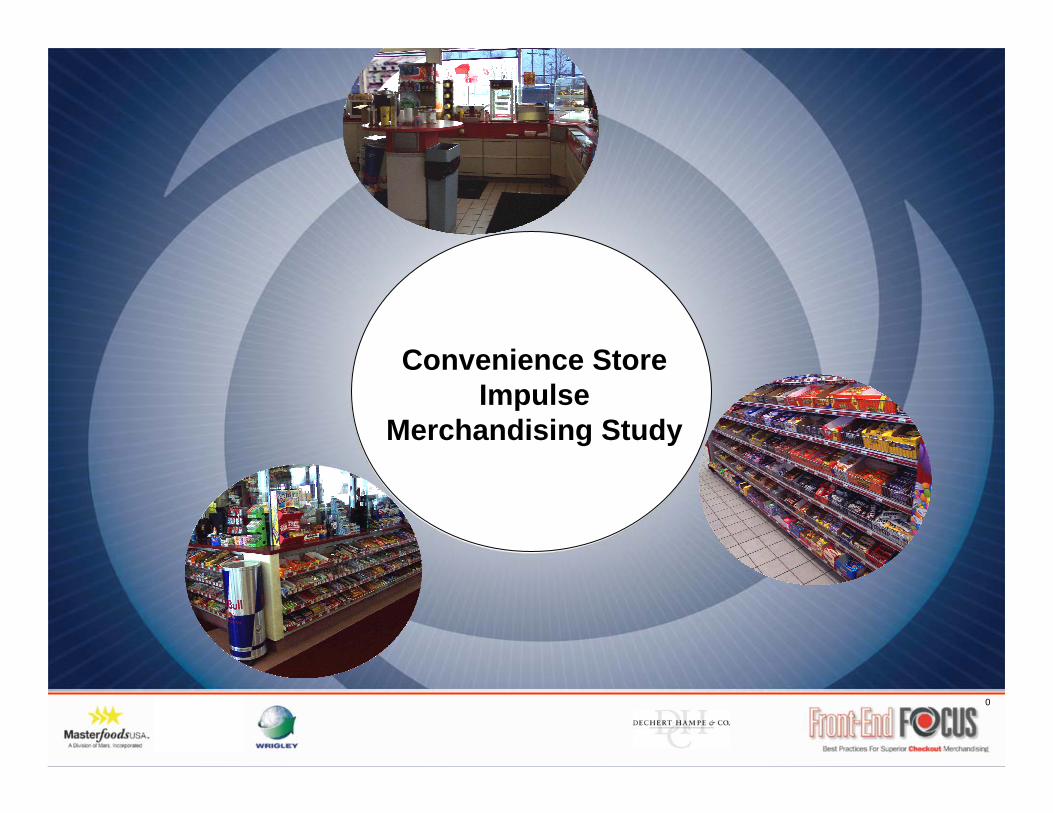
Convenience Store Impulse
Merchandising Study
1
Gen
eric
Pre
sena
tion/
4-25
-05/
N:p
pt
Key Issues Facing Convenience Retailers
NACS State of the Industry Report identified that pre-tax profits had rebounded in 2003, after 3 years of declines and for the first time in many years actual store counts were down
Pay at the pump and shrinking gasoline margins are a sizeable industry threat
Traditional high volume tobacco sales continue to decline
Labor costs on the rise
Household penetration is flat as is shopping frequency
Drug stores targeting the Convenience tripSource: MVI, Retail Forward;DHC.
2
Gen
eric
Pre
sena
tion/
4-25
-05/
N:p
pt
Opportunities For Channel Growth
Expansion of Food Service offerings
Understanding the impact of changing consumer demographics
Driving more gas purchasers into the store
Drive up the size of the market basket
Focusing on product mix to maximize your most profitable categories
Sharing merchandising best practices
Source: MVI, Retail Forward; DHC.
3
Gen
eric
Pre
sena
tion/
4-25
-05/
N:p
pt
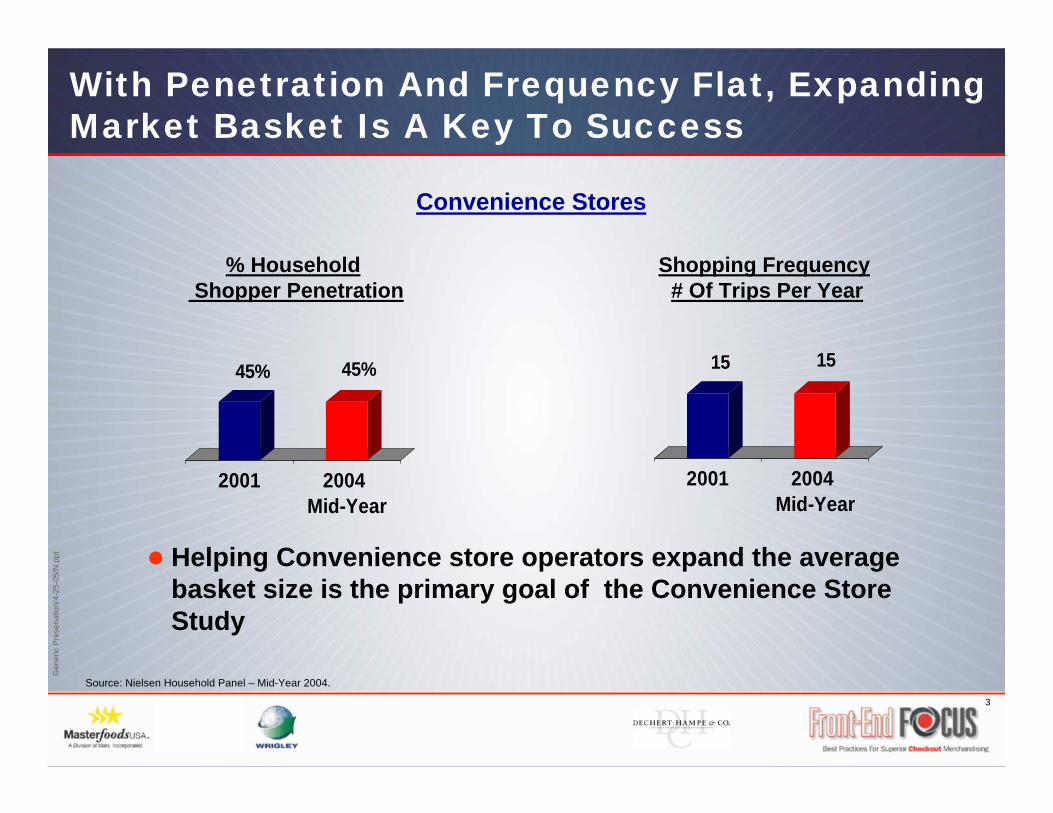
With Penetration And Frequency Flat, Expanding Market Basket Is A Key To Success
% Household Shopper Penetration
Shopping Frequency # Of Trips Per Year
Helping Convenience store operators expand the average basket size is the primary goal of the Convenience Store Study
Source: Nielsen Household Panel – Mid-Year 2004.
45% 45%
2001 2004 Mid-Year
15 15
2001 2004 Mid-Year
Convenience Stores
4
Gen
eric
Pre
sena
tion/
4-25
-05/
N:p
pt
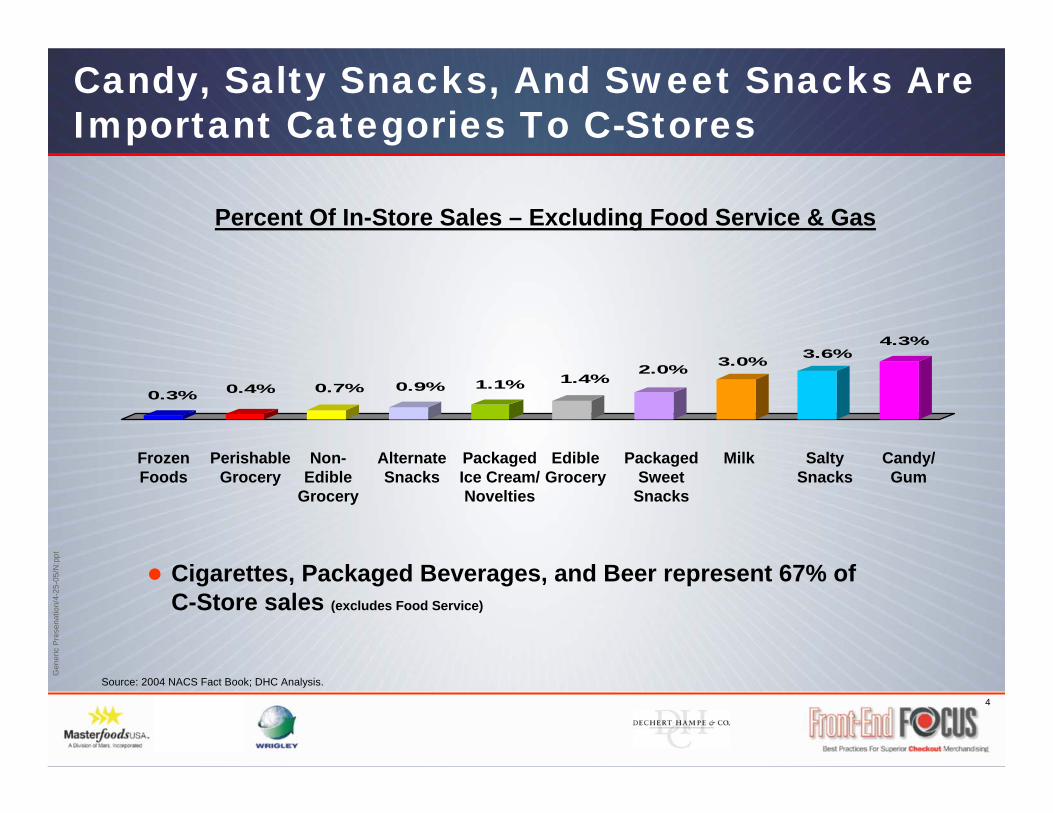
0.3% 0.4% 0.7% 0.9% 1.1% 1.4%2.0% 3.0% 3.6%
4.3%
Candy, Salty Snacks, And Sweet Snacks Are Important Categories To C-Stores
Source: 2004 NACS Fact Book; DHC Analysis.
Percent Of In-Store Sales – Excluding Food Service & Gas
Frozen Foods
Perishable Grocery
Non-Edible
Grocery
Alternate Snacks
Packaged Ice Cream/ Novelties
Edible Grocery
Packaged Sweet
Snacks
Milk Salty Snacks
Candy/ Gum
Cigarettes, Packaged Beverages, and Beer represent 67% of C-Store sales (excludes Food Service)
5
Gen
eric
Pre
sena
tion/
4-25
-05/
N:p
pt
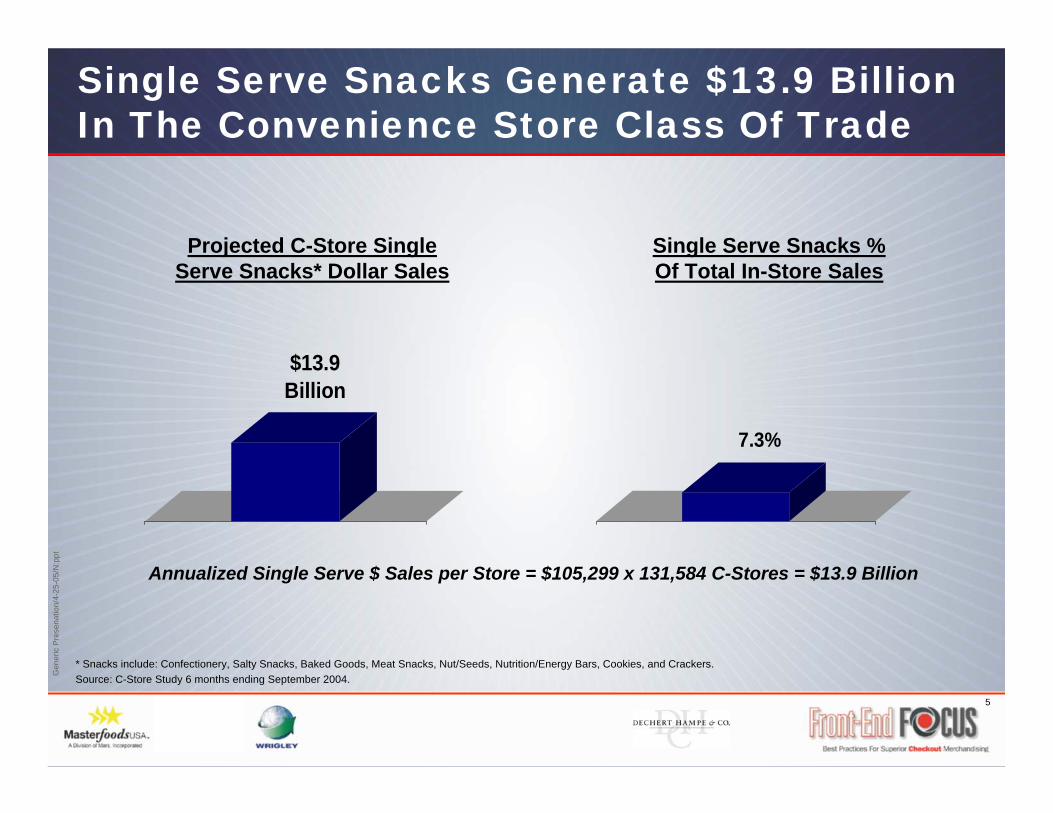
Single Serve Snacks Generate $13.9 Billion In The Convenience Store Class Of Trade
* Snacks include: Confectionery, Salty Snacks, Baked Goods, Meat Snacks, Nut/Seeds, Nutrition/Energy Bars, Cookies, and Crackers.Source: C-Store Study 6 months ending September 2004.
Annualized Single Serve $ Sales per Store = $105,299 x 131,584 C-Stores = $13.9 Billion
$13.9 Billion
Projected C-Store Single Serve Snacks* Dollar Sales
Single Serve Snacks % Of Total In-Store Sales
7.3%
6
Gen
eric
Pre
sena
tion/
4-25
-05/
N:p
pt
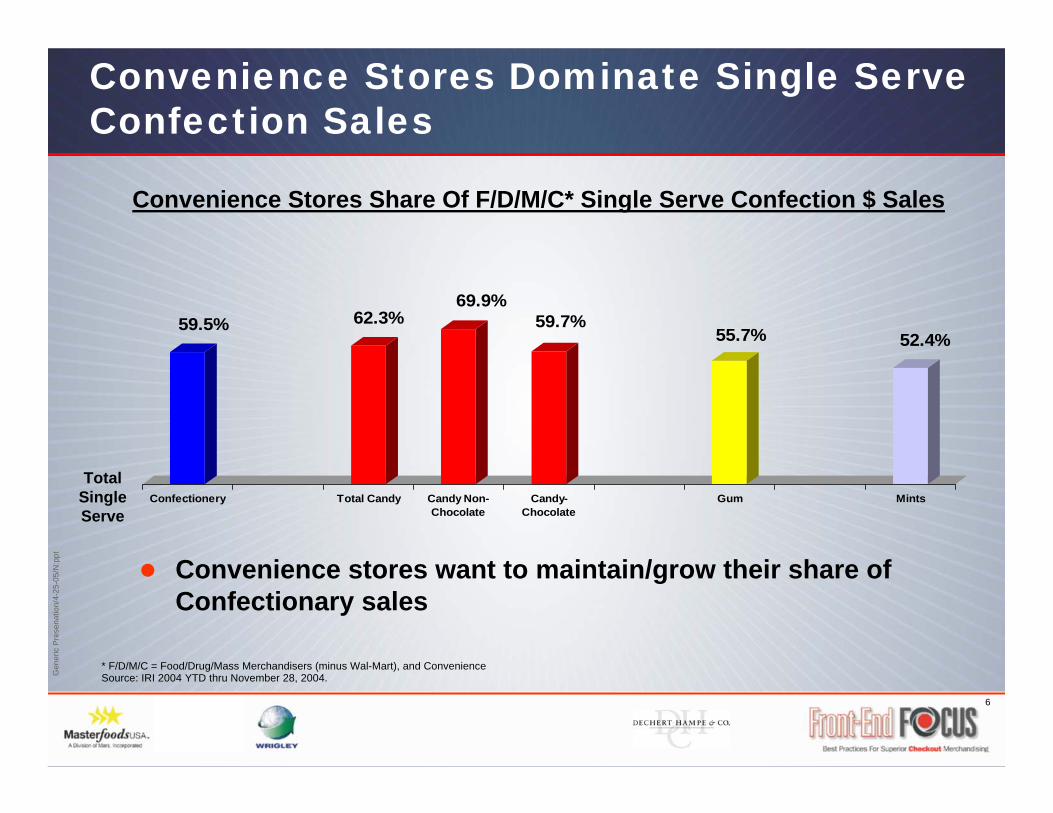
59.5% 62.3%69.9%
59.7%55.7% 52.4%
Confectionery Total Candy Candy Non-Chocolate
Candy-Chocolate
Gum Mints
Convenience Stores Dominate Single Serve Confection Sales
Source: IRI 2004 YTD thru November 28, 2004.
Convenience stores want to maintain/grow their share of Confectionary sales
Convenience Stores Share Of F/D/M/C* Single Serve Confection $ Sales
Total Single Serve
* F/D/M/C = Food/Drug/Mass Merchandisers (minus Wal-Mart), and Convenience
7
Gen
eric
Pre
sena
tion/
4-25
-05/
N:p
pt
Leadership
8
Gen
eric
Pre
sena
tion/
4-25
-05/
N:p
pt
Key Elements Of Leadership
Retailer/manufacturer partnerships can improve results for all stakeholders
Leadership is based on an understanding of consumer shopping behavior
Leadership means turning learning and ideas into executable in-store solutions
9
Gen
eric
Pre
sena
tion/
4-25
-05/
N:p
pt
Leadership Starts With Partnership
Formation of a leadership council including the following manufacturers:
Masterfoods USA, a Division of Mars, Incorporated
The Wm. Wrigley Jr. Company
In partnership with Dechert-Hampe & Company, an independent research and consulting firm
10
Gen
eric
Pre
sena
tion/
4-25
-05/
N:p
pt
Mission Of The Group
To work in partnership with retail customers and other stakeholders to improve store performance and enhance consumer satisfaction through:
New learning and consumer knowledge
Developing benchmarks and Best Practices
Innovative solutions to optimize in-store merchandising
11
Gen
eric
Pre
sena
tion/
4-25
-05/
N:p
pt
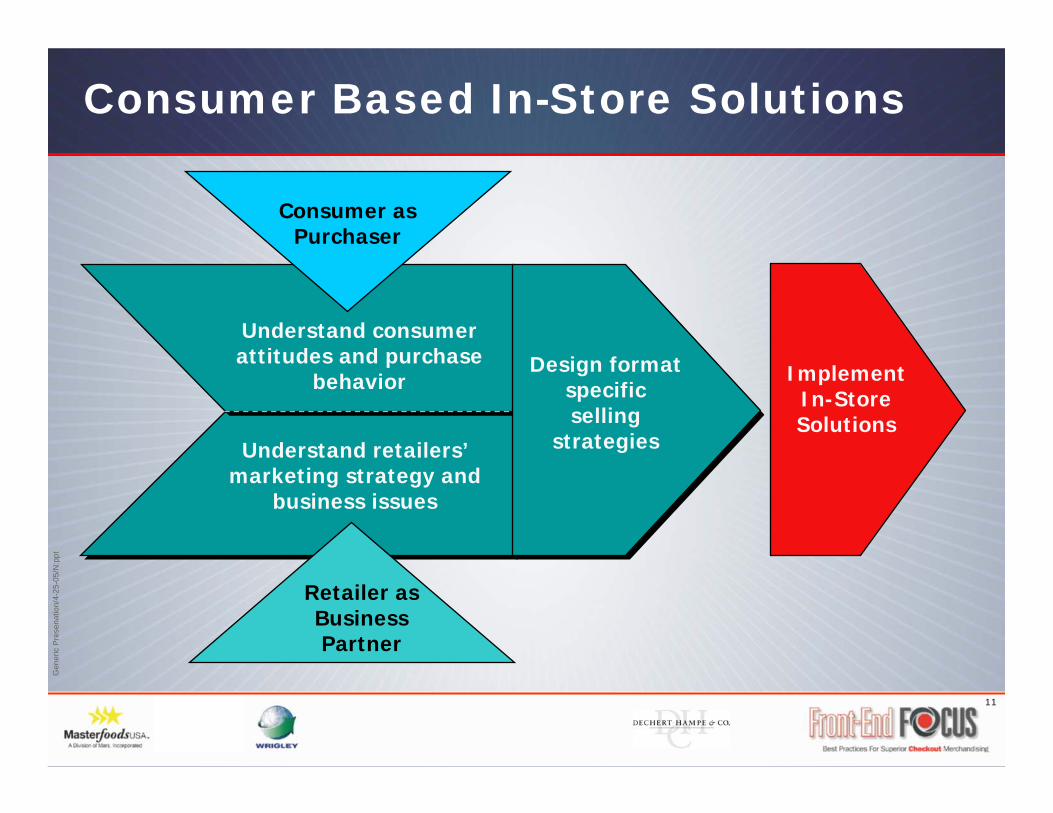
Consumer Based In-Store Solutions
Design format specific selling
strategiesUnderstand retailers’ marketing strategy and
business issues
Understand consumer attitudes and purchase
behavior Implement In-Store Solutions
Consumer as Purchaser
Retailer as Business Partner
12
Gen
eric
Pre
sena
tion/
4-25
-05/
N:p
pt
Convenience Store Merchandising Study
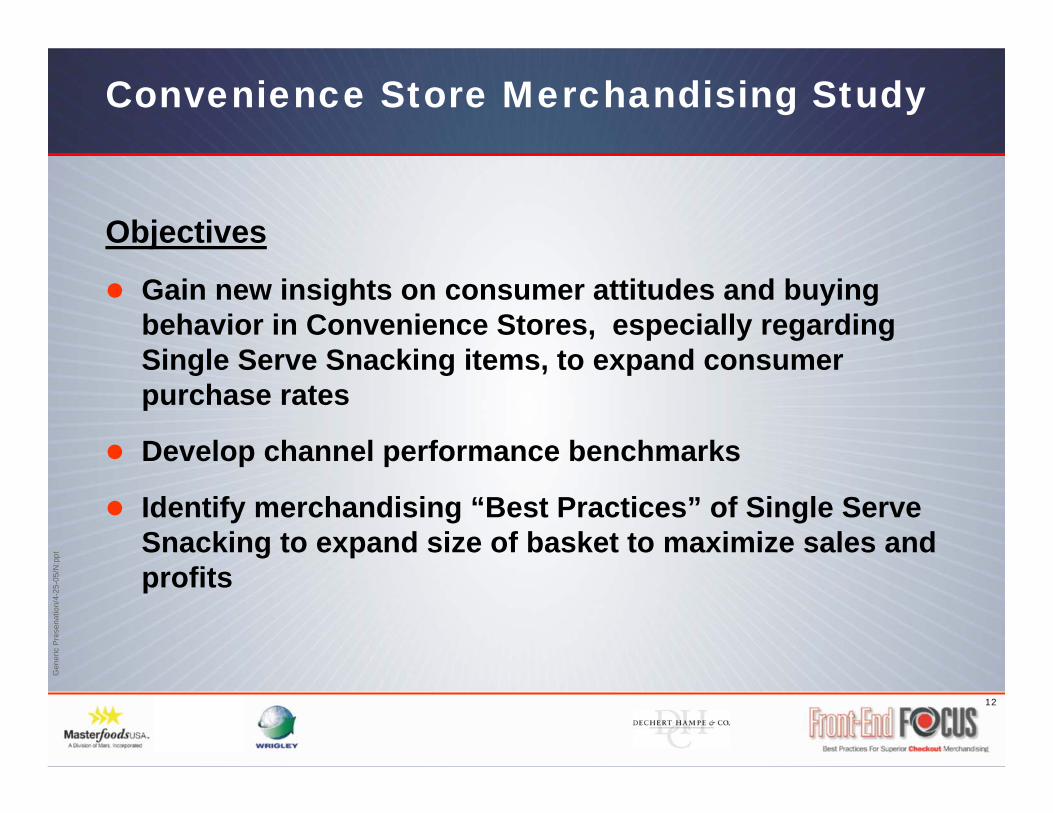
Objectives
Gain new insights on consumer attitudes and buying behavior in Convenience Stores, especially regarding Single Serve Snacking items, to expand consumer purchase rates
Develop channel performance benchmarks
Identify merchandising “Best Practices” of Single Serve Snacking to expand size of basket to maximize sales and profits
13
Gen
eric
Pre
sena
tion/
4-25
-05/
N:p
pt
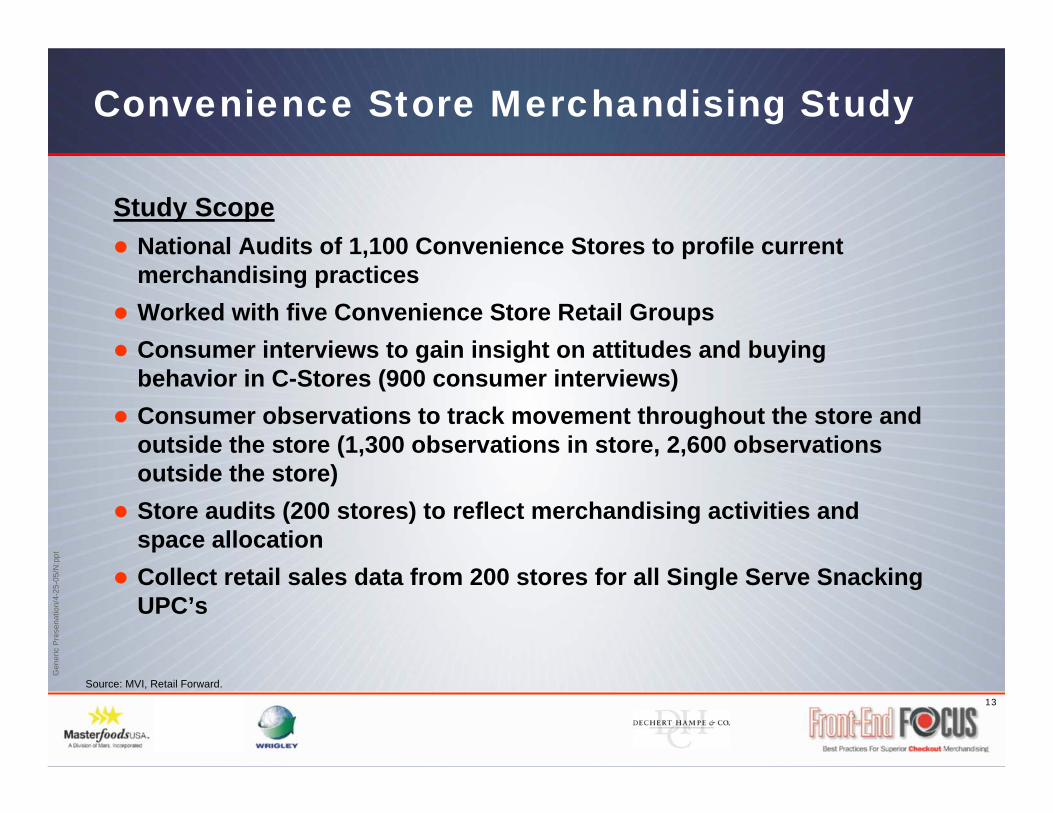
Convenience Store Merchandising Study
Study ScopeNational Audits of 1,100 Convenience Stores to profile current merchandising practicesWorked with five Convenience Store Retail GroupsConsumer interviews to gain insight on attitudes and buying behavior in C-Stores (900 consumer interviews)Consumer observations to track movement throughout the store andoutside the store (1,300 observations in store, 2,600 observations outside the store)Store audits (200 stores) to reflect merchandising activities and space allocationCollect retail sales data from 200 stores for all Single Serve Snacking UPC’s
Source: MVI, Retail Forward.
14
Gen
eric
Pre
sena
tion/
4-25
-05/
N:p
pt
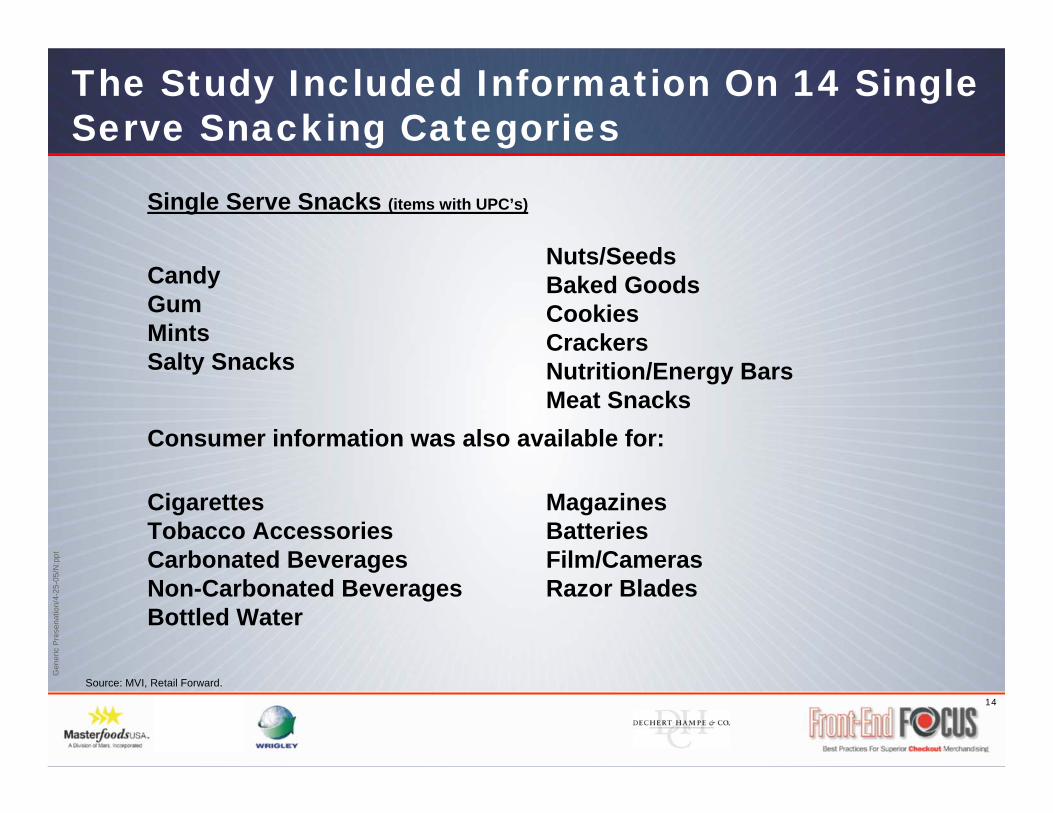
The Study Included Information On 14 Single Serve Snacking Categories
Source: MVI, Retail Forward.
Nuts/SeedsBaked GoodsCookies CrackersNutrition/Energy BarsMeat Snacks
CandyGumMints Salty Snacks
Magazines BatteriesFilm/CamerasRazor Blades
CigarettesTobacco AccessoriesCarbonated BeveragesNon-Carbonated BeveragesBottled Water
Consumer information was also available for:
Single Serve Snacks (items with UPC’s)
15
Gen
eric
Pre
sena
tion/
4-25
-05/
N:p
pt
Consumer Learning
16
Gen
eric
Pre
sena
tion/
4-25
-05/
N:p
pt
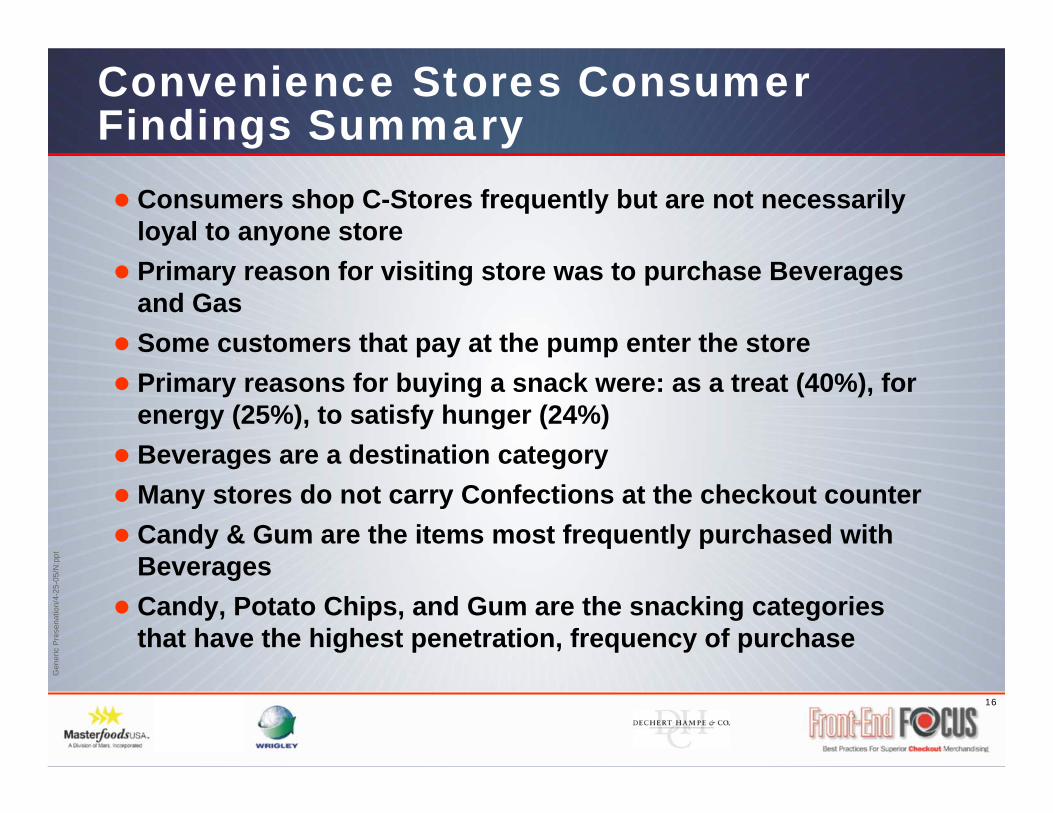
Convenience Stores Consumer Findings Summary
Consumers shop C-Stores frequently but are not necessarily loyal to anyone storePrimary reason for visiting store was to purchase Beverages and GasSome customers that pay at the pump enter the store Primary reasons for buying a snack were: as a treat (40%), for energy (25%), to satisfy hunger (24%)Beverages are a destination categoryMany stores do not carry Confections at the checkout counterCandy & Gum are the items most frequently purchased with BeveragesCandy, Potato Chips, and Gum are the snacking categories that have the highest penetration, frequency of purchase
17
Gen
eric
Pre
sena
tion/
4-25
-05/
N:p
pt
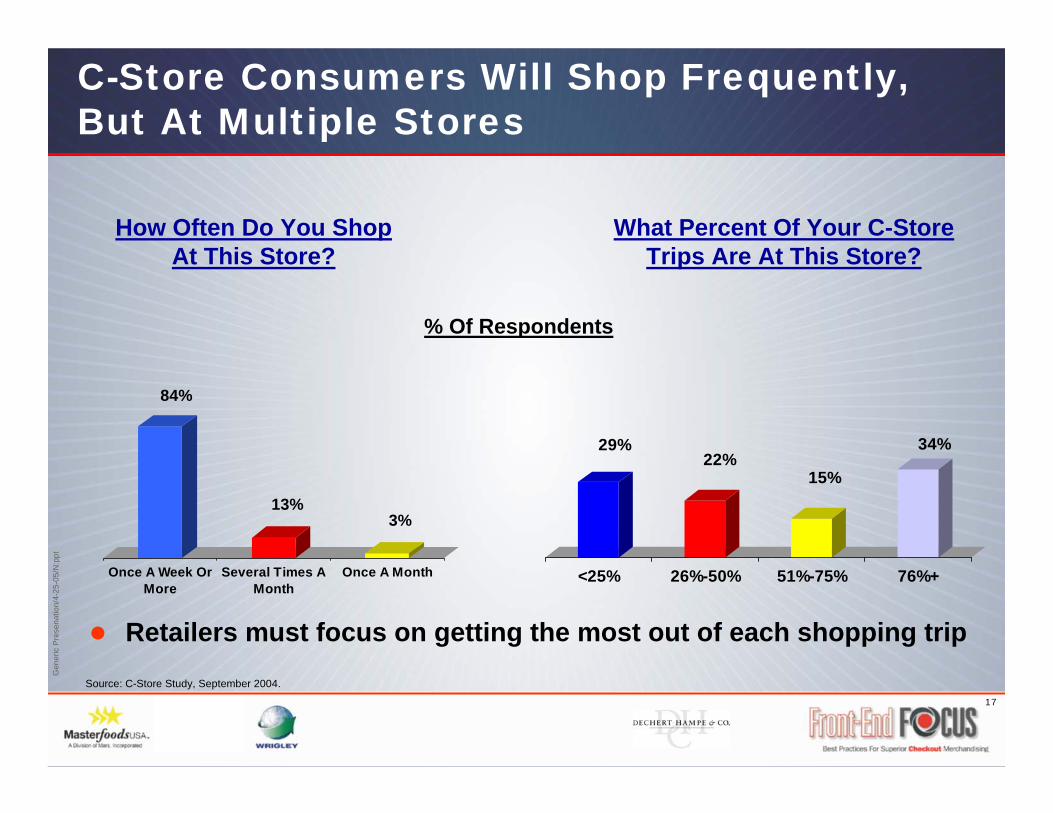
84%
13%3%
Once A Week OrMore
Several Times AMonth
Once A Month
C-Store Consumers Will Shop Frequently, But At Multiple Stores
What Percent Of Your C-Store Trips Are At This Store?
29%22%
15%
34%
<25% 26%-50% 51%-75% 76%+
Source: C-Store Study, September 2004.
% Of Respondents
Retailers must focus on getting the most out of each shopping trip
How Often Do You Shop At This Store?
18
Gen
eric
Pre
sena
tion/
4-25
-05/
N:p
pt
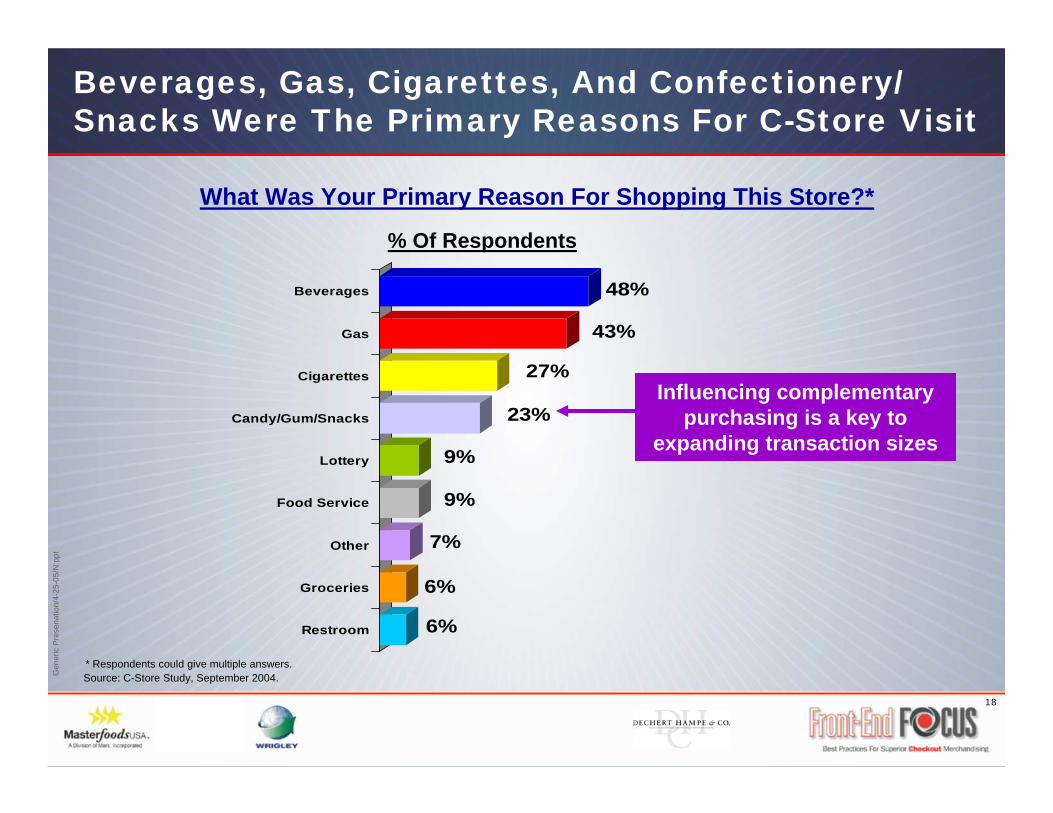
6%
6%
7%
9%
9%
23%
27%
43%
48%
Restroom
Groceries
Other
Food Service
Lottery
Candy/Gum/Snacks
Cigarettes
Gas
Beverages
Beverages, Gas, Cigarettes, And Confectionery/ Snacks Were The Primary Reasons For C-Store Visit
What Was Your Primary Reason For Shopping This Store?*
Source: C-Store Study, September 2004.
% Of Respondents
* Respondents could give multiple answers.
Influencing complementary purchasing is a key to
expanding transaction sizes
19
Gen
eric
Pre
sena
tion/
4-25
-05/
N:p
pt
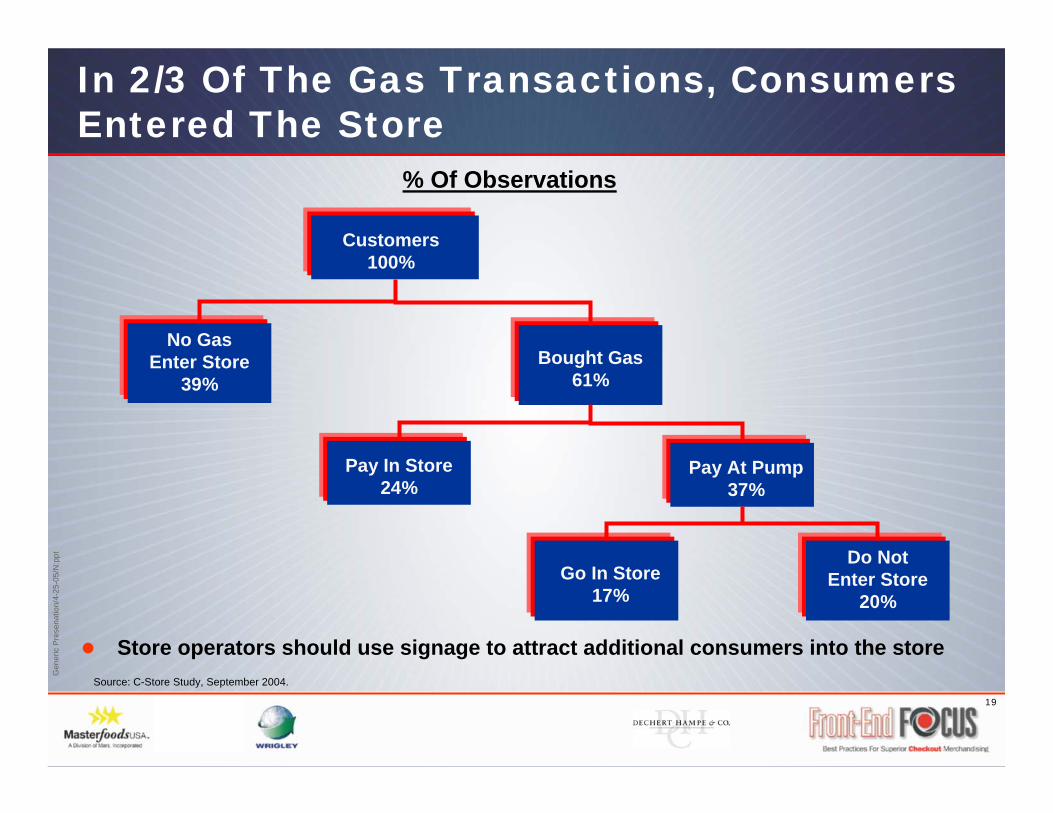
In 2/3 Of The Gas Transactions, Consumers Entered The Store
Source: C-Store Study, September 2004.
Store operators should use signage to attract additional consumers into the store
Do Not Enter Store
20%
No Gas Enter Store
39%
Go In Store17%
Pay At Pump37%
Bought Gas61%
Customers100%
Pay In Store24%
% Of Observations
20
Gen
eric
Pre
sena
tion/
4-25
-05/
N:p
pt
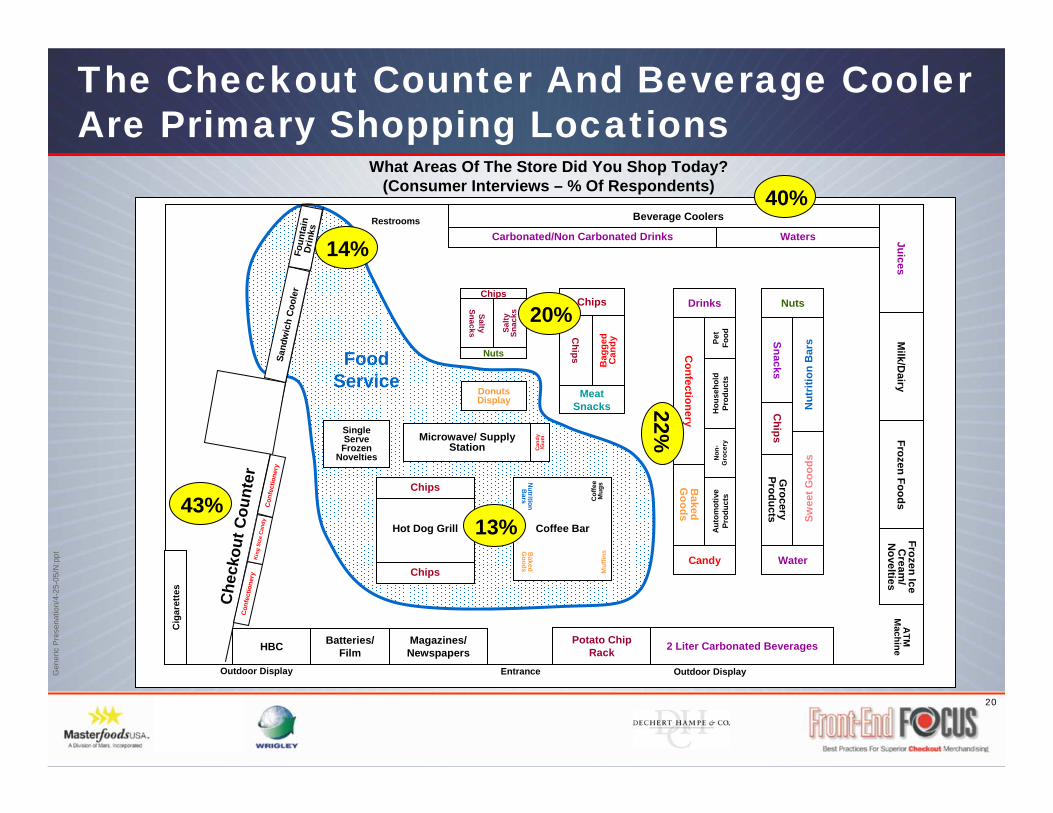
The Checkout Counter And Beverage Cooler Are Primary Shopping Locations
JuicesM
ilk/Dairy
Frozen FoodsFrozen Ice
Cream
/N
oveltiesA
TM
Machine
Potato Chip Rack 2 Liter Carbonated Beverages
Nut
ritio
n B
ars
Swee
t Goo
ds
SnacksG
rocery Products
Nuts
Chips
Water
Bag
ged
Can
dy
Chips
Chips
Meat Snacks
Salty
Sn
acksSalty
Snacks
Chips
Nuts
Donuts Display
Hot Dog Grill
Chips
Chips
HBC Batteries/ Film
Magazines/ Newspapers
Single Serve Frozen
Novelties
Restrooms
Cig
aret
tes
Che
ckou
t Cou
nter
Con
fect
ione
ryK
ing
Size
Can
dyC
onfe
ctio
nery
Sand
wic
h C
oole
rFo
unta
in
Drin
ks
Outdoor Display Outdoor DisplayEntrance
Coffee BarN
utritionB
ars Cof
fee
Mug
sM
uffin
sBaked
Goods
Aut
omot
ive
Prod
ucts
Confectionery
Baked
Goods
Drinks
Candy
Non
-G
roce
ryH
ouse
hold
Pr
oduc
tsPe
t Fo
od
Microwave/ Supply Station C
andy
/Gum
Food Service
Carbonated/Non Carbonated Drinks Waters
Beverage Coolers
What Areas Of The Store Did You Shop Today?(Consumer Interviews – % Of Respondents)
20%
22%
14%
13%
40%
43%
21
Gen
eric
Pre
sena
tion/
4-25
-05/
N:p
pt
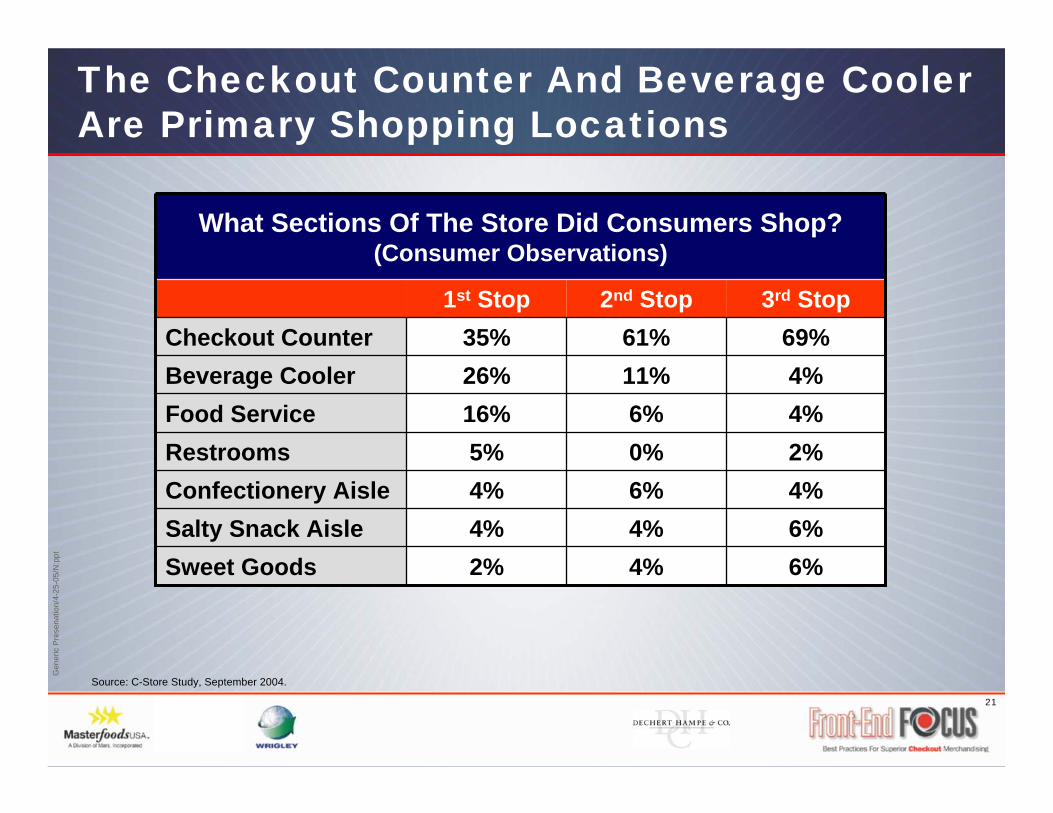
The Checkout Counter And Beverage Cooler Are Primary Shopping Locations
Source: C-Store Study, September 2004.
6%4%2%Sweet Goods6%4%4%Salty Snack Aisle4%6%4%Confectionery Aisle2%0%5%Restrooms4%6%16%Food Service4%11%26%Beverage Cooler
69%61%35%Checkout Counter3rd Stop2nd Stop1st Stop
What Sections Of The Store Did Consumers Shop?(Consumer Observations)
22
Gen
eric
Pre
sena
tion/
4-25
-05/
N:p
pt
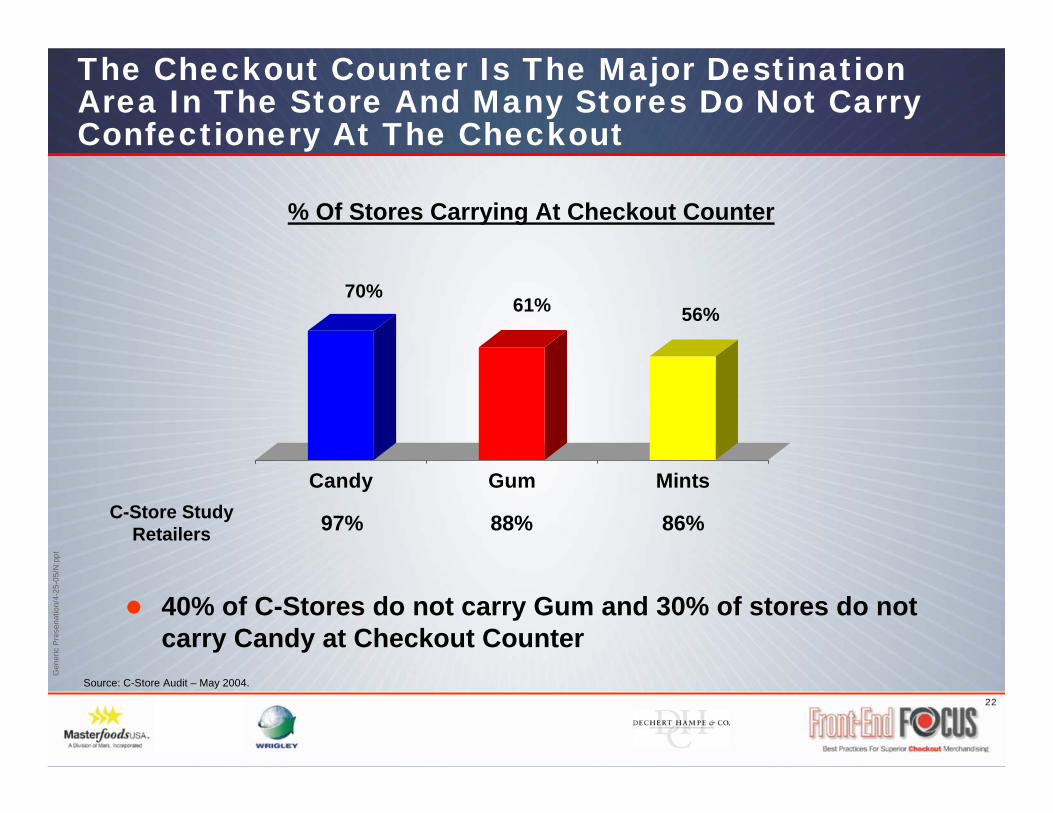
The Checkout Counter Is The Major Destination Area In The Store And Many Stores Do Not Carry Confectionery At The Checkout
% Of Stores Carrying At Checkout Counter
70%61% 56%
Candy Gum Mints
Source: C-Store Audit – May 2004.
40% of C-Stores do not carry Gum and 30% of stores do not carry Candy at Checkout Counter
86%88%97%C-Store Study Retailers
23
Gen
eric
Pre
sena
tion/
4-25
-05/
N:p
pt
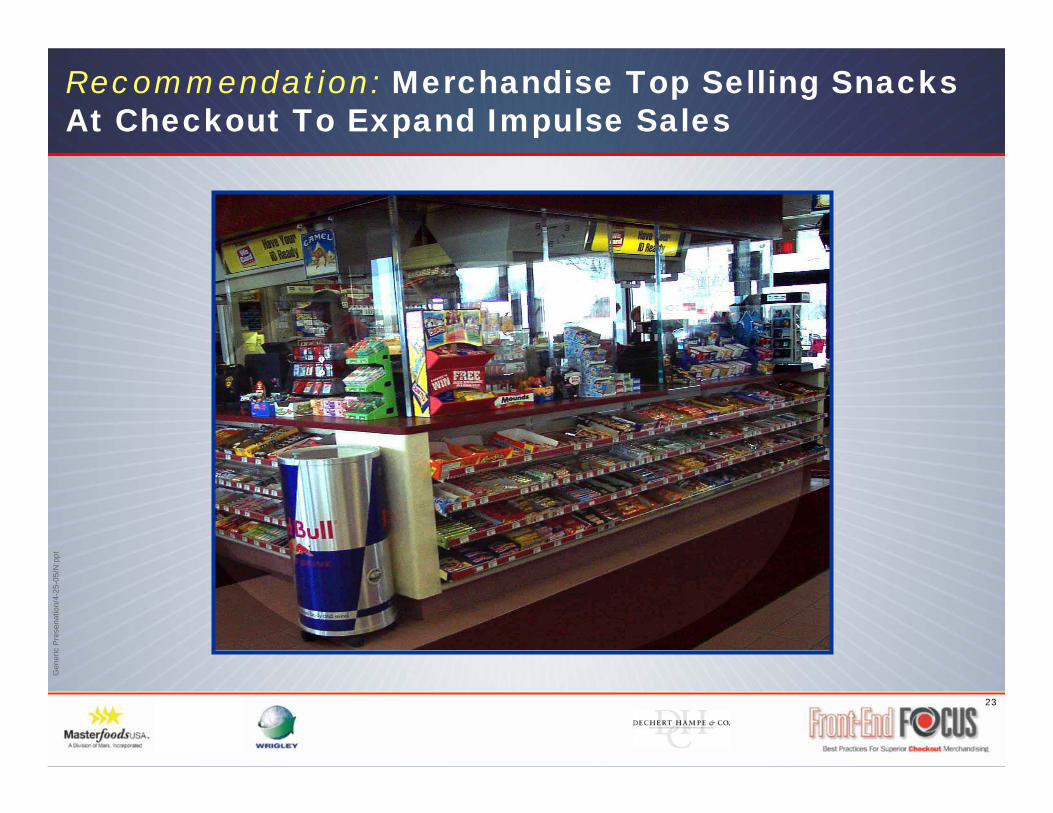
Recommendation: Merchandise Top Selling Snacks At Checkout To Expand Impulse Sales
24
Gen
eric
Pre
sena
tion/
4-25
-05/
N:p
pt
3%
3%
7%
8%
11%
23%
27%
30%
30%
30%Popcorn/Pretzels/OtherSalty Snacks
Cookies
Baked Goods
Energy/Nutrition Bars
Crackers
Magazines
Tobacco Acessories
Batteries
Film/Cameras
Razor Blades31%
36%
37%
37%
51%
52%
56%
57%
60%
65%CarbonatedBeverages
Potato Chips
Candy
Bottled Water
Non-CarbonatedBeverages
Gum
Mints
Cigarettes/Cigars
Nuts/Seeds
Corn/Tortilla Chips
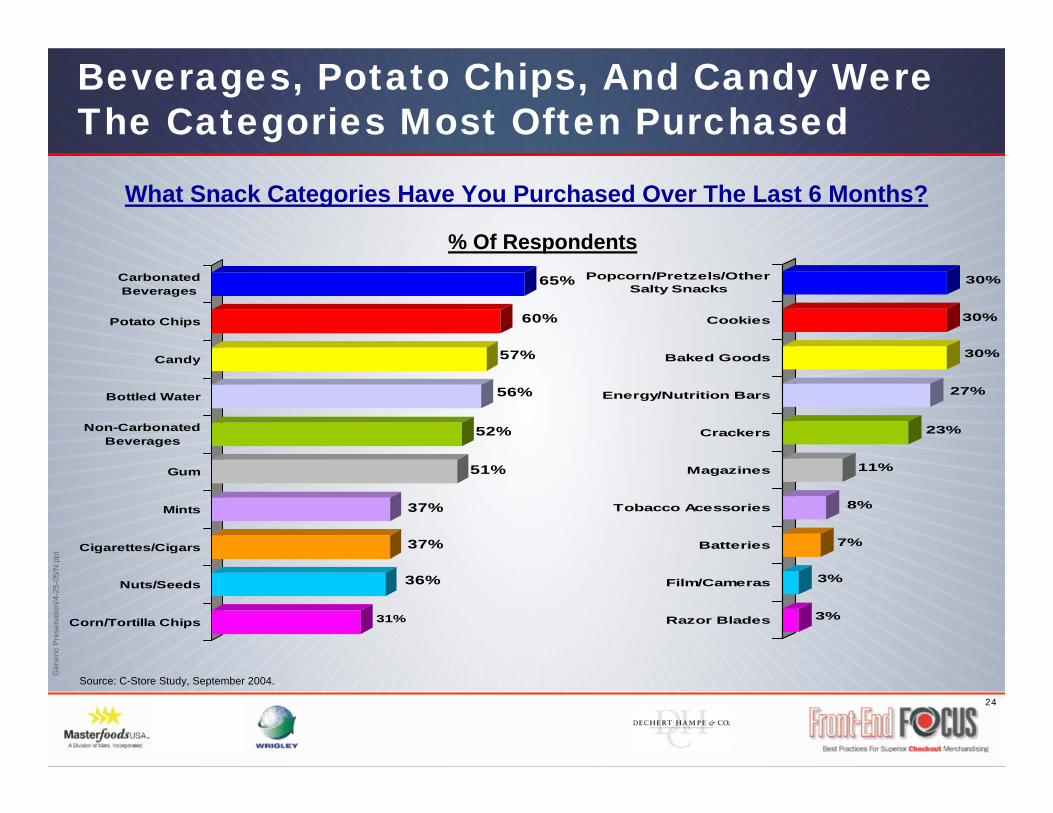
Beverages, Potato Chips, And Candy Were The Categories Most Often Purchased
Source: C-Store Study, September 2004.
What Snack Categories Have You Purchased Over The Last 6 Months?
% Of Respondents
25
Gen
eric
Pre
sena
tion/
4-25
-05/
N:p
pt
28%
34%
37%
38%
38%
40%
44%
45%
45%
51%Candy
Mints
Cookies
Baked Goods
Crackers
Gum
Potato Chips
Popcorn/Pretzels/OtherSalty Snacks
Tortilla/Corn Chips
Nuts/Seeds
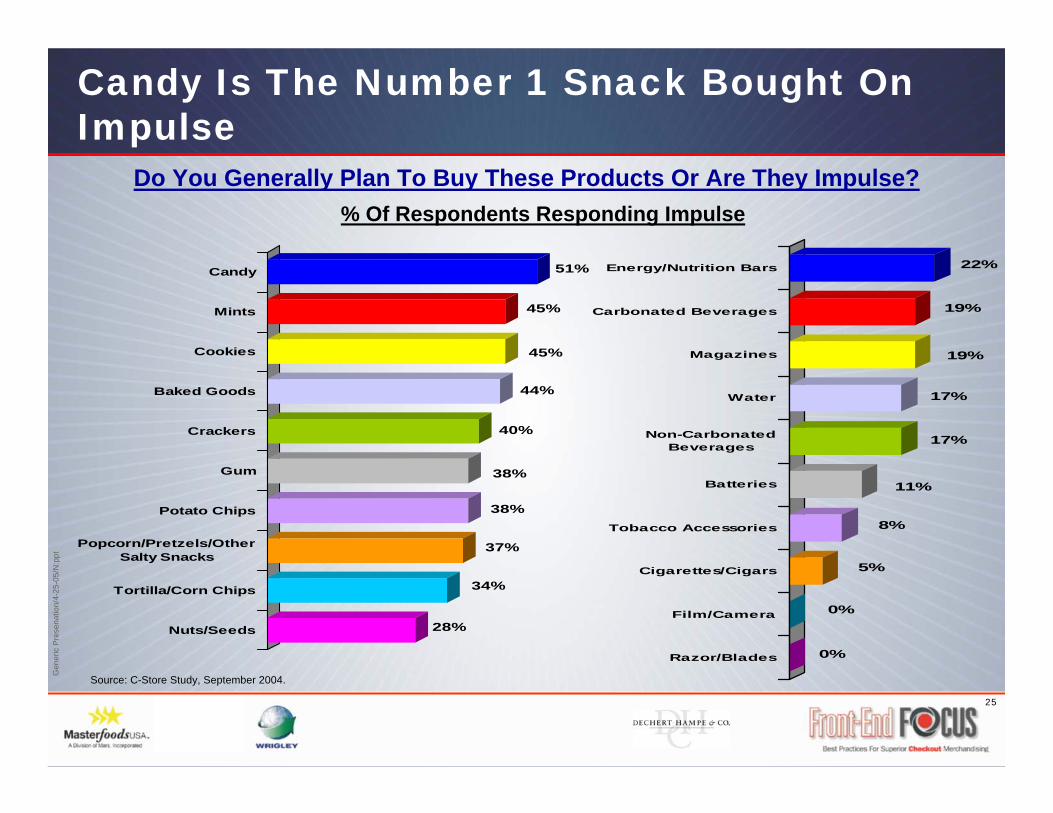
Candy Is The Number 1 Snack Bought On Impulse
Source: C-Store Study, September 2004.
Do You Generally Plan To Buy These Products Or Are They Impulse?% Of Respondents Responding Impulse
0%
0%
5%
8%
11%
17%
17%
19%
19%
22%Energy/Nutrition Bars
Carbonated Beverages
Magazines
Water
Non-CarbonatedBeverages
Batteries
Tobacco Accessories
Cigarettes/Cigars
Film/Camera
Razor/Blades
26
Gen
eric
Pre
sena
tion/
4-25
-05/
N:p
pt
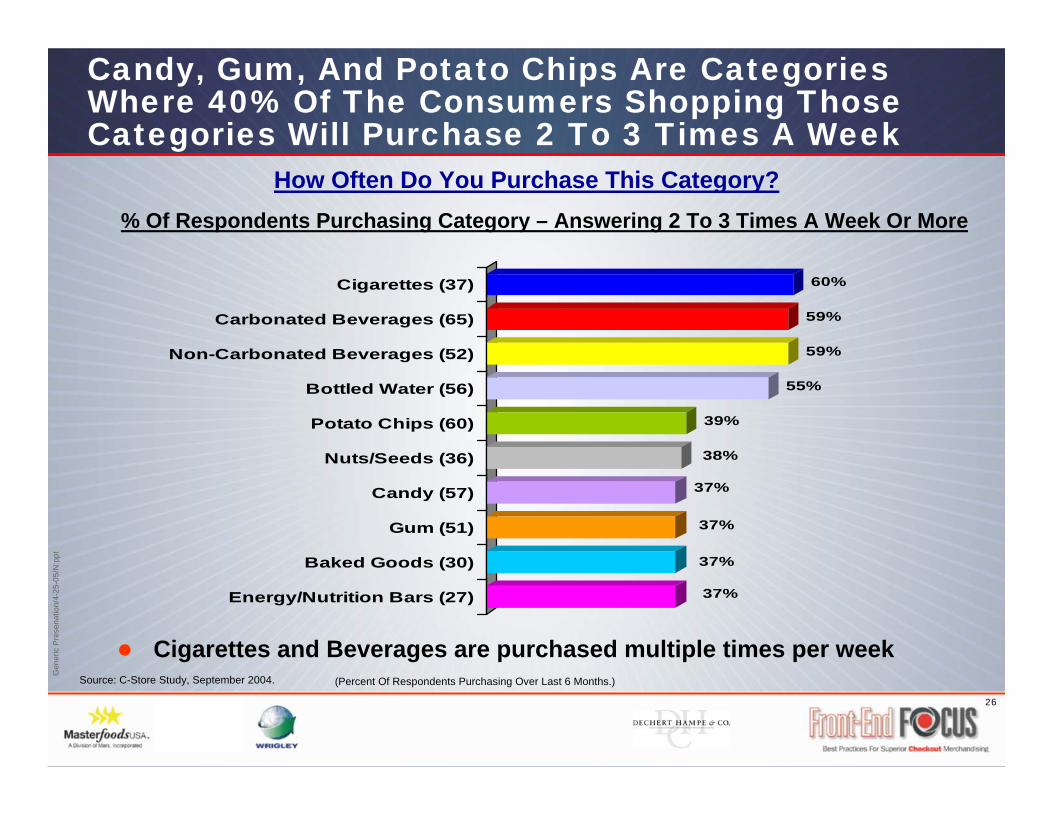
Candy, Gum, And Potato Chips Are Categories Where 40% Of The Consumers Shopping Those Categories Will Purchase 2 To 3 Times A Week
Source: C-Store Study, September 2004.
How Often Do You Purchase This Category?% Of Respondents Purchasing Category – Answering 2 To 3 Times A Week Or More
Cigarettes and Beverages are purchased multiple times per week(Percent Of Respondents Purchasing Over Last 6 Months.)
37%
37%
37%
37%
38%
39%
55%
59%
59%
60%Cigarettes (37)
Carbonated Beverages (65)
Non-Carbonated Beverages (52)
Bottled Water (56)
Potato Chips (60)
Nuts/Seeds (36)
Candy (57)
Gum (51)
Baked Goods (30)
Energy/Nutrition Bars (27)
27
Gen
eric
Pre
sena
tion/
4-25
-05/
N:p
pt
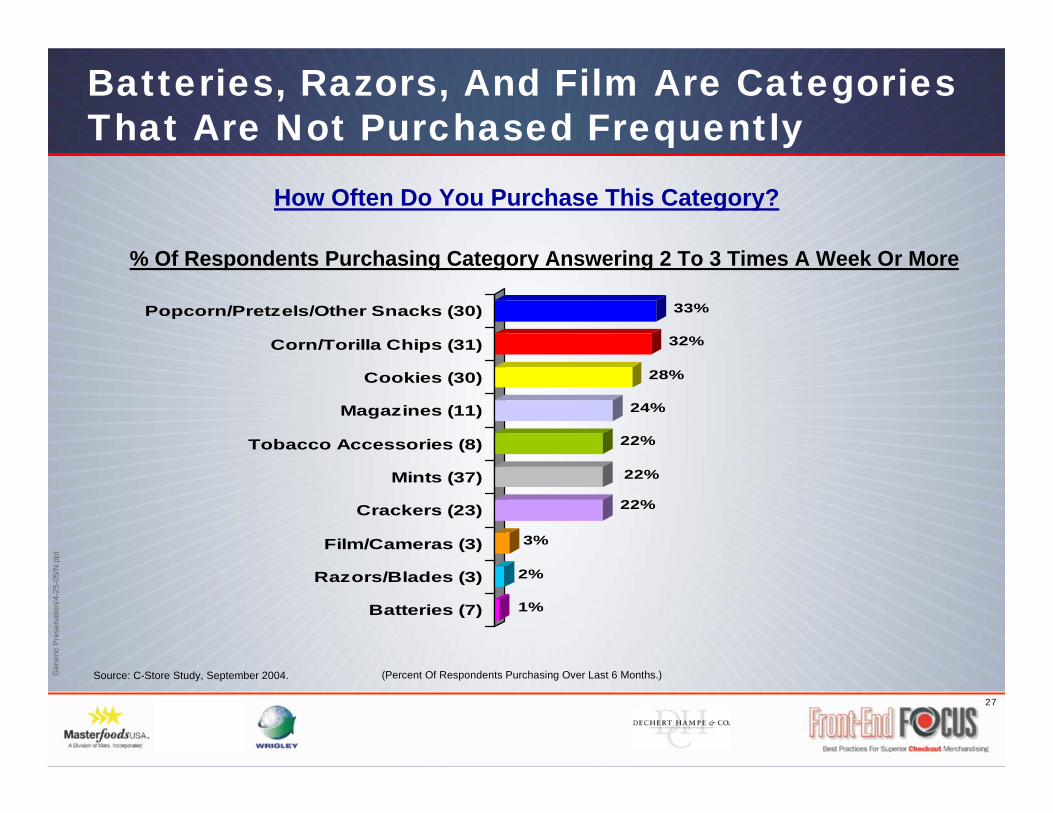
1%
2%
3%
22%
22%
22%
24%
28%
32%
33%Popcorn/Pretzels/Other Snacks (30)
Corn/Torilla Chips (31)
Cookies (30)
Magazines (11)
Tobacco Accessories (8)
Mints (37)
Crackers (23)
Film/Cameras (3)
Razors/Blades (3)
Batteries (7)
Batteries, Razors, And Film Are Categories That Are Not Purchased Frequently
Source: C-Store Study, September 2004.
How Often Do You Purchase This Category?
% Of Respondents Purchasing Category Answering 2 To 3 Times A Week Or More
(Percent Of Respondents Purchasing Over Last 6 Months.)
28
Gen
eric
Pre
sena
tion/
4-25
-05/
N:p
pt
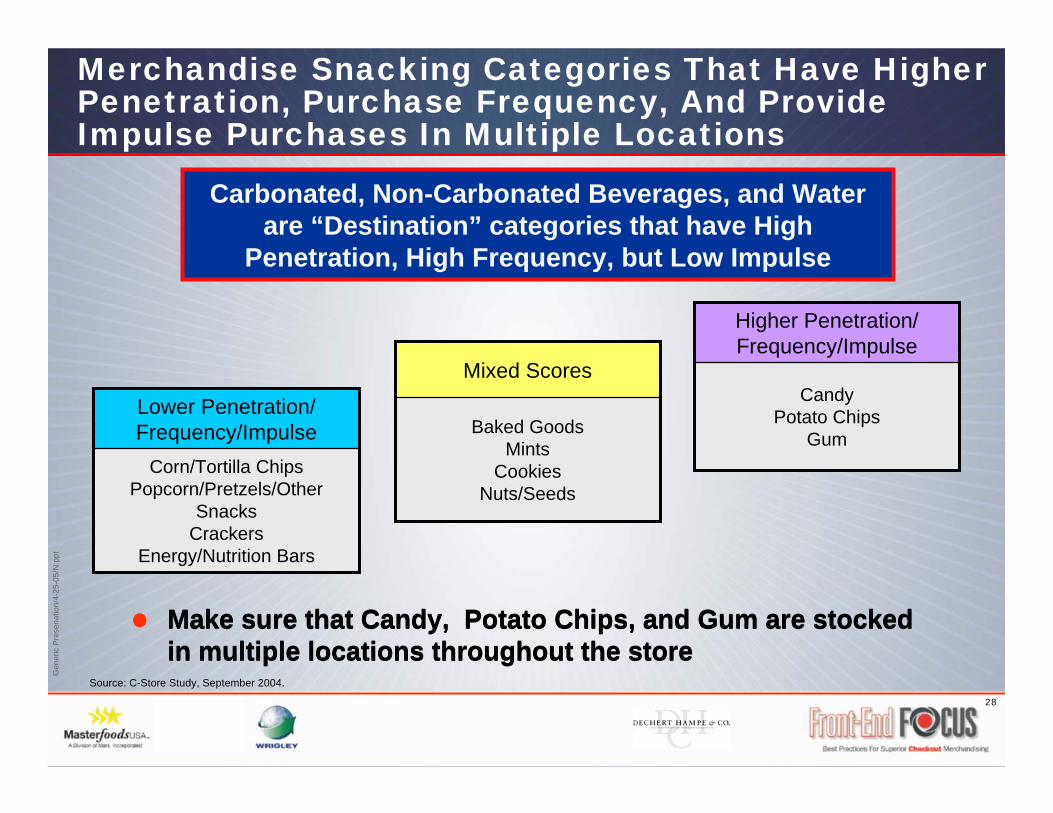
Merchandise Snacking Categories That Have Higher Penetration, Purchase Frequency, And Provide Impulse Purchases In Multiple Locations
Source: C-Store Study, September 2004.
Make sure that Candy, Potato Chips, and Gum are stocked in multiple locations throughout the store
Corn/Tortilla ChipsPopcorn/Pretzels/Other
SnacksCrackers
Energy/Nutrition Bars
Lower Penetration/ Frequency/Impulse
CandyPotato Chips
Gum
Higher Penetration/ Frequency/Impulse
Baked GoodsMints
CookiesNuts/Seeds
Mixed Scores
Make sure that Candy, Potato Chips, and Gum are stocked in multiple locations throughout the store
Carbonated, Non-Carbonated Beverages, and Water are “Destination” categories that have High
Penetration, High Frequency, but Low Impulse
29
Gen
eric
Pre
sena
tion/
4-25
-05/
N:p
pt
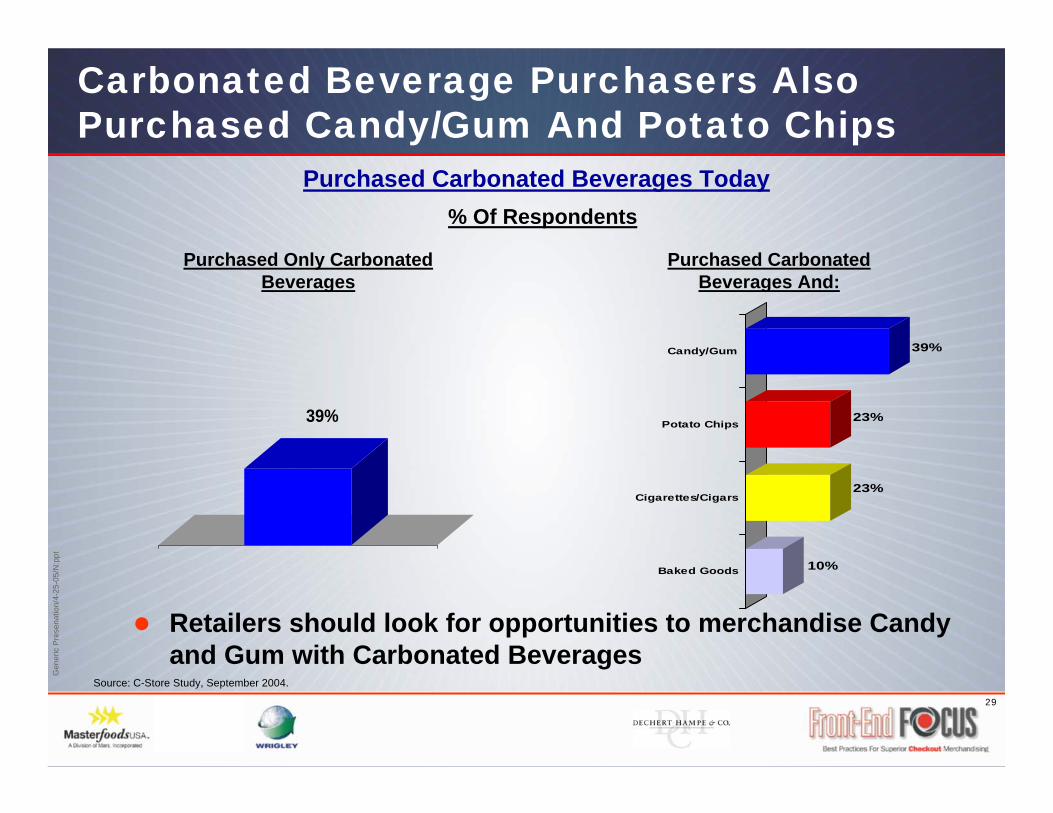
Carbonated Beverage Purchasers Also Purchased Candy/Gum And Potato Chips
Source: C-Store Study, September 2004.
Purchased Carbonated Beverages Today
Retailers should look for opportunities to merchandise Candy and Gum with Carbonated Beverages
% Of Respondents
10%
23%
23%
39%Candy/Gum
Potato Chips
Cigarettes/Cigars
Baked Goods
39%
Purchased Only Carbonated Beverages
Purchased Carbonated Beverages And:
30
Gen
eric
Pre
sena
tion/
4-25
-05/
N:p
pt
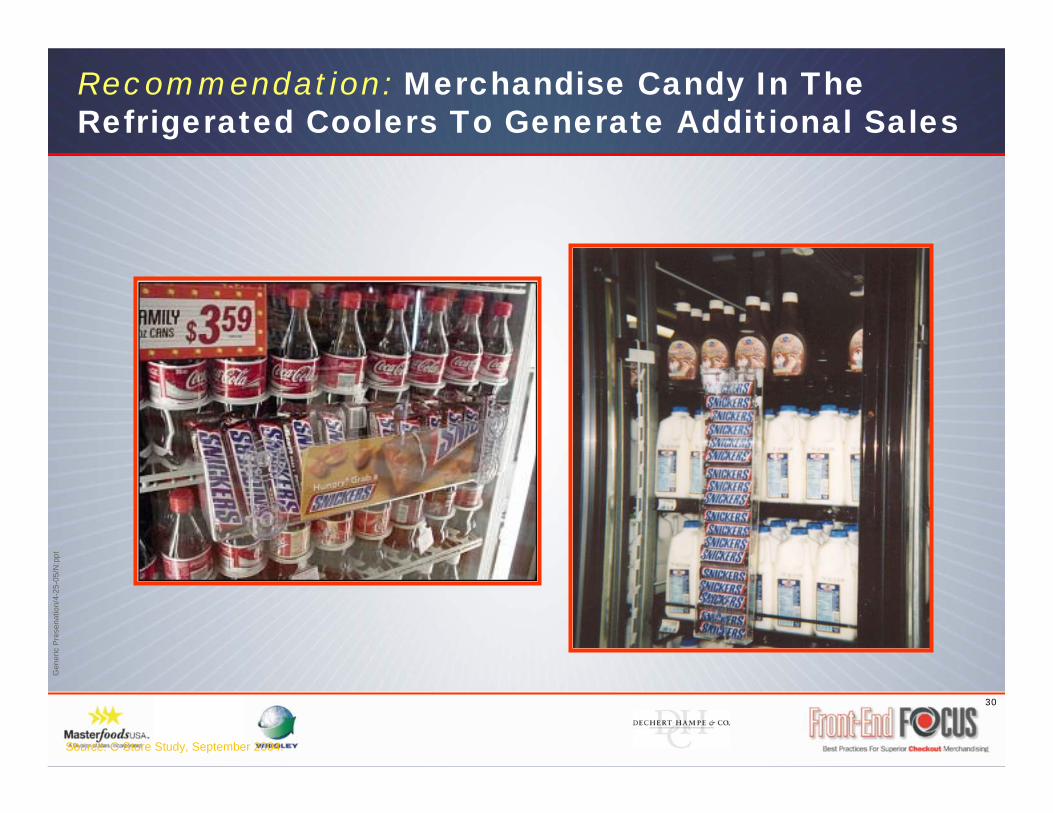
Recommendation: Merchandise Candy In The Refrigerated Coolers To Generate Additional Sales
Source: C-Store Study, September 2004.
31
Gen
eric
Pre
sena
tion/
4-25
-05/
N:p
pt
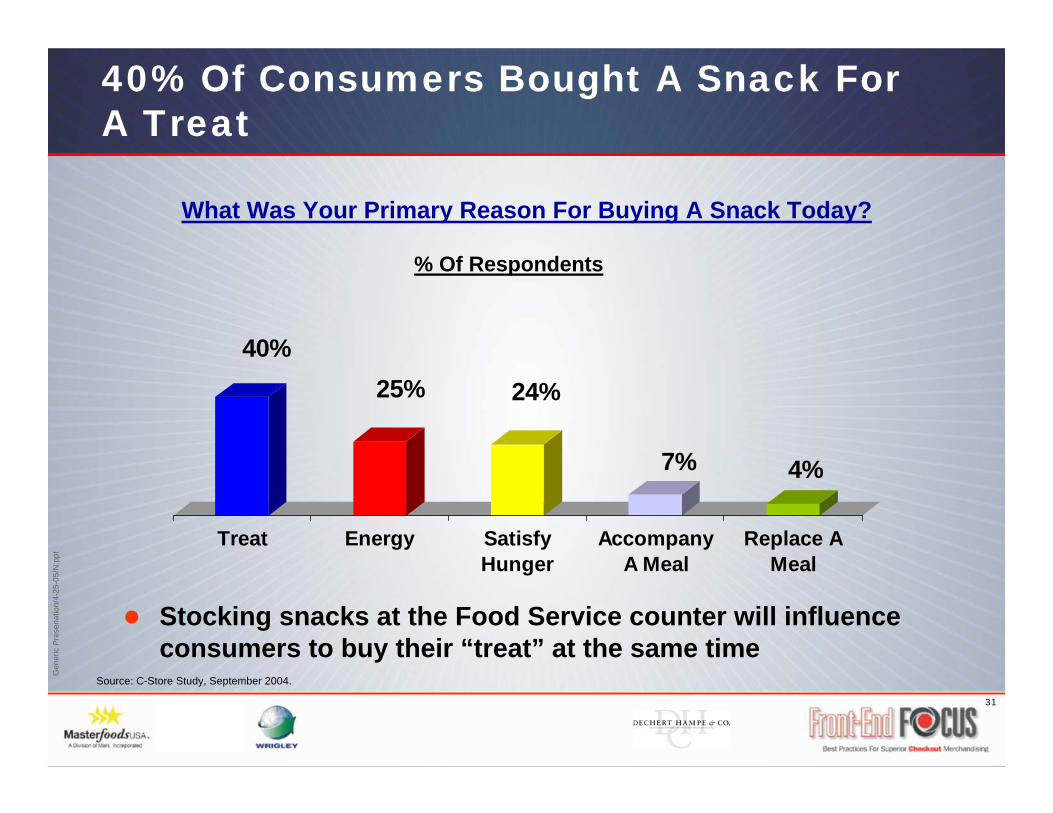
40%25% 24%
7% 4%
Treat Energy SatisfyHunger
AccompanyA Meal
Replace AMeal
40% Of Consumers Bought A Snack For A Treat
What Was Your Primary Reason For Buying A Snack Today?
Source: C-Store Study, September 2004.
Stocking snacks at the Food Service counter will influence consumers to buy their “treat” at the same time
% Of Respondents
32
Gen
eric
Pre
sena
tion/
4-25
-05/
N:p
pt
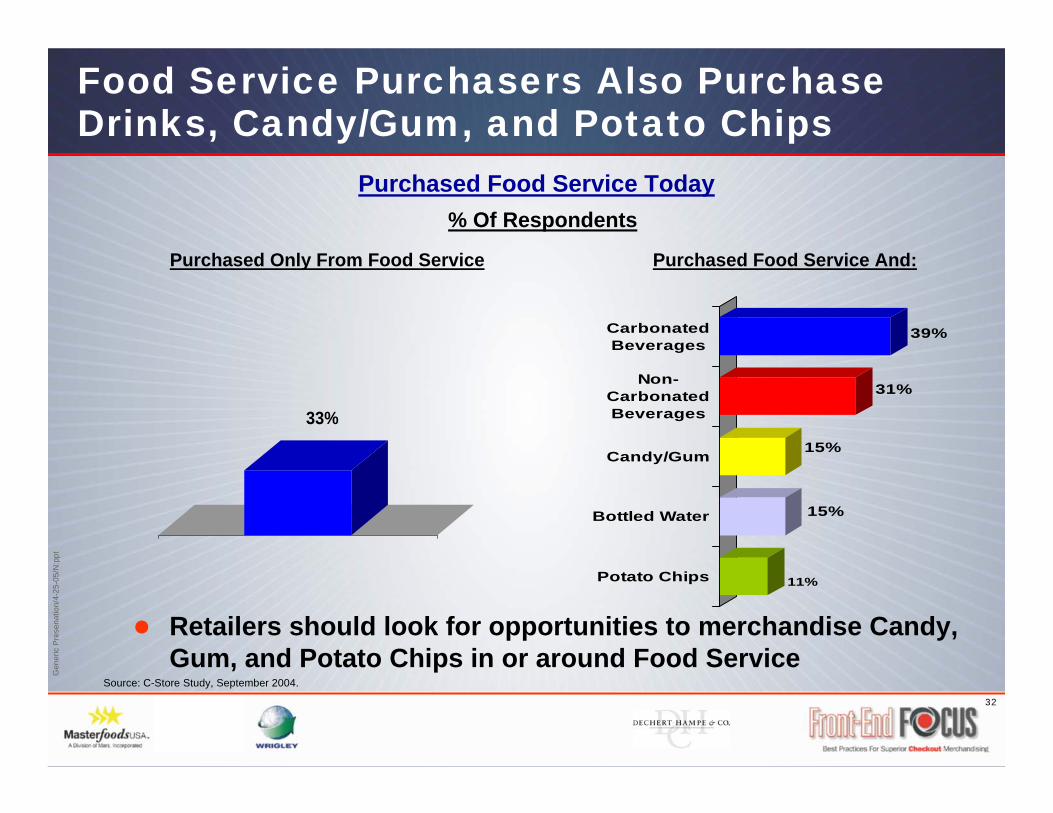
Food Service Purchasers Also Purchase Drinks, Candy/Gum, and Potato Chips
Source: C-Store Study, September 2004.
Purchased Food Service Today
Retailers should look for opportunities to merchandise Candy, Gum, and Potato Chips in or around Food Service
% Of Respondents
11%
15%
15%
31%
39%CarbonatedBeverages
Non-CarbonatedBeverages
Candy/Gum
Bottled Water
Potato Chips
33%
Purchased Only From Food Service Purchased Food Service And:
33
Gen
eric
Pre
sena
tion/
4-25
-05/
N:p
pt
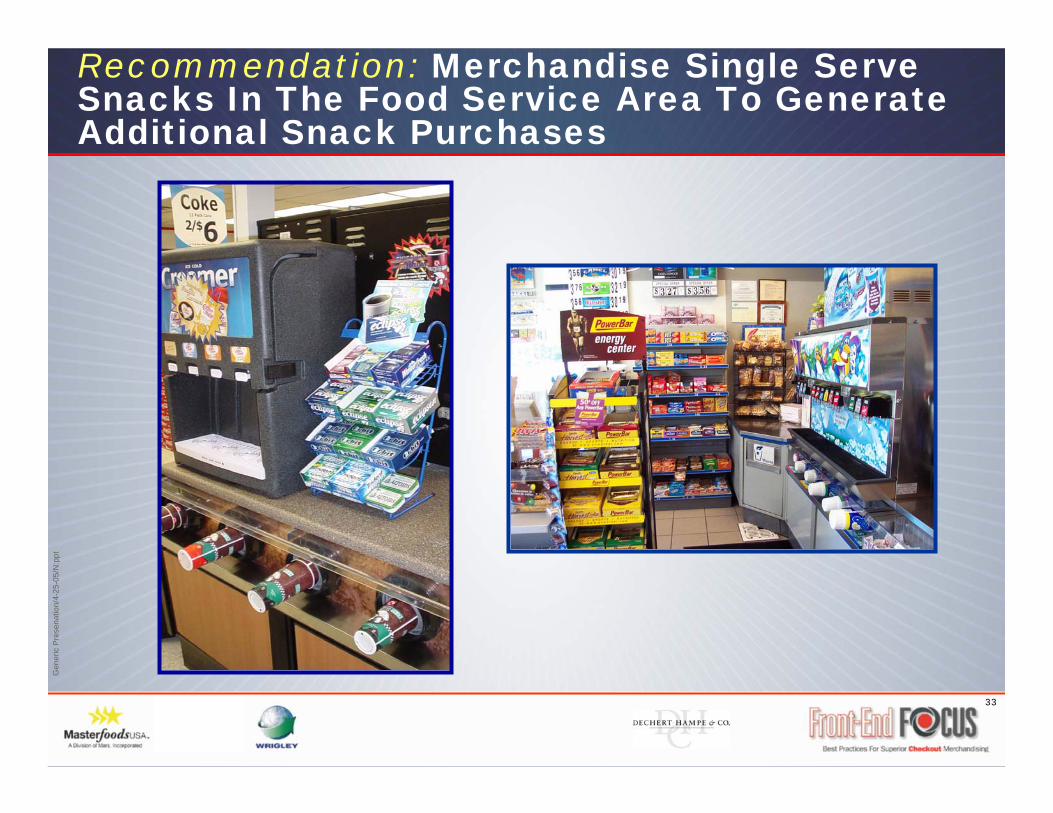
Recommendation: Merchandise Single Serve Snacks In The Food Service Area To Generate Additional Snack Purchases
34
Gen
eric
Pre
sena
tion/
4-25
-05/
N:p
pt
Recommendations Based On Consumer Findings
Use merchandising vehicles at the gas pumps to attract pay-at-the-pump customers into the store
Expand market basket size by focusing on complementary merchandising of single serve snacks
Focus secondary merchandising locations on the categories that have high penetration, frequency, and impulse (Candy, Potato Chips, Gum)
Merchandise Confectionery and Potato Chips in Food Service
Merchandise Confectionery at checkout locations
Merchandise Chocolate Candy in refrigerated Beverage Coolers
35
Gen
eric
Pre
sena
tion/
4-25
-05/
N:p
pt
C-Store Single Serve Snacks Sales/Audit Insights
36
Gen
eric
Pre
sena
tion/
4-25
-05/
N:p
pt
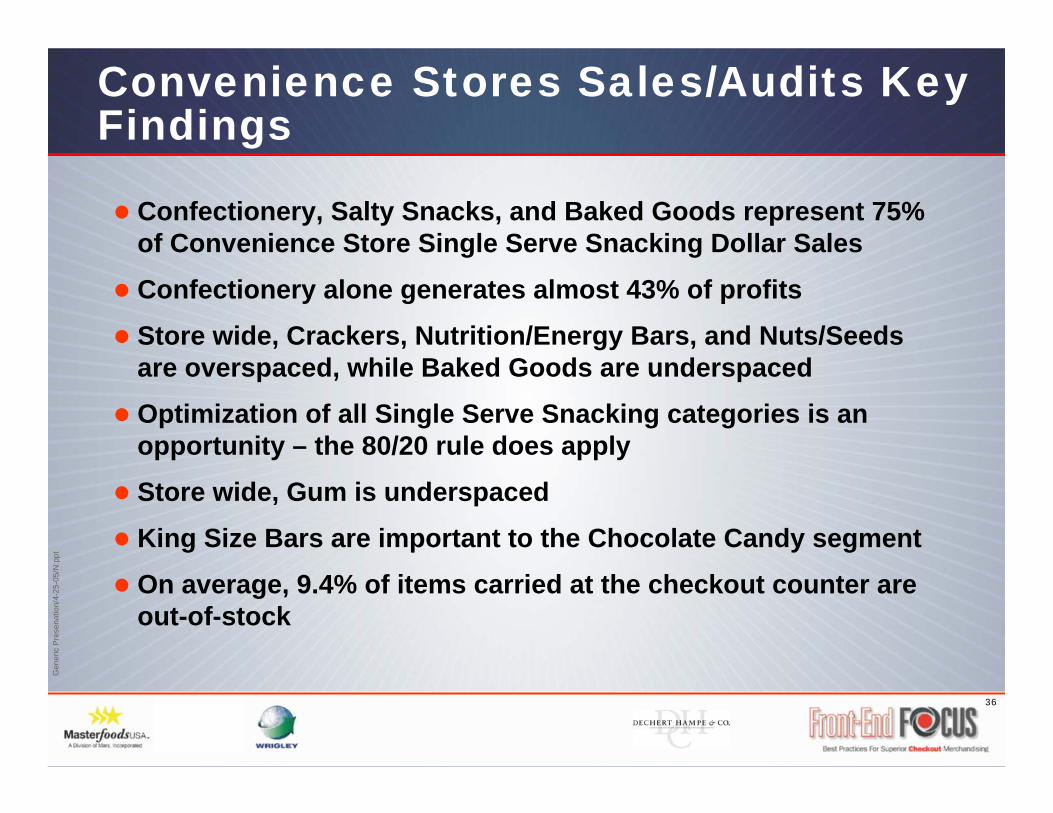
Convenience Stores Sales/Audits Key Findings
Confectionery, Salty Snacks, and Baked Goods represent 75% of Convenience Store Single Serve Snacking Dollar Sales
Confectionery alone generates almost 43% of profits
Store wide, Crackers, Nutrition/Energy Bars, and Nuts/Seeds are overspaced, while Baked Goods are underspaced
Optimization of all Single Serve Snacking categories is an opportunity – the 80/20 rule does apply
Store wide, Gum is underspaced
King Size Bars are important to the Chocolate Candy segment
On average, 9.4% of items carried at the checkout counter are out-of-stock
37
Gen
eric
Pre
sena
tion/
4-25
-05/
N:p
pt
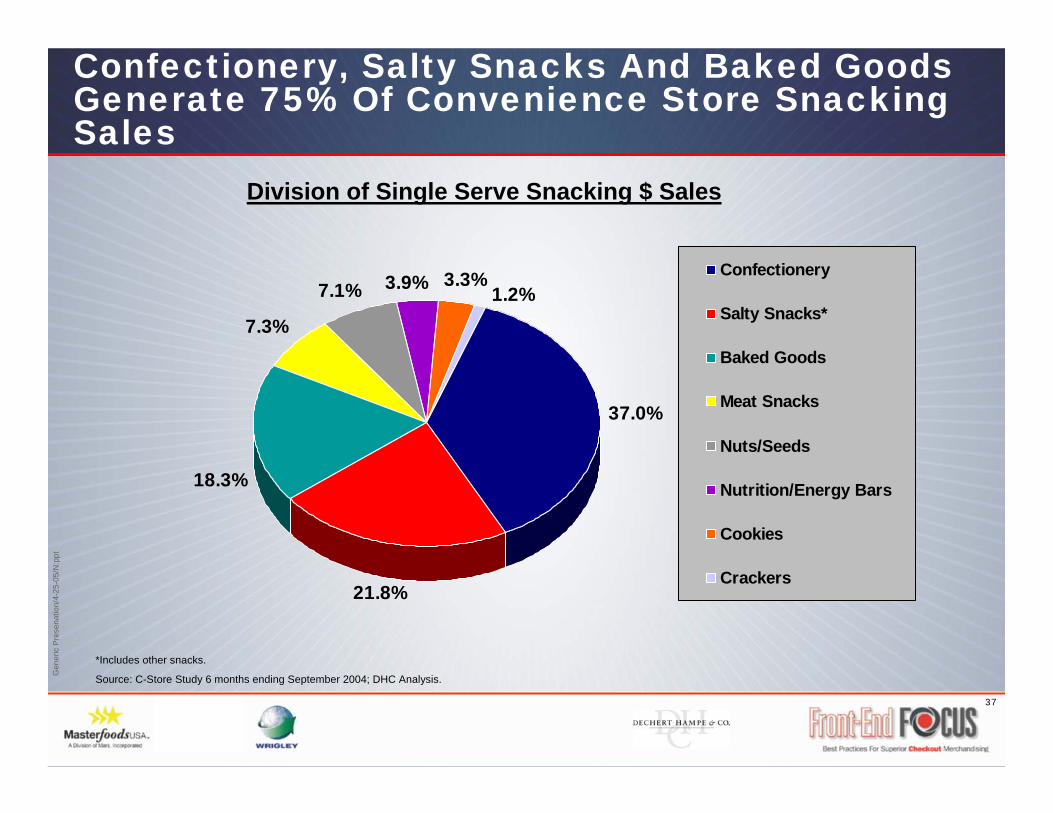
37.0%
7.3%
21.8%
18.3%
1.2%3.3%3.9%7.1%
Confectionery
Salty Snacks*
Baked Goods
Meat Snacks
Nuts/Seeds
Nutrition/Energy Bars
Cookies
Crackers
Confectionery, Salty Snacks And Baked Goods Generate 75% Of Convenience Store Snacking Sales
Division of Single Serve Snacking $ Sales
*Includes other snacks.
Source: C-Store Study 6 months ending September 2004; DHC Analysis.
38
Gen
eric
Pre
sena
tion/
4-25
-05/
N:p
pt
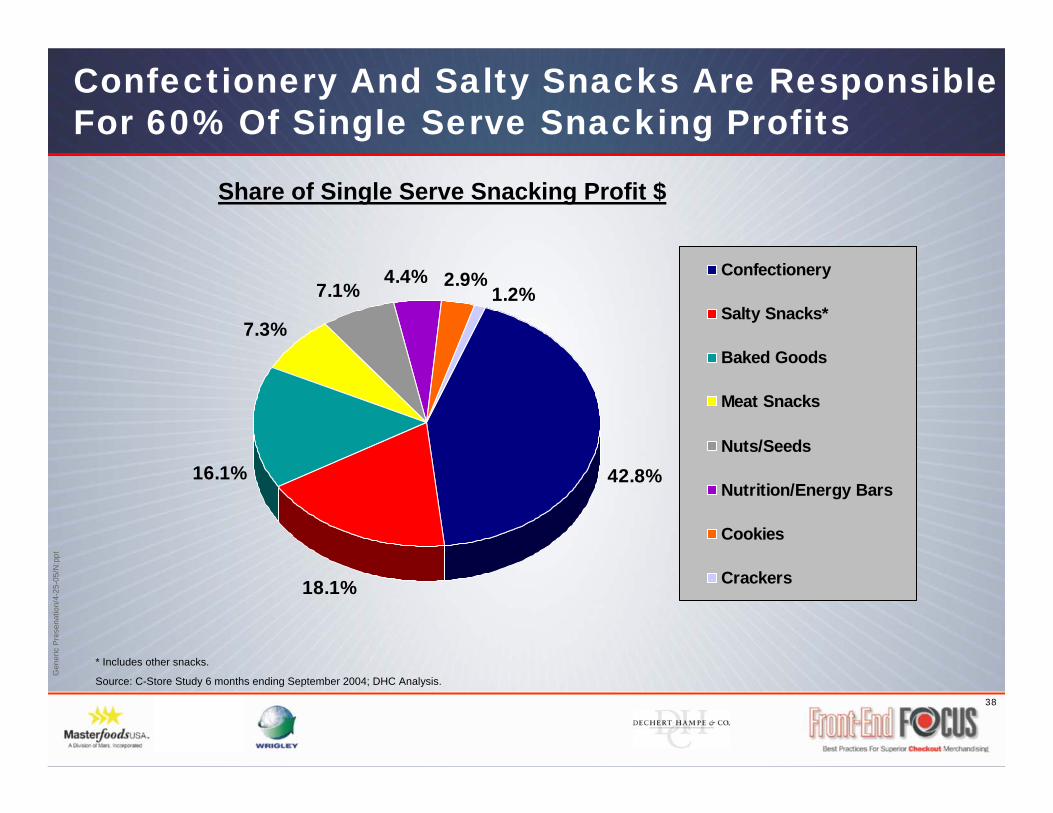
42.8%
7.3%
18.1%
16.1%
1.2%2.9%4.4%
7.1%Confectionery
Salty Snacks*
Baked Goods
Meat Snacks
Nuts/Seeds
Nutrition/Energy Bars
Cookies
Crackers
Confectionery And Salty Snacks Are Responsible For 60% Of Single Serve Snacking Profits
Share of Single Serve Snacking Profit $
* Includes other snacks.
Source: C-Store Study 6 months ending September 2004; DHC Analysis.
39
Gen
eric
Pre
sena
tion/
4-25
-05/
N:p
pt
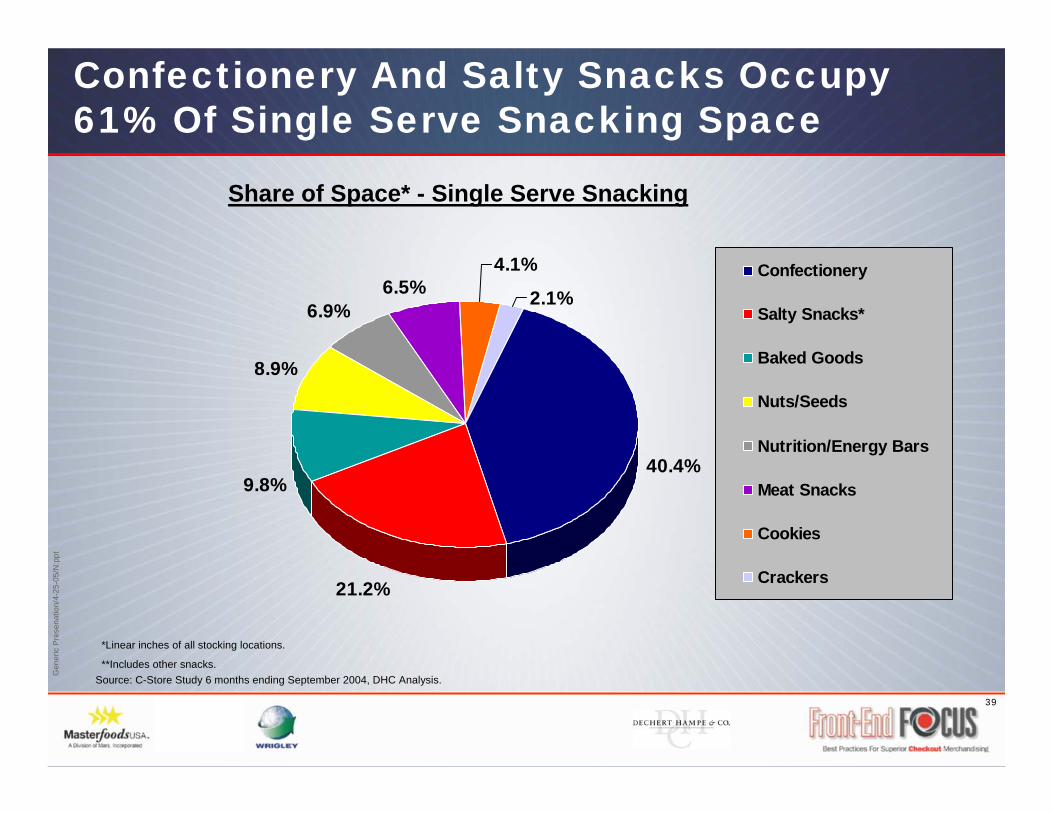
Confectionery And Salty Snacks Occupy 61% Of Single Serve Snacking Space
Share of Space* - Single Serve Snacking
Source: C-Store Study 6 months ending September 2004, DHC Analysis.
40.4%
21.2%
9.8%
8.9%
6.9%6.5%
4.1%
2.1%Confectionery
Salty Snacks*
Baked Goods
Nuts/Seeds
Nutrition/Energy Bars
Meat Snacks
Cookies
Crackers
*Linear inches of all stocking locations.
**Includes other snacks.
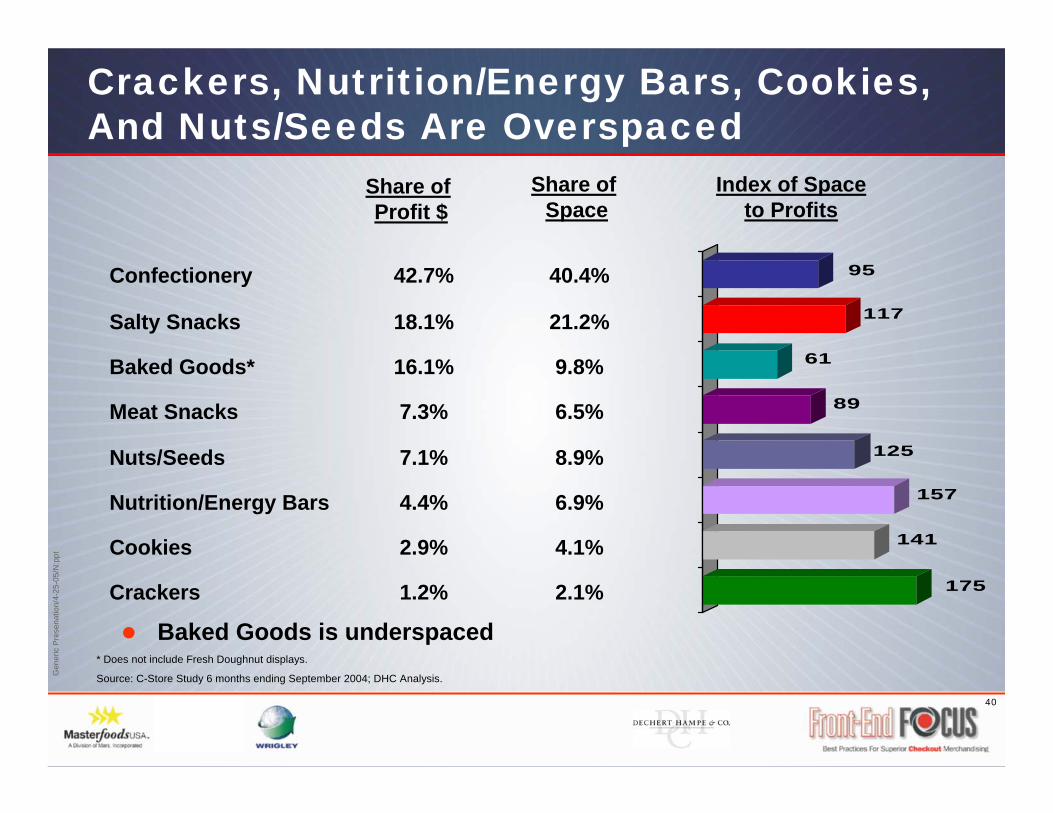
40
Gen
eric
Pre
sena
tion/
4-25
-05/
N:p
pt
175
141
157
125
89
61
117
95
Crackers, Nutrition/Energy Bars, Cookies, And Nuts/Seeds Are Overspaced
Share of Profit $
* Does not include Fresh Doughnut displays.
Source: C-Store Study 6 months ending September 2004; DHC Analysis.
Share of Space
Index of Space to Profits
2.1%1.2%Crackers
4.1%2.9%Cookies
6.9%4.4%Nutrition/Energy Bars
8.9%7.1%Nuts/Seeds
6.5%7.3%Meat Snacks
9.8%16.1%Baked Goods*
21.2%18.1%Salty Snacks
40.4%42.7%Confectionery
Baked Goods is underspaced