cooloce debris bed coolability experiments with an ... · this report describes the cooloce-11 test...
TRANSCRIPT

RESEARCH REPORT VTT-R-03316-13
COOLOCE debris bed coolability experiments with an agglomerate simulant: Test series 11 Authors: Eveliina Takasuo, Tuomo Kinnunen, Taru Lehtikuusi, Stefan
Holmström
Confidentiality: Public


RESEARCH REPORT VTT-R-03316-132 (22)
Contents
Contents ................................................................................................................................. 2
1. Introduction ....................................................................................................................... 3
2. Test matrix ........................................................................................................................ 4
3. Experimental set-up .......................................................................................................... 4
3.1 Particle material ........................................................................................................ 6 3.2 The test procedure .................................................................................................... 7
4. COOLOCE-11 results ....................................................................................................... 8
4.1 COOLOCE-11a......................................................................................................... 8 4.2 COOLOCE-11b....................................................................................................... 10 4.3 COOLOCE-11c ....................................................................................................... 11 4.4 COOLOCE-11d....................................................................................................... 13 4.5 COOLOCE-11e....................................................................................................... 14 4.6 COOLOCE-11f........................................................................................................ 16
5. Effect of flow mode on coolability .................................................................................... 17
6. Discussion ...................................................................................................................... 20
7. Summary ........................................................................................................................ 21
References ........................................................................................................................... 21
Appendix A. Heater arrangement of the COOLOCE cylinder ................................................. A
Appendix B. Thermocouple arrangement of the COOLOCE cylinder ..................................... B
Appendix C. Temperature histories ....................................................................................... C

RESEARCH REPORT VTT-R-03316-133 (22)
1. Introduction
A debris bed (particle bed) that consists of solidified corium may be formed as a result of a core melt accident in a nuclear power reactor. Depending on the design of the reactor, such a debris bed may be formed in the containment, e.g. in the flooded lower drywell of the Finnish BWRs after the failure of the reactor pressure vessel, or inside the pressure vessel. In order to ensure the coolability of the core debris and to prevent dryout and possible re-melting of the material, decay heat has to be removed from the material. The issue of corium coolability has received considerable attention since the accident at Fukushima which apparently resulted in various degrees of core melting in Units 1–3.
The COOLOCE test facility is used to investigate the coolability of porous particle beds of different geometries, focusing on ex-vessel cases. The main objective of the experimental programme in 2011 was to compare the dryout power of a conical (heap-like) particle bed configuration to that of a cylindrical (evenly distributed) configuration [1-5]. In 2012, the experiments were extended to include irregular gravel as a simulant material (COOLOCE-8) and initially subcooled pool (COOLOCE-9) [6].
After this, the focus was again on the effect of different flow modes (geometries) on coolability. A cylindrical bed with lateral and top flooding was investigated in COOLOCE-10 test series [7] and a cylindrical bed with lateral flooding only in COOLOCE-11. In the former of the test series, all surfaces except bottom were open to flooding and, in the latter, an agglomerate simulant was placed on top of the test bed so that only lateral flooding was allowed.
This report describes the COOLOCE-11 test series with the agglomerate simulant and presents a comparison of the dryout heat flux in the different flow modes: the cylindrical test beds in COOLOCE-10 and -11 are compared to the cylinder with top flooding only. The coolability of a cylinder with top flooding only was measured in COOLOCE- 3 – 5 test series [3]. The goals of the COOLOCE-10 and -11 experiments were (1) to produce data useful for simulation code validation (to evaluate code performance in the different flow modes) and (2) to directly compare the relative coolability in the investigated flow modes. The conclusions concerning goal (2) are discussed in this report. The simulation results will be reported later.
The debris beds in COOLOCE-10 and -11 can be considered representative for debris bed configurations possible in reactor scenarios, regardless of the known significant uncertainties associated with the debris bed formation process. The top and laterally flooded cylinder approximates a mound-shaped debris bed by having a similar multi-dimensional co-current flow mode. This type of bed is formed by settling of falling particles but, unlike in the case of a conical debris bed, the top of the bed is rounded e.g. by shifting of the particles during their settling. The bed with an agglomerate simulant (an impermeable top surface) represents a case in which part of the molten corium has solidified into an impermeable “cake” that blocks the fluid flow directly through the top surface.
The aforementioned experimental set-ups take into account a variety of debris bed flow modes. To the authors’ knowledge, the coolability of a conical bed, a mound-shaped bed and a bed with an agglomerate simulant has not been previously measured. Simulations of the experiments and comparisons of experimental and simulation results increase the understanding on how well the simulation codes predict coolability in reactor scale assessment, and possible future development needs are identified.

RESEARCH REPORT VTT-R-03316-134 (22)
2. Test matrix
The COOLOCE experiments starting in 2010 until January 2013 are summarized in Table 1. The experimental series are numbered according to their chronological order. In the reporting, the test runs for each pressure level are named in alphabetical order (of increasing pressure), e.g. COOLOCE-11a denotes 1.0 bar (abs.) pressure and COOLOCE-11f indicates 7.0 bar. The basis of pressure range selection is “as high as possible”: The upper limit is either the maximum available power (if dryout power exceeds it) or the design pressure of the test vessel (if the dryout power is below maximum available). An exception to this is COOLOCE-9, the experiments with subcooled pool, in which pressure variation was not done due to the type of the experiment [6]. The pressure range given in the table is nominal (approximate), the average pressures for each dryout point and pressure histories are presented in the descriptions of the experiments in the Results Chapter of each technical report.
Table 1. The COOLOCE experiments 2010-2013.
Experiment Test bed Flow configuration Particle material
Pressure range [bar]
COOLOCE-1 – 2 Conical Multi-dimensional Spherical beads
1.6-2.0 COOLOCE-3 – 5 Cylindrical Top flooding 1.0-7.0 COOLOCE-6 – 7 Conical Multi-dimensional 1.0-3.0 COOLOCE-8 Cylindrical Top flooding
Irregular gravel 1.0-7.0
COOLOCE-9 Cylindrical Top flooding* 1.0
COOLOCE-10 Cylindrical Lateral and top flooding Spherical
beads 1.3-3.0
COOLOCE-11 Cylindrical Lateral flooding 1.0-7.0 * Initially subcooled water pool, saturated pool in all other experiments.
3. Experimental set-up
The main components of the COOLOCE test facility are the pressure vessel which houses the test particle bed, the feed water and steam removal systems and instrumentation. The custom-designed pressure vessel has a volume of 270 dm³ and design pressure of 7 bar (overpressure). The schematic of the arrangement is presented in Fig. 1
The cylindrical test bed is 305 mm in diameter and 270 mm in height with the total volume being 19.7 dm³. Due to the installation of a wire net to constrain the bed sidewalls, the diameter is about 5 mm smaller than in the previous arrangement (that had a volume 20.4 dm3). The cylindrical sidewall is open to water infiltration and constrained by a wire net. A steel plate is placed on top of the test bed as the agglomerate simulant to block the flows though the top surface. The heating arrangement of the cylindrical test bed is shown in Fig. 2 (a) and the test bed filled with the simulant particles and covered with the steel plate in Fig. 2 (b).

RESEARCH REPORT VTT-R-03316-135 (22)
1) Feed water tank 2) Feed water pump 3) Feed water pre-heater 4) Feed water control valve 5) Safety valve 6) Resistance heaters of the test bed 7) Power input and measurement 8) Pressure vessel 9) Steam line control valve (pressure control) 10) Pressure measurement (control) 11) Water level measurement (feed water control) 12) Condenser 13) Temperature measurements 14) Bench scale for condensate mass measurement 15) Water circulation pump 16) Test bed (cylindrical) 17) Pressure measurement
Fig. 1. Schematic flow chart of the COOLOCE test facility.

RESEARCH REPORT VTT-R-03316-136 (22)
Fig. 2. (a) Heating arrangement of the cylindrical bed experiments and (b) the test bed of the COOLOCE-11 experiments.
The test bed is heated by Æ 6.3 mm vertically installed cartridge heaters as shown in Fig. 2 (a). There is a 40 mm layer of unheated particles above the heaters. In the cylindrical test bed, all the heaters have a heated length of approximately 230 mm. The configuration aims at a power distribution as uniform as possible without internal heat generation of the particles. To measure the particle bed temperature and detect dryout, K type thermocouples are installed in a distributed configuration aiming for maximal coverage of the particle bed volume between the heaters. The electrical connections for the heaters and the thermocouples are lead (with connectors) through the bottom plate of the pressure vessel.
3.1 Particle material
The debris simulant consists of zirconia/silica beads (ZrO2 ≥ 65%, SiO2 ≤ 35%). This particle material has been used in all the COOLOCE experiments with the exceptions of COOLOCE-8 and -9. The size range of the beads is 0.82-1.11 mm according to a sample of about 1000 beads evaluated with image processing software. The mean size based on this measurement is 0.97 mm. The density of the material is about 4230 kg/m3. The particles are nominally spherical but the images of the particles reveal that some of them are not strictly spheres but slightly elliptical (spheres with some unknown tolerance for roundness). A sample of the beads is shown in Fig. 3.
According to separate measurements at KTH (Kungliga Tekniska Högskolan in Sweden), the effective particle diameter of the beads is 0.8 mm for a bed porosity of 39.9% [8]. This means that the representative diameter considering the flow resistance would be close to the smallest particles in the distribution, rather than the mean of 0.97 mm. The estimation was done by measuring the single-phase pressure drop and fitting the results to the prediction by the Ergun’s equation. However, there is no guarantee that the packing is exactly the same in the separate experiments and in the COOLOCE test bed. Measurements by filling the COOLOCE test beds with water suggest that the porosity is 38-40%.
(a)
(b)

RESEARCH REPORT VTT-R-03316-137 (22)
The exact porosity and average particle size, and how to select the correct values for these parameters in case of e.g. multi-sized particles, are important questions in modelling because the pressure loss and thus dryout heat flux are highly sensitive to them. In the experiments addressed in this report, however, we do not consider the uncertainties in particle size and porosity because the same simulant material with the same method of bed build-up has been used (packing as dense as possible).
Fig. 3. Ceramic beads used as debris simulant.
3.2 The test procedure
The normal test procedure consists of a heat-up sequence and the main test sequence. Generally, these are similar for the cylindrical and conical bed experiments. Prior to the experiments, the test pressure vessel is filled with pre-heated demineralized water to a level of approximately 300 mm above the test bed surface. During the heat-up sequence the facility is heated up to the saturation temperature and steady-state boiling is reached. The power level of the heat-up sequence depends on e.g. the test pressure and the expected dryout power.
In the test sequence, a stepwise power increase is conducted until a dryout is indicated by one or more thermocouples within the test bed. Dryout is seen as a stable increase of the sensor temperature from the saturation temperature. A holding time of 20 to 30 minutes is applied for each power step. This is to allow enough time for the development of dryout (evaporation of liquid) inside the debris bed after the critical power level has been reached. An adequate holding time is especially important in top flooded test configurations.
The size of the power increments is 1 kW - 2 kW. The power increase scheme for each test sequence is documented in the power and temperature figures in Chapter 4. During the test sequence, the water level and pressure in the test vessel are controlled by the feed water and steam line control valves according to given set points. These process variables are shown in Chapter 4 for the purpose of documenting the events leading to dryout in the test runs.
The heating power is manually controlled by adjusting the output voltage of a purpose-tailored power transformer. The heaters are arranged in three groups according to the electrical phase. The heater locations are presented in Appendix A. Five of the heaters are equipped with temperature sensors which help to detect possible overheating. (In the previous experiments, there were three heaters with thermocouples). The thermocouple map is presented in Appendix B. The thermocouples numbered 100-45 and 400-8 have multiple measuring points and the other thermocouples have a single measuring point at the upper end. Total number of sensors is 70, excluding the heater measuring points.

RESEARCH REPORT VTT-R-03316-138 (22)
The heat-up sequence typically lasts from 1 to 2 hours during which the temperature is gradually increased up to the saturation temperature at the pressure of the experiment to be conducted. The temperatures near the bottom plate of the pressure vessel tend to increase more slowly than in the other parts of the test bed. The bottom plate temperature remains slightly below the saturation temperature in steady-state conditions due to heat losses.
The condensate mass flow that exits from the facility can be estimated by a bench scale connected to the condenser outlet. It is possible to verify the power level of the experiments and estimate the heat losses assuming that the water which is collected to the scale per unit of time is equal to the mass flux evaporated by the heated test bed. The difference between the power calculated from the measurements of mass (calculated power) and the control power gives an estimate of the heat losses and uncertainty in the recorded control power. Typically, this difference is 10-20% and increases with increasing power and pressure when the difference to the ambient temperature is greater.
Since the power generation by the test bed heaters has to compensate for the heat losses, in addition to being able to boil the water, the control power is greater than the calculated power. Based on the estimates of condensate accumulation at the dryout power steps, the difference is similar to the one observed in the previous COOLOCE experiments. Due to the unknown (and possible pressure-dependent) effect of direct contact condensation in the test vessel and other uncertainties in the condensate mass flow rate, we consider only the control power in Chapter 4 and in the comparisons presented in Chapter 5.
4. COOLOCE-11 results
This Chapter presents descriptions of the experiments with an agglomerate simulant. Each experimental run consists of a dryout measurement for one pressure level. The progress of the test runs is described by the time evolutions of control power, temperature and the process variables (pressure, water level in the test vessel and feed water temperature). The most important variable is the temperature in the test bed, based on which dryout is detected. Due to the large number of temperature sensors which do not indicate dryout, only the thermocouple readings of the sensors which indicated dryout (or are otherwise of interest) are shown in the illustrations. The temperatures of the heater, water pool and steam volume sensors are shown in Appendix C.
4.1 COOLOCE-11a
The test series was started with a dryout power measurement at atmospheric pressure that followed the normal heat-up sequence of the test facility. The steam line valve was fully open throughout the test run. However, after the steam generation started to increase following the power increments, the pressure started to show minor fluctuations and a slight increase to about 1.1 bar followed. This is typical to experiments at atmospheric pressure since there is flow resistance in the steam line and especially in its valve, and high steam flow rates are constricted in the pipeline (this means that the pressure control is not as stable as in pressures above atmospheric).
At the power of 21.9 kW, dryout was indicated by a sensor at 220 mm height in the centre of the test bed (26:122-45). This is the topmost sensor in the multi-point thermocouple at the centre of the test bed (see Appendix B). The dryout location remained steadily in this sensor, no spreading was seen. The temperature and power histories of the experiment are shown in Fig. 4 and the pressure and water level in the test vessel and feed water temperature in Fig. 5. The pressure and power increase seen in the end of the test run, just before 160 minutes, indicate the start of the next test run to be conducted at 2 bar abs.

RESEARCH REPORT VTT-R-03316-139 (22)
Fig. 4. Control power and the temperature of the sensor indicating dryout in COOLOCE-11a.
Fig. 5. Pressure and water level in the test vessel and feed water temperature in COOLOCE-
11a.

RESEARCH REPORT VTT-R-03316-1310 (22)
4.2 COOLOCE-11b
The test run at 2.0 bar followed the experiment at atmospheric pressure. Dryout was observed at the power of 30.0 kW by a temperature increase of about 5°C from the saturation temperature of 120°C, indicated by the sensor 26:122-45 at 220 mm from the test bed bottom. The increase was rather small and the sensor reading appeared to stabilize before the next power increment to 32.2 kW. At this power step, the temperature increase was drastic and the power was shut down after about 35°C increase. This suggests that the power of 30 kW is very close to the true dryout power and a local dry zone has been formed. However, the dry zone is so small, and presumably cooled by the steam flow, that the temperature excursion is very limited and a further power increment was required to develop a noticeable dryout.
It is reasonable to question whether the limited temperature increase at 30 kW can be considered a coolability limit (instead of the steep increase at 32 kW power) since the temperature increase remained around the criterion of 5°C which we have usually taken as the dryout limit. Furthermore, it does not seem likely that the limited temperature increase would cause any adverse effects such as debris re-melting in a reactor scenario. In this case, however, we have assessed the 30.0 kW to be the dryout power because (1) even though the temperature excursion is small, it is large enough not to have been caused by any offset or normal fluctuation in the temperature readings and (2) a consistent definition of dryout is necessary (≥5°C permanent temperature increase).
It is also noteworthy that none of the heater sensors showed increased temperatures. This is probably due to the location of the heater sensors being lower in the test bed (at 110 mm) than the dryout zone which is formed just below the cake simulant (top plate). The pressure and feed water level were well controlled in the experiment. The temperature and power histories of the experiment are shown in Fig. 6 and the pressure and water level in the test vessel and feed water temperature in Fig. 7.
Fig. 6. Control power and the temperature of the sensor indicating dryout in COOLOCE-11b.

RESEARCH REPORT VTT-R-03316-1311 (22)
Fig. 7. Pressure and water level in the test vessel and feed water temperature in COOLOCE-11b.
4.3 COOLOCE-11c
The test run at 3 bar followed the 2 bar experiment. In this experiment, two approaches to dryout (separate measurement at the dryout power) were necessary to obtain a reliable dryout because of a temporary failure in the water level control. At the occurrence of the first dryout, the water level had decreased, causing pressure fluctuations and somewhat unstable conditions in the test vessel (80-90 minutes into the experiment). More feed water was injected and another attempt to measure the dryout was made which verified the power level of 36.2 kW obtained in the first attempt.
The sensor indicating dryout was again the one near the top, 26:122-45. In the first dryout, the increase from saturation temperature (134 °C) was about 20°C and in the second about 4°C. The temperature and power histories of the experiment are shown in Fig. 8 and the pressure and water level in the test vessel and feed water temperature in Fig. 9.

RESEARCH REPORT VTT-R-03316-1312 (22)
Fig. 8. Control power and the temperature of the sensor indicating dryout in COOLOCE-11c.
Fig. 9. Pressure and water level in the test vessel and feed water temperature in COOLOCE-11c.
RESEARCH REPORT VTT-R-03316-1313 (22)
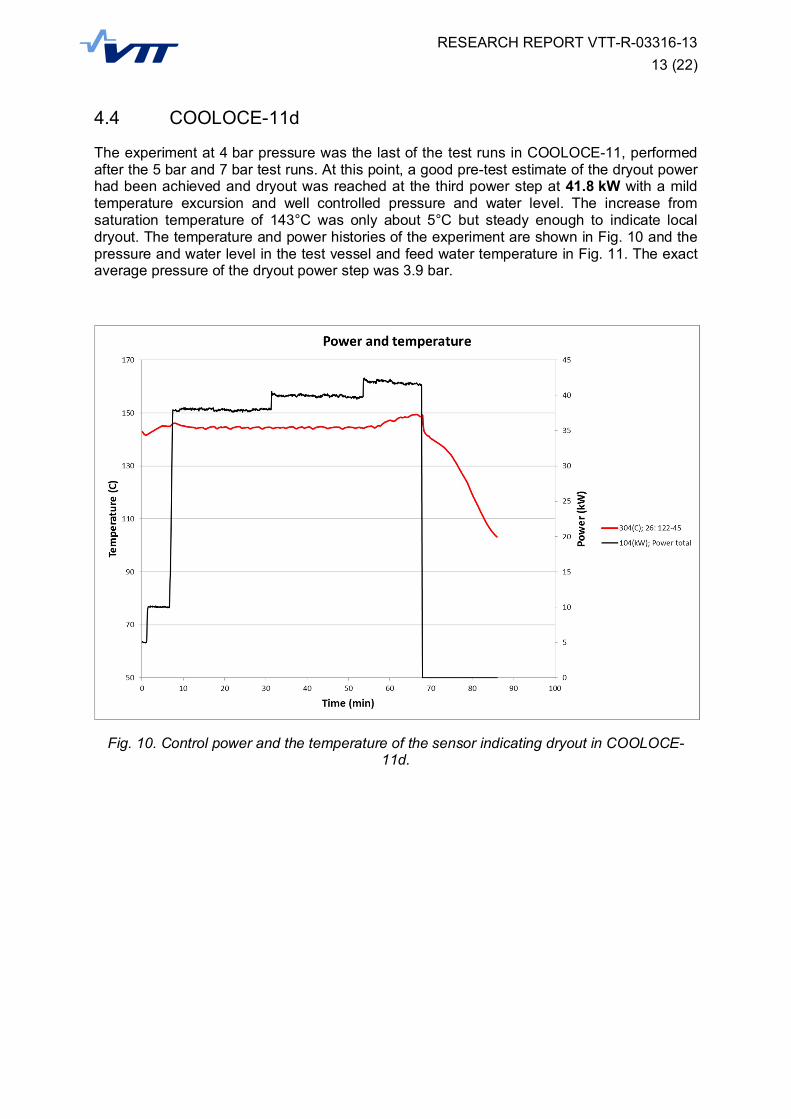
4.4 COOLOCE-11d
The experiment at 4 bar pressure was the last of the test runs in COOLOCE-11, performed after the 5 bar and 7 bar test runs. At this point, a good pre-test estimate of the dryout power had been achieved and dryout was reached at the third power step at 41.8 kW with a mild temperature excursion and well controlled pressure and water level. The increase from saturation temperature of 143°C was only about 5°C but steady enough to indicate local dryout. The temperature and power histories of the experiment are shown in Fig. 10 and the pressure and water level in the test vessel and feed water temperature in Fig. 11. The exact average pressure of the dryout power step was 3.9 bar.
Fig. 10. Control power and the temperature of the sensor indicating dryout in COOLOCE-11d.

RESEARCH REPORT VTT-R-03316-1314 (22)
Fig. 11. Pressure and water level in the test vessel and feed water temperature in COOLOCE-11d.
4.5 COOLOCE-11e
The experiment at 5 bar pressure was started after a heat-up sequence from a cold state. (The facility has been left to cool down overnight.) Dryout was observed at the power of 46.2 kW, indicated by the same sensor in the top centre as in the other experiments (26:122-45). The increase from saturation temperature (152°C) was about 8°C.
The temperature and power histories of the experiment are shown in Fig. 12 and the pressure and water level in the test vessel and feed water temperature in Fig. 13. The pressure showed minor fluctuations around the average of 4.9 bar. The heat-up sequence is seen in the figures, steady-state operation is reached at about 60 minutes.

RESEARCH REPORT VTT-R-03316-1315 (22)
Fig. 12. Control power and the temperature of the sensor indicating dryout in COOLOCE-11e.
Fig. 13. Pressure and water level in the test vessel and feed water temperature in COOLOCE-11e.
RESEARCH REPORT VTT-R-03316-1316 (22)
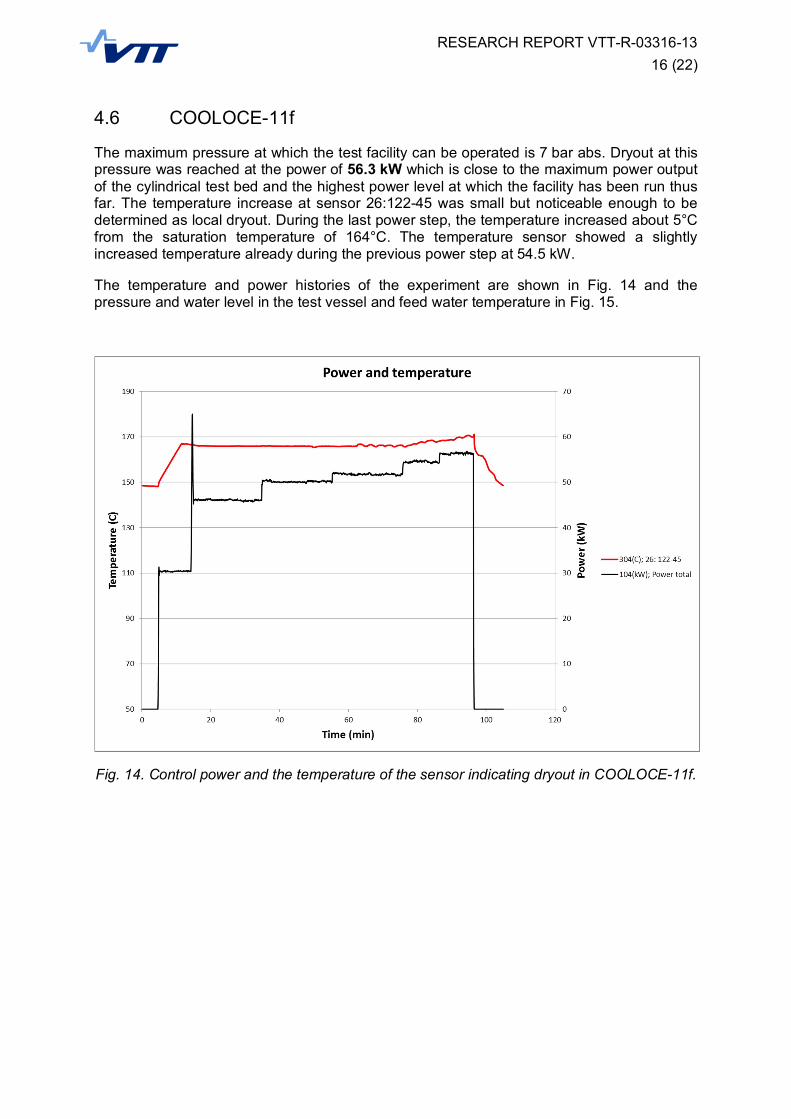
4.6 COOLOCE-11f
The maximum pressure at which the test facility can be operated is 7 bar abs. Dryout at this pressure was reached at the power of 56.3 kW which is close to the maximum power output of the cylindrical test bed and the highest power level at which the facility has been run thus far. The temperature increase at sensor 26:122-45 was small but noticeable enough to be determined as local dryout. During the last power step, the temperature increased about 5°C from the saturation temperature of 164°C. The temperature sensor showed a slightly increased temperature already during the previous power step at 54.5 kW.
The temperature and power histories of the experiment are shown in Fig. 14 and the pressure and water level in the test vessel and feed water temperature in Fig. 15.
Fig. 14. Control power and the temperature of the sensor indicating dryout in COOLOCE-11f.

RESEARCH REPORT VTT-R-03316-1317 (22)
Fig. 15. Pressure and water level in the test vessel and feed water temperature in COOLOCE-11f.
5. Effect of flow mode on coolability
The cylindrical bed experiments include three different flow configurations and one experiment with an alternative material, the alumina gravel that was used in the STYX experiments [9, 10]. It is well known that the flow mode has an effect on coolability. The debris bed which is top-flooded has poorer coolability than the same bed flooded though the bottom which has been shown to be highly favourable mode for coolability (by e.g. the classical experiments by Hofmann [11]). Coolability is also increased by downcomers or similar arrangement that allows lateral infiltration [9].
In the COOLOCE experiments with a cylindrical test bed, the top-flooded bed was found to have the poorest coolability. Even the case with a cake simulant that fully blocked the flows through the debris bed top and forced the steam flow to exit through the sidewall has slightly better coolability than the top-flooded bed with closed sidewall. As expected, the best coolability was measured for the fully flooded cylinder with all surfaces (except bottom) open to water infiltration.
The result of the three experiments valid for comparison, COOLOCE-3-5, COOLOCE-10 and COOLOCE-11 are presented in Table 2. To elucidate the results, the dryout heat flux for the different pressure levels is plotted in Fig. 16. For COOLOCE-10, the highest pressure is 3 bar due to the limited power output of the facility. As a result of the differences in the flow mode, there is some difference in the dryout zone locations. The approximate locations of dryout (based on the thermocouple locations) in the three experimental series with the cylindrical test bed are shown in Fig. 17.

RESEARCH REPORT VTT-R-03316-1318 (22)
Table 2. Dryout power and heat flux in the cylindrical bed experiments. The area for which the heat flux is calculated is 0.0755 m2 for the test series 3-5 and 0.0731 m2 for the test
series 10 and 11 (the difference is due to the small space taken by the sidewall wire net not yet installed in 3-5).
Experiment Pressure Dryout power [kW] Dryout heat flux [kW/m2]
COOLOCE-3-5
(top flooding)
1.1 20.4 270 2.0 26.2 347 3.0 31.9 423 4.0 34.6 458 5.0 37.2 493 7.0 42.3 560
COOLOCE-10
(lateral and top flooding, “fully flooded”)
1.3 34.1 467
2.0 40.1 549
2.9 46.2 632 COOLOCE-11
(laterally flooded, blocked top)
1.1 21.9 300 2.0 30.0 411 3.0 36.2 495 3.9 41.8 572 4.9 46.2 632 5.9 56.3 771
Fig. 16. Dryout heat flux vs. pressure in the cylindrical bed experiments with three flow modes.

RESEARCH REPORT VTT-R-03316-1319 (22)
(a) (b)
(c)
Fig. 17. Dryout zone locations according to the COOLOCE experiments in (a) top-flooded test bed, (b) top and laterally flooded test bed and (c) laterally flooded test bed with an
agglomerate simulant.
The difference between the top-flooded and “fully flooded” cylinder is significant. The contribution of the open sidewall caused the dryout heat flux to increase about 50-70% for the measured pressure levels. The coolability of the cylinder with lateral flooding and blocked top is between the fully flooded and the top flooded cylinder with the dryout heat flux being 10-40% greater than the top flooding DHF.
The flow mode explains the dryout zone location in the two cylindrical beds with lateral flooding. The steam flux increases when moving upwards in the geometry and the greatest void fraction (lowest saturation) in steady-state conditions is seen at the top in all homogenously heated beds (the test arrangement approximates homogenous heating). Simultaneously with this condition, water is fed through the full length of the sidewall to replace the evaporated water. The bottom parts of the test bed are well accessible to the surrounding water which maintains them coolable. Water flows upwards co-current with steam in the test bed (and directly above it) and downwards in the pool outside of the test bed, forming a two-phase flow natural circulation loop driven by boiling in the hot debris bed.

RESEARCH REPORT VTT-R-03316-1320 (22)
The high void fraction near the central top region of the test bed and the horizontal distance from the water reservoir at the sidewall makes the region marked in Fig. 17(b) the most vulnerable zone to local dryout in the fully flooded cylinder.
In the case of the cylinder with the blocked top, the lower region is well coolable but steam cannot discharge though the top surface and it has to find a different flow path through the upper parts of the open cylinder sidewall. This means that the agglomerate simulant serves as a lid that, presumably, traps some of the steam under it. Then, dryout is reached with a lower power compared to the fully flooded cylinder. The details of the flow field in this case have not yet been investigated using simulation codes.
In the case of the top-flooded cylinder, dryout was seen near the centre, or the lower centre region of the test bed. The location lower in the bed is explained by the saturation transient described by Hofmann [11] and shown in many later studies such as in the MEWA 2D simulations [12]. In the initial stages after dryout power is exceeded, the increasing void reduces the steam flow (counter-current to the liquid flow) and temporarily allows water to infiltrate deeper into the test bed. This causes the point of maximum void fraction to move lower in the debris bed. However, at this power the evaporation rate already exceeds the liquid flow rate into the test bed and all the incoming water is evaporated before it reaches the bottom of the bed.
It should be noticed that the measured dryout location is not in an exact agreement with the location of the homogenously heated top-flooded (one-dimensional) bed. At the exact dryout power, dryout is formed in the bottom of the bed (at zero height) and it covers the full cross-section of the bed (as the behaviour is one-dimensional). This behaviour is not reproduced in the experiments because (1) the heating is not homogenous and all 3D effects cannot be eliminated and (2) the power control has a limited accuracy.
The 2 kW power steps mean that the maximum error of the DHF is about 30 kW/m2 (below the measured value). The role of the heating arrangement as a source of uncertainty has been discussed in earlier reports and publications [5, 13]. The agreement between simulations and the experiments is good which suggests that the overall coolability that can be measured with the present test facility is adequately close for the coolability of a debris bed with entirely homogenous heating. In fact, when assessing the results against simulations, it is difficult to distinguish the uncertainty caused by the non-homogeneity from the small uncertainties in porosity and particle size [14]. We assume that the relative coolabilities of the different geometries are not affected by these uncertainties because the same facility and particles are used in all the geometry comparison experiments.
6. Discussion
The COOLOCE-11 experiment concludes the series of experiments that measured dryout power (heat flux) in debris beds of cylindrical geometries with different flow modes. The comparisons of the three different configurations clarify the coolability differences. The results of the fully flooded and the laterally flooded cylinders are not directly scalable to power plant scenarios because the ratio of the height and width are different from the realistic debris bed.
For power plant assessment, the simulation codes, especially MEWA 2D, have to be validated against the experiments. The validation work verifies that the codes are capable of predicting the dryout power correctly in the different types of beds and flow configurations. The experiments conducted thus far have addressed the following cases
· heap-like (conical)
· mound-like (fully flooded)

RESEARCH REPORT VTT-R-03316-1321 (22)
· evenly distributed (top-flooded cylindrical)
· with agglomerate (cake) formation
One geometry variation of relevance, a conical heap formed on a cylindrical, evenly distributed bottom part has not yet been investigated. The experiment with a cone on a cylindrical base will be performed next to make the set of COOLOCE geometry variations as exhaustive as possible. It is important to keep in mind that the debris bed formation (solidification and settlement of particles) is a stochastic process whose outcome cannot be fully predicted. The debris bed may be highly complex in terms of particle size, morphology and the spatial distribution of particles. The geometry variations examined in the COOLOCE experiments represent (approximate) certain possibilities of two-phase flow modes in the complex debris beds of power plant scenarios.
7. Summary
A series of debris bed coolability experiments, COOLOCE-11, with a cylindrical test bed and an agglomerate (cake) simulant has been conducted. The experimental set-up allows water infiltration through the sidewall of the cylinder but the top surface is impermeable due to a solid block which, in a realistic scenario, would consist of agglomerated debris particles. The pressure range investigated was 1-7 bar (absolute). Comparisons to previous experiments with cylindrical debris bed with different flow modes have been presented. The results suggest that the bed with both top and lateral flooding has the best coolability: the measured dryout heat flux (DHF) is 50-70% greater than the DHF of the test bed with top flooding only. Also, the test bed with the agglomerate simulant has better coolability than the top-flooded test bed, with 10-40% greater DHF. The results will be utilised in the validation and development work of simulation codes.
References
1. Takasuo, E., Kinnunen, T. Pankakoski P.H., Holmström, S. Description of the COOLOCE test facility – Conical particle bed. Research Report VTT-R-08956-10. Espoo, 2010. 18 p.
2. Takasuo, E., Kinnunen, T. Pankakoski P.H., Holmström, S. The COOLOCE-2
coolability experiment with a conical particle bed. Research Report VTT-R- 02427-11. Espoo, 2011. 15 p.
3. Takasuo, E., Kinnunen, T. Pankakoski P.H., Holmström, S. The COOLOCE particle
bed coolability experiments with a cylindrical geometry: Test series 3–5. Research Report VTT-R-07099-11. Espoo, 2011. 27 p.
4. Takasuo, E., Kinnunen, T. Pankakoski P.H., Holmström, S. The COOLOCE particle bed coolability experiments with a conical geometry: Test series 6–7. Research Report VTT-R-07097-11. Espoo, 2011. 26 p.
5. Takasuo, E., Holmström, S., Kinnunen, T., Pankakoski, P.H. The COOLOCE experiments investigating the dryout power in debris beds of heap-like and cylindrical geometries. Nuclear Engineering and Design 250 (2012), p. 687-700.
6. Takasuo, E., Kinnunen, T., Holmström, S. COOLOCE particle bed coolability
experiments with a cylindrical test bed: Test series 8-9. VTT Research Report VTT-R-07224-12. Espoo, 2012, 43 p.

RESEARCH REPORT VTT-R-03316-1322 (22)
7. Takasuo, E., Kinnunen, T., Lehtikuusi, T., Holmström, S. COOLOCE coolability experiments with a cylindrical debris bed and lateral flooding: COOLOCE-10. VTT Research Report VTT-R-00463-13. Espoo, 2013. 16 p.
8. Ma, W. 2012. Study of irregular multi-sized particles bed using POMECO-FL facility
(Draft). E-mail communications from Weimin Ma, December 4, 2012.
9. Takasuo, E., Holmström, S., Kinnunen, T., Pankakoski, P.H., Hosio, E., Lindholm, I. The effect of lateral flooding on the coolability of irregular core debris beds. Nuclear Engineering and Design (2010). doi:10.1016/j.nucengdes.2010.04.033
10. Lindholm, I., Holmström, S., Miettinen, J., Lestinen, V., Hyvärinen, J., Pankakoski, P.,
Sjövall, H. Dryout Heat Flux Experiments with Deep Heterogeneous Particle Bed. Nuclear Engineering and Design 236 (2006), pp. 2060–2074.
11. Hofmann, G. On the location and mechanisms of dryout in top-fed and bottom-fed particulate beds. Nuclear Technology, 65 (1984), pp. 36–45.
12. Takasuo, E., Hovi, V., Ilvonen, M., Holmström, S. Modeling of Dryout in Core Debris Beds of Conical and Cylindrical Geometries. 20th International Conference on Nuclear Engineering collocated with the ASME 2012 Power Conference. July 30 – August 3, 2012, Anaheim, California, USA. ICONE20-POWER2012-54159.
13. Takasuo, E., Hovi, V. MEWA and PORFLO calculations of the COOLOCE experiments. Research Report VTT-R-00967-12. Espoo, 2012. 36 p.
14. Takasuo, E. Debris coolability simulations with different particle materials and comparisons to COOLOCE experiments. Research Report VTT-R-00257-13. Espoo 2013. 17 p.

RESEARCH REPORT VTT-R-03316-13
A
Appendix A. Heater arrangement of the COOLOCE cylinder
15.
65 66 67 68 69
58 59 60 61 62 63 64
49 50 51 52 53 54 55 56 57
40 41 42 43 44 45 46 47 48
31 32 33 34 35 36 37 38 39
22 23 24 25 26 27 28 29 30
13 14 15 16 17 18 19 20 21
6 7 8 9 10 11 12
1 2 3 4 5
Electrical phases Conncention box123
0°
27090°
180°

RESEARCH REPORT VTT-R-03316-13
B
Appendix B. Thermocouple arrangement of the COOLOCE cylinder
Example of how to read the map:
111-225 1 – number of the ring to which the thermocouple belongs to (1 indicates the central sensors, 5 the outermost) 11 – height of the thermocouple from the bottom in cm 225 – angle between the thermocouple location and 0°

RESEARCH REPORT VTT-R-03316-13
C
Appendix C. Temperature histories
COOLOCE-11a
COOLOCE-11b

RESEARCH REPORT VTT-R-03316-13
C
COOLOCE-11c
COOLOCE-11d

RESEARCH REPORT VTT-R-03316-13
C
COOLOCE-11e
COOLOCE-11f