coordination area to prevent interference from lmds ... · 1 ipn progress report 42-174 • august...
TRANSCRIPT

1
IPN Progress Report 42-174 • August 15, 2008
Coordination Area to Prevent Interference from LMDS Transmitters Operating in the 25.7-GHz Band in Areas around the Robledo DSN Stations in SpainChristian Ho*
* Communication Architectures and Research Section.
The research described in this publication was carried out by the Jet Propulsion Laboratory, California Institute of Technology, under a contract with the National Aeronautics and Space Administration.
The Local Multipoint Distribution Service (LMDS) is a broadband wireless point-to-multi-point (P-MP) communication system operating in the frequency band between 24.5 and 26.5 GHz. The LMDS systems can cause potential interference to the Deep Space Network (DSN) stations in Robledo by propagating over the horizon and over the intervening ter-rain. This article assesses the potential interference to the Robledo DSN antennas from the LMDS emitters operating around the Madrid area and develops a coordination contour for planning future LMDS development in areas surrounding the Robledo DSN antennas.
I. Background
The Local Multipoint Distribution Service (LMDS) is a broadband wireless point-to-mul-tipoint (P-MP) communication system operating in the frequency band between 24.5 and 26.5 GHz that can be used to provide digital two-way voice, data, Internet, and video services. However, the LMDS deployment in the area around Madrid, Spain can cause po-tential interference to the Deep Space Network (DSN) stations in Robledo because the DSN will operate in the 25.5- to 27.0-GHz frequency band to support lunar and Lagrangian orbit missions. Although there is no direct line-of-sight in general between the LMDS trans-mitters and the DSN antennas at Robledo, emissions from the LMDS transmitters can be received by the DSN antennas through anomalous propagation modes, and the emissions may exceed the protection criteria established by the International Telecommunications Union (ITU) for the protection of the Space Research Service (SRS) in this band. The study described here estimates the interference levels and suggests a coordination area to protect the DSN antennas from harmful interference from LMDS transmitters operating in areas around the Robledo DSN site.
II. A Brief Description of the LMDS Systems and Characteristics
To perform this study, certain parameters of the LMDS systems are needed. SETSI (Spanish Secretary of State for Telecommunications and Information Society) provided the character-

2
istics of the LMDS systems deployed around Madrid in a NASA/SETSI document.1 Informa-tion from this document forms the basis of this study and is summarized below.
The LMDS systems in Spain have the following specifications: The point-to-multipoint (P-MP) communication system operates in the 24.549- to 24.717-GHz band for downlinks and in the 25.557- to 25.725-GHz band for uplinks. The uplinks that are of interest to us are from subscribers (terminal stations) to the base station. Typically, each 56-MHz downlink channel is paired with eight 7-MHz uplink carriers that provide 10.75 Mbps each on the air. Each downlink channel of 56 MHz is used by two 28-MHz carriers, and each of these carriers is paired with four 7-MHz uplink channels. The frequency spectrum for this system is shown in Figure 1. A typical cell consists of four 90-deg sectors. As shown in Figure 2, two adjacent sectors use different frequencies, while two opposite sectors use the same frequen-cy but with opposite polarizations.
1 Personal communication, Benito Gutierrez-Luaces, July 27, 2006; NASA/SETSI document provided by Carlos Carrascal, June 15, 2007.
Figure 2. An LMDS cell that consists of a base station and a number of terminal stations. The cell is divided into
four 90-deg sectors to achieve frequency reuse.
Figure 1. Frequency spectrum for the LMDS systems deployed around Madrid in Spain. Transmission from a
terminal station to a base station (uplink) will interfere with the DSN receiving station at Robledo.
P–MP P–P P–MP P–P
3 x 56 MHz 3 x 56 MHz
1 2 3 1' 2' 3'
24.5 GHz 26.5 GHz
2460524549 24661 24717
Downlink
24717 MHz24549 MHz25445 MHz
25557 MHz25725 MHz
26453 MHz
2561325557 25669 25725
Uplink
Typical Range of 5 km
Base Stationf1Pol V
f2Pol V
f2Pol H
f1Pol H

3
The subscriber terminal unit transmits a 7-MHz carrier with 14 dBm power (–16 dBW) to a subscriber antenna of approximately 35 dBi gain. The cell size for a typical base station is 5 km. The typical location of a base station is on top of the hills or tall buildings. The sub-scriber antennas thus generally point slightly up (from 0 to 3 deg).
III. Study Approach and Assumptions
The DSN receiving station at Robledo will use the 25.5- to 27.0-GHz frequency band to support downlinks from lunar and Lagrangian orbit missions. Thus, it has an overlap in the frequency between 25.557 and 25.725 GHz with the LMDS uplink. In this article, we first estimate the interference level received by the Robledo DSN antennas from one LMDS cell located at a given azimuth angle, and then compare that level with the space research pro-tection criterion established by the ITU for this band. From this comparison, the necessary coordination distance to prevent harmful interference to the DSN in that azimuth direction is determined. The process is repeated for all azimuth angles to obtain a complete coordina-tion contour around the Robledo DSN site. A number of simplifying assumptions are used.
IV. Analysis of Interference from Emitters of One Cell in a Given Azimuth Direction
Table 1 shows a sample link analysis. We have assumed that the interference is from one single LMDS cell in a given azimuth direction. There may be more than one transmitter in that cell contributing to the interference (to be discussed later). Interference from emit-ters in other cells, in the same azimuth direction or otherwise, is not considered. The key parameters in the table are described below.
Table 1. Link table for LMDS interference analysis.
Parameter
Transmitting frequency
Transmitter power per carrier
Transmitter antenna boresight gain
Top 1 percent antenna gain
EIRP for each carrier at 1 percent
Transmitting data rate
Transmitting bandwidth
Transmitter EIRP PSD
Transmitter cell range
DSN receiver antenna gain
DSN receiver system noise temperature
when pointed to the Moon
DSN receiver noise spectral density
Allowed I0N0
Interference threshold
Propagation loss required for one transmitter
Symbol
f
Tx
Gt
B
EIRPPSD
Gr
Tsys
N0
I0
Lreq
Value
25.7
10.75
7
5
350
Unit
GHz
Mbps
MHz
km
K
Value
–16
35
31
15
68.5
–53.5
variable
–203.1
–6
–209.1
155.6+Gr
Unit in dB
dB(W)
dBi
dBi
dB(W)
dB(Hz)
dB(W/Hz)
dBi
dB(W/Hz)
dB
dB(WHz)
dB

4
A. Effective Transmitter Antenna Gain
For LMDS transmitter within about 50 km from the Robledo station in the east and south directions, the dominating propagation mode is the diffraction mode (to be discussed later). The interference level in this case is a function of the distance and the effective gains of both the transmitting antenna and the receiving antenna in the transmitter-to-DSN direc-tion. The effective gain for a given transmitter antenna is its gain in the direction of the DSN antennas in Robledo. The maximum antenna gain is 35 dBi. This gain is reduced by an amount determined by the off-axis angle, i.e., the angle between the boresight of the trans-mitter antenna and the direction to the DSN. The effective gain of the receiving antenna is the gain of the DSN antenna in the direction of the interference along the transmitter-to-DSN direction (to be discussed in more detail later).
In general, the effective gain for a given transmitter is determined by its pointing direction in elevation and azimuth. As stated before, the subscriber antennas generally point slightly up towards the base station, which is typically located on top of a hill or a tall building. For the diffraction mode, interference from the LMDS transmitters in a given azimuth direction is assumed to be coming from the top of the intervening hills in that direction. The effec-tive gain can thus be assumed to be solely determined by the pointing of the transmitting antenna in the azimuth direction.
As previously mentioned, there are two transmitters using the same 7-MHz frequency chan-nel with opposite polarizations in each cell. Therefore, for a given frequency and polariza-tion, there will be only one LMDS transmitter in each cell contributing to interference to the DSN. At any time we only see one LMDS transmitter with its antenna pointed towards the DSN direction. Figure 3 is a reference radiation pattern based on ITU-R recommenda-
Figure 3. Antenna gain model for the LMDS transmitter antenna based on ITU F.669 model for a small antenna
(with D/λ<100). At the top 1.0 percent of azimuth distribution, the antenna has a gain of 31 dBi.
Ant
enna
Gai
n, d
Bi
40
ITU Antenna Model (F.699)for D/λ < 100f = 25.7 GHzD = 1 m, λ = 0.0116 mGm = 35 dBi
30
20
10
0
–100.010.001 10.1 10
Off-Boresight Angle, deg
Gt = 31 dBi at 0.9 deg(Top 1% of azimuths)
5
tion F.699. Under the assumption that the off-axis angle is uniformly distributed in (–90, 90 deg), the effective antenna gain for a 99 percent confidence level is calculated below:
Minimum off-axis angle = 90# (100 percent –99 percent) = 0.9 deg Effective transmitting antenna gain = Gt (0.9 deg) = 31 dBi
where Gt is the transmitter antenna gain. The gain in the direction to the DSN site is less than or equal to 31 dBi for 99 percent of the time. Only during 1 percent of the time would the gain exceed 31 dBi.
B. Transmitter EIRP Power Spectral Density
Using the effective transmitting antenna gain of 31 dBi and a bandwidth of 7 MHz, and assuming that only one transmitter in each cell could contribute to interference to the DSN, the transmitter’s effective isotropic radiated power (EIRP) spectral density (PSD) can be calculated as follows:
EIRPPSD = 31 dBi - 16 dBW - 68.5 dB (Hz) =-53.5 dB (WHz)
C. Applicable SRS Protection Criterion
The SRS protection criterion established by the ITU for the frequency band of interest is I0 /N0 = –6 dB for 99.9 percent of the time, where
I0 = Interference spectral density, dB(W/Hz) N 0 = Receiver noise spectral density, dB(W/Hz) = kBTsys
where kB is the Boltzmann constant, while Tsys is system noise temperature.
D. Receiver System Noise Temperature
When the DSN antenna is tracking a lunar mission on or near the Moon, the background noise from the Moon contributes a significant part to the total system noise temperature Based on existing link design for lunar mission operating in the 25.5- to 27-GHz band, the total system noise temperature is 350 K.2 (The system noise temperature for Lagrangian orbit missions is discussed in Appendix A).
E. Maximum Allowed Interference Spectral Density and Required Propagation Loss
The DSN receiver system noise when it points to the Moon is therefore
N 0 = kBTsys
N 0 =-228.6 + 10 log10 (350) = -203.1 in dB(W/Hz)
(2)
(1)
2 Provided by Sal Kayalar. Also see the 2005 IEEE Aerospace Conference paper by G. K. Noreen et al. [1]

6
Based on a protection criterion of –6 dB of I0 /N0, the maximum allowed interference spec-tral density is
I0 =-209.1 dB(WHz)
The required minimum propagation loss needed to reduce the interference to not exceed the allowable level is
Lreq = EIRPPSD+ Gr- I0 =-53.5 + Gr+ 209.1 = 155.6 + Gr (dB)
where Gr is the effective gain of the receiving DSN antenna, i.e., the gain in the direction of the interference. For a different receiving antenna gain Gr, there is a different Lreq, and consequently a different coordination distance.
F. Effective Gain of the DSN Antenna
In order to determine the amount of propagation loss, it is necessary to determine the effective gain of the receiving DSN antenna in the direction of the interference. This gain is a function of the separation angle between the antenna boresight and the interference path. The DSN receiving antennas at Robledo are surrounded by hills. There is no direct line of sight in general between the DSN and the LMDS transmitters in the Madrid area. However, emissions from the LMDS transmitters can propagate trans-horizontally over the intervening hills and be received by the DSN antennas. For most azimuth directions and for close distances, terrain diffraction is the dominant mode for interference propagation. For a given azimuth direction, the interference can be assumed to come from the top of the intervening hills in that direction. Consequently, the effective receiving antenna gain is determined by the separation angle between the DSN antenna boresight and the direction from the DSN antenna to the top of the hills along that azimuth direction, as illustrated in Figure 4.
Figure 4. An illustration of various angles used in this study. Interference from LMDS subscriber stations
around Madrid can propagate over the terrain and be received by the DSN station.
(3)
Off-Boresight Angle
Antenna Boresight
DSN
Tracking Elevation Angle
Terrain Elevation Angle
10 deg Minimum Operating Angle
Terrain
SubscriberBase Station
LMDS
Moon
Interference Path

7
In Figure 4, the DSN antenna tracking a lunar mission at or near the Moon is pointed to a certain elevation angle and azimuth angle. The emissions from an LMDS transmitter locat-ed some distance away from the DSN antenna reach the DSN antenna by propagating over the intervening terrain. The terrain elevation angle, the tracking elevation angle, the sepa-ration angle, and the minimum operation angle are shown in this figure. The minimum operational angle is the elevation angle at the beginning of the track, which is assumed to be 10 deg for the 25.5- to 27-GHz band.
V. Coordination Contour
Applying the method discussed in the previous section, we have established the coordina-tion distance (or coordination contour) for azimuth angles ranging from 0 to 360 deg at 1-deg increments. There are two key assumptions in developing the contour:
(1) There is one LMDS cell in each azimuth direction. The coordination distance for a given azimuth direction is determined by the interference from this cell in that azimuth direction, without considering interferences from cells in other azimuth directions.
(2) The minimum possible separation angle is used to determine the coordination distance, taking into account the minimum operational elevation angle of 10 deg, the terrain elevation angle, and the minimum tracking elevation angles.
A. Minimum Separation Angle while Tracking a Lunar Mission
The maximum and minimum elevation angles of the DSN antenna tracking a lunar mis-sion are obtained from a computer simulation based on one year of tracking data. Table 2 lists six sample tracks (each separated by two months) showing the azimuth and elevation
Table 2. Required propagation losses for six representative lunar tracks.
Parameters
Sample date
Start of track (t1)
El(t1)
Az(t1)
El_terrain at Az(t1)
Sep. angle i1 of El1 and El1_ter
Gr 1 at i1, dB
Lreq =155.6+Gr 1
End of track (t2)
El(t2)
Az(t2)
El_terrain at Az(t2)
Sep. angle i2 of El2 and El2_ter
Gr2 at i2, dB
Lreq =155.6+Gr2
Case 2
Mar. 1
10.0
120.8
2.9
7.1
10.7
166.3
10.0
236.5
4.6
5.4
13.7
169.3
Case 3
May 1
10.0
133.9
3.8
6.2
12.2
167.8
10.0
228.6
4.9
5.1
14.3
169.9
Case 4
July 1
10.0
79.3
6.7
3.3
19.0
174.6
10.0
284.0
6.5
3.5
18.4
174.0
Case 5
Sept. 1
10.0
70.8
4.5
5.5
13.5
169.1
10.0
286.4
7.2
2.8
20.8
176.4
Case 6
Nov. 1
10.0
117.9
2.9
7.1
10.7
166.3
10.0
239.2
4.8
5.2
14.1
169.7
Case 1
Jan. 1
10.0
84.1
7.2
2.8
20.8
176.4
10.0
272.7
6.0
4.0
16.9
172.5

8
Figure 5. Maximum and minimum elevation angles for the DSN receiving antenna tracking the Moon. During
the year, the Moon rises from the east and sets to the west, but it can appear anywhere within the shaded
area. The assumed antenna minimum operating angle (10 deg) and the terrain (terrain mask) elevation
angle around the Robledo DSN station for all azimuth directions are also shown.
angles during a track from moonrise (from east) to moonset (to west). The maximum and minimum tracking elevation angles are shown in Figure 5 as a function of the azimuth angle. The Moon (or the lunar mission) can appear anywhere within the shaded region. The other two curves in the figure are the terrain-elevation angles (terrain mask) and the assumed minimum operational elevation angle of 10 deg.
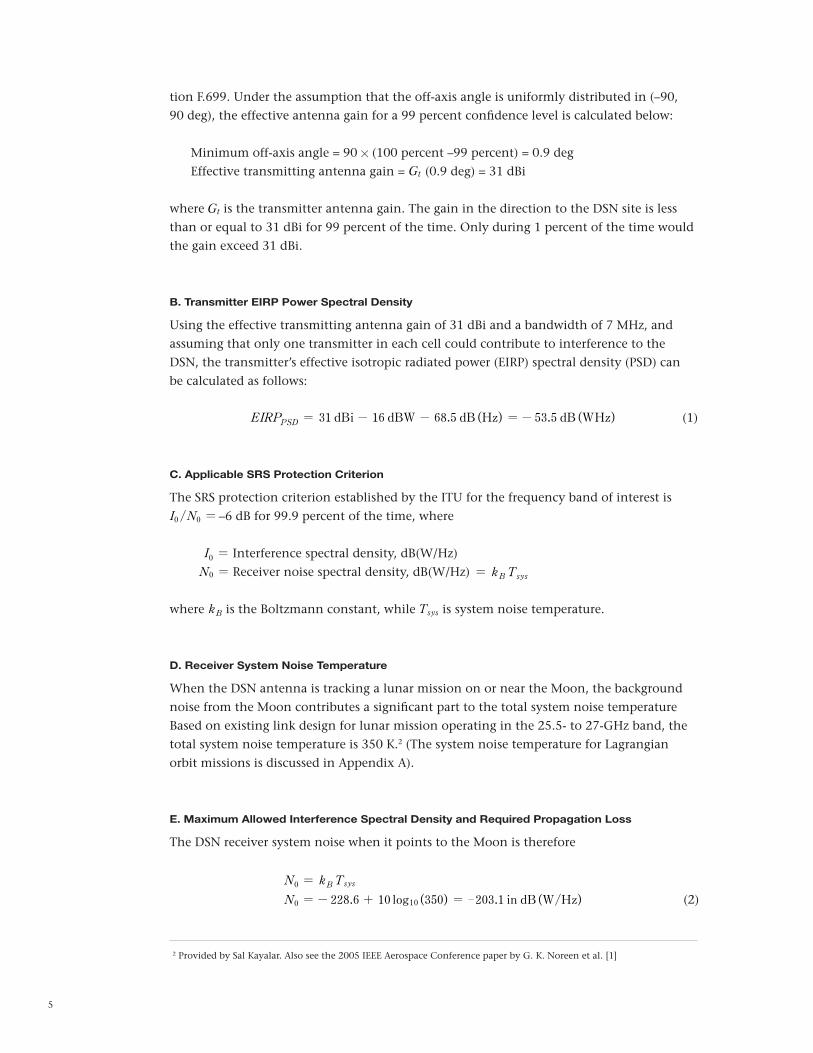
The minimum separation angle for each azimuth angle and the effective receiving antenna gain are calculated and shown in Figure 6. The gain is based on the ITU antenna model (F.699) for the 34-m DSN antenna (D/m 1 100). Because the Moon (or the lunar mission) is below the horizon between 0 to 60 deg and 300 to 360 deg azimuth sectors, as shown in the figure, the receiving antenna gain is assumed to be –10 dBi in those sectors. Between 60 to 140 deg and 220 to 300 deg azimuth sectors, the minimum separation angle is the difference between the terrain angle and minimum operational elevation angle of 10 deg. For the azimuth range between 140 to 220 deg, the minimum separation angle is the differ-ence between the Moon’s minimum elevation angle and the terrain elevation angle.
Ele
vatio
n A
ngle
, deg
80
120
Azimuth Angle, deg
60
40
20
00 60 300180 240 360
Moon Minimum Elevation Angle
Moon Maximum Elevation Angle
MinimumOperating Elevation Angle
TerrainMask
9
Figure 6. The separation (off-boresight) angles between the boresight of the receiving antenna and the direction
of interference as a function of azimuth angle around the Robledo DSN station are shown using the left axis
and a solid line. The effective antenna gains of the DSN receiving antenna are shown using the right axis and
a dotted line. When the azimuth angle is less than 60 deg or greater than 300 deg, the Moon is below the horizon
and the receiving antenna gain is –10 dBi.
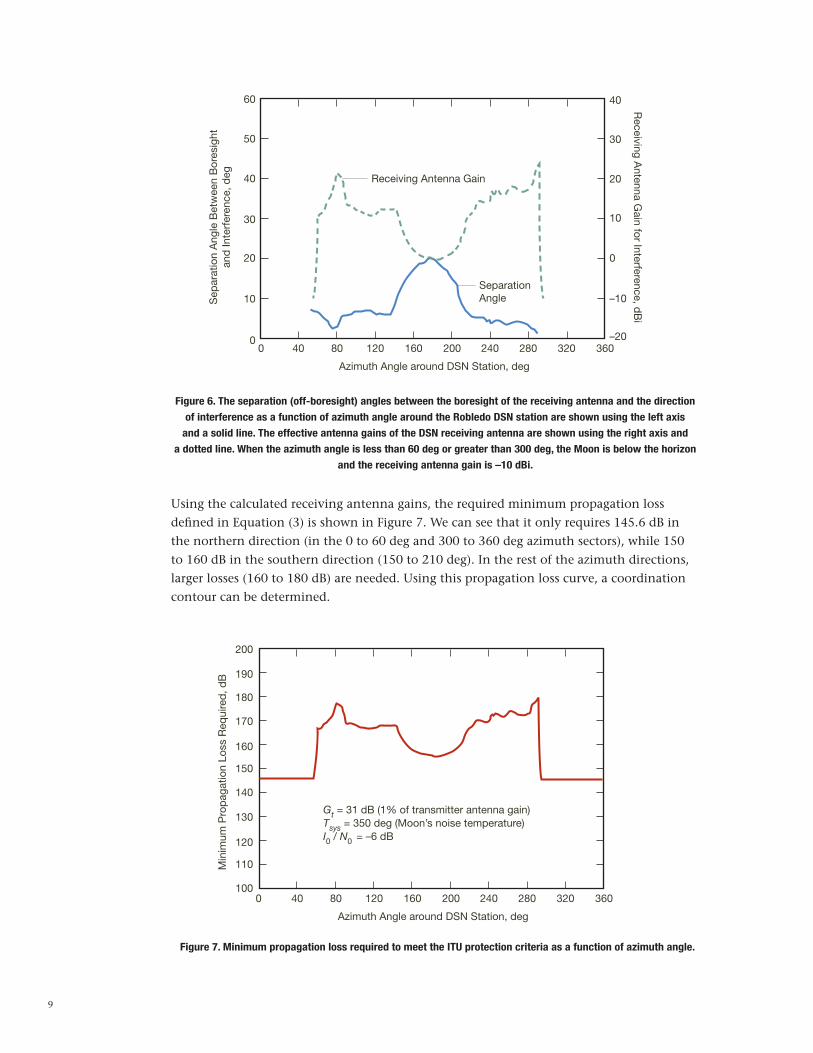
Figure 7. Minimum propagation loss required to meet the ITU protection criteria as a function of azimuth angle.
Using the calculated receiving antenna gains, the required minimum propagation loss defined in Equation (3) is shown in Figure 7. We can see that it only requires 145.6 dB in the northern direction (in the 0 to 60 deg and 300 to 360 deg azimuth sectors), while 150 to 160 dB in the southern direction (150 to 210 deg). In the rest of the azimuth directions, larger losses (160 to 180 dB) are needed. Using this propagation loss curve, a coordination contour can be determined.
Sep
arat
ion
Ang
le B
etw
een
Bor
esig
ht
and
Inte
rfer
ence
, deg
60
80
Azimuth Angle around DSN Station, deg
50
40
30
00 40 200120 160
20
10
240 360280 320
Receiving Antenna Gain
Separation Angle
40
30
20
10
0
–10
–20
Receiving A
ntenna Gain for Interference, d
Bi
Min
imum
Pro
pag
atio
n Lo
ss R
equi
red
, dB
200
80
Azimuth Angle around DSN Station, deg
190
180
170
140
0 40 200120 160
160
150
240 360280 320
130
100
120
110
Gt = 31 dB (1% of transmitter antenna gain)Tsys = 350 deg (Moon’s noise temperature)I0 / N0 = –6 dB

10
The contour assumes a minimum separation angle between the boresight of the DSN antenna and the interference path as discussed in Section V.A. This minimum separation angle happens at the beginning or the end of the track when the DSN antenna elevation angle is low. As the DSN antenna elevation angle rises during a track, the separation angle becomes larger, the power level of the interference received by the DSN becomes lower, and the percentage of time (p) becomes smaller. The percentage of time (p) averaged over the entire track hence will be much smaller than 1.0 percent. The average percentage of time is estimated for six typical tracks in Appendix B.
B. Two-Dimensional Propagation Loss Map and Coordination Contours
Using the Trans-Horizon Interference Propagation Loss (THIPL) computer program and high-resolution terrain data, a propagation loss map (in Figure 8) has been generated for the Madrid–Robledo area for the 26-GHz band and for p = 1.0 percent where p is the percentage of time when the loss is NOT exceeded. As shown in the map, in the east side of the DSN site is the Madrid metropolitan area where LMDS base stations are being deployed. The planned LMDS base stations are also shown in the figure. Applying the required mini-mum propagation losses showed in Figure 7, we could define a coordination zone around the Robledo DSN station as marked by a black line in the map. This contour circles an area beyond which a single cell of LMDS transmitters at a given azimuth angle will not interfere with the DSN antenna more than 1.0 percent of the time.
Figure 8. Propagation loss map with a coordination area around the Robledo DSN site for 1.0 percent of time
exceeded. LMDS stations deployed inside this area will cause harmful interference to the Robledo DSN station.
There are total 32 existing LMDS cells deployed around Madrid in the east side of the DSN station
but outside of the coordination area.
Nor
th–S
outh
Dis
tanc
e, k
m
50
0
East–West Distance, km
40
30
20
–30
–20 –10 3010 20
10
–10
40 6050 70
250
240
230
220
210
200
190
Prop
agation Loss, dB
0
–20
–40
–50
180
170
160
150

11
VI. LMDS Deployments in Madrid
An expanded map with the LMDS base station deployment pattern in the Madrid metro-politan areas is showed in Figure 9. The coordination zone (for p = 1.0 percent) around Robledo DSN site is also showed in the left side of this map.
Figure 9. LMDS base station deployment map around the Madrid metropolitan area. On the left side is the coordi-
nation area around the DSN site for 1.0 percent of time exceeded. All deployed stations are outside of this area.
Based on information provided by SETSI, 31 base stations have been deployed in the Madrid metropolitan area. In Table 3, we have listed the numbers of LMDS base stations deployed at each city around the Madrid area, the terrain elevation angles seen by the DSN in the direc-tion of that city, and the off-boresight (separation) angles of the receiving antenna and the corresponding antenna gains. We can see that the receiving antenna gains in the direction of the Madrid area (azimuth angle around 90 deg) are less than 20 dB.
In the direction from the Robledo DSN site to the city of Pozuelo de Alarcón (92 deg azi-muth with respect to the north), there are two base stations deployed at a distance of 37.88 km. In this azimuth direction, the minimum elevation angle of the terrain seen by the

12
DSN is 4.3 deg, and the separation angle is 5.7 deg. The receiving antenna gain in that direc-tion is 13.1 dB and the corresponding minimum loss required is 168.7 dB. In this direction, the coordination distance from the DSN station is 10 km for 1.0 percent of time exceeded. It is fortunate that the existing stations deployed around Madrid are quite far away from the coordination area.
VII. Conclusion
Based on the LMDS information provided by SETSI, we have performed a link analysis and propagation loss calculation to evaluate the interference effects on the DSN Robledo sta-tion. In order to protect the DSN receiving station from potential interference from LMDS operation in the 25.5- to 25.7-GHz band, we have defined a coordination zone around the Robledo DSN site for 1.0 percent of time exceeded as showed in Figures 8 and 9. Any LMDS stations within this zone could result in harmful interference to the DSN and should be avoided.
Based on the vendor’s deployment pattern of LMDS stations around Madrid, we find that these stations are outside of the coordination area and hence will not exceed the allowed interference level established by the ITU. It can be concluded that the LMDS deployments currently conceived do not pose unacceptable interference to the DSN. It is suggested that any future deployment and addition of LMDS stations in this frequency band consider the coordination maps given in Figures 8 and 9.
It should be emphasized that the coordination area given in this report is based on the as-sumption that there is only one LMDS cell in each azimuth direction and that interference at that azimuth direction is totally from transmitters of this cell. If there is more than one LMDS cell in a given azimuth direction, the coordination area will be larger.
Table 3. LMDS base station deployment around Madrid and elevation angles.
City
Madrid
Alcobendas
Getafe
Majadahonda
Móstoles
Pozuelo de Alarcón
San Sebastián de los Reyes
Torrejón de Ardoz
Approx. distance to DSN, km
48.01
53.52
47.37
32.37
34.10
37.88
54.45
65.03
Azimuth angle wrt DSN, deg
91
76.4
106.1
79.1
108.8
92
77.8
87.2
Min. ant. operating angle, deg
10
10
10
10
10
10
10
10
Terrain elev. angle,
deg
4.4
5.8
3.4
6.7
3.4
4.3
6.4
6.8
Min. off-boresight angle, deg
5.6
4.2
6.6
3.3
6.6
5.7
3.6
3.2
No. of base
stations
23
1
1
1
1
2
1
1
Max. DSN Rec. Ant Gain, dB
13.3
16.4
11.5
19.0
11.5
13.1
18.1
19.4
13
Acknowledgments
The author would like to thank Miles Sue for his valuable advice in many aspects of this study, and Farzin Manshadi for his comments and suggestions on this paper.
Reference
[1] G. K. Noreen, R. J. Cesarone, L. J. Deutsch, C. D. Edwards, J. A. Soloff, T. Ely, B. M. Cook, David D. Morabito, H. Hemmati, Sabino Piazzola, R. Hastrup, D. S. Abraham, M. K. Sue, and F. Manshadi, “Integrated Network Architecture for Sustained Human and Robotic Exploration,” paper no. 1378, Proceedings of IEEE
Aerospace Conference, Big Sky, Montana, March 5–12, 2005.

14
When the Robledo DSN station points its antenna to the Lagrangian points (or any deep space), instead of the Moon, the system noise temperature can be lowered from 350 K to ~100 K. Thus, the required minimum propagation loss to satisfy the ITU protection criteria will increase by 5.5 dB. This change will not significantly affect the shape of the coordina-tion area defined in Figure 8. We still can use this coordination area for the protection of Lagrangian orbit missions or other deep space missions.
Appendix A
Protection for Lagrangian Orbit Missions (Effects of a Lower System Noise Temperature on the Coordination Contour)
15
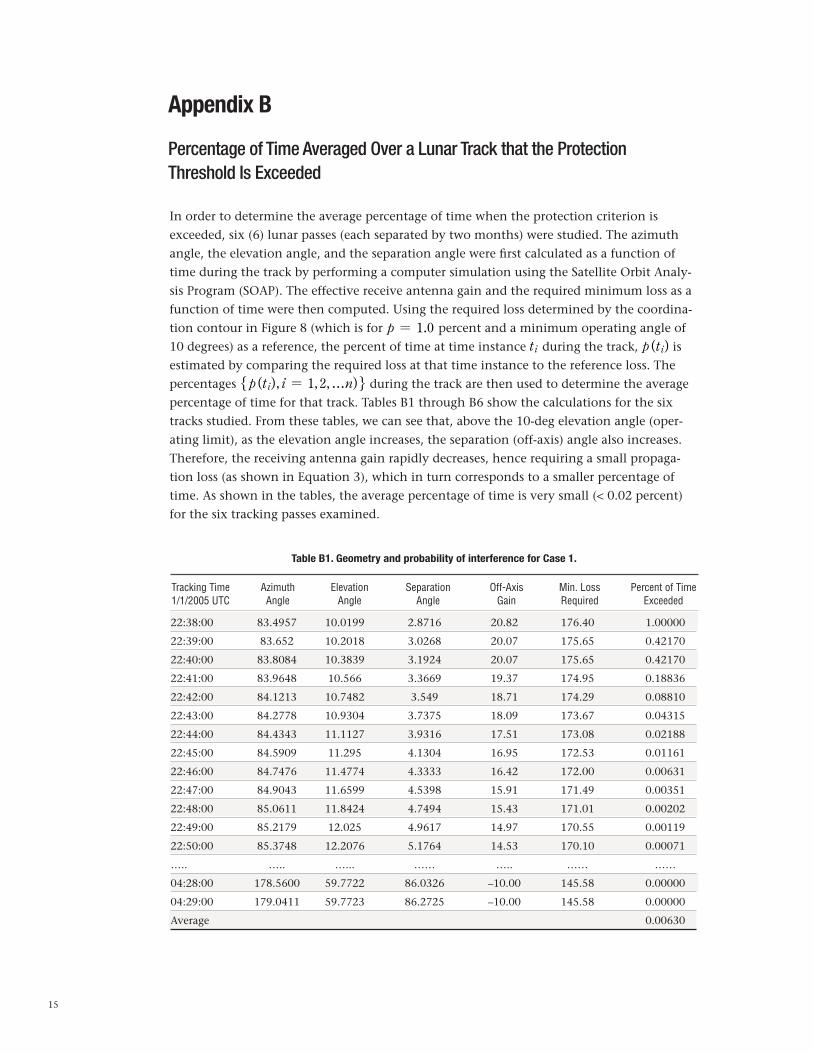
In order to determine the average percentage of time when the protection criterion is exceeded, six (6) lunar passes (each separated by two months) were studied. The azimuth angle, the elevation angle, and the separation angle were first calculated as a function of time during the track by performing a computer simulation using the Satellite Orbit Analy-sis Program (SOAP). The effective receive antenna gain and the required minimum loss as a function of time were then computed. Using the required loss determined by the coordina-tion contour in Figure 8 (which is for p = 1.0 percent and a minimum operating angle of 10 degrees) as a reference, the percent of time at time instance ti during the track, p (ti) is estimated by comparing the required loss at that time instance to the reference loss. The percentages p (ti), i = 1,2,fn)" , during the track are then used to determine the average percentage of time for that track. Tables B1 through B6 show the calculations for the six tracks studied. From these tables, we can see that, above the 10-deg elevation angle (oper-ating limit), as the elevation angle increases, the separation (off-axis) angle also increases. Therefore, the receiving antenna gain rapidly decreases, hence requiring a small propaga-tion loss (as shown in Equation 3), which in turn corresponds to a smaller percentage of time. As shown in the tables, the average percentage of time is very small (< 0.02 percent) for the six tracking passes examined.
Appendix B
Percentage of Time Averaged Over a Lunar Track that the Protection Threshold Is Exceeded
22:38:00 83.4957 10.0199 2.8716 20.82 176.40 1.00000
22:39:00 83.652 10.2018 3.0268 20.07 175.65 0.42170
22:40:00 83.8084 10.3839 3.1924 20.07 175.65 0.42170
22:41:00 83.9648 10.566 3.3669 19.37 174.95 0.18836
22:42:00 84.1213 10.7482 3.549 18.71 174.29 0.08810
22:43:00 84.2778 10.9304 3.7375 18.09 173.67 0.04315
22:44:00 84.4343 11.1127 3.9316 17.51 173.08 0.02188
22:45:00 84.5909 11.295 4.1304 16.95 172.53 0.01161
22:46:00 84.7476 11.4774 4.3333 16.42 172.00 0.00631
22:47:00 84.9043 11.6599 4.5398 15.91 171.49 0.00351
22:48:00 85.0611 11.8424 4.7494 15.43 171.01 0.00202
22:49:00 85.2179 12.025 4.9617 14.97 170.55 0.00119
22:50:00 85.3748 12.2076 5.1764 14.53 170.10 0.00071
….. ….. …... …… ….. …… ……
04:28:00 178.5600 59.7722 86.0326 –10.00 145.58 0.00000
04:29:00 179.0411 59.7723 86.2725 –10.00 145.58 0.00000
Average 0.00630
Tracking Time Azimuth Elevation Separation Off-Axis Min. Loss Percent of Time1/1/2005 UTC Angle Angle Angle Gain Required Exceeded
Table B1. Geometry and probability of interference for Case 1.

16
23:51:00 120.3404 10.1106 7.2245 10.57 165.99 1.00000
23:52:00 120.5185 10.2671 7.3721 10.57 165.99 1.00000
23:53:00 120.6969 10.4234 7.524 10.27 165.70 0.71614
23:54:00 120.8758 10.5793 7.6797 9.98 165.41 0.51286
23:55:00 121.055 10.735 7.8393 9.70 165.13 0.37154
23:56:00 121.2345 10.8903 8.0023 9.42 164.85 0.26915
23:57:00 121.4145 11.0454 8.1687 9.42 164.85 0.26915
23:58:00 121.5948 11.2002 8.3381 9.15 164.58 0.19724
23:59:00 121.7755 11.3546 8.5105 8.89 164.32 0.14622
00:00:00 121.9565 11.5088 8.6856 8.64 164.06 0.10839
00:01:00 122.138 11.6626 8.8633 8.39 163.82 0.08222
00:02:00 122.3198 11.8162 9.0434 8.14 163.57 0.06166
00:03:00 122.502 11.9694 9.2258 7.91 163.33 0.04677
….. ….. …... …… ….. …… ……
03:59:00 178.7733 33.1612 61.8722 –10.00 145.58 0.00000
04:40:00 179.0544 33.1611 62.0981 –10.00 145.58 0.00000
Average 0.01654
Tracking Time Azimuth Elevation Separation Off-Axis Min. Loss Percent of Time3/1/2005 UTC Angle Angle Angle Gain Required Exceeded
Table B2. Geometry and probability of interference exceeded for Case 2.
03:09:00 133.4331 10.1128 6.3311 12.19 167.80 1.00000
03:10:00 133.6122 10.2484 6.4555 11.85 167.46 0.67608
03:11:00 133.7916 10.3835 6.5847 11.85 167.46 0.67608
03:12:00 133.9715 10.5183 6.7186 11.51 167.12 0.45709
03:13:00 134.1517 10.6528 6.8567 11.19 166.80 0.31623
03:14:00 134.3324 10.7868 6.9988 11.19 166.80 0.31623
03:15:00 134.5134 10.9204 7.1448 10.87 166.48 0.21878
03:16:00 134.6949 11.0536 7.2943 10.57 166.18 0.15488
03:17:00 134.8767 11.1865 7.4472 10.27 165.88 0.10965
03:18:00 135.059 11.3189 7.6032 9.98 165.59 0.07852
03:19:00 135.2416 11.4509 7.7623 9.98 165.59 0.07852
03:20:00 135.4247 11.5825 7.9241 9.70 165.31 0.05689
03:21:00 135.6082 11.7137 8.0885 9.42 165.03 0.04121
….. ….. …... …… ….. …… ……
06:43:00 180.8361 26.4576 50.2407 –10.00 145.58 0.00000
06:44:00 181.0867 26.4577 50.4537 –10.00 145.58 0.00000
Average 0.01944
Tracking Time Azimuth Elevation Separation Off-Axis Min. Loss Percent of Time5/1/2005 UTC Angle Angle Angle Gain Required Exceeded
Table B3. Geometry and probability of interference exceeded for Case 3.

17
02:04:00 78.7956 10.0002 3.3459 19.37 174.60 1.00000
02:05:00 78.9427 10.1839 3.5074 18.71 173.94 0.46774
02:06:00 79.0898 10.3677 3.6769 18.09 173.32 0.22909
02:07:00 79.237 10.5516 3.8533 17.51 172.73 0.11614
02:08:00 79.384 10.7356 4.0357 16.95 172.18 0.06166
02:09:00 79.5311 10.9196 4.2233 16.42 171.65 0.03350
02:10:00 79.6781 11.1038 4.4156 15.91 171.14 0.01862
02:11:00 79.8252 11.2881 4.6118 15.43 170.66 0.01072
02:12:00 79.9722 11.4724 4.8116 14.97 170.20 0.00631
02:13:00 80.1192 11.6569 5.0144 14.53 169.75 0.00376
02:14:00 80.2662 11.8414 5.22 14.10 169.33 0.00232
02:15:00 80.4132 12.026 5.428 13.69 168.92 0.00145
02:16:00 80.5602 12.2108 5.6382 13.30 168.52 0.00091
….. ….. …... …… ….. …… ……
08:13:00 181.3222 66.0704 88.6993 –10.00 145.58 0.00000
08:14:00 181.902 66.0686 88.9281 –10.00 145.58 0.00000
Average 0.00528
Tracking Time Azimuth Elevation Separation Off-Axis Min. Loss Percent of Time7/1/2005 UTC Angle Angle Angle Gain Required Exceeded
Table B4. Moon track geometry and probability of interference exceeded for Case 4.
04:14:00 70.1206 10.0402 5.5779 13.69 169.10 1.00000
04:15:00 70.2675 10.2126 5.7346 13.30 168.71 0.63826
04:16:00 70.4143 10.3851 5.8959 12.91 168.32 0.40738
04:17:00 70.5609 10.5578 6.0615 12.55 167.96 0.26915
04:18:00 70.7075 10.7307 6.2311 12.19 167.60 0.17783
04:19:00 70.854 10.9038 6.4043 11.85 167.26 0.12023
04:20:00 71.0004 11.077 6.5808 11.85 167.26 0.12023
04:21:00 71.1467 11.2503 6.7605 11.51 166.92 0.08128
04:22:00 71.2929 11.4239 6.943 11.19 166.60 0.05623
04:23:00 71.439 11.5976 7.1281 10.87 166.28 0.03890
04:24:00 71.5851 11.7714 7.3157 10.57 165.98 0.02754
04:25:00 71.731 11.9454 7.5056 10.27 165.68 0.01950
04:26:00 71.8769 12.1196 7.6975 9.98 165.39 0.01396
….. ….. …... …… ….. …… ……
10:44:00 180.1249 70.3545 92.1306 –10.00 145.58 0.00000
10:45:00 180.8077 70.3501 92.3477 –10.00 145.58 0.00000
Average 0.00760
Tracking Time Azimuth Elevation Separation Off-Axis Min. Loss Percent of Time9/1/2005 UTC Angle Angle Angle Gain Required Exceeded
Table B5. Geometry and probability of interference exceeded for Case 5.

18
07:10:00 117.4441 10.0624 7.177 10.87 166.30 1.00000
07:11:00 117.6209 10.2236 7.329 10.57 165.99 0.69984
07:12:00 117.798 10.3845 7.4853 10.27 165.70 0.50119
07:13:00 117.9755 10.5452 7.6455 9.98 165.41 0.35892
07:14:00 118.1534 10.7056 7.8095 9.70 165.13 0.26002
07:15:00 118.3316 10.8658 7.977 9.70 165.13 0.26002
07:16:00 118.5101 11.0256 8.1477 9.42 164.85 0.18836
07:17:00 118.689 11.1852 8.3215 9.15 164.58 0.13804
07:18:00 118.8683 11.3446 8.4983 8.89 164.32 0.10233
07:19:00 119.0479 11.5036 8.6777 8.64 164.06 0.07586
07:20:00 119.2279 11.6624 8.8597 8.39 163.82 0.05754
07:21:00 119.4083 11.8209 9.0441 8.14 163.57 0.04315
07:22:00 119.5891 11.9791 9.2307 7.91 163.33 0.03273
….. ….. …... …… ….. …… ……
11:28:00 179.1317 35.0208 64.9574 –10.00 145.58 0.00000
11:29:00 179.4220 35.0193 65.1866 –10.00 145.58 0.00000
Average 0.01436
Tracking Time Azimuth Elevation Separation Off-Axis Min. Loss Percent of Time11/1/2005 UTC Angle Angle Angle Gain Required Exceeded
Table B6. Geometry and probability of interference exceeded for Case 6.