copenhagen economics institute short course march 5-7 2007 globalization in the very long run...
Post on 19-Dec-2015
213 views
TRANSCRIPT
Copenhagen Economics InstituteShort Course
March 5-7 2007
Globalization in the Very Long Run
Jeffrey G. Williamson
Harvard University
Carlos III de Madrid (visiting Spring)

Monday Morning March 5• 9:30-10:30 Trade and Globalization since 1492• 10:30-11:00 Coffee/Tea break• 11:00-12:00 Distribution and Growth Impact Monday Afternoon March 5• 14:00-16:00 Williamson Office Hours • (Note change: The original “Global Capital Markets” 14:00-15:00
hour will not be offered.)• 18:00 Course DinnerTuesday Morning March 6• 9:30-10:30 The Determinants of Mass Migration• 10:30-11:00 Coffee/Tea break• 11:00-12:00 The Impact of Mass MigrationTuesday Afternoon March 6• 13:00-14:00 Institute Seminar “Globalization, De-Industrialization
and Divergence: Third World before the Modern Era”
• 15:00-16:30 Williamson Office Hours Wednesday Morning March 7• 9:30-10:30 The Political Economy of Protection• 10:30-11:00 Coffee/Tea break• 11:00-12:00 The Political Economy of Immigration

Recommended Course Readings:
M. Bordo, A. M. Taylor and J. G. Williamson (eds.), Globalization in Historical Perspective (Chicago and NBER 2003). Paperback 2006.
K. H. O’Rourke and J. G. Williamson, Globalization and History: The Evolution of a 19th Century Atlantic Economy (MIT 1999). Paperback 2000.
T. J. Hatton and J. G. Williamson, Global Migration and the World Economy: Two Centuries of Policy and Performance (MIT 2005).
M. Obstfeld and A. M. Taylor, Global Capital Markets: Integration, Crisis, and Growth (Cambridge 2004). Paperback 2005.
K. H. O’Rourke and R. Findlay, Power and Plenty: Trade, War and the World Economy 1000-2000 (forthcoming), Chps. 6-10.
J. G. Williamson, Globalization and the Poor Periphery before the 1950: The Ohlin Lectures (MIT 2006).
Other Readings of Interest:
J. Inikori, Africans and the Industrial Revolution in England (Cambridge 2002). Also in paperback.
R. Rogowski, Commerce and Coalitions (Princeton 1989). Also in paperback.W. Lewis, The Evolution of the International Economic Order (Princeton: 1978).D. A. Irwin, Against the Tide: An Intellectual History of Free Trade (Princeton
1996). Also in paperback.

Part 1 Trade and Globalization Since 1492
1492-1820 Closed: Mercantilist Autarky
1820-1913 Open: First Global Century
1913-1950 Closed: Interwar Autarky
1950-2007 Open: Second Global Century (c1970-2007 for the Third World)
Qualification: I define each ‘open’ period as an
ongoing transition to world market integration, not
having achieved complete integration.

Defining Globalization Globalization = market integration = more openness
trade: commodity price convergence – this morning capital flows: interest rate convergence – some other daymass migrations: wage rate convergence – Tuesday
morning
Factor and commodity prices are what matter! Yet, economists (who should know better) still insist on using trade shares to measure openness and globalizing markets. A very bad idea, since endogenous variables alsoresponding to domestic supply and demand, as illustrated by the three centuries 1492-1820 (or by 1870-1913 and/or by 1950-2007).
After Columbus: Was There An Anti-Global Trade Boom 1492-1820?
Actually, there are three questions
[1] Was there a Trade Boom?
[2] If so, why the Anti-Global label?
[3] If so, what did cause the Trade Boom?
The answer has nothing to do with ‘going
open’ since that world was very anti-global.
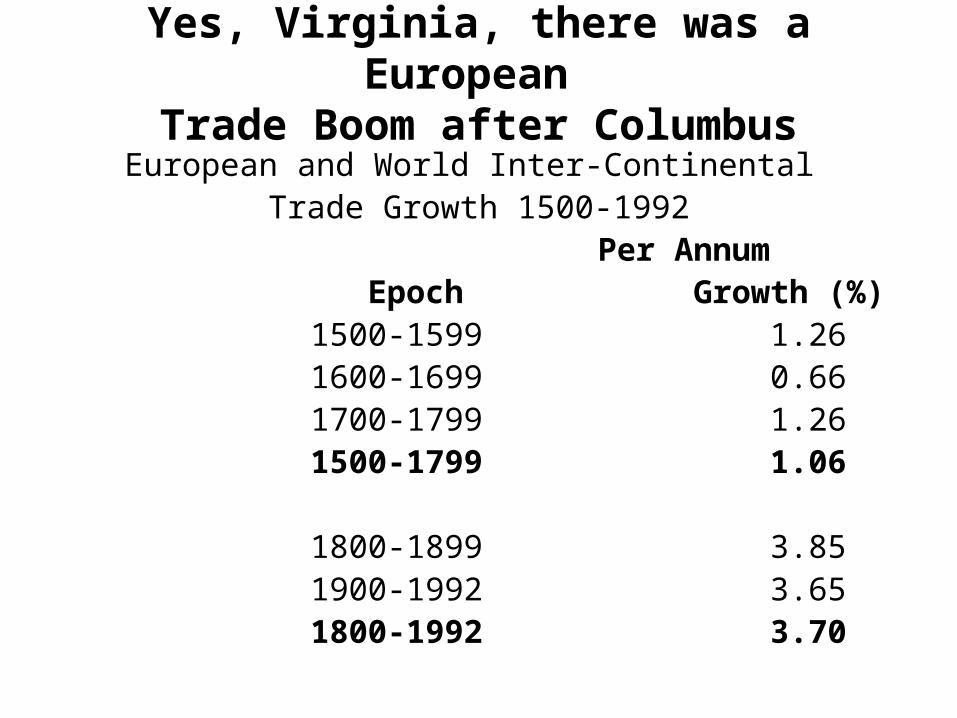
Yes, Virginia, there was a European Trade Boom after Columbus
European and World Inter-Continental Trade Growth 1500-1992
Per Annum Epoch Growth (%) 1500-1599 1.26 1600-1699 0.66 1700-1799 1.26 1500-1799 1.06
1800-1899 3.85 1900-1992 3.65 1800-1992 3.70

But there was not any CPC for spices Amsterdam vs Southeast Asia 1580-1820!
Figure 3.1Spice and Coffee Markups:
Amsterdam vs. Southeast Asia 1580-1939
0
5
10
15
20
25
30
1580s 1610s 1640s 1670s 1700s 1730s 1760s 1790s 1820s 1850s 1880s 1910s
Year
Sales price / purchase price
Cloves Black Pepper Coffee

Nor was there any CPC for textiles London vs Calcutta!
Figure 3.2 Asian Textile Trade Markups: 1664-1759
0
1
2
3
4
5
6
7
8
9
Year
Sa
les
pri
ce
/ p
urc
ha
se
pri
ce
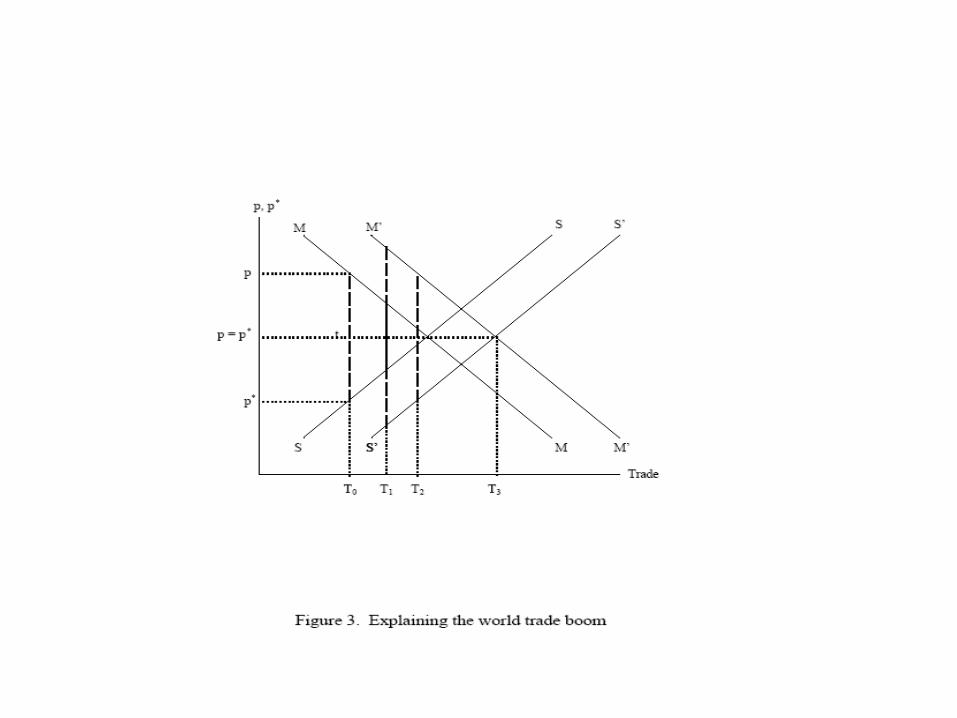

So, how much of European trade boom due to world demand and supply boom?
1492-1800: 65% import demand at home, 35% export supply abroad, 0% “globalization”
1850-1913: 70% import demand and export supply, 30% “globalization”
1950-2007: 65% import demand and export supply, 35% “globalization”
Looks like we have found a
historical constant!

In contrast, the First Global Century had both CPC and a trade boom!
First, documenting the CPC – illustrated by Atlantic wheat market 1820-1913, and a boom in the grain trade.
And then, second, documenting the world trade boom after 1850.

0
40
80
120
160
200
0
10,000
20,000
30,000
40,000
50,000
60,000
70,000
1800 1825 1850 1875 1900 1925 1950 1975 2000
Anglo-American wheat price gapBritish imports of US wheat
perc
enta
ge p
rice
gap
, 3 y
ear m
ovin
g av
erag
eIm
ports, thousands of cwt.


When the World Went Open (and followed the leader)…
British Tariff Rates1815-27 1828-41 1842-45
72.8 58.5 24.1 69.8 50.4 19.0
Note! Britain ‘went open’ thirty years before the famous 1846 Repeal of the Corn Laws.What About Terms of Trade Shocks? Did Britain have to share her productivity gains as the Industrial Revolution leader?

Sharing productivity gains from the First Industrial Revolution with the rest of the world
Figure 7.1Britain's Terms of Trade, 1820-1872
80
90
100
110
120
130
140
150
160
170
1820 1825 1830 1835 1840 1845 1850 1855 1860 1865 1870
Year
Exp
ort
/Imp
ort
pri
ce r
atio

Figure 1Latin American Terms of Trade 1811-1939
0
20
40
60
80
100
120
140
160
1811
1815
1819
1823
1827
1831
1835
1839
1843
1847
1851
1855
1859
1863
1867
1871
1875
1879
1883
1887
1891
1895
1899
1903
1907
1911
1915
1919
1923
1927
1931
1935
1939
Year
Px/
Pm
Average LA TOT Unadjusted
Average LA TOT Adjusted
Source: Unadjusted- - Clingingsmith and Williamson (2004), Figure 9, based on data in Coatsworth and Williamson (2004a); Adjusted- - see Appendix 1.

But, of course, the move to free trade wasn’t the only, or even the main, force at work integrating world markets.
The big force was the transport revolution
(1st best replaces 2nd best, e.g. steam engine vs sail, railroad vs wagon-cum-canals, plus tfpg=3-5% p. a on all modes as size, density etc. on all routes rises).

The 19th C Transport Revolution on Sea Lanes
And then a slow approach to steady state …

Figure 2.2: Real Global Freight Rate Index(1869-1997) (1884=1.00)
0.00
0.20
0.40
0.60
0.80
1.00
1.20
1.40
1870
-1874
1875
-1879
1880
-1884
1884
1885
-1889
1890
-1894
1895
-1899
1900
-1904
1905
-1909
1910
-1914
1915
-1919
1920
-1924
1925
-1929
1930
-1934
1935
-1939
1940
-1944
1945
-1949
1950
-1954
1955
-1959
1960
-1964
1965
-1969
1970
-1974
1975
-1979
1980
-1984
1985
-1989
1990
-1994

What about impact of globalization on De-Industrialization in the Poor Periphery?
Did manufacturing get wiped out there, and did this suppress economic growth there and contribute to the growing North-South Gap?
Find out the answer
Tuesday 1-2pmWilliamson Institute Seminar
“Globalization, De-Industrialization and Divergence in the Third World before the
Modern Era”
PostscriptAll of these questions have also been posed
of world trade globalization experience since 1970.
Are there lessons of history from the First Global Century for the Second, or are conditions sufficiently different to modify or even overturn the lessons?
If so, what conditions?
Ponder these questions while we break for coffee and tea.
Part 2 Distribution and Growth Impact
2.1 Growth
Four kinds of modern studies have
tried to assess the gains from freer
trade, or the losses from more
protection, especially in developing
countries. The focus is usually on
growth performance, rather than
simply once-off comparative static
gains.
First
NBER project on trade and exchange-control regimes in the 1960s and 1970s used classic partial-equilibrium calculations of deadweight costs (Harberger Triangles).
Concluded that the barriers imposed significant costs on Argentina, Chile, Colombia, Egypt, Ghana, India, Israel, Mexico, Pakistan, the Philippines, South Korea, Taiwan, and Turkey.
By themselves, these calculations were vulnerable to the charge of assuming, not proving, that trade barriers were bad since they assume that all relevant effects are captured by measures of consumer and producer surplus.
What about allowing protection a chance to lower long-run cost curves, as in traditional infant-industry case? What about impact on industrialization and thus growth, as in modern growth theory where industry is the carrier of productivity advance and capital deepening?

Second
Cross-country growth studies that contrast the growth performance of relatively open and closed economies.
The World Bank conducted such studies for 41 countries in the periods before and after the first oil shock. Table 3 extends this coverage through 1992.

Table 3
Trade-Policy Orientation and Growth Rates in the Third World, 1963-1992
Average annual rates growth of GDP per capita
Trade policy orientation 1963-1973 1973-1985 1980-1992
Strongly open to trade 6.9% 5.9% 6.4%Moderately open 4.9% 1.6% 2.3%Moderately anti-trade 4.0% 1.7% - 0.2%Strongly anti-trade 1.6% - 0.1% - 0.4%
NOTE: Bairoch used the same (crude) methodology to report the exact opposite correlation for late 19th century Europe, a correlation that Kevin O’Rourke confirmed using more modern and sophisticated econometrics. More on the European paradox later.

Table 3 correlation is vulnerable to three criticisms.
First, assigning countries to trade policy categories is always tricky, since it is hard to measure overall openness. The worst studies use endogenous variables like X/Y or [X+M]/Y.
Second, and much more importantly, it is hard to isolate the effect of trade policies alone, since other policies are usually changing at the same time. Liberalism typically comes as a package.
Third, causality! Is it political economy?

Third Event studies (e.g. economic history). Strategy is
to focus on periods when trade policy changed the most so as to see its effect on growth.
Anne Krueger looked at trade opening moments in South Korea around 1960, Brazil and Colombia around 1965, and Tunisia around 1970. Growth improved after liberalization in all four cases (Krueger 1983, 1984).
David Dollar and Aart Kraay (2000) examined the reforms and trade liberalizations of 16 countries in the 1980s and 1990s, finding, once again, the positive correlation between freer trade and faster growth.

Critique: Again, one can argue that the liberal reform episodes changed more than just participation in the global economy – like liberalizing their domestic factor markets, liberalizing their domestic commodity markets, and setting up better property-rights enforcement. Thus, an independent trade effect has not been isolated.

Fourth
Multivariate econometric analysis (growth regressions): Even with several other variables held constant, these studies show that freer trade is associated with more growth. A zillion regressions.
Critique: Omitted variables, causality and simultaneity. Critique: Depends on when a country goes global.
Are its trading partners liberalizing too? Are its competitors liberalizing? Is the liberalizing country ready for industrialization, accumulation, and human capital deepening, or will it be driven instead up some primary-product dead end?
Economic history matters: Conditions were less auspicious for Third-World liberalization during 1914-1960 (world autarchy) than since 1960. Or the 1980s and 1990s (China) compared with the 1960s and 1970s (no China).

Table 3Tariff Impact on GDP per capita Growth by Region
Dependent Variable: 5-Year Overlapping Average Growth Rate
(1) (2) (3) (4)
Included Countries ALL ALL ALL ALLYears per Period 1 1 1 1Time Interval 1875-1908 1875-1908 1924-1934 1924-1934
ln GDP/capita 0.15 0.10 -0.73 -0.891.14 0.75 -1.77 -2.13
ln Own Tariff 0.14 0.56 0.36 1.651.64 3.35 1.27 2.83
(European Periphery -0.72 -2.45dummy) x (ln tariff rate) -3.32 -3.18(Latin America -0.97 0.58dummy) x (ln tariff rate) -3.15 0.49(Asia dummy) x -0.19 -1.47(ln tariff rate) -0.84 -2.02Euro Periph dummy -0.21 1.58 -0.04 6.15
-1.24 2.77 -0.08 3.10Latin America dummy 0.19 3.01 -0.73 -3.31
0.94 3.13 -1.31 -0.96Asia dummy -0.26 0.30 -1.17 2.39
-1.09 0.55 -1.52 1.24Constant -0.12 -0.76 5.92 3.99
-0.11 -0.68 1.55 1.05Country Dummies? No No No NoTime Dummies? No No No No
N 1,190 1,190 372 372 R-squared 0.0357 0.0498 0.0227 0.0605 Adj. R-squared 0.0317 0.0433 0.0094 0.0398
Part 2 Distribution and Growth Impact
2.2 Distribution

Who Gained and Who Lost from Globalization in the First Global Century?
Three Big Distribution Issues
Globalization and the Big Rise in World Inequality (mainly between richcore and poor “Third World”)
World Trade and Changing Income Distribution within Countries
Mass Migration and Changing Income Distribution within Countries

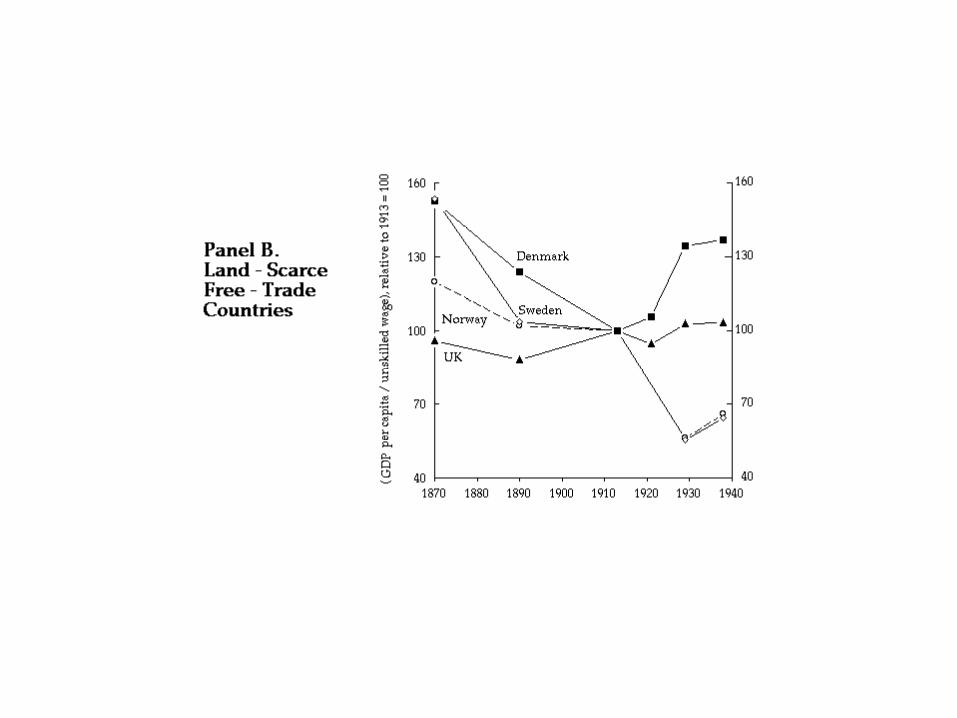
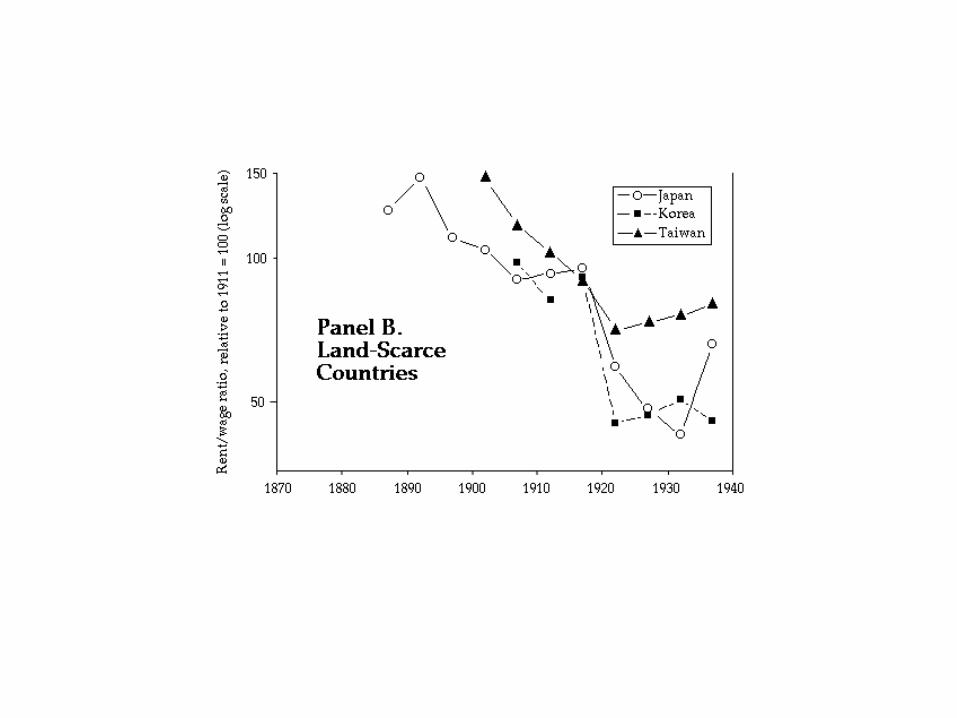
There certainly was convergence between
the members of the greater Atlantic
economy in the First Global Century.
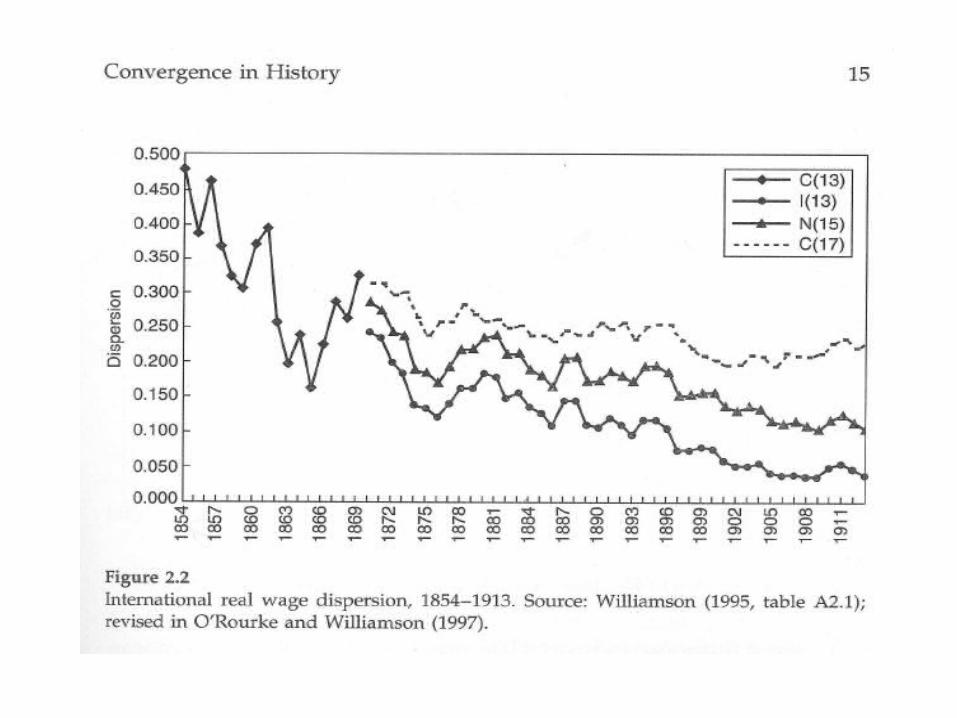

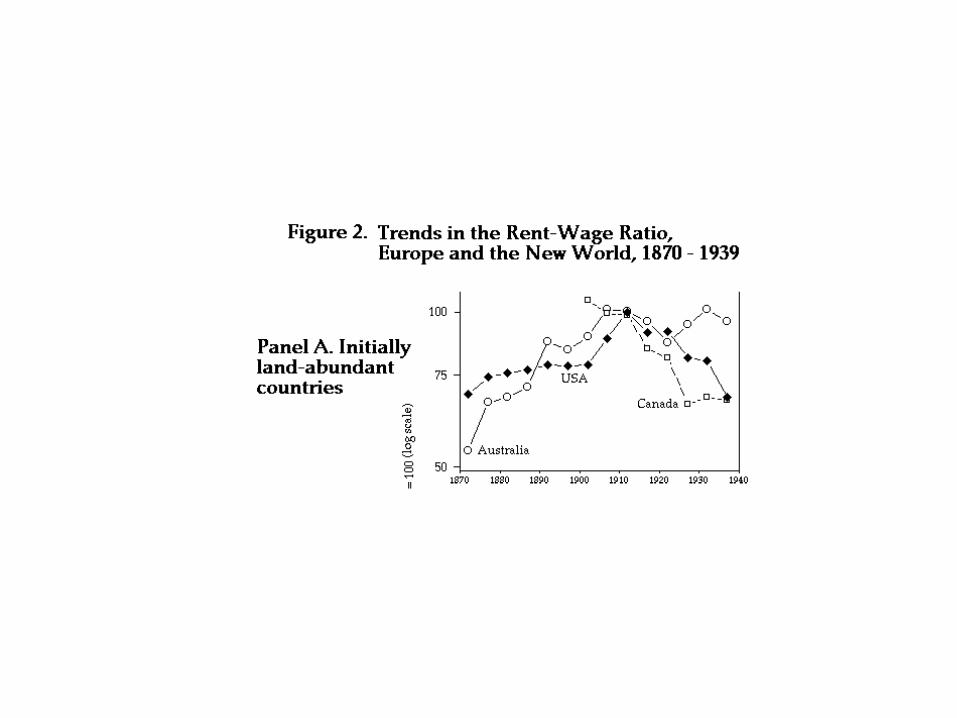
And inequality rose in the labor scarce Atlantic economies and fell in the labor abundant Atlantic economies.

The impact of migration and trade on inequality within countries
Globalization and Inequality 1870-1913
Ann
ua
l cha
ng
e (
%)
in e
qua
lity ind
ex
-0.5
0.5
-0
-1
-1.5-40 -20 0 20 40
spafra
gernet
ita
den
ukcan
1 swe
nor
aust
usa
bel
por
Migration’s impact on the labor force (%)

But what about the rest of the world and what about the rest of the five millenia 1492-2007?

Some awkward facts for the globalization induces inequality thesis
Fact #1: Dramatic income divergence around the globe over the past two centuries


Two big facts supporting the globalization induces inequality thesis
Fact #1: Dramatic income divergence around the globe over the past two centuries. And all from between inequality.
Fact #2: Since the 1820s, there has also been an impressive worldwide increase in commodity and factor market integration, despite the temporary and disastrous retreat during the World Wars and the troubled era in between. So far, so good. The globalization-inequality correlation holds.
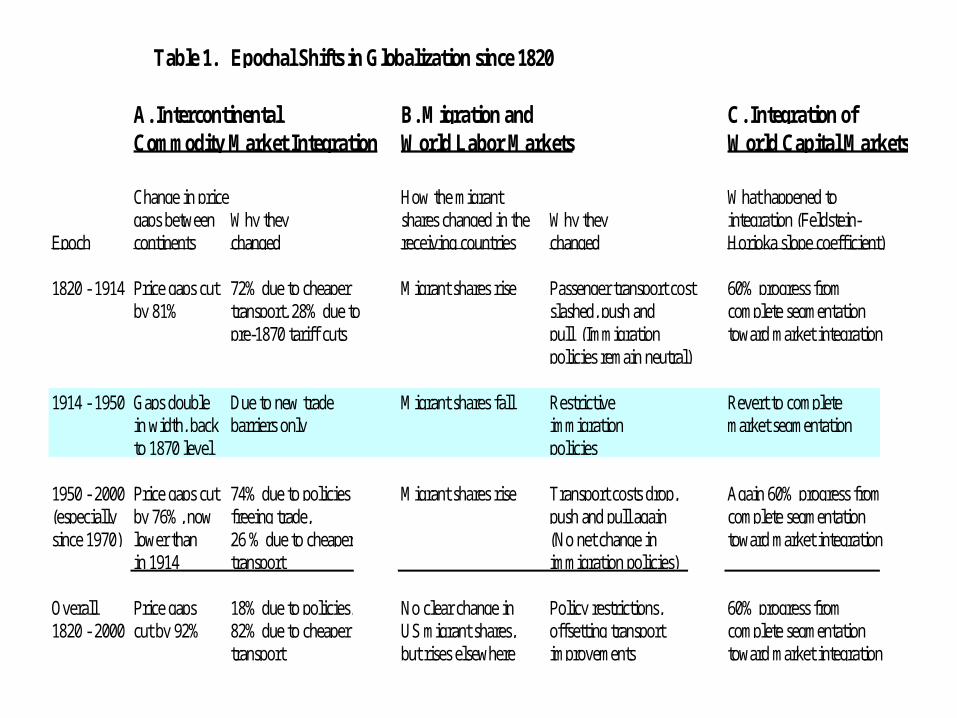
Table 1. Epochal Shifts in Globalization since 1820
A. Intercontinental B. Migration and C. Integration ofCommodity Market Integration World Labor Markets World Capital Markets
Change in price How the migrant What happened togaps between Why they shares changed in the Why they integration (Feldstein-
Epoch continents changed receiving countries changed Horioka slope coefficient)
1820 - 1914 Price gaps cut 72% due to cheaper Migrant shares rise Passenger transport cost 60% progress from by 81% transport, 28% due to slashed, push and complete segmentation
pre-1870 tariff cuts pull (Immigration toward market integrationpolicies remain neutral)
1914 - 1950 Gaps double Due to new trade Migrant shares fall Restrictive Revert to complete in width, back barriers only immigration market segmentationto 1870 level policies
1950 - 2000 Price gaps cut 74% due to policies Migrant shares rise Transport costs drop, Again 60% progress from (especially by 76%, now freeing trade, push and pull again complete segmentationsince 1970) lower than 26 % due to cheaper (No net change in toward market integration
in 1914 transport immigration policies)
Overall Price gaps 18% due to policies, No clear change in Policy restrictions, 60% progress from 1820 - 2000 cut by 92% 82% due to cheaper US migrant shares, offsetting transport complete segmentation
transport but rises elsewhere improvements toward market integration

Two big facts rejecting the globalization induces inequality thesis
Fact #3: However, income gaps almost certainly widened from 1600 or even earlier. This early modern “great divergence” was true in all dimensions – between and within European nations.
Fact #4: The pre-1800 epoch was anti-global.
Bottom Line: Globalization could not have contributed to rising “world” inequality.

Even though B-M show that between inequality changes did all the work, within inequality changes could still have been dramatic.


Two Questions
• How much work did Heckscher-Ohlin and Stolper-Samuelson do (especially when it was re-inforced by mass migration)?
• Would we expect the same today? (If not, why not?)


A big bottom lineThere is absolutely nothing inconsistent about the simultaneous
appearance of powerful relative factor price convergence and powerful absolute factor price divergence in the global economy.
Globalization can explain the relative factor price convergence before 1940.
But deeper explanations are needed to account for absolute factor price divergence like culture, geography and institutions as they influence the rates of technical progress and human capital deepening between core and periphery. Indeed, if technical progress tends to raise the efficiency of all factors (e.g. no factor saving), then globalization and commodity price convergence will drive relative factor price convergence with even more certainty.
Still, what is striking about pre-1940 world economic experience is that both relative factor price convergence and absolute factor price divergence were so hugely powerful, at the same time.

Would we expect the same today?
If not, why not?
Tak!