copper mining for 2014 - cochilco
TRANSCRIPT

Update Report on Energy Usage in
Copper Mining for 2014
FROM 03 /2015
Intellectual Property Registry © N° 254.581

Executive Summary
Energy is considered a strategic supply in mining, since without this resource it would be impossible to
carry out everyday mining activities. In this case, the source of electricity is determinant in the
sustainability and competitive position of the industry. The Chilean Copper Commission (Cochilco), as
part of their mission, generates information and action proposals which contribute to the
development of sustainable mining, as well as generate energy consumption statistics from the copper
mining industry at a national level. This information is provided to Cochilco by the mining sites of the
medium and large private mines, Enami and Codelco, reaching 98% representation in terms of
production of fine copper.
In 2014 total energy consumption of 161,716 TJ was reported, which reflects a 4.4% increase with
respects to the previous year. The consumption of electricity reached 83,261 TJ in 2014. This
represents a 2.7% increase in respect to the previous year, and the increase is due principally to an
increase in the processing of concentrates of sulfide ores. On the other hand, copper mining reached
78.454 TJ of fuel energy consumption in 2014, which represents a 6.4% increase over 2013.
Figure 1: National energy consumption in copper mining, Terajoule, 2001 – 2014
Source: Developed by Cochilco
In the case of fuels, pit mining is the mining process with the highest usage, reaching 59,974 TJ,
representing 76% of total fuel consumption. In electricity, the concentrator reaches consumption of
43,685 TJ and oxide processing (LxSxEw) consumes 20,751 TJ, which represent 52% and 25% of energy
consumption in mining respectively.
Total annual energy consumption divided by total annual copper production is an approximation of the
unitary coefficient of energy usage. This indicator allows for analyzing the tendencies of energy
consumption in mining production. In this manner, the unitary consumption of energy increased from
26.8 GJ/TMF in 2014 to 28.8 GJ/TMF in 2014, which represents a 7% increase. However, this increase
is determined by the ore grades of the treated mineral.
2001 2002 2003 2004 2005 2006 2007 2008 2009 2010 2011 2012 2013 2014
Electricidad 47,272 49,454 53,945 58,082 58,831 59,744 63,854 64,653 68,318 68,947 71,874 77,678 81,084 83,261
Combustibles 38,962 38,251 40,742 42,031 42,468 44,346 52,939 56,993 64,402 60,637 65,732 74,326 73,751 78,454
0
20,000
40,000
60,000
80,000
100,000
120,000
140,000
160,000
180,000
TWh
Electricity
Fuels

Update Report on Energy Usage in Copper Mining for 2014 II
Chilean Copper Commission
The unitary consumption of electricity in the concentrator reached 80.3 MJ/Tm of processed ore,
which corresponds to just a 0.8% increase with respect to the unitary consumption of 2013 which
reached 79.7 MJ/TM of processed ore. On the other hand, the unitary consumption of fuels in pit
mines reached 57.8 MJ/TM of extracted ore in 2014, which represents a 0.7% increase with respects to
the previous year, reaching a unitary consumption of 57.4 MJ/TM of extracted ore.
The unitary consumption of electricity in the case of hydrometallurgical processing of LXSXEW reached
12.086 MJ/TMF Cu in 2014, which represents a 4.1% increase from 2013, when it reached 11.613
MJ/TMF Cu.
The increase in total energy consumption is led by the concentration process which increases
proportionally to the amount of ore processed. On the other hand, the increase in the consumption of
fuels in pit mining, with respects to 2013, is due principally to the increase of transported ore as well
as marginal increments due to increases in the traveling distance and depth of the deposits.

Update Report on Energy Usage in Copper Mining for 2014 III
Chilean Copper Commission
Index
Executive Summary . . . . . . . . . . . . . . . . . . . . . . . . . . . . . . . . . . . . . . . . . . . . . . . . . . . . . . . . . . . . . . . . . . . 1
1. Introduction . . . . . . . . . . . . . . . . . . . . . . . . . . . . . . . . . . . . . . . . . . . . . . . . . . . . . . . . . . . . . . . . . . . . . . . 6
2. Methodology . . . . . . . . . . . . . . . . . . . . . . . . . . . . . . . . . . . . . . . . . . . . . . . . . . . . . . . . . . . . . . . . . . . . . . 7
2.1. General information and survey . . . . . . . . . . . . . . . . . . . . . . . . . . . . . . . . . . . . . . . . . . . . . . . . . 7
2.2. Data Analysis . . . . . . . . . . . . . . . . . . . . . . . . . . . . . . . . . . . . . . . . . . . . . . . . . . . . . . . . . . . . . . . . . 9
3. Energy consumption in copper mining at national level . . . . . . . . . . . . . . . . . . . . . . . . . . . . . . . . . . . 12
4. Fuel consumption in copper mining . . . . . . . . . . . . . . . . . . . . . . . . . . . . . . . . . . . . . . . . . . . . . . . . . . . 16
5. Electricity consumption in copper mining . . . . . . . . . . . . . . . . . . . . . . . . . . . . . . . . . . . . . . . . . . . . . . 21
5.1. Electricity consumption in copper mining at a national level . . . . . . . . . . . . . . . . . . . . . . . . . 21
5.2. Electricity consumption in copper mining in the interconnected Norte grande system and in
the interconnected Center system . . . . . . . . . . . . . . . . . . . . . . . . . . . . . . . . . . . . . . . . . . . . . . . . . . 25
6. Final comments . . . . . . . . . . . . . . . . . . . . . . . . . . . . . . . . . . . . . . . . . . . . . . . . . . . . . . . . . . . . . . . . . . . 30
7. Glossary . . . . . . . . . . . . . . . . . . . . . . . . . . . . . . . . . . . . . . . . . . . . . . . . . . . . . . . . . . . . . . . . . . . . . . . . . . 31
Update Report on Energy Usage in Copper Mining for 2014 IV
Chilean Copper Commission
Figure Index Figure 1: National energy consumption in copper mining, Terajoules, 2001 – 2014 ................................. I
Figure 2: Production processes of copper mining ...................................................................................... 8
Figure 3: Type of energy used in Mining .................................................................................................... 8
Figure 4: National energy consumption in copper mining, Terajoule, 2001 – 2014. ............................... 12
Figure 5: Percentage of electricity and fuels in total energy consumption and yearly variation in usage
for 2001 – 2014. ....................................................................................................................................... 12
Figure 6: Evolution of unitary energy consumption in fine production in Chile when compared with the
evolution of the average mineral laws ..................................................................................................... 14
Figure 7: Percentage of electricity and energy usage in copper mining and national consumption 2001
– 2013. ...................................................................................................................................................... 14
Figure 8: Annual variance based on 2001 of percentage of electricity and energy usage in mining of
national consumption, 2001 – 2013. ....................................................................................................... 15
Figure 9: Fuel based energy consumption in copper mining in TJ, 2001 - 2014 ...................................... 16
Figure 10: Percentage of diesel consumption in fuel based energy in 2014. ......................................... 17
Figure 11: Fuel consumption in ore processing, national level, 2001 – 2014. ......................................... 17
Figure 12: Participation of ore processing in total fuel based energy consumption, 2001 – 2014. ........ 18
Figure 13: Annual variance in fuel usage based on process, based on 2001 = 1. ................................... 19
Figure 14: Unitary consumption of fuels per ton of fine copper in process and yearly change compared
to base year 2001 ..................................................................................................................................... 20
Figure 15: Unitary consumption of energy associated to fuels according to ton of ore processed and
yearly change compared to base year 2001 ............................................................................................ 20
Figure 16: Electricity usage in copper mining in TJ, 2001 - 2014 ............................................................ 21
Figure 17:Electricity usage per mining process, national level 2001 – 2014. .......................................... 22
Figure 18: Percentage of mining processes in total electricity consumption, 2001 – 2014. ................... 23
Figure 19: Annual change in fuel consumption per process, base year 2001 = 1. ................................... 24
Figure 20: Unitary consumption of electricity per ton of fine copper content in process and yearly
change, compared to base year 2001. ..................................................................................................... 24
Figure 21: Unitary electricty usage per ton of ore processed and yearly change based on 2001 ........... 25
Figure 22: Change in electricity usage per process in SIC and SING ........................................................ 26
Figure 23: Evolution of the participation of electrical energy per process in SING and SIC .................... 27
Figure 24: Change in electrical energy usage per process, with respect to 2001 .................................... 27
Figure 25: Change in unitary consumption of electrical energy per process per ton of fine copper, with
respect to 2001 ........................................................................................................................................ 28
Figure 26: Change in unitary electrical energy consumption per ton of processed/extracted, wtih
respect to 2001 ........................................................................................................................................ 29
Update Report on Energy Usage in Copper Mining for 2014 V
Chilean Copper Commission
Table Index
Table 1: Partial sample of Production, Energy and Hydrological Resource 2014 survey. ......................... 9
Table 2: Conversion coefficients of physical units of fuels to energy ...................................................... 10

Update Report on Energy Usage in Copper Mining for 2014 6
Chilean Copper Commission
1. Introduction
The Chilean Copper Commission (Cochilco) reports copper mining energy consumption yearly
through the Energy Usage Statistics of Copper and through the present report, within the
permanent frameworks since 2001. In this sense, the report has the objective of analyzing the
whole fuel and energy consumption incurred by copper mining, as well as an analysis of the
evolution of unitary consumption since 2001.
The data analyzed in 2015 corresponds to data reported by the 44 most important copper
production sites in the country, as well as the existing smelters and refineries. The energy usage
data, as well as that of production, are requested through the Production; Water and Energy
Consumption survey, which is requested by Cochilco annually during the months of February and
March. This data is used to determine the electric consumption of mining at a national level and
to classify according to the interconnected Norte Grande and Central systems. Additionally, the
total fuel consumption and individual copper mining processes are analyzed. Finally, the
production data of fine copper and processed ores, in the different mining processes are used to
determine the unitary coefficients of energy, electricity, and fuel consumption in the different
processes.
The present report, begins in section two presenting the terminology used herein. The third
section shows the methodology used to gather the information and the subsequent calculation of
the energy usage incurred by copper mining at global and unitary levels. In section four, an
analysis of energy consumption at a national level is presented. In section five, the results of fuel
consumption results in copper mining are shown up to 2014. Section six begins showing the
results of electric usage at a national level and an analysis of its evolution, to then analyze the
results of electric consumption in the Interconnected Norte Grande and Interconnected Central
systems. Lastly, section seven has the final report comments.

Update Report on Energy Usage in Copper Mining for 2014 7
Chilean Copper Commission
2. Methodology
The methodology may be summarized in two parts. First, data was collected on production,
energy and water consumption in the mining process from the principal operating sites inside the
principal mining value chain. Second, based on the information supplied by the mining operations,
the global and unit consumption was determined for electricity and fuels for processes at a
national level. The methodology can be summarized in the following steps:
Data was collected directly from the companies through the “Production, Energy, and
Hydrological Resource Survey”.
Based on the information provided by the mining companies, the usage and respective
unitary energy coefficients are calculated. For the country, the energy from fuels is
calculated as well as the energy from electricity, while electricity is detailed by SING and
SIC.
Energy consumption is presented in terajoules (TJ) and unitary consumption in megajoules
divided by metric tons (MJ/TM)
2.1. General Information and Survey
Two production lines are identified according to the type of mineral processed. First the process of
sulfite minerals is identified, which follow a production line of flotation, concentration, and then
pyrometallurgy. Conversely, the oxide ores, and some types of sulfide minerals, follow a leaching
line or through hydrometallurgy to extract the copper. The principal productive processes of the
sulphide ores are mining, concentration, smelting and refining. The principal processes involved in
copper extraction from oxide ores are mining, leaching, solvent-extraction and electro-winning.
Additionally, figure two shows vertically each of the product boxes and their respective units, of
each of the processes (see Figure 2).
Although it is not shown in Figure 2 in the present report, the Service process is recognized, as is
indicated in the terminology corresponding to the total of those activities which are not included
within the processes of the principal value chain, yet are necessary to carry out the mining
production. This area includes the energy consumption due to the impulsion and desalinization of
water.

Update Report on Energy Usage in Copper Mining for 2014 8
Chilean Copper Commission
Figure 2: Production Process in Copper Mining
*
Pregnant Leach Solution (PLS)
Source: Prepared by Cochilco
The principal sources of energy supplies to mines are electricity from the interconnected systems
and fuels. The interconnected systems are the Norte Grande System (SING) and Central System
(SIC). The present report recognizes energy gained from fuels through the use of: Carbon,
Gasoline, Diesel, Enap 6, Kerosene, Liquefied Gas, Natural Gas, Wood, and Butane.
Figure 3: Type of energy used in mining
Source: Prepared by Cochilco
Min
eral
(K
TM)
Mining extraction:
Extraction of sulphurs
Co
nce
ntr
atio
n (
TM)
Concentration: Milling and Floating of mineral A
no
des
(TM
F)
Smelting:
Production of blisters/anodes
Cat
ho
des
of
ER (
TMF)
Refining:
Production of cathodes through electro-refining (ER)
Min
eral
(K
TM)
Mining Extraction:
Extraction of leachable oxides and sulphides
PLS
(m
3/s
eg)
Leaching (Lx):
Irrigation in piles to produce PLS*
Elec
tro
lyte
(m
3/s
ec)
Extraction with Solvents (Sx):
Increase in copper concentration in electrolyte C
ath
od
es E
w (
TMF)
Electrowinning (Ew):
Cathode production
Energy in Mining
Fuel-based Energy::
Diesel
Enap 6
Kerosene
Liquefied Gas
Natural Gas
Electric Energy
Interconnected Central System (SIC)
Interconnected Norte Grande System (SING)

Update Report on Energy Usage in Copper Mining for 2014 9
Chilean Copper Commission
The information to determine the energy usage was gathered through the Production, Energy, and
Hydrological Resource Survey. This survey takes production information from the principal
production processes, identifying the ore supplies, as well as the products and their principal
characteristics. For example, in the case of extraction, the quantities in metric tons of material
and waste removed and their respective ore grades are reported; and in the case of ore
concentration the processed mineral, the quantity of concentrate produced, and the respective
grades are looked up. The different productive processes are associated with questions which
refer to the amount of electricity used, the amount of fuel (in physical units, for example m3 of
diesel) and total water consumed and recycled by the process. As an example of some of the data
reported in the survey, Table 1 is shown where a fraction of the production section of the
Production, Energy, and Hydrological Resources Survey is available.
Table 1: Partial simple of the Production, Energy, and Hydrological Resources Survey 2014.
Open Pit Mine Unit 2014
Material Extracted
Ore Extracted (to plant, leach, stock pile, etc.) KTM
Waste Extracted
Ore Grade
Ore extracted (to plant, leach, a stock pile, etc.) %
Waste grade %
Concentration Plant Unit 2014
Processed Ore TMS
Concentrate Produced TMS
Grade of Cu of Ore %
Grade of Cu of Concentrate %
% of Concentrate Recovered %
LXSXEW Unit 2014
Leachable Ore Treated KTM
Leachable Ore Grade %
Recovered through Leaching %
Cathode Production SX-EW TMF
Source: Prepared by Cochilco
In 2014 a total of 44 mining operations were surveyed among which were mines, smelters, and
refineries, which represent 97.6% of fine copper production at a national level. In the case of the
22 operations which are part of the SING system which answered the survey satisfactorily, they
represent 97.6% of the production of fine copper, while the 22 operations in the SIC system reach
95.5% representation in terms of fine copper production related to the total reported in this
system.
The detailed information in the tables are the base for the calculations, graphs, and analysis for
this report and are available in Cochilco´s webpage (www.cochilco.cl) in the Energy and GEI
Statistics section.
2.2. Data Analysis
Once the surveys from the mining sites were received and 97.6% production reached, the
information was extrapolated and scaled to 100%. This means that the energy usage, on an global

Update Report on Energy Usage in Copper Mining for 2014 10
Chilean Copper Commission
level and per process are scaled to a proportional fraction to reach 100% of copper production at a
national level according to the data received by Cochilco during 2014 in contrast with the data
from the survey.
Extrapolating the data for the global electricity consumption is not complex since the usage is
grouped in processes, then added on a national level to be scaled. In the case of fuels, first they
must be transformed into physical units consumed as reported in the energy unit survey, in this
case in megajoules. Each fuel reported is transformed into the equivalent energy unit as shown in
Figure 2, which state-of-the-art technology in the mining industry and the energy factor of the
fuels.
Table 2: Conversion coefficient in physical units of fuels to energy
Fuel Unit Quantity Useful Energy
(Megajoule, MJ)
Coal Kg 1 29
Gasoline M3 1 34.208
Diesel M3 1 38.309
Enap 6 t 1 43.932
Kerosene M3 1 37.618
Liquified Gas Kg 1 51
Natural Gas M3 1 39
Wood Kg 1 15
Butane lts 1 29 Source: Prepared by Cochilco
The following will show the principal indicators calculated for the consumption of energy through fuels and electricity.
2.2.1. Fuels:
At a national level, energy from fuels corresponds to the sum of consumption of the different sites considered in this report, as shown in (3.1)
𝐹𝑢𝑒𝑙 𝑒𝑛𝑒𝑟𝑔𝑦 ∑ 𝐹𝑢𝑒𝑙 𝐸𝑛𝑒𝑟𝑔𝑦 𝑐𝑜𝑛𝑠𝑢𝑚𝑒𝑑𝑖𝑖 (𝑃𝑒𝑡𝑎𝑗𝑜𝑢𝑙𝑒𝑠) (3.1)
Where i corresponds to the mine site.
The unitary consumption of fuels measured as the energy used in the processing of a ton of fine copper content by process by site is calculated as: the consumption of fuel transformed into energy units divided by fine copper content in the product of the aforementioned process, as shown in (3.2). For the calculations of the fuel units consumed per ton of fine copper at a national level per process, the unitary consumption per site is considered and weighted in accordance to their contribution of fine copper to the national total according to the process at hand, as shown in (3.3).

Update Report on Energy Usage in Copper Mining for 2014 11
Chilean Copper Commission
𝐶𝑜𝑛𝑠. 𝑈𝑛𝑖𝑡. 𝑜𝑓 𝐹𝑢𝑒𝑙. 𝑥 𝐶𝑢 𝐹𝑖𝑛𝑒𝑖𝑗 =𝐹𝑢𝑒𝑙 𝑒𝑛𝑒𝑟𝑔𝑦 𝑐𝑜𝑛𝑠𝑢𝑚𝑒𝑑 𝑖𝑗 (𝑀𝐽)
𝐹𝑖𝑛𝑒 𝐶𝑜𝑝𝑝𝑒𝑟 𝑐𝑜𝑛𝑡𝑒𝑛𝑡 𝑖𝑛 𝑝𝑟𝑜𝑑𝑢𝑐𝑡,𝑝𝑟𝑜𝑐𝑒𝑠𝑠𝑖𝑗 (𝑇𝑀𝐹)(𝑀𝐽/𝑇𝑀𝐹) (3.2)
𝐶𝑜𝑛𝑠. 𝑈𝑛𝑖𝑡. 𝑜𝑓 𝐹𝑢𝑒𝑙 𝑥 𝐶𝑢 𝐹𝑖𝑛𝑒 = ∑ 𝐶𝑜𝑛𝑠. 𝑈𝑛𝑖𝑡. 𝑑𝑒 𝐹𝑢𝑒𝑙𝑥 𝐶𝑢 𝐹𝑖𝑛𝑒𝑖𝑗 ×𝐶𝑢 𝐹𝑖𝑛𝑒 𝑖𝑛 𝑃𝑟𝑜𝑑𝑢𝑐𝑡𝑖𝑗
𝐶𝑢 𝐹𝑖𝑛𝑒 𝑖𝑛 𝑃𝑟𝑜𝑑𝑢𝑐𝑡𝑗𝑖𝑗 (𝑀𝐽/𝑇𝑀𝐹) (3.3)
Where i corresponds to mining site, while j corresponds to the different productive processes.
In the case of unitary consumption of fuel energy according to the processed ores, first the unitary usage per site is calculated, taking the fuel energy used in the processes divided by the total material processed, as shown in (3.4). To carry out the calculation of the unitary fuel consumption of processed material at a national level, the unitary levels are weighted in accordance to their participation of the amount of processed material per site of the national total processed in a specific process as shown in (3.5).
𝐶𝑜𝑛𝑠. 𝑈𝑛𝑖𝑡 𝑜𝑓𝐹𝑢𝑒𝑙. 𝑥 𝑀𝑎𝑡𝑒𝑟𝑖𝑎𝑙𝑖𝑗 =𝐹𝑢𝑒𝑙 𝐸𝑛𝑒𝑟𝑔𝑦 𝑈𝑠𝑒𝑑𝑖𝑗 (𝑀𝐽)
𝑀𝑎𝑡𝑒𝑟𝑖𝑎𝑙 𝑝𝑟𝑜𝑐𝑒𝑠𝑠𝑒𝑑,𝑝𝑟𝑜𝑐𝑒𝑠𝑠𝑖𝑗 (𝑀𝑒𝑡𝑟𝑖𝑐 𝑇𝑜𝑛𝑠 𝑜𝑓 𝑀𝑎𝑡𝑒𝑟𝑖𝑎𝑙)(𝑀𝐽/𝑇𝑀) (3.4)
𝐶𝑜𝑛𝑠. 𝑈𝑛𝑖. 𝑜𝑓 𝐹𝑢𝑒𝑙. 𝑥 𝑀𝑎𝑡𝑒𝑟𝑖𝑎𝑙 = ∑ 𝐶𝑜𝑛𝑠. 𝑈𝑛𝑖𝑡 𝑜𝑓 𝐹𝑢𝑒𝑙𝑥 𝑀𝑎𝑡𝑒𝑟𝑖𝑎𝑙𝑖𝑗 ×𝑀𝑎𝑡𝑒𝑟𝑖𝑎𝑙 𝑝𝑟𝑜𝑐𝑒𝑠𝑠𝑒𝑑𝑖𝑗
𝑀𝑎𝑡𝑒𝑟𝑖𝑎𝑙 𝑝𝑟𝑜𝑐𝑒𝑠𝑠𝑒𝑑𝑗𝑖𝑗 (𝑀𝐽/𝑇𝑀) (3.5)
Where i corresponds to mine site while j corresponds to the different productive processes..
2.2.2. Electricity:
The methodology used to carry out the calculations of the usage indicators of electricity on a global and unitary level are presented in (3.6), (3.7), (3.8), (3.9) y (3.10), following the same nomenclature previously presented.
𝐸𝑙𝑒𝑐𝑡𝑟𝑖𝑐𝑎𝑙 𝐸𝑛𝑒𝑟𝑔𝑦 = ∑ 𝐸𝑙𝑒𝑐𝑡𝑟𝑖𝑐𝑎𝑙 𝐸𝑛𝑒𝑟𝑔𝑦 𝐶𝑜𝑛𝑠𝑢𝑚𝑒𝑑𝑖 (𝑃𝑒𝑡𝑎𝑗𝑜𝑢𝑙𝑒𝑠) (3.6)
𝐶𝑜𝑛𝑠. 𝑈𝑛𝑖𝑡 𝑜𝑓 𝐸𝑙𝑒𝑐𝑡𝑟𝑖𝑐𝑖𝑡𝑦 𝑥 𝐶𝑢 𝐹𝑖𝑛𝑒𝑖𝑗 =𝐸𝑙𝑒𝑐𝑡𝑟𝑖𝑐𝑎𝑙 𝐸𝑛𝑒𝑟𝑔𝑦 𝑐𝑜𝑛𝑠𝑢𝑚𝑒𝑑 𝑖𝑗 (𝑀𝐽)
𝐹𝑖𝑛𝑒 𝑐𝑜𝑝𝑝𝑒𝑟 𝑐𝑜𝑛𝑡𝑒𝑛𝑡 𝑖𝑛 𝑝𝑟𝑜𝑑𝑢𝑐𝑡, 𝑝𝑟𝑜𝑐𝑒𝑠𝑠𝑖𝑗 (𝑇𝑀𝐹)(𝑀𝐽/𝑇𝑀𝐹) (3.7)
𝐶𝑜𝑛𝑠. 𝑈𝑛𝑖𝑡 𝑜𝑓 𝐸𝑙𝑒𝑐. 𝑥 𝐶𝑢 𝐹𝑖𝑛𝑒 = ∑ 𝐶𝑜𝑛𝑠. 𝑈𝑛𝑖𝑡 𝑜𝑓 𝐸𝑙𝑒𝑐. 𝑥 𝐶𝑢 𝐹𝑖𝑛𝑒𝑖𝑗 ×𝐶𝑢 𝐹𝑖𝑛𝑒 𝑖𝑛 𝑃𝑟𝑜𝑑𝑢𝑐𝑡𝑖𝑗
𝐶𝑢 𝐹𝑖𝑛𝑒 𝑖𝑛 𝑃𝑟𝑜𝑑𝑢𝑐𝑡𝑗𝑖𝑗 (𝑀𝐽/𝑇𝑀𝐹) (3.8)
𝐶𝑜𝑛𝑠. 𝑈𝑛𝑖𝑡 𝑜𝑓 𝐸𝑙𝑒𝑐. 𝑥 𝑀𝑎𝑡𝑒𝑟𝑖𝑎𝑙𝑖𝑗 =𝐸𝑙𝑒𝑐𝑡𝑟𝑖𝑐𝑎𝑙 𝐸𝑛𝑒𝑟𝑔𝑦 𝑐𝑜𝑛𝑠𝑢𝑚𝑒𝑑 𝑖𝑗 (𝑀𝐽)
𝑀𝑎𝑡𝑒𝑟𝑖𝑎𝑙 𝑝𝑟𝑜𝑐𝑒𝑠𝑠𝑒𝑑,𝑝𝑟𝑜𝑐𝑒𝑠𝑠𝑖𝑗 (𝑀𝑒𝑡𝑟𝑖𝑐 𝑡𝑜𝑛𝑠 𝑜𝑓 𝑚𝑎𝑡𝑒𝑟𝑖𝑎𝑙)(𝑀𝐽/𝑇𝑀) (3.9)
𝐶𝑜𝑛𝑠. 𝑈𝑛𝑖𝑡 𝑜𝑓 𝐸𝑙𝑒𝑐. 𝑥 𝑀𝑎𝑡𝑒𝑟𝑖𝑎𝑙 = ∑ 𝐶𝑜𝑛𝑠. 𝑈𝑛𝑖𝑡 𝑜𝑓 𝐸𝑙𝑒𝑐. 𝑥 𝑀𝑎𝑡𝑒𝑟𝑖𝑎𝑙𝑖𝑗 ×𝑀𝑎𝑡𝑒𝑟𝑖𝑎𝑙 𝑝𝑟𝑜𝑐𝑒𝑠𝑠𝑒𝑑𝑖𝑗
𝑀𝑎𝑡𝑒𝑟𝑖𝑎𝑙 𝑝𝑟𝑜𝑐𝑒𝑠𝑠𝑒𝑑𝑗𝑖𝑗 (𝑀𝐽/𝑇𝑀) (3.10)
3. Energy consumption of copper mining at a national level
This section shows a general vision of energy consumption in copper mining in Chile. It includes
information related to the total use of energy, unitary usage per ton of fine copper, and the
variation in comparison with the energy usage on a country level.

Update Report on Energy Usage in Copper Mining for 2014 12
Chilean Copper Commission
Figure 4 shows a graph of the national consumption of energy in copper mining segmented by the
usage of electricity and fuels. It is noteworthy that there has been an increase from 154,835
terajoules (TJ) in 2013 to 161,716 TJ in 2014, which represents a 4.4% rise. In this sense, the
increase in electricity consumption was 2.7% in the 2013-2014 period, while the increase in fuel
consumption was 6.4% in the same period. In the case of fuels, the increase in total consumption
is due principally to further transporting distances in trucking, an increase in material being
moved, as well as an increase in fuel consumption for the start-up of a new mine. On the other
hand, the increase in the consumption of electrical energy is due primarily to a greater quantity of
copper being processed in concentrating plants. This reflects the manner in which the total
energy consumption in copper mining increased 85% in the period of 2001-2014, where fuels
increased 74% and electricity by 99% in the same time period.
Figure 4: National Energy Usage in Copper Mining, Terajoules, 2001 – 2014.
Source: Prepared by Cochilco
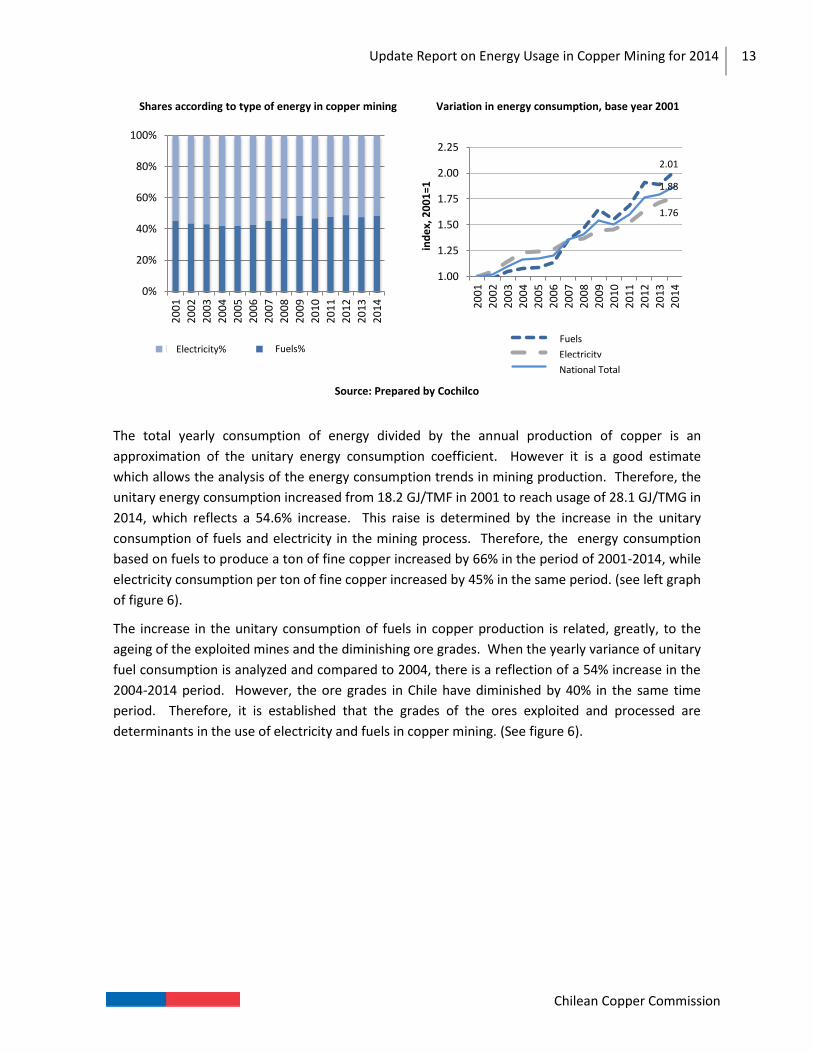
In 2014 the percentage of electrical consumption of total energy reached 52%, very much like the average of the last 4 years when an average of 53% was reached. This contrasts with the average
usage of electricity in the 2003.2007 period, which reached 57%. Figure 5: Shares of electricity and fuels in total energy consumption and annual variation in energy usage between 2001-2014.
2001 2002 2003 2004 2005 2006 2007 2008 2009 2010 2011 2012 2013 2014
Electricidad 47,272 49,454 53,945 58,082 58,831 59,744 63,854 64,653 68,318 68,947 71,874 77,678 81,084 83,261
Combustibles 38,962 38,251 40,742 42,031 42,468 44,346 52,939 56,993 64,402 60,637 65,732 74,326 73,751 78,454
0
20,000
40,000
60,000
80,000
100,000
120,000
140,000
160,000
180,000
Tera
jou
le
Electricity
Fuels
Update Report on Energy Usage in Copper Mining for 2014 13
Chilean Copper Commission
Source: Prepared by Cochilco
The total yearly consumption of energy divided by the annual production of copper is an
approximation of the unitary energy consumption coefficient. However it is a good estimate
which allows the analysis of the energy consumption trends in mining production. Therefore, the
unitary energy consumption increased from 18.2 GJ/TMF in 2001 to reach usage of 28.1 GJ/TMG in
2014, which reflects a 54.6% increase. This raise is determined by the increase in the unitary
consumption of fuels and electricity in the mining process. Therefore, the energy consumption
based on fuels to produce a ton of fine copper increased by 66% in the period of 2001-2014, while
electricity consumption per ton of fine copper increased by 45% in the same period. (see left graph
of figure 6).
The increase in the unitary consumption of fuels in copper production is related, greatly, to the
ageing of the exploited mines and the diminishing ore grades. When the yearly variance of unitary
fuel consumption is analyzed and compared to 2004, there is a reflection of a 54% increase in the
2004-2014 period. However, the ore grades in Chile have diminished by 40% in the same time
period. Therefore, it is established that the grades of the ores exploited and processed are
determinants in the use of electricity and fuels in copper mining. (See figure 6).
0%
20%
40%
60%
80%
100%
20
01
20
02
20
03
20
04
20
05
20
06
20
07
20
08
20
09
20
10
20
11
20
12
20
13
20
14
Electricidad % Combustibles %
Shares according to type of energy in copper mining
2.01
1.76
1.88
1.00
1.25
1.50
1.75
2.00
2.25
20
01
20
02
20
03
20
04
20
05
20
06
20
07
20
08
20
09
20
10
20
11
20
12
20
13
20
14
ind
ex,
20
01
=1
CombustiblesElectricidadTotal Nacional
Variation in energy consumption, base year 2001
Electricity% Fuels% Electricity
Fuels
National Total
Update Report on Energy Usage in Copper Mining for 2014 14
Chilean Copper Commission
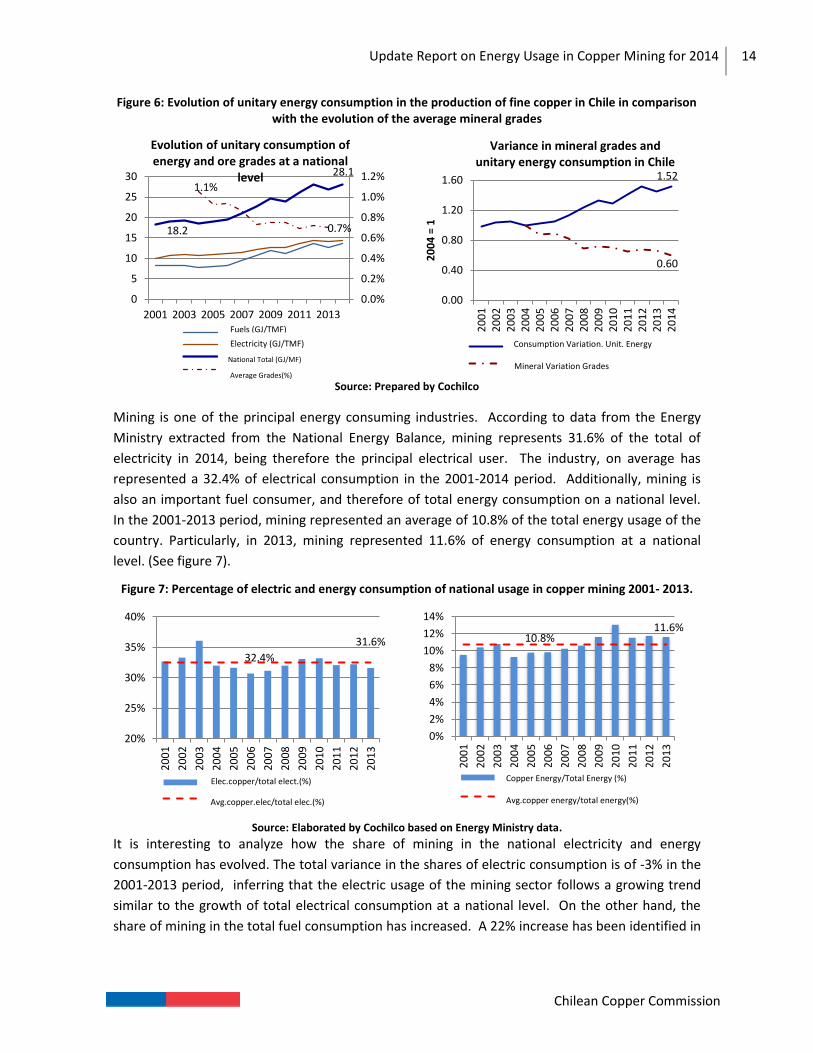
Figure 6: Evolution of unitary energy consumption in the production of fine copper in Chile in comparison with the evolution of the average mineral grades
Source: Prepared by Cochilco
Mining is one of the principal energy consuming industries. According to data from the Energy
Ministry extracted from the National Energy Balance, mining represents 31.6% of the total of
electricity in 2014, being therefore the principal electrical user. The industry, on average has
represented a 32.4% of electrical consumption in the 2001-2014 period. Additionally, mining is
also an important fuel consumer, and therefore of total energy consumption on a national level.
In the 2001-2013 period, mining represented an average of 10.8% of the total energy usage of the
country. Particularly, in 2013, mining represented 11.6% of energy consumption at a national
level. (See figure 7).
Figure 7: Percentage of electric and energy consumption of national usage in copper mining 2001- 2013.
Source: Elaborated by Cochilco based on Energy Ministry data.
It is interesting to analyze how the share of mining in the national electricity and energy
consumption has evolved. The total variance in the shares of electric consumption is of -3% in the
2001-2013 period, inferring that the electric usage of the mining sector follows a growing trend
similar to the growth of total electrical consumption at a national level. On the other hand, the
share of mining in the total fuel consumption has increased. A 22% increase has been identified in
18.2
28.1
1.1%
0.7%
0.0%
0.2%
0.4%
0.6%
0.8%
1.0%
1.2%
0
5
10
15
20
25
30
2001 2003 2005 2007 2009 2011 2013
Evolution of unitary consumption of energy and ore grades at a national
level
Combustibles (GJ/TMF)Electricidad (GJ/TMF)Total Nacional (GJ/TMF)Leyes Promedio (%)
1.52
0.60
0.00
0.40
0.80
1.20
1.60
20
01
20
02
20
03
20
04
20
05
20
06
20
07
20
08
20
09
20
10
20
11
20
12
20
13
20
14
20
04
= 1
Variance in mineral grades and unitary energy consumption in Chile
Variación Consumo. Unit. Energía
Variación Leyes Mineral
31.6%
32.4%
20%
25%
30%
35%
40%
20
01
20
02
20
03
20
04
20
05
20
06
20
07
20
08
20
09
20
10
20
11
20
12
20
13
Elect. cobre/elect. total (%)
Prom. elec. cobre/elec. total (%)
11.6% 10.8%
0%
2%
4%
6%
8%
10%
12%
14%
20
01
20
02
20
03
20
04
20
05
20
06
20
07
20
08
20
09
20
10
20
11
20
12
20
13
Energía cobre/energía total (%)
Prom. energia cobre/ energía total (%)
Fuels (GJ/TMF)
Electricity (GJ/TMF)
National Total (GJ/MF)
Average Grades(%)
Consumption Variation. Unit. Energy
Mineral Variation Grades
Elec.copper/total elect.(%)
Avg.copper.elec/total elec.(%)
Copper Energy/Total Energy (%)
Avg.copper energy/total energy(%)

Update Report on Energy Usage in Copper Mining for 2014 15
Chilean Copper Commission
the 2001-2013 period, wherein the maximum was reached in 2008, with a 37% fluctuation with
respects to 2001.
Figure 8: Yearly change with 2001 as base in the participation of electrical and energy consumption in mining of national consumption, 2001 – 2013.
Source: Prepared by Cochilco
0.97
1.37
1.22
0.80
0.90
1.00
1.10
1.20
1.30
1.40
Variación Elect.cobre/elect. total (%)
Variación energíacobre/energía total(%)
Elect. Variation copper/total elect.(%)
Energy Variation Copper/Total Energy
(%)

Update Report on Energy Usage in Copper Mining for 2014 16
Chilean Copper Commission
4. Fuel consumption of copper mining
This section shows information referring to the total evolution based on fuels, the total fuel energy
per process, and the unitary consumption of fuels for fine copper and per processed materials.
In 2014 mining reached a total consumption of 78,454 terajoules (TJ) of energy based on fuels,
which represents a 4.6% increase over 2013. As previously mentioned, this increase is due to the
start-up of a new mining site, the greater consumption due to the increase in material removed
due to the expansion of the processing capacity of open pit mining operations, as well as an
increase in the marginal consumption associated with a decrease in ore grades and ageing of the
mines. The energy consumption based on fuels in 2001 was 38,962 TJ, therefore the fuel
consumption in 2014 corresponds to a 101% increase.
Figure 9: Consumption of fuel based energy in copper mining in TJ, 2001 - 2014
Source: Prepared by Cochilco
In 2014, 85.2% of the energy used in the mix of fuels corresponds to diesel. This fuel is used in the
most part in the ore and waste transportation trucks in the extraction process of mining. It is
followed by the fuels Enap 6 and natural gas, with 7.5 and 6.4% shares respectively, which are
used primarily in the generation of electricity in various services. (See figure 10)
38,962
73,751 78,454
0
10,000
20,000
30,000
40,000
50,000
60,000
70,000
80,000
90,000
2001 2002 2003 2004 2005 2006 2007 2008 2009 2010 2011 2012 2013 2014
Fue
l En
erg
y TJ

Update Report on Energy Usage in Copper Mining for 2014 17
Chilean Copper Commission
Figure 10: Diesel participation in fuel based energy consumption in 2014.
Source: Prepared by Cochilco
A great percentage of fuel based energy used in copper mining is during the transportation
process. This is owing to this process being intensive in diesel consumption. In 2014, the fuel
based energy consumption in pit mining was 59,974 TH. The pit mining process increased the use
in 2014 by 4.6% over 2013. On the other hand, the smelting process increased fuel based energy
consumption by 13.2% over 2013, reaching 7,410 TJ, due principally to an increase in concentrate
processed, which rose by 11% in the 2013-2014 period. (See figure 11)
Figure 11: Consumption of fuels per mining process, national level 2001 – 2014.
Source: Prepared by Cochilco
The increase in fuel usage in the open pit mining process has not only been in absolute terms, but
also in relative terms to the other processes inside the mining production chain. Therefore the
Diesel 85.2%
Enap 6 7.5%
Natural Gas (PERCENTAGE)
Other (PERCENTAGE)
Fuel consumption en 2014 (Total 78.454 TJ)
59.974
7.410 4.438 4.222
0
10,000
20,000
30,000
40,000
50,000
60,000
70,000
80,000
90,000
Fuel
En
ergy
TJ
Servicios
LX/SX/EW
Refinería
Fundición
Concentradora
Mina Subterránea
Mina Rajo
Services
LX/SX/EW
Refining
Smelting
Concentration
Underground Mining
Open Pit Mining

Update Report on Energy Usage in Copper Mining for 2014 18
Chilean Copper Commission
percentage of pit mining processes over the total usage of fuel energy was 56% in 2001, while this
value increased to reach 76% in 2014. Conversely, refining and smelting have reduced their
relative participation in fuel consumption in the 2001-2014 period due to a lack of increase in
processing capacity, which directly coincides with energy usage. Thus, the smelting process
represented 24% of total fuel consumption in 2001, whereas in 2014 it only reached 9.5% (see
figure 12).
Figure 12: Percentage per mining process of total usage of fuel based energy, 2001 – 2014.
Source: Prepared by Cochilco
The pit mining process in 2014 corresponds to 2.7 times the consumption of 2001. The increase in
the usage can be divided in two phases. First, the 2001-2006 period wherein the growth in fuel
consumption corresponds to a rate of 4% yearly. Second, the 2006-2014 period wherein the
growth of fuel usage in the pit mines has been more intense, reaching a growth rate of 11% yearly.
Contrarily, the smelting and refining processes have diminished their total fuel consumption when
compared with the usage in 2001. The usage of fuels in refining in 2001 was 1,524TJ, whereas in
2014 it was 1,171 TJ, which represents a 23% reduction. Likewise, in the 2001-2014 period,
smelting reduced total consumption by 19% (see Figure 13).
0%
10%
20%
30%
40%
50%
60%
70%
80%
90%
100%
Servicios
LX/SX/EW
Refinería
Fundición
Concentradora
Mina Subterránea
Mina Rajo
Services
LX/SX/EW LX/SX/EW
Refining
Services Smelting
Services Concentration
Services Underground Mining
Services Open Pit Mining
Services

Update Report on Energy Usage in Copper Mining for 2014 19
Chilean Copper Commission
Figure 13: Yearly change in fuel consumption per process, base year 2001 = 1.
Source: Prepared by Cochilco
The following gives a brief review of the evolution and change of unitary fuel based energy
consumption in copper mining.
The unitary consumption of fuels per ton of fine copper in the processes of concentration,
subterranean mining, and refining have been relatively constant, wherein no significant changes
are seen. In the case of smelting there has been a noticeable decrease in the unitary consumption
of fuels by 21% in the 2001-2014 period. The unitary usage of fuel per ton of fine copper in the pit
mining process has risen reaching an increase of 78% in the 2001-2014 period. The increase in
unitary fuel consumption in the services process in the 2001-2014 period is of a considerable
157%. However this process has little relative weight, up to now, as it does not coincide with a
greater increase in the total fuel consumption. It is projected that the energy consumption in the
services process will keep increasing principally for the start-up of new desalinization and water
impulsion plants in copper mining.
2.77
0.77
1.27
2.49
0.0
0.5
1.0
1.5
2.0
2.5
3.0
3.5
4.0
4.5

Update Report on Energy Usage in Copper Mining for 2014 20
Chilean Copper Commission
Figure 14: Unitary consumption of fuels per ton of fine copper content in process and annual change compared to base year 2001.
Source: Prepared by Cochilco
Upon analyzing the unitary consumption of energy based on fuels per ton of extracted ore, in the
case of pit mining, a 31% increase on the 2001-2014 period is seen. This indicator is not skewed by
diminishing ore grades, therefore the increase in the fuel consumption is associated to
transportation distances, relative depth of extraction, and possible operational inefficiencies as
the principal causes. On the other hand, the unitary fuel consumption per ton of treated ores in
the case of the concentrator, leaching, and smelting are seen diminishing, which is indicative of
improved operations or management.
Figure 15: Unitary energy usage associated with fuels according to tons of ore processed and yearly change with base year 2001.
Source: Prepared by Cochilco
7,678
4,784
1,301
2,866
0
3,000
6,000
9,000
20
01
20
02
20
03
20
04
20
05
20
06
20
07
20
08
20
09
20
10
20
11
20
12
20
13
20
14
MJ/
TMF
Unitary consumption of fuels per ton of fine copper
Mina Rajo Mina SubterráneaConcentradora FundiciónRefinería LX/SX/EWServicios
1.78
0.79
1.18
2.57
0.0
0.5
1.0
1.5
2.0
2.5
3.0
20
01
20
02
20
03
20
04
20
05
20
06
20
07
20
08
20
09
20
10
20
11
20
12
20
13
20
14
Bas
e y
ear
20
01
=1
Annual change in unitary fuel consumption, base year 2001 = 1
57.8
1.6
9.8
1,381
0
500
1,000
1,500
2,000
2,500
0
10
20
30
40
50
60
70
20
01
20
02
20
03
20
04
20
05
20
06
20
07
20
08
20
09
20
10
20
11
20
12
20
13
20
14
Unitary consumption of fuels per ton of processed ore
Mina Rajo (MJ/TM mineral extraído)Mina Subterránea (MJ/TM mineral extraído)Concentradora (MJ/TM mineral procesado)LX/SX/EW (MJ/TM mineral lixiviado)Fundición (MJ/TM conc. procesado)
1.31
0.86 0.73 0.60
0.00
0.40
0.80
1.20
1.60
2.00
20
01
20
02
20
03
20
04
20
05
20
06
20
07
20
08
20
09
20
10
20
11
20
12
20
13
20
14
año
bas
e 2
00
1=1
Change in unitary consumption of fuels per ton of processed ore
Mina Rajo Mina Subterránea
Concentradora Fundición
LX/SX/EW
Open Pit Mining
Concentration
Refining
Services
Underground Mine
Smelting
Open Pit Mining (MJ/TM extracted ore) Underground Mining (MJ/TM extracted ore)
Concentration (MJ/TM processed ore)
LX/SX/EW (MJ/TM leached ore)
Smelting (MJ/TM processed con.)
Open Pit Mining
Concentration
Underground Mining
Smelting

Update Report on Energy Usage in Copper Mining for 2014 21
Chilean Copper Commission
5. Electricity usage in copper mining
The following will analyze the consumption and yearly change in electrical usage in copper mining
on a higher level, per process per ton of copper and the unitary consumption of electricity per ton
of ore treated per process.
In the case of electricity, an analysis of consumption on a national level in copper production will
be done. Then a comparative analysis in electricity usage in copper production between the
interconnected Norte Grande and Central systems will be carried out.
5.1. Electrical consumption of copper mining at a national level
In 2014 copper mining consumed a total of 83,261 TJ of electrical energy. This usage corresponds
to a 2.7% increase over usage from 2013, where it reached 81,084 TJ. The increase in electrical
consumption is principally due to the marginal increase in consumption from the existing
operations, as well as from the increase in processing capacity in concentration plants at a national
level of the new mining sites and expansion projects started in 2013 and 2014.
Figure 16: Electrical consumption in copper mining in TJ, 2001 - 2014
Source: Prepared by Cochilco
When analyzing the electrical consumption per process in mining, it is determined that the
greatest increase occurs in the concentrating plant which reached an increase in total
consumption of 5.4% over 2013, finishing at 43,685 TJ. The rise in electrical consumption is related
to the increase in processed ore in the concentrating plants which rose by 4.8% in the 2013-2014
period, due principally to the start-up of new processing capacities in the Caserones, Ministro
Hales, and Sierra Gorda mines, as well as a growth in mineral processing reached by important
operations in mining through expansion projects. The second process which consumed most
electricity in 2014 corresponds to leaching, which consumed a total of 20,752 TJ, which correlates
to a 4.9% drop in total consumption over 2013, due in part to the decline in fine copper
production of cathodes through electro-winning, which decreased by 7.4% in the 2013-2014
81,084 83,261
0
10,000
20,000
30,000
40,000
50,000
60,000
70,000
80,000
90,000
2001 2002 2003 2004 2005 2006 2007 2008 2009 2010 2011 2012 2013 2014
Ele
ctri
cal E
ne
rgy,
TJ
Update Report on Energy Usage in Copper Mining for 2014 22
Chilean Copper Commission
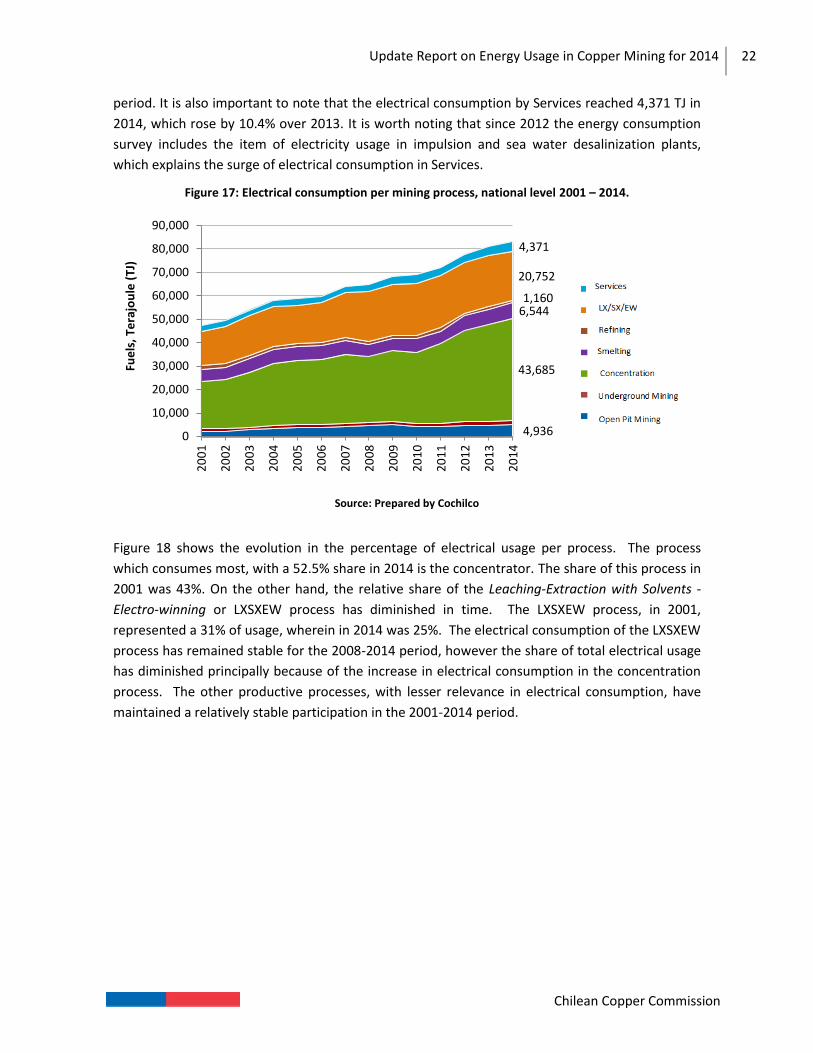
period. It is also important to note that the electrical consumption by Services reached 4,371 TJ in
2014, which rose by 10.4% over 2013. It is worth noting that since 2012 the energy consumption
survey includes the item of electricity usage in impulsion and sea water desalinization plants,
which explains the surge of electrical consumption in Services.
Figure 17: Electrical consumption per mining process, national level 2001 – 2014.
Source: Prepared by Cochilco
Figure 18 shows the evolution in the percentage of electrical usage per process. The process
which consumes most, with a 52.5% share in 2014 is the concentrator. The share of this process in
2001 was 43%. On the other hand, the relative share of the Leaching-Extraction with Solvents -
Electro-winning or LXSXEW process has diminished in time. The LXSXEW process, in 2001,
represented a 31% of usage, wherein in 2014 was 25%. The electrical consumption of the LXSXEW
process has remained stable for the 2008-2014 period, however the share of total electrical usage
has diminished principally because of the increase in electrical consumption in the concentration
process. The other productive processes, with lesser relevance in electrical consumption, have
maintained a relatively stable participation in the 2001-2014 period.
4,936
43,685
6,544 1,160
20,752
4,371
0
10,000
20,000
30,000
40,000
50,000
60,000
70,000
80,000
90,000
20
01
20
02
20
03
20
04
20
05
20
06
20
07
20
08
20
09
20
10
20
11
20
12
20
13
20
14
Fue
ls, T
era
jou
le (
TJ)

Update Report on Energy Usage in Copper Mining for 2014 23
Chilean Copper Commission
Figure 18: Share of the mining processes in the total electricity usage, 2001 – 2014.
Source: Prepared by Cochilco
The concentration process has surged in electrical consumption by 117% in the 2001-2014 period,
where the largest increase is seen starting in 2010 and lasting through 2014. In this manner, the
increase in electricity consumption in the 2001-20010 period occurs at an average yearly growth
rate of 4.8%, while in the 2010-2014 period the growth rate is 7%. The LXSXEW process is
important to analyze due to the share it represents of electricity usage and evolution in total
consumption as well. In this sense, the LXSXEW process in the 2001-2014 period increased
consumption by 41%, from 14,679 TJ to 20,766TJ in 2014; in three periods: 2001-2005 with a
yearly growth rate of 8.1%, 2005-2009 with a growth rate of 2.5% yearly, and 2009-2014 with a
7.0% yearly growth rate. The electrical consumption in the smelting and pit mining process have
reached historic highs. In the case of smelting, a total consumption of 6,544 TH was reached in
2014, which is 24% higher than 2001. With respects to electricity usage in pit mining 2014
reached 4,936 TJ, a 117% increase over consumption in 2001. (See figure 19).
0%
10%
20%
30%
40%
50%
60%
70%
80%
90%
100%

Update Report on Energy Usage in Copper Mining for 2014 24
Chilean Copper Commission
Figure 19: Annual change in energy consumption according to process, base year 2001=.
Source: Prepared by Cochilco
Figure 20 shows the unitary consumption of electricity per ton of processed copper for the
different processes. The unitary consumption of electricity in the concentration process has
increased by 77% in the 2001-2014 period, a yearly growth rate of 4.4%. The increase in the
unitary consumption of electricity per ton of fine copper in the LXSXEW process has been 19% in
the 2001.2014 period, reflecting an annual growth rate of 1.4% in the same period. The 2013-
2014 period shows in increase in the unitary consumption of electricity per ton of fine copper of
4.1%, due to the decrease of copper in LXSXEW of 7.8%, while the electric consumption only
declines by 4.3% (see figure 20).
Figure 20: Unitary consumption of electricity per ton of fine copper per process and yearly change in compared to base year 2001.
Source: Prepared by Cochilco
Lastly, when analyzing the unitary consumption of electricity per ton of processed ore in the
2013/2014 period, only the concentration area presents an increase, reaching a 0.8% rate. In this
sense, when the unitary consumption of treated ore is analyzed for the concentrating plant in the
1.90
2.17
1.24
0.78
1.41
1.76
0.0
0.5
1.0
1.5
2.0
2.5
Mina Rajo
Mina Subterránea
Concentradora
Fundición
Refinería
LX/SX/EW
Servicios
2,175
10,810
4,225
1,278
12,086
0
2,000
4,000
6,000
8,000
10,000
12,000
14,000
20
01
20
02
20
03
20
04
20
05
20
06
20
07
20
08
20
09
20
10
20
11
20
12
20
13
20
14
MJ/
TMF
Unitary consumption of electricity per ton of fine copper
1.48
1.77
1.21
1.03
0.75
1.00
1.25
1.50
1.75
2.00
20
01
20
02
20
03
20
04
20
05
20
06
20
07
20
08
20
09
20
10
20
11
20
12
20
13
20
14
Change in unitary consumption per ton of finecopper
Open Pit Mining
Underground Mining
Concentration
Smelting
Refining
Services

Update Report on Energy Usage in Copper Mining for 2014 25
Chilean Copper Commission
last 4 years, an average of 79.7 MJ/TM of processed ore is reached, very similar to the usage
reached in 2014; wherein in the 2001-2014 period the increase is of 20%. In the case of the
LXSXEW process, the 2013-2014 period presents a decline in the unitary consumption of
processed ore by 1.7%, mainly because of the increase in the leaching and processing of low grade
ores by mining sites.
Figure 21: Unitary consumption of electricity per ton of ore processed and yearly change with base year 2001.
Source: Prepared by Cochilco
5.2. Electric consumption of copper mining in the Norte Grande and Central Interconnected Systems.
The electric consumption in the Interconnected Norte Grande System was of 47,464 TJ, while in
the Interconnected Central System was 35,796 TJ in 2014. With respects to electrical consumption
in the year 2013, the Norte Grande System had a 2.6% increase, while usage in the Central
Interconnected System had a 2.8% increase in the 2013-2014 period.
The processes with the highest energy consumption in the SING in 2014 correspond to LXSXEW
with a total of 18,834 TJ consumed, and the concentration process with a usage of 18,333 TJ. With
respects to the LXSXEW process the usage in 2014 decreased by 3.7% in comparison to usage in
2013. On the other hand, the concentration process in SING in 2014 increased in usage by 8.5% in
respects to 2013 (See figure 22).
The highest consumption in the SIC occurred in the concentrator, where the total consumption
reached 25,351 TJ in 2014, which represents a 3.3% increase over 2013. The second most relevant
process in the SIC corresponds to smelting, which in 2014 used a total of 3.642 TJ, which is a 0.2%
increase over 2013.
5.0
21.3
80.3
40.5
1,220
0
500
1,000
1,500
0
30
60
90
Unitary consumption of electricity per ton of processed ore
1.09
1.52
1.20
0.63
0.0
0.3
0.6
0.9
1.2
1.5
1.8
Yearly change in unitary consumption of electricity per ton of processed ore
Mina Rajo Mina SubterráneaConcentradora FundiciónLX/SX/EW
Open Pit Mining
Concentration
Underground Mining
Smelting

Update Report on Energy Usage in Copper Mining for 2014 26
Chilean Copper Commission
Figure 22: Evolution of electric consumption per process in SIC and SING
Source: Prepared by Cochilco
In the case of SING, the concentration process share has increase, while the LXSXEW process has
decreased in the 2001-2014 period. The share in electricity consumption in the SING concentrator
was 27.5% in 2001, increasing to 38.6% share in 2014. On the other hand, the LXSXEW process in
2001 reached a 49% participation, declining to a 39% share in 2014. In the case of the share of
electric consumption by processes in the SIC, the shares are more stable than in the SING line. As
the most significant usage occurs in the condenser, it reached a 63% share in 2001, and increased
to 67.4% in 2014. The smelting process´ electric consumption decreased slightly in the SIC, from
14.8% in 2001 to 13% in 2014. (See figure 23).
0
10,000
20,000
30,000
40,000
50,0002
00
1
20
02
20
03
20
04
20
05
20
06
20
07
20
08
20
09
20
10
20
11
20
12
20
13
20
14
TJ
SING
Servicios LX/SX/EWRefinería FundiciónConcentradora Mina SubterráneaMina Rajo
0
10,000
20,000
30,000
40,000
50,000
20
01
20
02
20
03
20
04
20
05
20
06
20
07
20
08
20
09
20
10
20
11
20
12
20
13
20
14
TJ
SIC
Services
Refining
Concentration
Open Pit Mining
Smelting
Underground Mining

Update Report on Energy Usage in Copper Mining for 2014 27
Chilean Copper Commission
Figure 23: Evolution of the participation of electrical energy per process in SING and SIC
Source: Prepared by Cochilco
In the case of the variation in electrical consumption in SING, the 147% increase in the
concentrating process stands out in the 2001-2014 period, which has increased over time with a
yearly rate of 8%. The LXSXEW process has also increased in usage, but on a smaller scale.
Electricity consumption by LXSXEW increased by 41% in 2014 with respects to the usage in 2001.
In the case of the change in the SIC, the increase in electrical consumption in the concentration
process is noteworthy, which has increased by 100% in respect to the same process in 2001. The
interconnected SIC system also discloses the increase of electrical consumption in the LXSXEW
process which rose by 43% in the 2001-2014 period (see figure 23).
Figure 24: Change in electrical energy consumption per process in respect to 2001
Source: Prepared by Cochilco
0%
20%
40%
60%
80%
100%
SING
0%
20%
40%
60%
80%
100%
SIC
2.47
0.54
1.41
1.70
8.59
0.00
1.50
3.00
4.50
6.00
7.50
9.00
0.00
0.50
1.00
1.50
2.00
2.50
3.00
20
01
20
02
20
03
20
04
20
05
20
06
20
07
20
08
20
09
20
10
20
11
20
12
20
13
20
14
SING
Mina Rajo Concentradora
Fundición Refinería
LX/SX/EW Servicios
Mina Subterránea
2.00
1.07
1.43
0.75
1.00
1.25
1.50
1.75
2.00
2.25
20
01
20
02
20
03
20
04
20
05
20
06
20
07
20
08
20
09
20
10
20
11
20
12
20
13
20
14
SIC
Open Pit Mining
Smelting
Underground Mining
Concentration
Refining
Services

Update Report on Energy Usage in Copper Mining for 2014 28
Chilean Copper Commission
In SIC as well as in SING there exists an increase in unitary consumption per ton of fine copper
content in the concentrator process. In SING there exists an increase in unitary electricity
consumption per ton of fine copper content processed in the concentrator of 69% in the 2001-
2014 period, while in the SIC it increased by 76%, with the increase being very similar in both
systems. In the case of the variation on the unitary consumption of electricity per ton of fine
copper in the LXSXEW processes a similar evolution is seen but in different magnitudes in both
systems. In the SING the unitary change increased by 25% in the 2001-2014 period, while the SIC
system reached a unitary change of 40% (see Figure 25).
Figure 25: Change in unitary usage of electricity per process per ton of fine copper, with respects to 2001.
Source: Prepared by Cochilco
Upon analyzing the unitary change of electricity for ore processing in the concentrator in the SING
and SIC systems it is determined that the growth is similar, although higher in the SIC system.
Therein, the annual growth rate in the unitary consumption of electricity per ton of copper
processed in the concentrator un SING´s case is 1.36% yearly, while in the case of SIC it is 1.51% in
the 2001-2014 period. These rates determine that the unitary consumption of electricity for
treated ore increased by 17% in SING and by 21% in SIC in the 2001-2014 period. On the other
hand, the LXSXEW case shows a decrease in the unitary consumption of electricity per ton of
processed copper due to an increase of in low-grade copper ores processed. In this case the
electrical consumption per ton of treated copper in LXSXEW has decreased by 37% in SING while in
SIC it has decreased by 40% in the 2001-2014 period. (See figure 26).
0.25
0.50
0.75
1.00
1.25
1.50
1.75
2.00
20
01
20
02
20
03
20
04
20
05
20
06
20
07
20
08
20
09
20
10
20
11
20
12
20
13
20
14
Unitary change in electrical consumption per ton of fine copper-SING
Mina Rajo Mina Subterránea
Concentradora Fundición
Refinería LX/SX/EW
Servicios
0.60
0.90
1.20
1.50
1.80
2.10
20
01
20
02
20
03
20
04
20
05
20
06
20
07
20
08
20
09
20
10
20
11
20
12
20
13
20
14
Unitary change in electrical consumption per ton of fine copper-SIC
Open Pit Mining
Concentration
Refining
Services
Underground Mining
Smelting

Update Report on Energy Usage in Copper Mining for 2014 29
Chilean Copper Commission
Figure 26: Change in unitary consumption of electrical energy per ton processed/extracted, with respect to 2001
Source: Prepared by Cochilco
0.27
1.17
0.63
0.20
0.40
0.60
0.80
1.00
1.20
1.40
20
01
20
02
20
03
20
04
20
05
20
06
20
07
20
08
20
09
20
10
20
11
20
12
20
13
20
14
Change in unitary consumption of electricity per ore processed - SING
Mina Rajo Mina SubterráneaConcentradora FundiciónLX/SX/EW
0.97
1.57
1.26
0.60 0.400.600.801.001.201.401.601.802.00
20
01
20
02
20
03
20
04
20
05
20
06
20
07
20
08
20
09
20
10
20
11
20
12
20
13
20
14
Change in unitary consumption of electricity per ore processed - SIC
Open Pit Mining
Concentration
Underground Mining
Smelting

Update Report on Energy Usage in Copper Mining for 2014 30
Chilean Copper Commission
6. Final Comments
Copper mining increased total energy usage by 4.4% in the 2013-2014 period, which
translates to an increase from 154,834 TJ in 2013 to 161,716 TJ in 2014.
In the case of electricity consumption in mining, there was a 2.7% increase in the 2013-
2014 period. The principal contributor to the increased electrical consumption occurs in
the concentrator, which registered a 5.4% increase, which translates to an additional
consumption of 2,251 TJ in 2013-2014. The Pit Mining and Service processes increased
their electrical consumption in the aforementioned period by 9.3% and 10.45 respectively.
The electrical usage in the LXSXEW process diminished by 4.9% in the 2013-2014 period,
which translates to a 1,078 TJ drop. This decrease in the usage is principally due to
diminished production of cathodes through electro-winning, which dropped by 7.8% in the
same period.
The concentrator process has the highest share of electrical consumption in 2014,
reaching 55.7%. The unitary consumption for processed ores only increased by 0-8% in the
2013-2014 period.
In the case of energy usage from fuels, this increased by 6.4% in the 2013-2014 period.
This is due mainly to an increase in the consumption of diesel in the pit mining process,
which increased by 6.5% in the 2013-2014 period, principally for the start-up of new
mining projects, the increase in ore transportation because of important mining site
expansions, and an increase in ore transportation distances in the existing operations.
The pit mining process consumes the highest amount of fuel energy in 2014, reaching
76.4%. However the unitary consumption for extracted ore only increased by 0.7% in the
2013-2014 period.
In the case of electricity usage in the SING and SIC, they increased consumption in 2014 by
2.6% and 2.8% respectively, when compared to 2013.

Update Report on Energy Usage in Copper Mining for 2014 31
Chilean Copper Commission
7. Glossary
Following is the terminology used:
2.1 ENERGY: The type of energy used in each of the identified processes in the mining activity.
Two principal sources are identified: electricity and fuels. Additionally, in this report, the concept
of energy is identified as the total amount of fuel energy used and electricity used.
2.1.1 Fuels: Corresponds to the total of fuels used in mining to generate energy. The
fuels considered are: Coal, Gasoline, Diesel, Enap 6, Kerosene, Liquefied Gas, Natural Gas,
Wood, Butane, Naphtha, and Propane. The present report shows the use of fuels as units
equivalent to their energy output (terajoules), considering the process of generation and
the output of the same.
2.1.2 Electricity: Corresponds to the electrical energy consumed by the copper mining
industry from the Interconnected Norte Grande System (SING) and the Interconnected
Central System (SIC)
2.2 PROCESSES: Processes are understood as the production stages in mining, which are clearly
identifiable, required, and separate, according to the particularity of the tasks carried out in the
mining production.
2.2.1 Pit Mine: Understood as the set of individual processes necessary for the
extraction of ores from an open pit mining site for subsequent processing and mineral
recovery. Some of the principal processes are: drilling and blasting, transportation,
loading, primary crushing, and others. (Contemplates up to the separate process of
Primary Crushing).
2.2.2 Subterranean Mine: Understood as the set of individual processes necessary for
the extraction of ores from a subterranean mining site, using any type of subterranean
exploitation, for subsequent processing and mineral recovery. Some of the principal
processes are: drilling and blasting, transportation, loading, primary crushing, and others.
2.2.3 Concentrator: Takes into account all of the individual processes, after primary
crushing, involved in the production of copper concentrate. The principal processes
involved are: Crushing Plants, Traditional Milling, S.A.G. Milling, Concentration (Floating),
Filtering, and others.
2.2.4 LXSXEW: Takes into account all of the unitary hydrometallurgical processes
involved in the production of cathodes through electro-winning. The principal processes
include: Agglomeration, ROM Leaching, HEAP Leaching, Extraction with Solvents, and
Electro-winning.
2.2.5 Smelting: Takes into account all of the unitary processes involved in the copper
blister production based on copper concentrate. The principal processes include: Drying,
Fusion (ovens), Conversion, Heat refinery (refining and molding) and others.

Update Report on Energy Usage in Copper Mining for 2014 32
Chilean Copper Commission
2.2.6 Refining: Corresponds to the physical electrolysis process through which highly
pure cathodes are obtained.
2.2.7 Services: Corresponds to those activities which are not involved in the unitary
production processes in the principal value chain, yet are necessary to carry out mining
and use an important amount of energy, such as: energy usage in shops, mining camps,
impulsion and desalinization of water, and others.

Update Report on Energy Usage in Copper Mining for 2014 33
Chilean Copper Commission
This report was elaborated in the
Dirección de Estudios y Políticas Públicas by
Sergio Verdugo Montenegro M.
Mining Analyst
Rosana Brantes A.
Sustainability Analyst
Jorge Cantallopts Araya
Director of Studies and Public Policies
June / 2015