copper removal at the gardner wastewater treatment ... · copper removal at the gardner wastewater...
TRANSCRIPT
Copper Removal at the Gardner Wastewater Treatment Facility
A Major Qualifying Project
Submitted to
The Faculty of
WORCESTER POLYTECHNIC INSTITUTE
In partial fulfillment of the requirements for the
Degree of Bachelor of Science
by
___________________________________
Joshua Less
___________________________________
Ryan Wallace
_________________________________
Elliot White
Date: April 26, 2012
_________________________________
Professor John A. Bergendahl
_________________________________ Professor James C. O’Shaughnessy
_________________________________
Professor Chickery Kasouf

COPPER REMOVAL AT THE GARDNER WWTF 2
Abstract In the recent past, the Gardner Wastewater Treatment Facility has not consistently met permitted limits
for copper discharge. The goal of this project was to gather qualitative information on the copper in the
wastewater flow, such as total & dissolved copper levels, particle sizes, & possible copper sources.
Testing was then conducted to determine possible treatment options. It was concluded that removing
sources of contamination and chemical precipitation would provide the most effluent copper reduction.

COPPER REMOVAL AT THE GARDNER WWTF 3
Acknowledgements A special thanks to Professor James O’Shaughnessy and lab manager Don Pellegrino of WPI’s
Department of Civil & Environmental Engineering and Professor Chickery Kasouf of WPI’s School of
Business for their guidance and assistance throughout the course of this project. We would also like to
thank Mr. Dane Arnold, Gardner Director of Public Works, Mr. Robert Sims of the Maguire Group, and
Tracy Earnest and the staff at the Gardner WWTF for their continued assistance and accommodation
during this project.
COPPER REMOVAL AT THE GARDNER WWTF 4
Executive Summary The United States Environmental Protection Agency (EPA) is concerned with high concentrations
of heavy metals such as copper in any water body because it will lead to numerous environmental issues
affecting aquatic and human lives that depend on the waterway. High levels of copper in water can be
deadly for many different aquatic organisms, thus altering the natural ecosystems living in streams,
rivers and lakes. The Gardner Wastewater Treatment Facility (WWTF), located in East Templeton,
Massachusetts and operated by the city of Gardner, is experiencing problems meeting their maximum
permitted copper levels set forth by the EPA. The goal of this Major Qualifying Project is to investigate
possible copper removal techniques within the WWTF, identify copper contamination within the city’s
sewer system and propose recommendations for additional copper treatment and management
solutions to be further studied for implementation by the city of Gardner.
The EPA is tasked with protecting human health and the environment by determining and
enforcing regulations. The EPA enforces various environmental laws through fines and sanctions, along
with other methods. To ensure that all Americans have access to safe drinking water, the EPA has set
standards for public sewer systems in the United States. The vast majority of these public sewer
systems are regulated through the National Pollutant Discharge Elimination System (NPDES) permits.
The NPDES program, developed to protect the water quality of natural water bodies with the US,
involves many steps, beginning with the submission of an application by the discharging agency or
facility and ending with the development and writing of discharge limits specific to the applicant facility.
The NPDES permit sets effluent limitations not only based on the industry, technology and pollutant
data but also aquatic life and recreation in the body of water in which the effluent is discharged. Once
the limits are set, the discharging facility is responsible for meeting the limits and must take steps to
ensure this.
The NPDES permit also allows for certain limits to be altered or relaxed if the treatment facility
presents a case for it to the permitting agency. For example, when it became clear that the Gardner
WWTF could not meet stringent limits on copper discharge, a higher limit was temporarily introduced
until a new limitation could be developed and put in place. Gardner’s NPDES permit also allows the city
to set limitations for users discharging into the city sewer system. Therefore, the city has developed
local limits set forth in their sewer ordinance. These users must meet the Gardner’s requirements or
face penalties enforced by the city. Regardless of the discharge from these individual facilities the
WWTF must still meet the required discharge limit at the plant.
In order to accomplish the goals set forth in this project, the team conducted numerous
laboratory tests to identify copper removal within the plant and to investigate possible design solutions
to provide for further copper removal. An extensive plant sampling routine was carried out to show
existing copper removal within the Gardner WWTF. Samples were also tested from other area
wastewater treatment facilities to show a copper removal trend. A filtration experiment was conducted
by the team to identify any relationship between solid particle size and copper concentration in the
wastewater. The hardness of the Otter River, which the Gardner WWTF discharges to, and the plant
effluent were determined. Hardness is a measure of the levels of metals in the water, and has an effect

COPPER REMOVAL AT THE GARDNER WWTF 5
on the determination of discharge limits for copper. A precipitation experiment was also carried out by
the team as a method for copper removal at the Gardner WWTF. In addition to the several laboratory
experiments conducted by the team, a survey was prepared and distributed to industrial users within
the city of Gardner in order to identify any users that may be discharging high levels of copper into the
city sewer system.
The results of the testing of copper levels within the Gardner WWTF were as expected. The
total copper level decreased linearly as it progressed through the plant’s treatment stages. The plant
influent had an average total copper value of 79.21 parts per billion (ppb), while the effluent had an
average total copper value of 23.15 ppb. The majority of the copper entering the WWTF is particulate
copper suspended in the water. Unlike the total copper levels, the dissolved copper levels did not
reduce linearly in the plant filtering process. The final clarifier had higher dissolved copper levels in 5 of
the 6 trials conducted. These higher values can be explained by the reactions taking place in the
activated sludge tanks. The results show that dissolved copper is less of a problem and harder to filter
than total copper, so total copper is the primary target for removal in the WWTF. The results from this
experiment can be found below in Figure 1.
Figure 1: Average total & dissolved copper removal in the Gardner WWTF
After conducting filter testing using 4 filter sizes ranging from 0.45 µm to 10 µm, the particle
sizes were deemed too small for efficient removal from Gardner’s WWTF. The next focus of testing was
to determine if the soluble copper could be precipitated into slurry, which could then be filtered. On a
small-scale model with an exaggerated amount of dissolved copper, the results were positive. However,
copper removal by precipitation is not as effective with lower concentrations, such as the copper level
entering the Gardner WWTF. With almost all possible solutions exhausted, the potential for applying for
a new permit from the EPA is another efficient way of obtaining copper values within their regulations.
0.00
10.00
20.00
30.00
40.00
50.00
60.00
70.00
80.00
90.00
0 2 4 6
Co
pp
er
(pp
b)
Treatment Stage
Average Copper Removal
Total Cu Average
Dissolved Cu Average
COPPER REMOVAL AT THE GARDNER WWTF 6
Applying for a new permit would require hardness tests of both upstream (Otter River) and the plant
effluent. The results of the hardness test concluded similar results to those obtained from the EPA.
After review of the results of the laboratory experiments the group conducted, it was decided to
provide several recommendations to the city of Gardner for further investigation of copper removal at
the WWTF. Possible plant upgrades include: the addition of a sand filtration unit, the addition of a
reverse osmosis or ion exchange system and the addition of a reactor for copper precipitation from the
wastewater. In addition to these solutions, land application can be explored as an alternative to
discharging into the Otter River. The results of the industrial survey should be reviewed and further
investigation should be carried out if the results indicate high concentrations of copper in one area of
the city. An option to remove any possible sewer flows high in copper concentration would be a sewer
system separation. In this option, the city’s industrial users would discharge to a separate system, and
the wastewater from that system could be further treated and discharged separately. This project
provides the city with several methods for copper removal in order to meet NPDES requirements and
protect wildlife in the Otter River.

COPPER REMOVAL AT THE GARDNER WWTF 7
Table of Contents Abstract ......................................................................................................................................................... 2
Acknowledgements ....................................................................................................................................... 3
Executive Summary ....................................................................................................................................... 4
List of Figures ................................................................................................................................................ 9
List of Tables ............................................................................................................................................... 11
Chapter 1: Introduction .............................................................................................................................. 12
Chapter 2: Background ............................................................................................................................... 13
2.1 History of Wastewater Treatment .................................................................................................... 13
2.2 Regulatory Environment ................................................................................................................... 17
2.3 US Environmental Protection Agency ............................................................................................... 18
2.4 National Pollutant Discharge Elimination System ............................................................................ 20
2.5 City of Gardner, Massachusetts ........................................................................................................ 21
2.6 Gardner Wastewater Treatment Facility .......................................................................................... 21
2.7 Management and Operation of WWTF ............................................................................................ 27
2.8.1 Operation and Maintenance of the Sewer System Defined by NPDES ..................................... 32
2.8.2 Sludge Conditions ...................................................................................................................... 32
2.8.3 Special Conditions ...................................................................................................................... 33
2.8.4 Industrial Pretreatment ............................................................................................................. 33
2.8.5 Industrial Pretreatment Case Study ........................................................................................... 34
2.9 Sources of Copper Contamination .................................................................................................... 35
2.10 Copper in Plant Effluent .................................................................................................................. 36
2.11 Case Study ....................................................................................................................................... 37
Chapter 3: Methodology ............................................................................................................................. 41
3.1 Plant Sampling Routine ..................................................................................................................... 41
3.2 Sampling at Other WWTFs ................................................................................................................ 48
3.3 Filtration Experiment ........................................................................................................................ 49
3.4 Chemical Precipitation ...................................................................................................................... 50
3.5 Hardness Testing ............................................................................................................................... 52
3.6 Industrial Survey ............................................................................................................................... 55
Chapter 4: Findings ..................................................................................................................................... 57

COPPER REMOVAL AT THE GARDNER WWTF 8
4.1 Plant Sampling Routine ..................................................................................................................... 57
4.2 Filtration Experiment ........................................................................................................................ 60
4.3 Chemical Precipitation ...................................................................................................................... 61
4.4 Hardness Testing ............................................................................................................................... 64
4.5 Regional WWTF Sampling ................................................................................................................. 65
Chapter 5: Recommendations .................................................................................................................... 68
5.1 Source Studies ................................................................................................................................... 68
5.2 Effluent Diversion .............................................................................................................................. 68
5.3 Chemical Precipitation ...................................................................................................................... 69
5.4 Operations & Management .............................................................................................................. 69
References .................................................................................................................................................. 71
Appendix A: Results of Laboratory Experiments ........................................................................................ 73
Appendix B: Gardner Business Survey ........................................................................................................ 75
Appendix C: Results from AA Testing .......................................................................................................... 82
COPPER REMOVAL AT THE GARDNER WWTF 9
List of Figures Figure 1: Average copper removal in the Gardner WWTF, showing total & dissolved copper levels .......... 5
Figure 2: Cross-Section of a Cesspool ......................................................................................................... 14
Figure 3: Privy Vault .................................................................................................................................... 15
Figure 4: Location of Gardner, Massachusetts ........................................................................................... 21
Figure 5: Aerial View of the Gardner WWTF ............................................................................................... 22
Figure 6: Gardner WWTF Layout ................................................................................................................ 23
Figure 7: Flow Diagram of Gardner WWTF ................................................................................................. 24
Figure 8: Gardner WWTF headworks building ............................................................................................ 24
Figure 9: Gardner WWTF primary clarifiers ................................................................................................ 25
Figure 10: Trickling filters at the Gardner WWTF ....................................................................................... 25
Figure 11: Gardner WWTF activated sludge ............................................................................................... 25
Figure 12: Chlorine contact tank for disinfection ....................................................................................... 26
Figure 13: Otter River just downstream of the Gardner WWTF ................................................................. 26
Figure 14: Gardner WWTF gravity thickener .............................................................................................. 26
Figure 15: Belt press at the Gardner WWTF ............................................................................................... 27
Figure 16: Flow diagram and sampling locations for in-plant metal study................................................. 38
Figure 17: Annual average influent & effluent total copper concentrations & copper removal efficiency40
Figure 18: Atomic-absorption spectroscopy machine at WPI .................................................................... 42
Figure 19: Location of influent sampling .................................................................................................... 43
Figure 20: Location of primary clarifier sampling ....................................................................................... 43
Figure 21: Location of intermediate clarifier sampling ............................................................................... 44
Figure 22: Location of final clarifier sampling ............................................................................................. 44
Figure 23: Location of effluent sampling .................................................................................................... 45
Figure 24: Grab sampling using long-handled dipper ................................................................................. 46
Figure 25: Picture of 250-mL sampling bottle ............................................................................................. 46
Figure 26: Filtration using 0.45 µm filter .................................................................................................... 47
Figure 27: Using hot plate to digest sample for testing .............................................................................. 48
Figure 28: Filtration experiment testing ..................................................................................................... 50
Figure 29: Dissolving copper tubing into solution ...................................................................................... 51
Figure 30: Setup of chemical precipitation experiment ............................................................................. 52
Figure 31: Using 5-gallon bucket to collect river samples .......................................................................... 54
Figure 32: Locations of sampling for hardness test .................................................................................... 54
Figure 33: Hardness test in progress .......................................................................................................... 55
Figure 34: Total copper effluent concentrations from 6 trials ................................................................... 57
Figure 35: Average results of plant sampling routine ................................................................................. 58
Figure 36: Copper concentrations from previous Maguire study ............................................................... 59
Figure 37: Total vs. dissolved copper levels over the 6 trials ..................................................................... 59
Figure 38: Average filtration results ........................................................................................................... 60
Figure 39: Results of precipitation of dissolved copper tubing .................................................................. 62
Figure 40: 10 ppm precipitation test after mixing ...................................................................................... 62
COPPER REMOVAL AT THE GARDNER WWTF 10
Figure 41: Results of precipitation experiment on plant water .................................................................. 63
Figure 42: Total copper removal from other WWTFs ................................................................................. 66
Figure 43: Dissolved copper removal from other WWTFs .......................................................................... 66
COPPER REMOVAL AT THE GARDNER WWTF 11
List of Tables Table 1: Gardner WWTF effluent discharge limitations ............................................................................. 30
Table 2: Gardner WWTF effluent discharge limitations continued ............................................................ 31
Table 3: Sludge frequency monitoring ........................................................................................................ 32
Table 4: Industrtial Pretreatment Costs ...................................................................................................... 35
Table 5: Copper concentrations from June 22, 1993 to September 21, 1994 ............................................ 38
Table 6: Individual treatment process median copper and nickel removal efficiencies ............................ 39
Table 7: Fate of total and dissolved copper from June 22, 1993 to September 21, 1994 .......................... 39
Table 8: Filtration experiment results ......................................................................................................... 60
Table 9: Results of hardness testing ........................................................................................................... 64
COPPER REMOVAL AT THE GARDNER WWTF 12
Chapter 1: Introduction Modern-day wastewater treatment facilities are required to eliminate and reduce many forms
of toxins and pollutants in order to ensure for the environmental safety of American waterways. Until
the twentieth century, advanced wastewater treatment and collection systems did not exist. With the
discovery of waterborne pathogens such as cholera, and with advancement in treatment technologies,
wastewater collection and treatment became more commonplace. Throughout the 1900s, the
technology and methods of wastewater treatment continued advancement. Governments, media and
the general population also became more aware and concerned with issues affecting the health of the
environment. This led to regulation of wastewater treatment systems and specific legislation dealing
with discharge limits.
Today in the US, the Environmental Protection Agency, through its NPDES permitting process,
regulates all wastewater treatment systems, both industrial and municipal. The EPA has developed
processes to set limits on a wide range of pollutants and nutrients that may be harmful to the
environment in wastewater. Individual facilities often have different limits from one another,
depending on the composition of the wastewater flow and the discharge waters. For example, plants
discharging to salt water have stricter limits on nitrogen and those discharging to fresh water have more
stringent limits on phosphorous.
One of the several metals regulated for discharge by the EPA at almost every wastewater
treatment facility is copper. Copper is used in a variety of products and applications, and can be
especially prevalent in water and wastewater systems. Copper is used for algae control in reservoirs, is
also a common material in household plumbing, and is also used as a root killer in underground pipes.
Due to the dramatic effect that high levels of copper can have on aquatic life, the EPA regularly sets
strict discharge limitations for copper.
The city of Gardner, Massachusetts has not consistently met its permitted copper discharge limit
in recent years. The EPA has issued administrative orders requiring the city to take action in ensuring its
treatment facility can consistently meets these limitations. The city has undertaken steps already to
reduce the copper in its wastewater flow. A new water treatment facility was recently built, an
aggressive inflow and infiltration program was carried out, and a copper study was completed at the
treatment plant. The city’s latest effort to reduce copper concentrations includes this project.
This project aims to demonstrate existing copper removal within the Gardner Wastewater
Treatment Facility, investigate possible sources of copper contamination within the city’s sewer system,
study methods of copper removal at the treatment facility, and conduct a management review of the
treatment plant’s operations. Numerous laboratory experiments were performed to achieve these
goals. A survey was distributed to city industries, and a management analysis of the plant and its
proposed upgrades was conducted. The findings from the research performed were then analyzed by
the group, and recommendations were made for the city to conduct further research.

COPPER REMOVAL AT THE GARDNER WWTF 13
Chapter 2: Background
2.1 History of Wastewater Treatment Wastewater treatment and wastewater collection have evolved to a very standardized and
technologically advanced industry. For hundreds of years no treatment or sewage systems existed for
wastewater, and said wastewater was dumped into streets and left to flow wherever the road took it. As
one can imagine, this led to serious disease and terribly unsanitary and dangerous health conditions that
caused deadly epidemics. As communities grew and more people came to live near one another, the
need for better water quality was necessary. Without clean water, humans cannot be expected to
survive very long. The need to supply safe water, remove wastewater, and to protect public health were
main concerns that grew more important throughout generations. Therefore, understanding the causes
of disease outbreaks such as cholera and dysentery led to the development of infrastructures and
processes that could be implemented to prevent these health problems. Much research and
advancement in the understanding of bacteria and waterborne diseases led to great strides and efforts
in public sanitation. Once it was discovered that the lack of wastewater collection and treatment was
the root cause to diseases such as typhoid fever, cholera, and dysentery, wastewater treatment and
collection was taken much more seriously and steps toward disinfection progressed.
As long as humans have walked the earth, they have created waste. The issue of pure water
supplies and wastewater did not become an issue until people began settling down and building cities.
The earliest records of wastewater disposal go back approximately 5,000 years, to the city of Nippur, in
Sumeria. This early sewerage system carried away wastes from the city’s homes and palaces. Over
3,000 years later in the year A.D. 98, Sextus Julius Frontinus, the water commissioner of Rome noted, “I
desire that nobody shall conduct away any excess water without having received my permission or that
of my representatives.” Frontinus was speaking of Rome’s sewer system, which was designed primarily
to handle storm runoff. He did not want Roman people discharging into his sewer because he
recognized the need for cleaning and maintenance of the system. It is interesting to note, that although
Nippur and Rome did in fact have sewers, there are only few known instances of direct connections
being made to homes and palaces. The vast majority of homes did not have direct access to either city’s
sewer system.1
From the days of ancient Rome until the middle of the nineteenth century, no prominent
progress was made in sewage systems. The city of Hamburg, Germany experienced a devastating fire
that destroyed the old section of the city in 1842. City officials made the decision to rebuild the city to
include modern ideas pertaining to sanitation. An English engineer, W. Lindley, was hired to design a
collection system that incorporated many ideas still in use today. Unfortunately, it would take time for
many to recognize that Lindley was ahead of his time and many of his ideas were not put into practice
for quite a while.2
1 Viessman, Jr., Hammer, Perez & Chadik, p. 2
2 Ibid, p. 2
COPPER REMOVAL AT THE GARDNER WWTF 14
During the 1850’s the first comprehensive sewage system was designed and implemented in
Chicago by an engineer named Ellis Chesborough, who was also responsible for the design of Boston’s
water distribution system, in response to Chicago’s public health crisis. Chesborough’s system relied on
gravity flow; therefore he “raised” Chicago by building the sewers above the existing streets and then
covered them. By building tunnels beneath the lake into a new intake crib, he brought clean safe water
to the city, allowing for continued growth.3
Although no thought had really been given to wastewater treatment, water disinfection had
been studied and practiced for hundreds of years. Water disinfection can be dated back to 1500 B.C.
when Egyptians first discovered the principle of coagulation and how it could be applied to particle
settlement. Although at a very elementary level, the Egyptians sought to filter their water with
coagulation and bag filters. However, rather than treating for pathogens, as pathogens had not been
discovered, the water was being treated to taste better. In the 1700’s domestic applications of water
disinfection were applied. It had been known for a better part of history that boiling water would
disinfect the water to a certain degree; however this was the first point in which water filters, made of
wool sponge and charcoal, were used on a domestic level. In 1804 the first municipal water treatment
plant was constructed by Robert Thom in Scotland. This treatment plant was based on slow sand
filtration. At this point it time it became suggested that all people should have access to safe drinking
water, however this concept would take much longer to be applied.
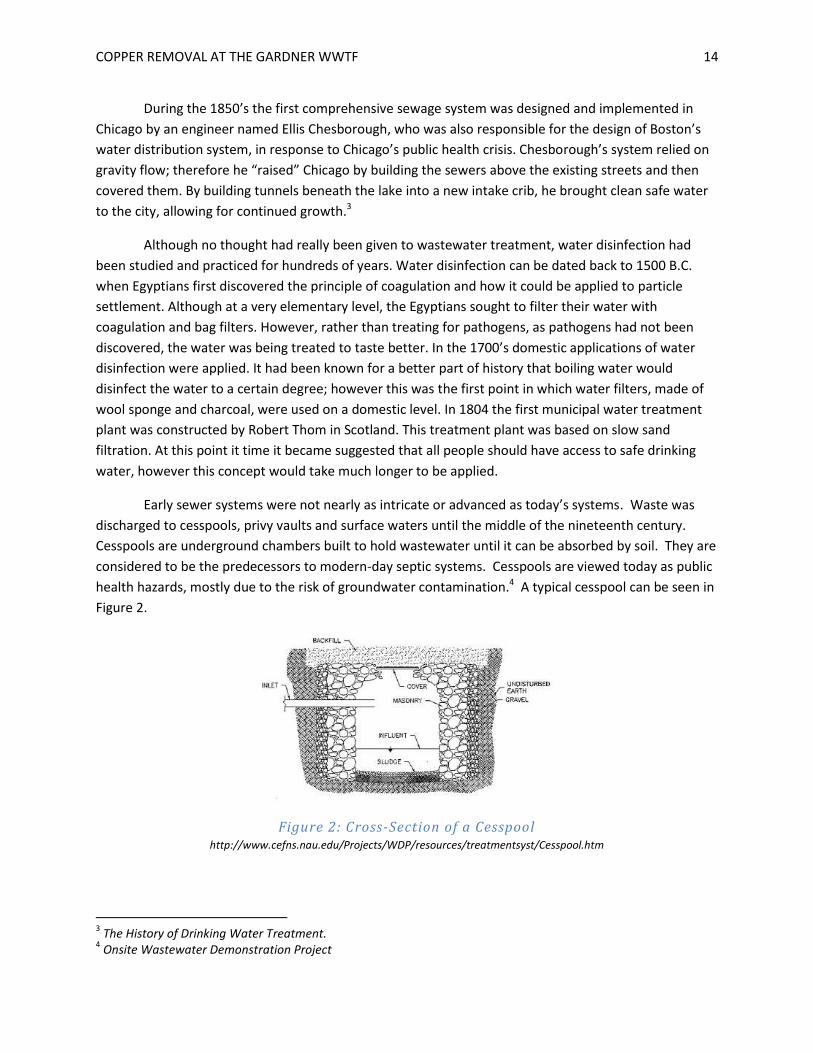
Early sewer systems were not nearly as intricate or advanced as today’s systems. Waste was
discharged to cesspools, privy vaults and surface waters until the middle of the nineteenth century.
Cesspools are underground chambers built to hold wastewater until it can be absorbed by soil. They are
considered to be the predecessors to modern-day septic systems. Cesspools are viewed today as public
health hazards, mostly due to the risk of groundwater contamination.4 A typical cesspool can be seen in
Figure 2.
Figure 2: Cross-Section of a Cesspool http://www.cefns.nau.edu/Projects/WDP/resources/treatmentsyst/Cesspool.htm
3 The History of Drinking Water Treatment.
4 Onsite Wastewater Demonstration Project

COPPER REMOVAL AT THE GARDNER WWTF 15
A privy, commonly referred to as an outhouse, usually has a vault located directly below for storage or
leeching of waste. Like cesspools, many communities view them as public health hazards, and they are
generally no longer in use.5 Figure 3 shows a common privy vault.
Figure 3: Privy Vault http://www.publichealthgreybruce.on.ca/images/Sewage/PitPrivy.gif
It was not until 1847 that serious thought was given to further developments in sewerage and
wastewater treatment. A cholera outbreak began in India and spread westward to London. A royal
commission was appointed and found that one of the major problems concerning sewage in London was
the lack of a central authority to handle it. Thus, in 1848 British Parliament created the Metropolitan
Commission of Sewers. Cholera hit London that summer, killing 14,000 people within a year.6 Dr. John
Snow, an anesthesiologist and innovator in the field of epidemiology, concluded that cholera was spread
through contaminated water, but neither local authorities nor medical professionals gave his theory
much credence. During the cholera outbreak in 1854-55, Snow traced the disease to a pump on Broad
Street in Soho, which he believed to be the source of the cholera.7 In fear that human wastes caused
the cholera outbreak, residents of London dumped their waste into the city’s storm sewers, where it
was carried to the nearest body of water. As this practice became more common, the drainage ditches
were eventually covered and converted to sewers to contain the smell. This led to negative
environmental consequences. The large amount of waste being discharged into relatively small streams
overwhelmed the bodies of water. The smaller and eventually larger bodies of water began to ferment,
thus creating a health problem, especially during dry and hot weather.8
The United States had followed on the coattails of Europe as it developed its sewer systems.
The US experienced many disease outbreaks during the nineteenth century. Cholera struck in 1832,
5 The Sanitary Vault Privy: A Planning Guide and Minimum Requirements For the Construction of Vault Privies.
(1986). 6 Viessman, Jr. et.al, p. 3
7 Broad Street Pump Outbreak
8 Viessman, Jr. et.al, p. 4

COPPER REMOVAL AT THE GARDNER WWTF 16
1849, and 1866, and typhoid in 1848. These outbreaks caused officials to see the need to construct
sewer systems in US cities. However, such systems were slow to develop. US cities in the late
nineteenth century were not as heavily populated as their European counterparts. By the end of the
nineteenth century, many cities saw the need for separate storm and sanitary sewers, and the idea of
wastewater treatment became more realistic. As the US population grew, increasing more than fourfold
between 1850 and 1920, the population base shifted from rural areas to urban areas. During the same
period, the US population in urban areas increased from 12.5 percent to 51 percent. The rapid growth
of American cities greatly strained existing sewer systems, which were never designed to handle such
high flows produced by so many people. Most sewers in the US at the time were combined systems,
which, as they had in England, only transferred the health concerns from the inner cities to the nearest
water bodies. At the start of the twentieth century, wastewater treatment technologies were still
crude. The four most common types of wastewater treatment were dilution, irrigation of farmlands,
filtration, and chemical precipitation. All of these technologies were usually only effective at treating
smaller, wastewater-only flows, not the large flows from combined sewers found in most US cities. As
more cities began discharging into rivers and lakes, the need for wastewater treatment became even
more apparent.9
As strong as the argument for wastewater treatment was in the early twentieth century, there
were more arguments against treating wastewater. Opponents to wastewater treatment questioned its
need if drinking water treatment systems were in place, and claimed that the pollution problem could
be solved by proper planning. Additionally, the economic burden of building two treatment works often
caused municipalities to side on the opposition to wastewater treatment. This stance can clearly be
seen in a published statement in a 1903 issue of Engineering Record, “…it is often more equitable to all
concerned for an upper riparian city to discharge its sewage into a stream and a lower riparian city to
filter the water of the same stream for a domestic supply, than for the former city to be forced to put in
wastewater treatment works.” Those in opposition to wastewater treatment were successful in their
arguments during the early 1900’s. In 1905, more than 95 percent of people in urban areas discharged
untreated wastewater into waterways. By 1924, still more than 88 percent of the urban population in
US cities over 100,000 discharged their waste directly into waterways.10
Things began to change for wastewater treatment proponents during the early 1900’s. As the
Progressive Movement swept through the US, more people began to focus on reducing pollution and
preserving the natural state of waterways. Also, new laws were passed on the local and state levels
advocating the protection of water quality. As these new laws were challenged in state courts, many
cases were ruled in favor of downstream municipalities if sewage discharge from upstream
municipalities created nuisance conditions. Also, many business groups, media outlets, and public
health groups expressed favor of wastewater treatment. As studies were published that showed the
relationship between wastewater discharge and disease transmission and as technology improved,
more time was spent on finding cost-effective ways to treat wastewater. The turning point in the
9 Burian, Nix, Pitt & Durans, 2000
10 Ibid.

COPPER REMOVAL AT THE GARDNER WWTF 17
development of wastewater treatment technology in the early 1900’s was activated sludge. Activated
sludge was demonstrated to be a cost-effective way to treat large quantities of wastewater.11
Along with improving technologies, legislation played an important role in the eventual
widespread construction of wastewater treatment works. The first water pollution legislation came in
1886, but it only dealt with dumping obstructions to safe navigation in New York Harbor. Congress then
passed the River and Harbors Act in 1899, which outlawed dumping solid wastes into navigable waters.
In 1912 the Public Health Service Act was passed, which included a section on waterborne diseases. In
1924, the Oil Pollution Act was passed, which prohibited oil discharges from ships into coastal waters. A
key component of this act gave enforcement power to the federal government if local government
failed to enforce the law. Another key component of this act was a provision for matching grants for
waste-treatment facilities. In 1966, regulations were further strengthened by the passing of the Clean
Rivers Restoration Act, which considered entire river basins in pollution control rather than localities. It
also provided for a large increase in funding for the construction of wastewater treatment facilities. By
1970, the government recognized the need for more federal investment into the construction of
wastewater treatment facilities. President Nixon proposed a four-year, $10 billion program of
investment by federal, state and local governments in wastewater treatment facilities. In 1970 the
National Environmental Policy Act (NEPA) was passed and the Environmental Protection Agency (EPA)
was established. The EPA is the primary federal regulatory authority concerning all environmental
issues.
The Clean Water Act was passed in 1987, which created the National Pollution Discharge
Elimination System (NPDES). Through NPDES, the EPA has been able to place regulations on all
discharges from wastewater treatment plants. Because the EPA places limits on what can be
discharged, many plants have been forced to upgrade and expand their facilities to avoid heavy fines
from the federal government.12
2.2 Regulatory Environment The EPA is charged with protecting human health and the environment by writing and enforcing
regulations based on laws passed by Congress.13 The EPA conducts environmental assessments,
research and education. It maintains and enforces national standards through various environmental
laws in consultation with state and local governments. For the most part, the EPA enforces these laws
through fines, sanctions and other measures. The city of Gardner lies in Region 1 of the EPA along with
the rest of New England.14 Since 1970 the EPA has submitted and Congress has passed seven different
acts all having to do with water and water quality. The EPA’s main goal in regards to water is to ensure
safe drinking water for all the public and has therefore set standards for more than 160,000 public water
systems in the United States.15
11
Burian, Nix, Pitt & Durans, 2000 12
Viessman, Jr. et.al, p. 8 13
Our Mission and What We Do. 14
Public Access – When and how was the EPA Created? 15
Safe Drinking Water Act PL 93-523, 1974
COPPER REMOVAL AT THE GARDNER WWTF 18
NPDES is a program that seeks to protect and restore the quality of rivers, lakes, and coastal
waters. Forty-four states and one territory are authorized to implement the NPDES program and its
permits. The mission of the NPDES program is to shape national program direction by identifying issues
of national or regional concern and developing strategies to address these issues. The NPDES program
produces policies and regulations to address problems that affect the nation’s waters. It develops
technical and administrative tools to implement permits and it records and manages information on
permit issuance, permit quality and point source pollution abatement. The EPA’s water program seeks
to support watershed planning, permit and program quality, consistency and innovation, standards to
permits, modernize the permit management system, measuring environmental results, and finally,
better communication and participation of stakeholders (states and territories, citizens, congress, etc.).16
The actual NPDES permitting process involves a multitude of steps. First, the operator of a
facility must submit an application to a permit writer. The permit writer then reviews the application for
completeness and accuracy and decides whether to continue with the permit or not. Once the decision
is made to draft a permit, the permit writer uses application data and the fact sheet or statement of
basis to develop the permit. The permit writer derives technology-based effluent limits. Following this
step the permit writer derives effluent limits that are protective of state water quality standards such as
water quality-based effluent limits. These two limits, technology-based and state water quality
standards, are compared and the more stringent of the limits are applied to the permits. A permit may
have some limits that are technology-based and other limits that are water quality based. Once the
effluent limits are developed, the permit writer develops appropriate monitoring and reporting
conditions, facility-specific special conditions and includes standard conditions that are consistent
throughout all permits. After, the draft permit is completed; the permitting authority provides an
opportunity for public participation in the process via public notice. The public notice announces the
permit and anyone who is interested can submit comments regarding the draft permit. The permitting
authority will then develop a final permit and issue it to the respective facility.17
2.3 US Environmental Protection Agency In the 20th century, many strides toward environmental protection and conservation were made
in the United States. On December 2, 1970 the EPA was established as an independent agency whose
critical obligation was to protect and enhance the environment. The EPA’s critical obligation was not
only concerned with the deteriorating environment but also with establishing environmental standards,
research, and the enforcement of set standards to protect against air and water pollution, solid waste
disposal, radiation and the ill environmental effects of pesticides.18 Currently, the EPA employs
approximately 17,000 people and engages in many more employees on a contractual basis. Offices for
16
Protecting the Nation’s Waters Through Effective NPDES Permits, EPA, 2001-present, http://www.epa.gov/npdes/pubs/strategicplan.pdf 17
Water Permitting 101, Office of Wastewater management, EPA, http://www.epa.gov/npdes/pubs/101pape.pdf 18
http://www.epa.gov/aboutepa/history/publications/print/origins.html
COPPER REMOVAL AT THE GARDNER WWTF 19
the EPA include the agency headquarters in Washington D.C. as well as regional offices in each of the
agency’s 10 regions throughout the U.S.19
The environmental status of the US had became grave with examples such as the Cuyahoga
River fires and a rupture of one of Union Oil’s platforms off the Pacific coast near Santa Barbara, CA. In
an effort to fight and win World War II, there was a major increase in industrial production which
resulted in extremely dangerous amounts of industrial pollution in both air and water bodies. The
Cuyahoga River was described in Time Magazine as the river that “oozes rather than flows” and in which
a person “does not drown but decays.” In 1969 the most detrimental of Cuyahoga River fires occurred
resulting in over $1 million in damage to boats and riverfront office buildings that captured the attention
of the nation. Industries were discharging anything and everything from their facilities into the river,
which resulted in its described state and zero marine life. On the west coast, 100,000 barrels of oil
flowed out in the Union Oil spill into the ocean, polluting a 60-mile stretch of coastline. This severely
disrupted the natural balance of the Channel Islands offshore and did serious damage to fishing and
other activities which were a vital part of the local economy. Led by Senator Gaylord Nelson of
Wisconsin, who had been an avid spokesperson for environmental and water quality awareness for
many years, the National Environmental Policy Act of 1969 was introduced. Fueled by the Santa Barbara
spill and the status of the Cuyahoga River, NEPA was passed by the Senate.20
Prior to the establishment of the Environmental Protection Agency, President Nixon set up the
Environmental Quality Council, whose main objective was to address the public’s concerns on issues of
the Santa Barbara spill and Cuyahoga River. Although during his election campaign, Nixon focused more
on foreign policy and increase in crime in the US rather than environmental issues and policy, he was the
first president to make concrete strides toward developing water quality standards and fight water
pollution in the US. On July 9, 1970, Nixon decided to support the recommendations made by chairmen
of the Council on Environmental Quality (previously known as the Environmental Quality Council) Russell
E. Train and John Ehrlichman. Ehrlichman was the head of a White House committee devoted to
examining current environmental policy, and sent the Reorganization Plan No. 3 to Congress. This plan’s
goal was to consolidate different departments, such as the Interior and Agricultural, Health, Education
and Welfare and Transportation Departments into one government agency. Finally, as a result of the
growth in national awareness of water pollution in the US, the Environmental Protection Agency was
established. Soon after, William D. Ruckelshaus, Assistant Attorney General at the time, was nominated
by the President as the EPA’s first Administrator and was quickly confirmed by the Senate. The EPA then
began operations on December 2, 1970.21
One of the first acts of the newly established EPA was to establish standards for discharge of
pollutants into surface waters. In response to the Cuyahoga River fires, the Clean Water Act (CWA),
which became effective on October 18, 1972, established goals of eliminating releases of high amounts
of toxic substances into water by 1985. The main focus of the CWA was surface waters such as lakes and
19
http://www.epa.gov/aboutepa/index.html 20
http://domestic.nixonfoundation.org/2010/06/14/rn-and-the-formation-of-the-epa-3/ 21
http://domestic.nixonfoundation.org/2010/06/14/rn-and-the-formation-of-the-epa-3/
COPPER REMOVAL AT THE GARDNER WWTF 20
rivers rather than groundwater. More specifically it was established to affect “all waters with a
significant nexus to navigable waters.”22 The CWA set regulations for industrial facilities, municipal
governments and government facilities as well as some agricultural facilities. Basically, the CWA sought
to abandon the previous approach that state and local governments were primarily responsible for
ensuring water quality and moved to a national standard. The CWA made it illegal to discharge
pollutants unless the discharger first obtained a permit from the government. It was determined that
virtually nothing had been achieved by relying on state action to reduce water pollution in the previous
years and as a result Congress established the CWA and sought to better relations between the federal
government and states to achieve real water quality improvements.23
2.4 National Pollutant Discharge Elimination System The Clean Water Act established the National Pollutant Discharge Elimination System Program
or NPDES. NPDES main objective was to control “point source” or direct discharge from pipes and
sewers. The CWA made it unlawful for any discharge into the nation’s waters without first being
authorized by a permit obtained for the EPA or an authorized state/tribe. Under section 402 of the CWA,
NPDES was created effecting more than 65,000 industrial and municipal dischargers. A NPDES permit
contains industry-specific, technology-based and water quality based limits and establishes pollutant
monitoring and reporting requirements. A facility seeking a NPDES permit must provide quantitative
analytical data that identifies the different types of pollutants present in the facilities effluent discharge.
Dependent on the data, available technology, and industry, the permit will set conditions and limitations
for the effluent that the facility seeks to discharge. Not only does a NPDES permit set limitations based
on the industry, technology and pollutant data, it also considers aquatic life and recreation, as well as
specific federal and state/tribe water quality standards for surface waters. Unlike technology driven
standards, limitations based on aquatic life and recreation rarely take into account the feasibility or
costs of said limitations.
Although standards between facilities and states may be similar, each is specific to that facility
and the circumstances of the effluent and surface water quality and use. The NPDES permit requires
industries to attain the best practicable control technology for each pollutant that is discharged. NPDES
permits are issued every 5 years and must be renewed in order to maintain continued discharge. Once a
permit is established for a facility, that facility is required to maintain records of day to day activities as
well as effluent monitoring. The EPA can enforce the Clean Water Act through the NPDES permit and
can issue compliance orders and civil suits against any person in violation of their NPDES permit.
Penalties for noncompliance can range anywhere from $25,000 a day to as much as $250,000 a day,
and/or can result in the incarceration of violators for a maximum of 15 years for the “knowing
endangerment” of public health.24
22
http://www.epa.gov/oecaagct/lcwa.html 23
http://www.epa.gov/oecaagct/lcwa.html 24
Ibid.

COPPER REMOVAL AT THE GARDNER WWTF 21
2.5 City of Gardner, Massachusetts Gardner, established in 1785, is a small city located about 60 miles northwest of Boston and
about 25 miles northwest of Worcester, MA. Its location is shown below in Figure 4. It is named after
Colonel Thomas Gardner who was fatally wounded in the battle of Bunker Hill. The majority of
Gardner’s economy is centered on the large amount of furniture manufacturers in the city, so much so
that it is sometimes referred to as the “Furniture Capital of New England”. The city is composed of 23
square miles and is home to about twenty one thousand residents.25 Gardner’s public water supply
draws the majority of its water from surface water supplies that are comprised of Cowee Pond, Pearly
Brook Reservoir, and Crystal Lake. The Snake Pond well is used only during summer months. Only a
small portion of the city’s residents get water from private wells.26
Figure 4: Location of Gardner, Massachusetts http://www.bestplaces.net/city/massachusetts/gardner
2.6 Gardner Wastewater Treatment Facility The residents of Gardner are served by the city’s sewer system. The system is comprised of over
30 miles of sewer mains, and the wastewater ultimately makes its way to Gardner’s wastewater
treatment facility. The facility is located at 52 Plant Road in East Templeton, Massachusetts. The plant
serves 20,000 customers from Gardner, along with approximately 1,680 people in the town of
Ashburnham and about 150 people from East Templeton. It was built in 1946, and major upgrades were
finished in both 1963 and 1988. The Gardner Wastewater Treatment Facility (WWTF) also receives flow
from 43 industrial users, leachate from the sludge landfill, and septage from recreational vehicles. The
plant, which can be seen below in Figure 5, is a publicly owned treatment works (POTW) owned by the
city of Gardner, but has been operated by a private contractor since 1998. The current operator of the
Gardner WWTF is United Water.27 United Water has been in operation since 1869, and is currently one
of the United States’ largest water & wastewater utilities. It serves over 200 communities in 22 states
25
About the City. 26
Annual Water Report. (2011). 27
Maguire Group, NPDES Permit Compliance Report, 2010, p. 10
COPPER REMOVAL AT THE GARDNER WWTF 22
and employs 2,300 people in the US.28 In addition to the day-to-day operation and maintenance of the
plant, the firm also operates and maintains Gardner’s water treatment and distribution systems as well
as the city’s sewer system.
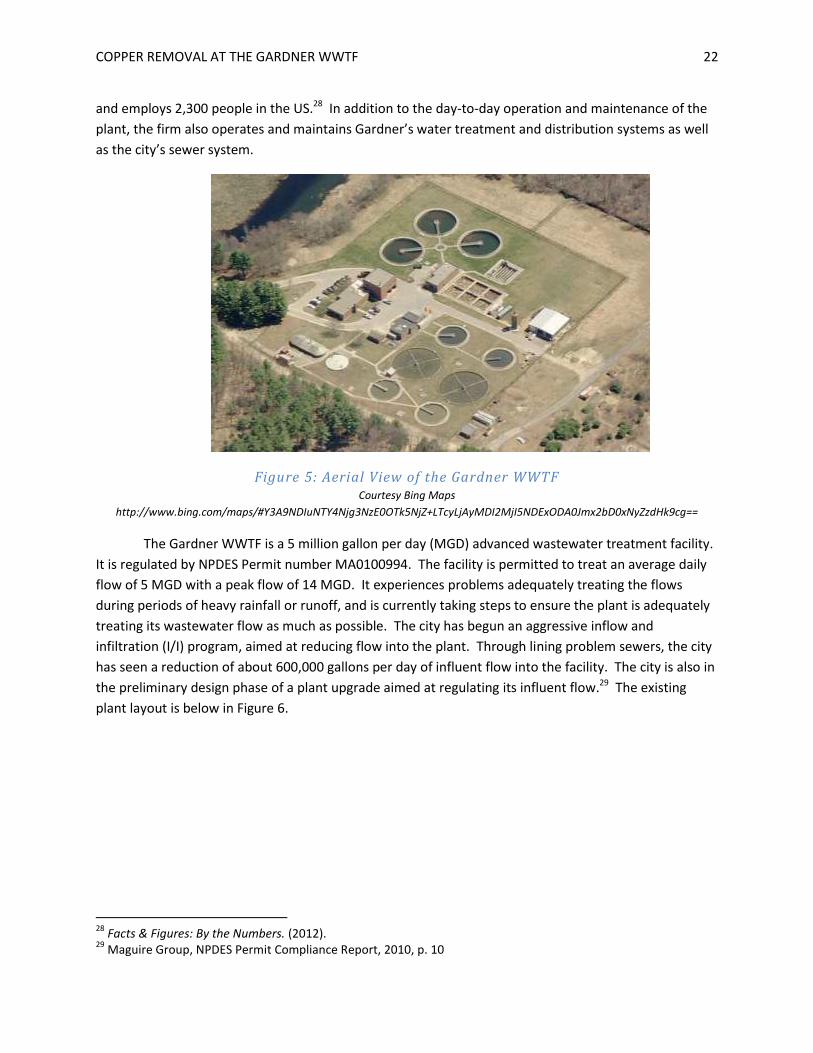
Figure 5: Aerial View of the Gardner WWTF Courtesy Bing Maps
http://www.bing.com/maps/#Y3A9NDIuNTY4Njg3NzE0OTk5NjZ+LTcyLjAyMDI2MjI5NDExODA0Jmx2bD0xNyZzdHk9cg==
The Gardner WWTF is a 5 million gallon per day (MGD) advanced wastewater treatment facility.
It is regulated by NPDES Permit number MA0100994. The facility is permitted to treat an average daily
flow of 5 MGD with a peak flow of 14 MGD. It experiences problems adequately treating the flows
during periods of heavy rainfall or runoff, and is currently taking steps to ensure the plant is adequately
treating its wastewater flow as much as possible. The city has begun an aggressive inflow and
infiltration (I/I) program, aimed at reducing flow into the plant. Through lining problem sewers, the city
has seen a reduction of about 600,000 gallons per day of influent flow into the facility. The city is also in
the preliminary design phase of a plant upgrade aimed at regulating its influent flow.29 The existing
plant layout is below in Figure 6.
28
Facts & Figures: By the Numbers. (2012). 29
Maguire Group, NPDES Permit Compliance Report, 2010, p. 10

COPPER REMOVAL AT THE GARDNER WWTF 23
Figure 6: Gardner WWTF Layout
There are several stages of treatment currently working at the Gardner plant. Figure 7 below
shows the flow diagram for the Gardner WWTF. The plant receives flow at the enclosed headworks,
which consists of a mechanical bar screen, aerated grit chamber and comminutor. The plant headworks
can be seen below in Figure 8. From there, flow goes to one of two primary clarifiers for solids removal,
which can be seen in Figure 9. Secondary treatment consists of two trickling filters and two
intermediate clarifiers, seen in Figure 10. Further treatment is accomplished through an activated
sludge system, which can be seen below in Figure 11, and three final clarifiers. From there, the flow
moves to chlorine contact tanks for chlorination and dechlorination, seen in Figure 12. The final effluent
is discharged through outfall 0001 to the Otter River, which can be seen below in Figure 13. The
discharge is located approximately 9.7 miles upstream of the confluence of the Otter River with the
Millers River, in the Millers River Basin. The effluent eventually makes its way to the Connecticut River
and finally to the Long Island Sound. Several chemicals are used in the process. Lime is added for pH
control, ferric chloride for phosphorous removal, sodium hypochlorate is used for disinfection and
sodium bisulphate is added for dechlorination. The plant’s sludge treatment consists of gravity
thickeners seen in Figure 14, a sludge holding tank and two belt filter presses for dewatering, which can

COPPER REMOVAL AT THE GARDNER WWTF 24
be seen below in Figure 15. The sludge is then trucked to the lined, city-owned, sludge-only landfill for
mixing, spreading and covering.30 Several chemicals are used to treat wastewater at the Gardner plant.
The plant also has an onsite emergency generator to ensure it can remain operational in the event of a
power failure. The influent flow is measured at the headworks and the effluent flow is measured just
before the chlorine contact tanks.31
Figure 7: Flow Diagram of Gardner WWTF
Figure 8: Gardner WWTF headworks building
30
United Water in Gardner, Massachusetts. (2011). 31
Maguire Group, NPDES Permit Compliance Report, 2010, p. 10

COPPER REMOVAL AT THE GARDNER WWTF 25
Figure 9: Gardner WWTF primary clarifiers
Figure 10: Trickling filters at the Gardner WWTF
Figure 11: Gardner WWTF activated sludge

COPPER REMOVAL AT THE GARDNER WWTF 26
Figure 12: Chlorine contact tank for disinfection
Figure 13: Otter River just downstream of the Gardner WWTF
Figure 14: Gardner WWTF gravity thickener
COPPER REMOVAL AT THE GARDNER WWTF 27
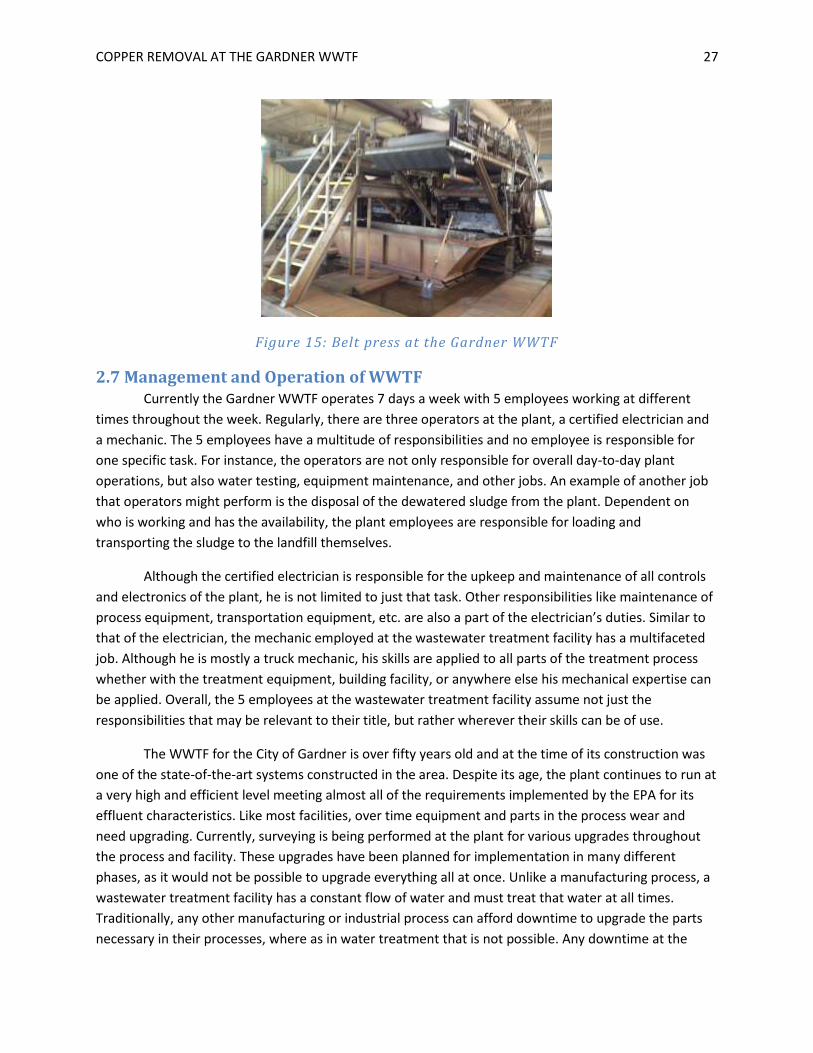
Figure 15: Belt press at the Gardner WWTF
2.7 Management and Operation of WWTF Currently the Gardner WWTF operates 7 days a week with 5 employees working at different
times throughout the week. Regularly, there are three operators at the plant, a certified electrician and
a mechanic. The 5 employees have a multitude of responsibilities and no employee is responsible for
one specific task. For instance, the operators are not only responsible for overall day-to-day plant
operations, but also water testing, equipment maintenance, and other jobs. An example of another job
that operators might perform is the disposal of the dewatered sludge from the plant. Dependent on
who is working and has the availability, the plant employees are responsible for loading and
transporting the sludge to the landfill themselves.
Although the certified electrician is responsible for the upkeep and maintenance of all controls
and electronics of the plant, he is not limited to just that task. Other responsibilities like maintenance of
process equipment, transportation equipment, etc. are also a part of the electrician’s duties. Similar to
that of the electrician, the mechanic employed at the wastewater treatment facility has a multifaceted
job. Although he is mostly a truck mechanic, his skills are applied to all parts of the treatment process
whether with the treatment equipment, building facility, or anywhere else his mechanical expertise can
be applied. Overall, the 5 employees at the wastewater treatment facility assume not just the
responsibilities that may be relevant to their title, but rather wherever their skills can be of use.
The WWTF for the City of Gardner is over fifty years old and at the time of its construction was
one of the state-of-the-art systems constructed in the area. Despite its age, the plant continues to run at
a very high and efficient level meeting almost all of the requirements implemented by the EPA for its
effluent characteristics. Like most facilities, over time equipment and parts in the process wear and
need upgrading. Currently, surveying is being performed at the plant for various upgrades throughout
the process and facility. These upgrades have been planned for implementation in many different
phases, as it would not be possible to upgrade everything all at once. Unlike a manufacturing process, a
wastewater treatment facility has a constant flow of water and must treat that water at all times.
Traditionally, any other manufacturing or industrial process can afford downtime to upgrade the parts
necessary in their processes, where as in water treatment that is not possible. Any downtime at the

COPPER REMOVAL AT THE GARDNER WWTF 28
WWTF would result in untreated water being discharged into the receiving water body, which is in direct
violation of EPA regulations. Therefore, wastewater treatment facilities must find ways to upgrade their
facilities while still treating the water and achieving appropriate effluent characteristics.
A WWTF has a constant flow that must always be treated as the flow progresses throughout the
process. The WWTF in Gardner has been doing this for quite some time now under the same conditions.
Although the facility was state of the art at the time of its construction in 1946 that does not mean it is
state of the art today. In actuality, the WWTF in Gardner is seriously outdated compared to other local
facilities. Despite the age of the facility however, the plant continues to treat wastewater and meet its
effluent limitations for the most part. As mentioned before, the WWTF has had trouble meeting the
appropriate limits for copper and phosphorus in the effluent in the past. Our project was to determine if
there was any way of treating the copper and phosphorus at the facility rather than doing another
remote study focused on the source of high copper. If it was determined that something could be done
to treat the copper at the facility, the new treatment and treatment equipment would be included in the
already planned phases of upgrades. However, it was determined that there was no real way of treating
for copper at the facility so no new plans for upgrades have been established and the city of Gardner will
most likely have to perform another study to determine the source of copper and how to deal with it.
Despite the lack of conclusiveness of our research, upgrades to the facility are still relevant and
will be established in the near future. Although these upgrades do not include any specific treatment for
copper they do include upgrades to all parts of the process that will help make the current process a
more efficient and complete one. The facility is doing its job currently, but with the upgrades the facility
will do its job better, with a larger quantity of potential treated water and a more efficient way of
treating that wastewater.
The first and most apparent upgrade for the WWTF is to its headworks. The headworks is at the
head of the plant. At the headworks five primary functions are performed: sampling, flow measurement,
chemical addition, screening, and grit removal. Most solid material is removed from the wastewater
through bar screens, which act as large solid filters. The bar screens filter large objects such as cans and
pieces of lumber out of the flow stream. The purpose of the headworks is to condition the wastewater
for further treatment such as biological treatment downstream in the plant. Another solid material
removed in the headworks is a substance called grit. Grit is defined as inorganic matter such as sand and
gravel. The grit is inorganic and therefore does not need to be biologically treated and can simply be
filtered out. In Gardner, the grit is separated from the wastewater in a grit machine. The grit machine
separates, dewaters and collects the sand and gravel, which is then disposed of at the local landfill. As
part of the upgrade to the headworks, an upgrade to the grit machine will also occur.
Upgrades to the Gardner WWTF also include the construction of equalization basins. The object
of an equalization basin is to maintain a constant flow in the treatment plant especially during excess
flow conditions. The equalization basin is meant to eliminate large and rapid changes in flow to the
downstream treatment processes during periods of high influent flow. Gardner is considering four
250,000-gallon equalization basins to divert flow in the process if there is ever the need. Another
opportunity that equalization basins present is the ability to separate nutrients like nitrogen and
COPPER REMOVAL AT THE GARDNER WWTF 29
phosphorus from the wastewater. The possibility of constructing an equalization basin with no oxygen is
an example to treat for nitrogen before primary treatment takes place. The headworks, grit machine,
and equalization basin are all part of pretreatment upgrades to the WWTF that will help downstream in
the process and make it much more efficient and easier to treat the wastewater effectively.
Currently, the sludge holding tanks at the WWTF serve no other purpose other than containing
and holding the sludge. Upgrades to the sludge holding tanks are another example of increasing the
efficiency of the process and taking pressure off the treatment systems further downstream. Upgrading
these sludge holding tanks would involve better separation of sludge from wastewater before moving
the sludge to the dewatering process. By increasing the amount of sludge separated from wastewater in
the sludge holding tanks, it will make for easier dewatering of sludge before the sludge is transported
from the plant. If the sludge contains less wastewater, the dewatering sludge process will be much
faster and more efficient. Instead of the sludge simply being contained, with upgrades to the sludge
holding tanks it will allow for treatment to the sludge to occur while being contained in the holding
tanks.
A more complicated and later phase of upgrades to the WWTF involves replacing the current
siphons into the Otter River with newer ones. Over time these siphons have become worn, and although
they still perform the operation they are meant to, new siphons would directly result in a more efficient
process, significantly decreasing the need for maintenance and upkeep that the current siphons require.
This upgrade is considered a much more difficult one because upgrading the siphons almost always
means stopping or diverting flow in some way. A successful way of implementing this at the Gardner
WWTF has yet to be discovered, however the upgrade is still a possibility. If the flow can somehow be
diverted or discharged to the Otter River by different means temporarily, the upgrade of the discharge
siphons will be a reality. As mentioned before, the current siphons do the job they are required to do,
however because of the wear and tear over time, new siphons would result a significant decrease in
required maintenance and upkeep of the system.
The final and potentially simpler upgrade to the WWTF will involve moving from using lime in
treatment to using soda ash. Lime and soda ash are used in water treatment to add alkalinity to the
water and adjust the pH. Lime treatment also has incidental benefits to remove iron, aid in clarification
of turbid waters and has minimal bactericidal benefit. By moving from lime to soda ash, a better and
more efficient addition of alkalinity and adjustment of pH can be expected. The soda ash better softens
the water to permit for easier treatment of unwanted wastewater characteristics such as nitrogen and
phosphorus compared to strictly lime. With the implementation of soda ash to the process instead of
lime, treatment processes downstream will result in a significant increase of effectiveness with
wastewater being softer and easier to treat2.8 NPDES Permit in Gardner, Massachusetts
The City of Gardner and more specifically the Department of Public Works and the
Wastewater Treatment Facility must comply with NPDES permit No. MA0100994. This
limitations for the treatment facility in Gardner that discharges to the Otter River.
NPDES permit is the town of Ashburnham as a co -permittee as about 1600 residents in
discharge into sewers that are treated at the Gardner WWTF. The NPDES permit became

COPPER REMOVAL AT THE GARDNER WWTF 30
December 1, 2009 and will be expire in 2014. Specific numbers for the effluent discharge
shown below in
Table 1 and
Table 2. 32
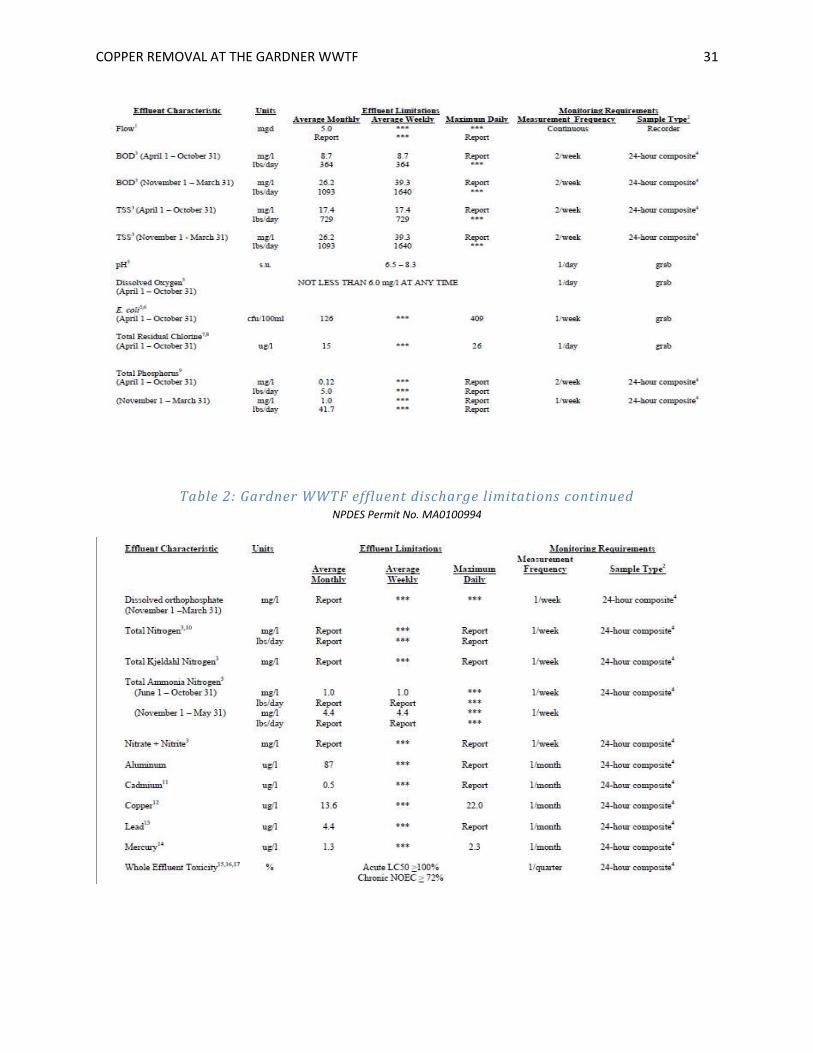
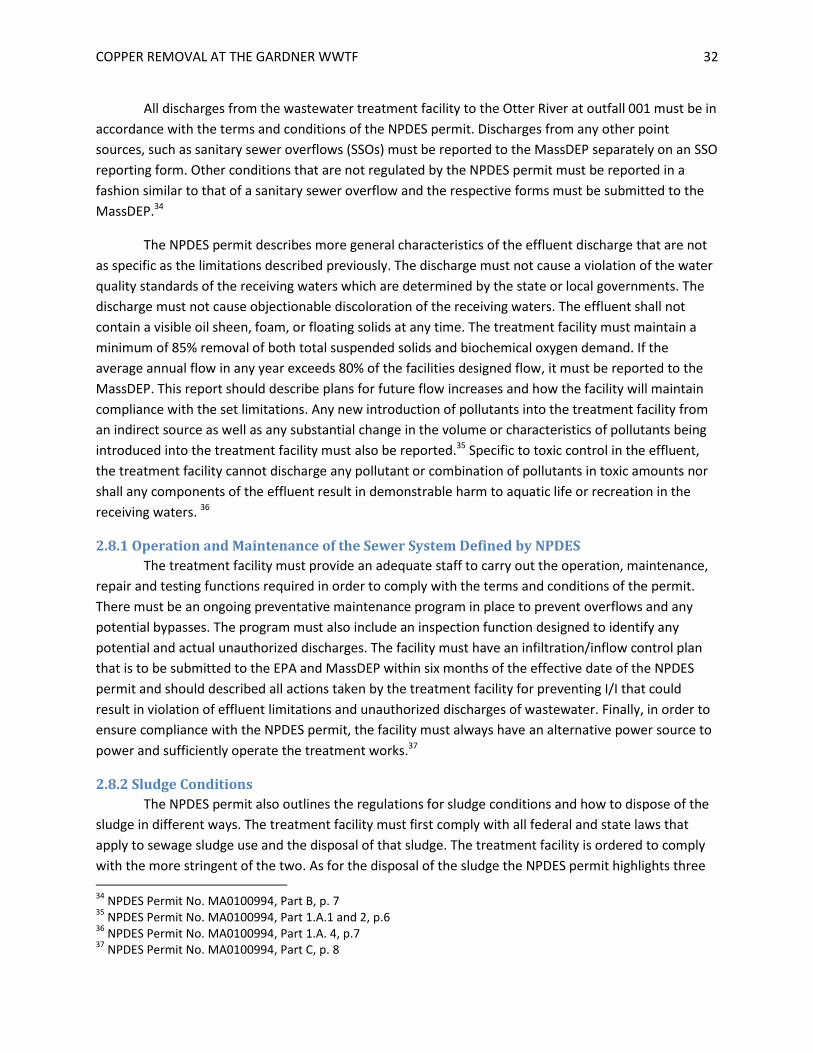
This NPDES permit is specific to the wastewater characteristics in Gardner. Although many of
these effluent characteristics are present in almost all wastewater treatment facilities, the limitations
are different and vary depending on present technology and where the effluent is discharged. The
NPDES permit defines the terms in the tables below. It also defines when and what kind of samples shall
be taken, and how they are to be reported in the Discharge Monitoring Report.
The wastewater treatment facility must develop a routine sampling program where samples are
always taken at the same location, same time, and same days every month to insure maximum
accuracy. All samples that are taken should be 24-hour composite samples unless it is specified
otherwise in the permit. A 24-hour composite sample consists of at least twenty-four grab samples
taken consecutively in a 24-hour period and should be combined proportional to flow. 33
Table 1: Gardner WWTF effluent discharge limitations NPDES Permit No. MA0100994
32
NPDES Permit No. MA0100994, Part 1.A, p.2 33
Ibid, p.3
COPPER REMOVAL AT THE GARDNER WWTF 31
Table 2: Gardner WWTF effluent discharge limitations continued NPDES Permit No. MA0100994
COPPER REMOVAL AT THE GARDNER WWTF 32
All discharges from the wastewater treatment facility to the Otter River at outfall 001 must be in
accordance with the terms and conditions of the NPDES permit. Discharges from any other point
sources, such as sanitary sewer overflows (SSOs) must be reported to the MassDEP separately on an SSO
reporting form. Other conditions that are not regulated by the NPDES permit must be reported in a
fashion similar to that of a sanitary sewer overflow and the respective forms must be submitted to the
MassDEP.34
The NPDES permit describes more general characteristics of the effluent discharge that are not
as specific as the limitations described previously. The discharge must not cause a violation of the water
quality standards of the receiving waters which are determined by the state or local governments. The
discharge must not cause objectionable discoloration of the receiving waters. The effluent shall not
contain a visible oil sheen, foam, or floating solids at any time. The treatment facility must maintain a
minimum of 85% removal of both total suspended solids and biochemical oxygen demand. If the
average annual flow in any year exceeds 80% of the facilities designed flow, it must be reported to the
MassDEP. This report should describe plans for future flow increases and how the facility will maintain
compliance with the set limitations. Any new introduction of pollutants into the treatment facility from
an indirect source as well as any substantial change in the volume or characteristics of pollutants being
introduced into the treatment facility must also be reported.35 Specific to toxic control in the effluent,
the treatment facility cannot discharge any pollutant or combination of pollutants in toxic amounts nor
shall any components of the effluent result in demonstrable harm to aquatic life or recreation in the
receiving waters. 36
2.8.1 Operation and Maintenance of the Sewer System Defined by NPDES
The treatment facility must provide an adequate staff to carry out the operation, maintenance,
repair and testing functions required in order to comply with the terms and conditions of the permit.
There must be an ongoing preventative maintenance program in place to prevent overflows and any
potential bypasses. The program must also include an inspection function designed to identify any
potential and actual unauthorized discharges. The facility must have an infiltration/inflow control plan
that is to be submitted to the EPA and MassDEP within six months of the effective date of the NPDES
permit and should described all actions taken by the treatment facility for preventing I/I that could
result in violation of effluent limitations and unauthorized discharges of wastewater. Finally, in order to
ensure compliance with the NPDES permit, the facility must always have an alternative power source to
power and sufficiently operate the treatment works.37
2.8.2 Sludge Conditions
The NPDES permit also outlines the regulations for sludge conditions and how to dispose of the
sludge in different ways. The treatment facility must first comply with all federal and state laws that
apply to sewage sludge use and the disposal of that sludge. The treatment facility is ordered to comply
with the more stringent of the two. As for the disposal of the sludge the NPDES permit highlights three 34
NPDES Permit No. MA0100994, Part B, p. 7 35
NPDES Permit No. MA0100994, Part 1.A.1 and 2, p.6 36
NPDES Permit No. MA0100994, Part 1.A. 4, p.7 37
NPDES Permit No. MA0100994, Part C, p. 8
COPPER REMOVAL AT THE GARDNER WWTF 33
different methods. The first is land application of the sludge and using it to condition or fertilize the soil.
The second is surface disposal which is the placement of the sludge in a sludge only landfill. Finally, the
last method of removal of the sludge is to incinerate the sludge in a sludge only incinerator. If the facility
places the sludge within a municipal solid waste landfill or instead of disposing the sludge the facility
treats the sludge using, for instance, lagoons or reed beds, the conditions of the permit and the sludge
conditions do not apply. In the case of Gardner, their sludge is distributed to a sludge only landfill.38 The
facility must monitor the pollutant concentrations, pathogen reduction and vector attraction reduction
of the sludge at a frequency dependent on the volume of the sludge. The frequencies are shown below
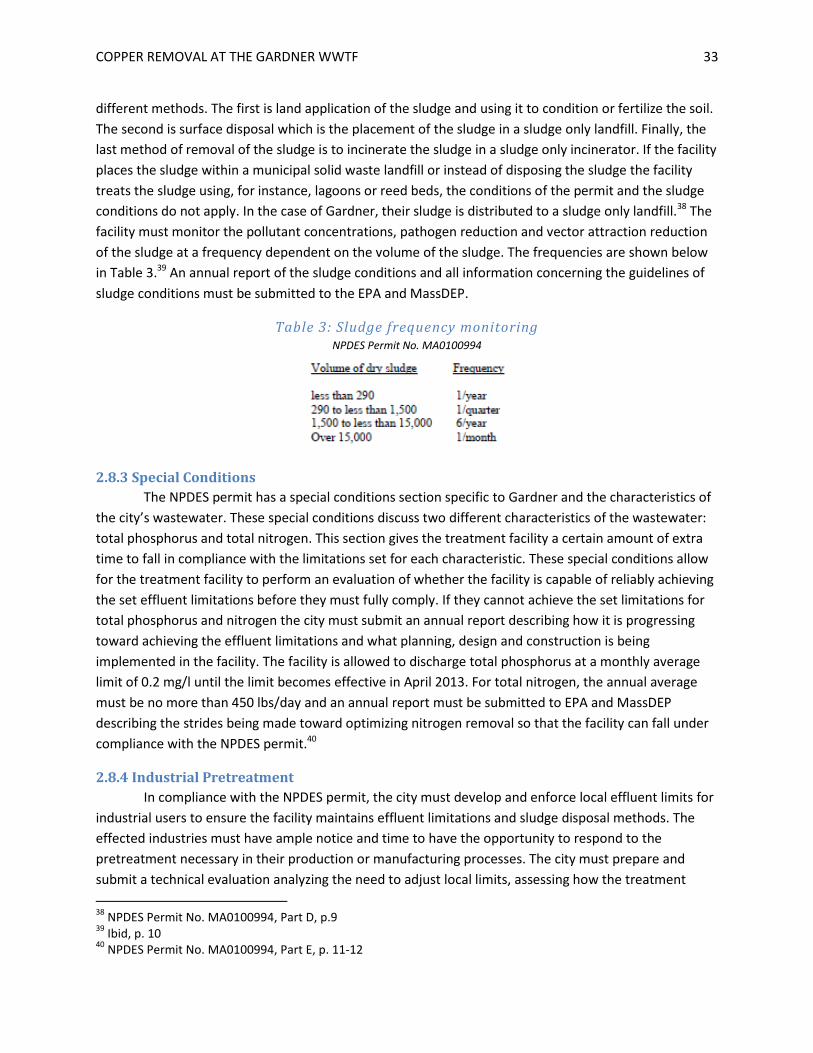
in Table 3.39 An annual report of the sludge conditions and all information concerning the guidelines of
sludge conditions must be submitted to the EPA and MassDEP.
Table 3: Sludge frequency monitoring NPDES Permit No. MA0100994
2.8.3 Special Conditions
The NPDES permit has a special conditions section specific to Gardner and the characteristics of
the city’s wastewater. These special conditions discuss two different characteristics of the wastewater:
total phosphorus and total nitrogen. This section gives the treatment facility a certain amount of extra
time to fall in compliance with the limitations set for each characteristic. These special conditions allow
for the treatment facility to perform an evaluation of whether the facility is capable of reliably achieving
the set effluent limitations before they must fully comply. If they cannot achieve the set limitations for
total phosphorus and nitrogen the city must submit an annual report describing how it is progressing
toward achieving the effluent limitations and what planning, design and construction is being
implemented in the facility. The facility is allowed to discharge total phosphorus at a monthly average
limit of 0.2 mg/l until the limit becomes effective in April 2013. For total nitrogen, the annual average
must be no more than 450 lbs/day and an annual report must be submitted to EPA and MassDEP
describing the strides being made toward optimizing nitrogen removal so that the facility can fall under
compliance with the NPDES permit.40
2.8.4 Industrial Pretreatment
In compliance with the NPDES permit, the city must develop and enforce local effluent limits for
industrial users to ensure the facility maintains effluent limitations and sludge disposal methods. The
effected industries must have ample notice and time to have the opportunity to respond to the
pretreatment necessary in their production or manufacturing processes. The city must prepare and
submit a technical evaluation analyzing the need to adjust local limits, assessing how the treatment
38
NPDES Permit No. MA0100994, Part D, p.9 39
Ibid, p. 10 40
NPDES Permit No. MA0100994, Part E, p. 11-12
COPPER REMOVAL AT THE GARDNER WWTF 34
facility performs with respect to influent and effluent pollutants, as well as water quality concerns,
sludge quality, sludge processing concerns, and biomonitoring results. If the local limits must be revised,
a technical evaluation form of the local limits must be submitted to the EPA and MassDEP and the local
limits must be revised within 120 days of notification by the EPA and submit the revisions for approval.
The city must implement an Industrial Pretreatment Program in accordance with legal
authorities, policies, procedures, and financial provisions that are described in the city’s approved
Pretreatment Program. The city must perform inspection, surveillance and monitoring of the industries,
which will determine whether the industry is in compliance with the pretreatment standards. The city
must also obtain remedies for noncompliance by any industrial user with any pretreatment
requirement.41
2.8.5 Industrial Pretreatment Case Study
In order to better understand what actually entails pretreatment at an industry before discharge
a local company that has a large pretreatment system in place was researched and studied. Vitasoy USA
is a tofu manufacturer located in Ayer, MA. Although this industry is not in Gardner and does not
discharge to the Gardner WWTF, it is part of a very large-scale industrial pretreatment program. The
tofu manufacturing process uses an enormous amount of water, more so than most other industries,
and is not very similar to the industries located in Gardner, MA. The purpose of this case study was to
break down and determine what actually makes up industrial pretreatment of wastewater and the cost,
chemicals, and processes associated with it. Although Vitasoy does use an extremely large amount of
water, the goal of this case study is to display industrial pretreatment on a large scale.
From April 2010 to March 2011, Vitasoy had a total wastewater flow of 32, 164, 986 gallons with
a total wastewater treatment and air scrubber system cost of $187, 645. The process uses various
chemicals that are added to the wastewater for purposes such has pH control, sludge settling and foam
control. Costs included in the total costs are the cost of chemicals, lab testing, repairs and labor cost.
Not only does Vitasoy treat their wastewater, but it also develops sludge through the process that must
be handled and treated separate to the wastewater and air scrubber system.
Unlike the wastewater treatment and air scrubber system, the sludge dewatering operation
takes the sludge that is developed during the treatment process and dewaters it developing a cake-like
substance. Once the sludge is dewatered, it is then stored and transported to a local farm where the
farm owner uses the sludge for fertilizer. Costs included in the sludge dewatering operation include the
costs of chemicals, transportation, D-Earth cost, repairs and labor. The total cost of the sludge
dewatering operation is $283, 800.
Together the wastewater treatment and air scrubber system, along with the sludge dewatering
operation totaled $471, 445 from April 2010 to March 2011. With 32, 164, 986 gallons being treated in
that time period, the treatment cost was $.01465 per gallon.
41
NPDES Permit No. MA0100994, Part F, p. 12-13

COPPER REMOVAL AT THE GARDNER WWTF 35
No industrial pretreatment process is ever going to be exactly the same and it dependent on the
type of industry. Because tofu manufacturing requires large amounts of water, the pretreatment system
is a very large one. However, in Gardner, most local industries would not qualify for such a large scale
operation as these industries are furniture manufacturers, metal finishing industries and other various
low water processes. Nevertheless, if it were ever determined that a company that discharges to the
Gardner sewage system did qualify for industrial pretreatment, the cost per gallon can be expected to
be similar to that of Vitasoy USA. The cost figures are displayed below in Table 4.
Table 4: Industrtial Pretreatment Costs
Wastewater Treatment process and Air Scrubber system
Sludge Dewatering Operation
Total Wastewater Cost
Cost per gallon of Wastewater
Chemical Cost $63,468 Chemical cost $57, 920 $471, 445 $.01465
Lab Test Cost $39, 377 Transportation $111, 800
Repair Cost $19, 800 D-Earth Cost $49, 280
Labor Cost $65, 000 Repair Cost $ 19, 800
Labor Cost $45,000
Total Cost $187, 645 Total Cost $283, 800
2.9 Sources of Copper Contamination There are many places where copper can originate from in the water cycle. Copper is naturally
found in water at low levels between 50 and 100 ppb in drinking reservoirs.42 Even lower levels are
found in groundwater sources, averaging only 5 ppb. The city of Gardner has 113 private wells that
discharge into the city sewer line. This means that the majority of Gardner’s water supply comes from
the water treatment facility, where the copper levels could be as high as the EPA limit of 1300 ppb,
although the actual level is much lower. The city samples the water at various locations around the city,
usually areas furthest from the treatment plant, where the copper levels have been reported
consistently under the EPA wastewater discharge limit for Gardner. With 5 million gallons of wastewater
entering the plant daily at an average of 100 ppb, the root of the copper is not from the water sources.
Copper piping is of major concern when locating the source of the copper. Almost all hot water
pipes, as well as some cold water pipes are made of copper. Mildly corrosive water with a pH slightly
above or below 7 could affect the piping system and elevate the copper level in the water. Additionally,
42
Maag et al.

COPPER REMOVAL AT THE GARDNER WWTF 36
copper particles are more likely to release in hot water applications, such as hot water heaters used in
every household. One study suggests that the copper plumbing accounts for 14-61% of the total copper
in wastewater. If copper plumbing is in fact contributing significantly to the total copper entering the
WWTF, measures can be taken to reduce the corrosive level leaving the treatment plant. With the
WWTF operating at the same level of efficiency of copper removal, and with a reduction of 61% of
copper entering the plant, the discharge copper level should be well within EPA limits. 43
Root killer (copper sulfate) is a common homeowner tool used to remove roots from septic
pipes. The product is dumped directly into the sewer lines and, being of high copper concentration,
could potentially be a source of copper in wastewater. Root killer would also explain sporadic copper
levels experienced in the Gardner WWTF. Unfortunately, it is difficult to prove root killer as a copper
source because the source location varies as the product is used at different locations. To overcome this
difficulty, root killer sales can be tracked within the area of the Gardner wastewater collection area.44
Industrial facilities in the area are a high probability of copper infiltration. Some of the industries
in the Gardner area are metal finishing companies that could dispose of copper particles in the sewer
system. Some metal finishing processes could also result in a chemical abrasion of the metal, dissolving
it, which would in-turn end in the sewer system. Copper is also a dominant ingredient in batteries and
metal plating. Excess material from these companies could result in an overall increase of copper in the
Gardner WWTF.45
In addition to root killer, copper sulfate is also used to treat algae. One reason that the EPA sets
strict limits on copper discharge is because of the hazard it poses to the wildlife. One study suggests that
the algae treatment “Bluestone” has the potential to kill fish in small water systems. Although small
water systems are neither a drinking source nor a wastewater depository, contamination of the small
system could reach the WWTF by infiltration and inflow. The effect of Bluestone is based on the
alkalinity of the water. The higher the alkalinity, the more copper sulfate is necessary for proper
treatment. If algae treatment is present in high alkaline waters in Gardner, it could be a source of copper
entering the WWTF.46
2.10 Copper in Plant Effluent One of the biggest challenges in meeting the NPDES permit limits faced by the operator of the
Gardner WWTF is the total copper discharge limit. In order to determine where the copper was actually
coming from and how the treatment facility could lower these levels many studies were performed. In
June 1994, the city of Gardner conducted a corrosion control study to comply with the Safe Drinking
Water Act Lead and Copper Rule. This study revealed that the city’s source water was corrosive and
therefore led to leaching of copper into the water from building plumbing. These findings led to full-
scale chemical precipitation trials with ferric chloride and the effect it would have on the copper levels.
The trials concluded that ferric chloride had the ability to reduce copper levels in effluent, but not
43
Sprague 44
Ibid 45
Ibid 46
Ibid
COPPER REMOVAL AT THE GARDNER WWTF 37
enough to comply with the limitations set by the NPDES permit at that time. As a result, the city of
Gardner re-evaluated the local limits and revisited copper sources that entered the collection system.
The evaluation determined that adjusting the local limits under the city’s industrial pretreatment
program was no viable due to the fact that the local industries attributed to such a small portion of the
copper in the wastewater. Adjusting the local limits would not reduce the amount of copper enough to
comply with the NPDES permit at that time. Corrosion control during water treatment and chemical
addition at the water treatment plant would be necessary in order to comply with the NPDES permit.47
In 2002, the contract operator at the time compiled a report that described the corrosion
control program efforts that were in effect and its successes in reducing the copper levels that were
discharged. In addition, the report described how further optimization of the corrosion control program
would result in better copper removal.48 In 2003 the city performed its own copper optimization study
called the Wastewater System Copper Optimization Engineering Report. This report sought to
completely identify all the sources of copper in the collection system and determine treatment options
that were applicable to reduce the total copper concentration to the treatment facility. Some of the
report’s recommendations were to implement corrosion control inhibitors within the municipal system
and an extensive infiltration and inflow reduction program to further reduce the copper levels loading
into the treatment facility.49
Despite the studies and recommendations the city continued to fail to meet the NPDES permit
discharge limits through 2008. During this time the EPA issued three Administrative Orders that required
the city of Gardner to take definitive actions to reduce the copper effluent levels. The first two
Administrative Orders were complied with by the city, leaving the last and most recent Administrative
Order the only active one. The Maguire Group and the city of Gardner submitted a “Copper Report” to
the EPA and MassDEP in December of 2010 in order to satisfy the requirements of the final
Administrative Order.50
The NPDES permit had been revised in 2009 adjusting more stringent limitations for certain
effluent characteristics such as aluminum, copper and phosphorus. The previous NPDES permit had
much more strict limitations but did not take into account the combined CaCO3 hardness downstream of
the wastewater treatment plant or the in-stream copper concentration of the Otter River. As a result,
the limitations had been adjusted to better fit the actual characteristics of the effluent and actual levels.
Specifically for copper, the limit had been adjusted from 3.3 ug/L to 13.6 ug/L. 51
2.11 Case Study A study was conducted at the San Jose/Santa Clara water pollution control plant on the removal
of copper and nickel. The plant processes on average 167 million gallons per day, and has a copper
discharge limit of 4.9 ppb (1998). Similar to the task assigned by the Gardner WWTF, “This paper
47
NPDES Permit No. MA0100994, Part F, p. 15 48
Ibid, p. 12 49
Ibid, p. 15 50
Maguire Group, NPDES Permit Compliance Report, 2010, p. 13 51
Maguire Group, NPDES Permit Compliance Report, 2010, p. 17
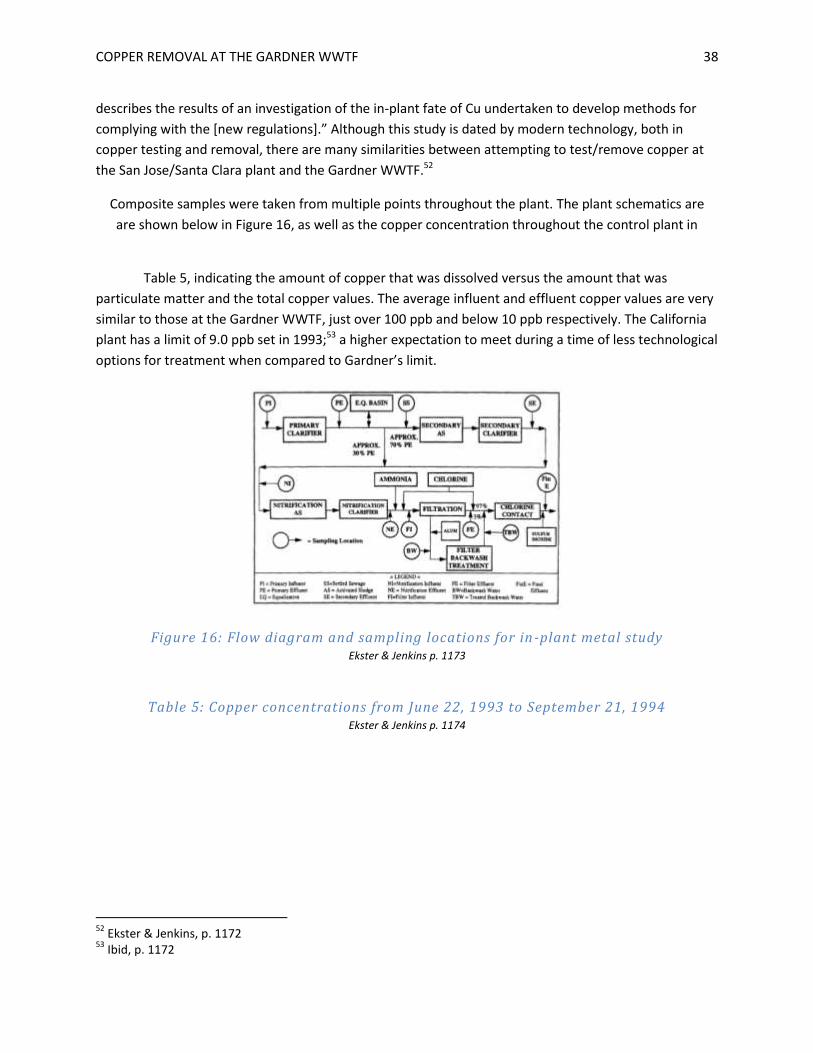
COPPER REMOVAL AT THE GARDNER WWTF 38
describes the results of an investigation of the in-plant fate of Cu undertaken to develop methods for
complying with the [new regulations].” Although this study is dated by modern technology, both in
copper testing and removal, there are many similarities between attempting to test/remove copper at
the San Jose/Santa Clara plant and the Gardner WWTF.52
Composite samples were taken from multiple points throughout the plant. The plant schematics are
are shown below in Figure 16, as well as the copper concentration throughout the control plant in
Table 5, indicating the amount of copper that was dissolved versus the amount that was
particulate matter and the total copper values. The average influent and effluent copper values are very
similar to those at the Gardner WWTF, just over 100 ppb and below 10 ppb respectively. The California
plant has a limit of 9.0 ppb set in 1993;53 a higher expectation to meet during a time of less technological
options for treatment when compared to Gardner’s limit.
Figure 16: Flow diagram and sampling locations for in-plant metal study Ekster & Jenkins p. 1173
Table 5: Copper concentrations from June 22, 1993 to September 21, 1994 Ekster & Jenkins p. 1174
52
Ekster & Jenkins, p. 1172 53
Ibid, p. 1172

COPPER REMOVAL AT THE GARDNER WWTF 39
The method for testing copper concentrations is almost identical to those recommended in the
2005 version of Standard Methods for the Examination of Water and Wastewater (21st edition). Total
copper concentration was measured by unfiltered digestion, while the dissolved copper concentration
was filtered using 0.45 µm filters. The San Jose/Santa Clara test samples were preserved with to a
pH under 2, while Gardner’s samples were preserved with hydrochloric acid (HCl) to a pH under 3. The
difference in pH used in preservation should not vary the test results.54
The majority of the copper removed throughout the treatment process was the
copper while passing through the secondary activated sludge tank, indicated in Table 6.
Additionally, the secondary activated sludge tank was the only process throughout the
plant that made significant progress is removing dissolved copper, shown in
Table 7, from 3.6 ppb to 1.1 ppb. Copper removed via the secondary activated sludge system varied
seasonally, where the higher removals were associated with increased activated sludge growth. 55
Table 6: Individual treatment process median copper and nickel removal efficiencies Ekster & Jenkins p. 1175
Table 7: Fate of total and dissolved copper from June 22, 1993 to September 21, 1994 Ekster & Jenkins p. 1175
54
Ekster & Jenkins, p. 1172 55
Ibid, p. 1174
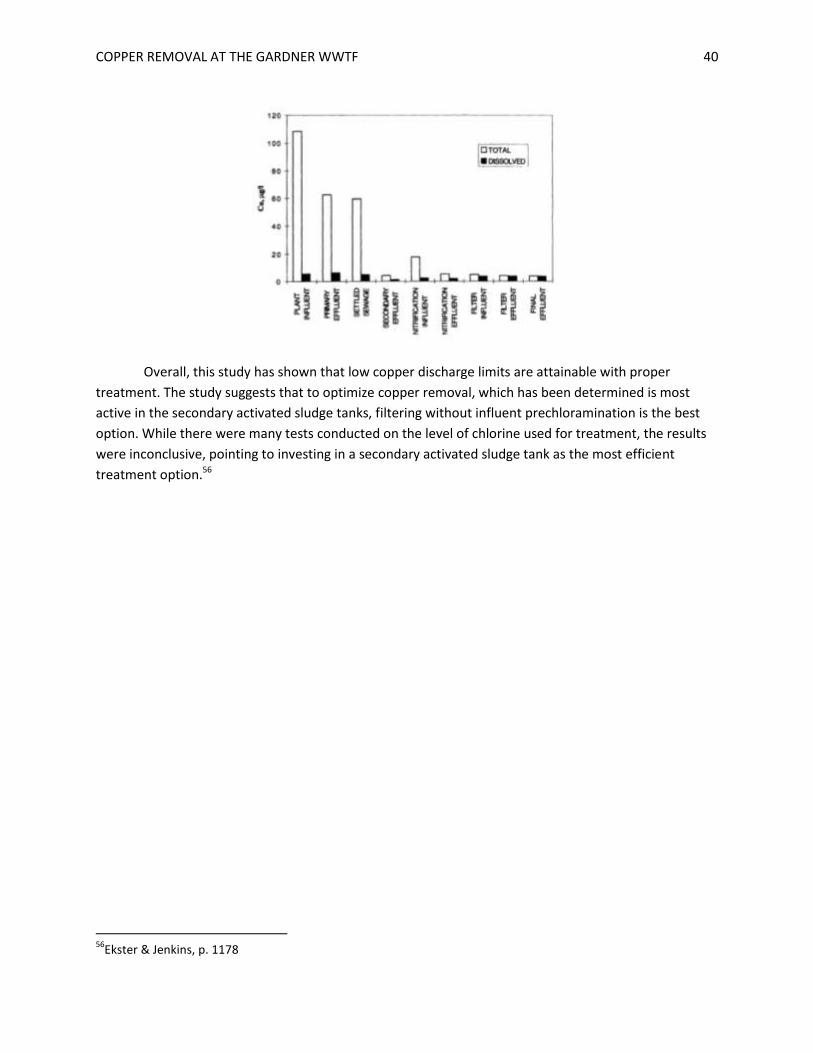
COPPER REMOVAL AT THE GARDNER WWTF 40
Overall, this study has shown that low copper discharge limits are attainable with proper
treatment. The study suggests that to optimize copper removal, which has been determined is most
active in the secondary activated sludge tanks, filtering without influent prechloramination is the best
option. While there were many tests conducted on the level of chlorine used for treatment, the results
were inconclusive, pointing to investing in a secondary activated sludge tank as the most efficient
treatment option.56
56
Ekster & Jenkins, p. 1178

COPPER REMOVAL AT THE GARDNER WWTF 41
Figure 17: Annual average influent & effluent total copper concentrations & copper
removal efficiency Ekster & Jenkins p. 1178
In addition to treating the waste water for copper, it may be worthwhile to investigate the
treatment options at the water treatment plant. Over the 12 years of recorded data shown in Figure 17,
there is a correlation between the decreased levels of copper in the wastewater effluent and the
decreased level of copper leaving the water treatment plant. Treating the water before it enters the
water distribution system could affect the corrosiveness of the water, which in copper pipes could be a
major contributor to the copper entering the wastewater treatment plants.
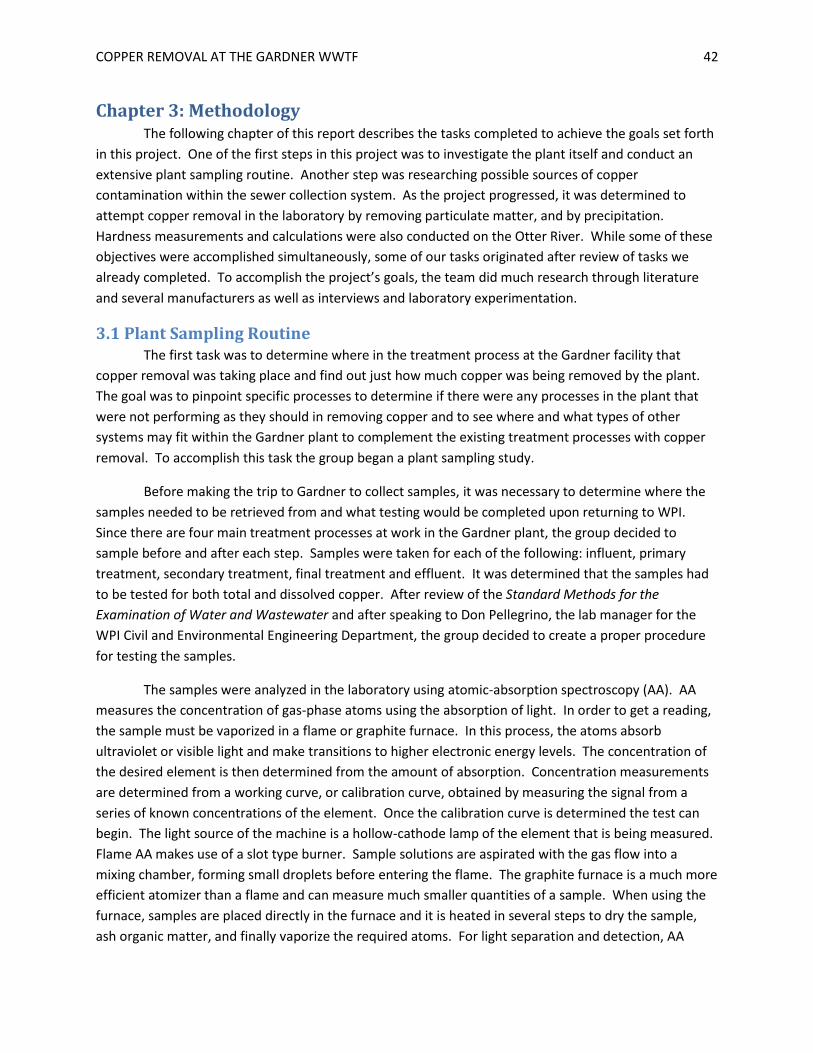
COPPER REMOVAL AT THE GARDNER WWTF 42
Chapter 3: Methodology The following chapter of this report describes the tasks completed to achieve the goals set forth
in this project. One of the first steps in this project was to investigate the plant itself and conduct an
extensive plant sampling routine. Another step was researching possible sources of copper
contamination within the sewer collection system. As the project progressed, it was determined to
attempt copper removal in the laboratory by removing particulate matter, and by precipitation.
Hardness measurements and calculations were also conducted on the Otter River. While some of these
objectives were accomplished simultaneously, some of our tasks originated after review of tasks we
already completed. To accomplish the project’s goals, the team did much research through literature
and several manufacturers as well as interviews and laboratory experimentation.
3.1 Plant Sampling Routine The first task was to determine where in the treatment process at the Gardner facility that
copper removal was taking place and find out just how much copper was being removed by the plant.
The goal was to pinpoint specific processes to determine if there were any processes in the plant that
were not performing as they should in removing copper and to see where and what types of other
systems may fit within the Gardner plant to complement the existing treatment processes with copper
removal. To accomplish this task the group began a plant sampling study.
Before making the trip to Gardner to collect samples, it was necessary to determine where the
samples needed to be retrieved from and what testing would be completed upon returning to WPI.
Since there are four main treatment processes at work in the Gardner plant, the group decided to
sample before and after each step. Samples were taken for each of the following: influent, primary
treatment, secondary treatment, final treatment and effluent. It was determined that the samples had
to be tested for both total and dissolved copper. After review of the Standard Methods for the
Examination of Water and Wastewater and after speaking to Don Pellegrino, the lab manager for the
WPI Civil and Environmental Engineering Department, the group decided to create a proper procedure
for testing the samples.
The samples were analyzed in the laboratory using atomic-absorption spectroscopy (AA). AA
measures the concentration of gas-phase atoms using the absorption of light. In order to get a reading,
the sample must be vaporized in a flame or graphite furnace. In this process, the atoms absorb
ultraviolet or visible light and make transitions to higher electronic energy levels. The concentration of
the desired element is then determined from the amount of absorption. Concentration measurements
are determined from a working curve, or calibration curve, obtained by measuring the signal from a
series of known concentrations of the element. Once the calibration curve is determined the test can
begin. The light source of the machine is a hollow-cathode lamp of the element that is being measured.
Flame AA makes use of a slot type burner. Sample solutions are aspirated with the gas flow into a
mixing chamber, forming small droplets before entering the flame. The graphite furnace is a much more
efficient atomizer than a flame and can measure much smaller quantities of a sample. When using the
furnace, samples are placed directly in the furnace and it is heated in several steps to dry the sample,
ash organic matter, and finally vaporize the required atoms. For light separation and detection, AA
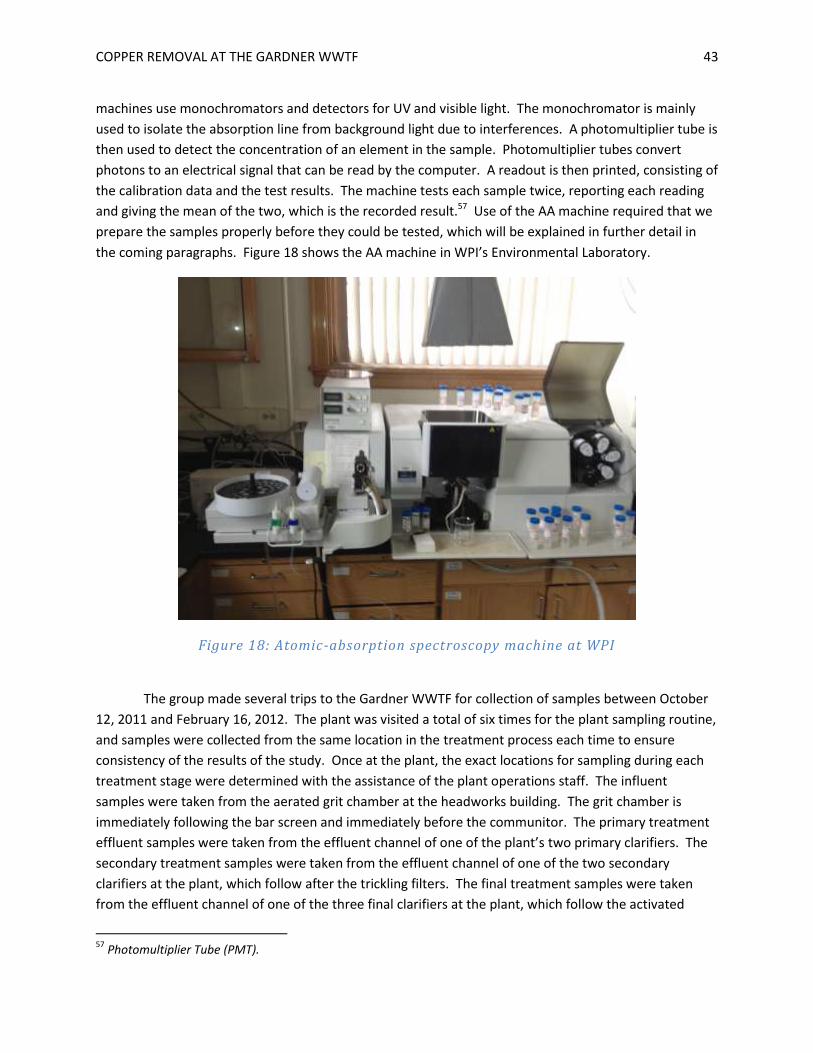
COPPER REMOVAL AT THE GARDNER WWTF 43
machines use monochromators and detectors for UV and visible light. The monochromator is mainly
used to isolate the absorption line from background light due to interferences. A photomultiplier tube is
then used to detect the concentration of an element in the sample. Photomultiplier tubes convert
photons to an electrical signal that can be read by the computer. A readout is then printed, consisting of
the calibration data and the test results. The machine tests each sample twice, reporting each reading
and giving the mean of the two, which is the recorded result.57 Use of the AA machine required that we
prepare the samples properly before they could be tested, which will be explained in further detail in
the coming paragraphs. Figure 18 shows the AA machine in WPI’s Environmental Laboratory.
Figure 18: Atomic-absorption spectroscopy machine at WPI
The group made several trips to the Gardner WWTF for collection of samples between October
12, 2011 and February 16, 2012. The plant was visited a total of six times for the plant sampling routine,
and samples were collected from the same location in the treatment process each time to ensure
consistency of the results of the study. Once at the plant, the exact locations for sampling during each
treatment stage were determined with the assistance of the plant operations staff. The influent
samples were taken from the aerated grit chamber at the headworks building. The grit chamber is
immediately following the bar screen and immediately before the communitor. The primary treatment
effluent samples were taken from the effluent channel of one of the plant’s two primary clarifiers. The
secondary treatment samples were taken from the effluent channel of one of the two secondary
clarifiers at the plant, which follow after the trickling filters. The final treatment samples were taken
from the effluent channel of one of the three final clarifiers at the plant, which follow the activated
57
Photomultiplier Tube (PMT).
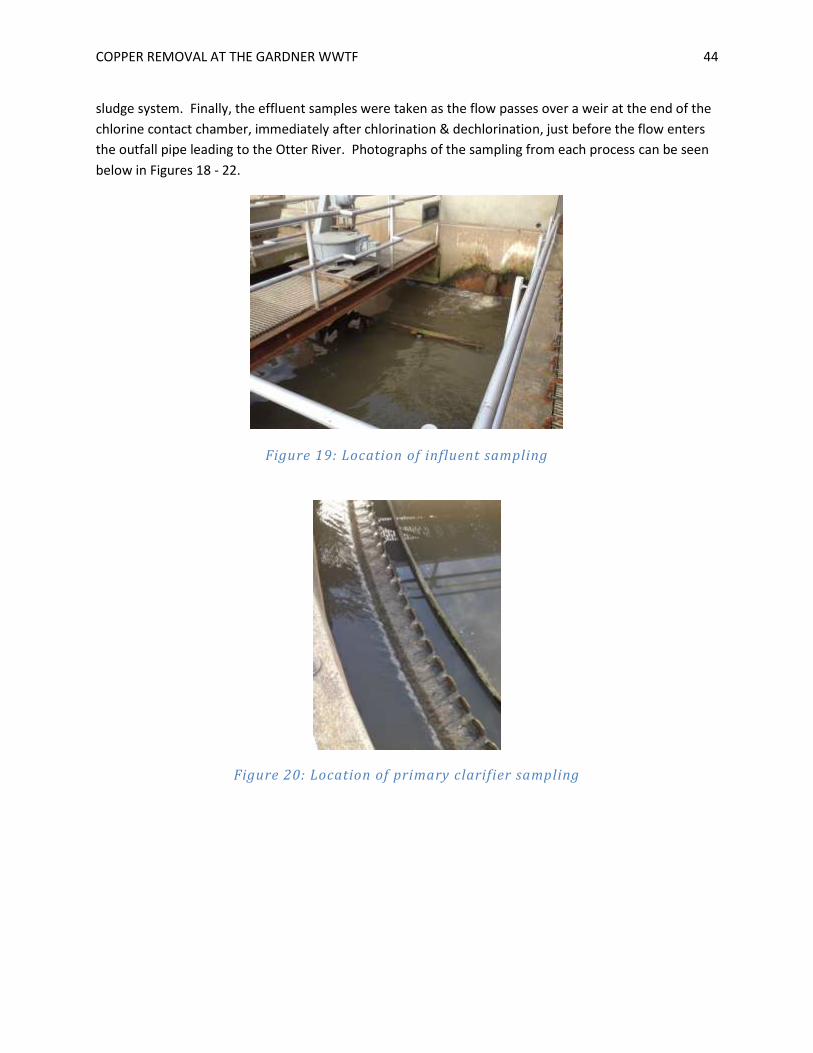
COPPER REMOVAL AT THE GARDNER WWTF 44
sludge system. Finally, the effluent samples were taken as the flow passes over a weir at the end of the
chlorine contact chamber, immediately after chlorination & dechlorination, just before the flow enters
the outfall pipe leading to the Otter River. Photographs of the sampling from each process can be seen
below in Figures 18 - 22.
Figure 19: Location of influent sampling
Figure 20: Location of primary clarifier sampling
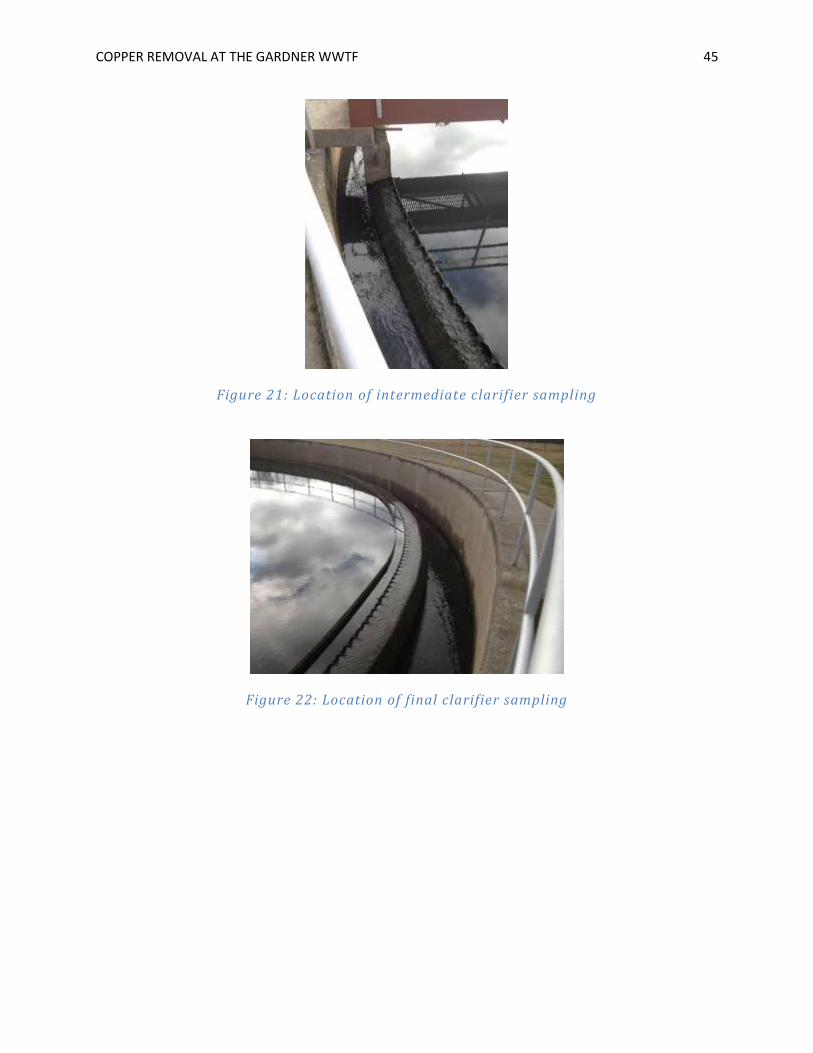
COPPER REMOVAL AT THE GARDNER WWTF 45
Figure 21: Location of intermediate clarifier sampling
Figure 22: Location of final clarifier sampling
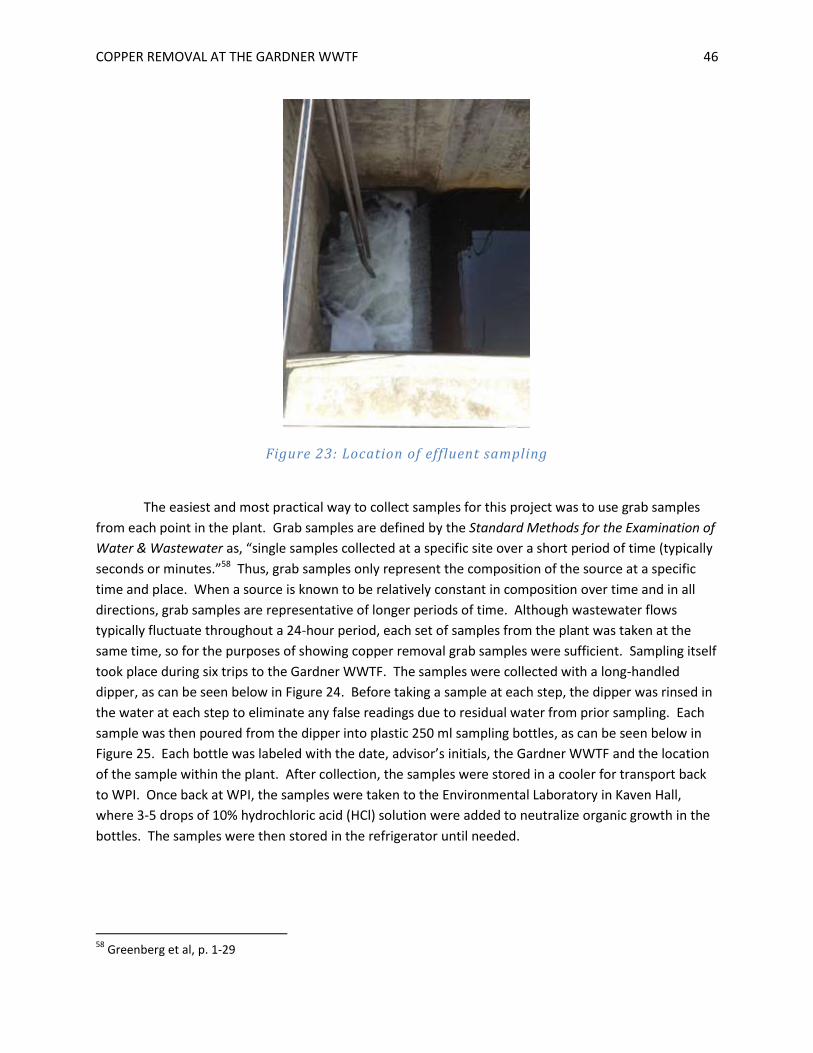
COPPER REMOVAL AT THE GARDNER WWTF 46
Figure 23: Location of effluent sampling
The easiest and most practical way to collect samples for this project was to use grab samples
from each point in the plant. Grab samples are defined by the Standard Methods for the Examination of
Water & Wastewater as, “single samples collected at a specific site over a short period of time (typically
seconds or minutes.”58 Thus, grab samples only represent the composition of the source at a specific
time and place. When a source is known to be relatively constant in composition over time and in all
directions, grab samples are representative of longer periods of time. Although wastewater flows
typically fluctuate throughout a 24-hour period, each set of samples from the plant was taken at the
same time, so for the purposes of showing copper removal grab samples were sufficient. Sampling itself
took place during six trips to the Gardner WWTF. The samples were collected with a long-handled
dipper, as can be seen below in Figure 24. Before taking a sample at each step, the dipper was rinsed in
the water at each step to eliminate any false readings due to residual water from prior sampling. Each
sample was then poured from the dipper into plastic 250 ml sampling bottles, as can be seen below in
Figure 25. Each bottle was labeled with the date, advisor’s initials, the Gardner WWTF and the location
of the sample within the plant. After collection, the samples were stored in a cooler for transport back
to WPI. Once back at WPI, the samples were taken to the Environmental Laboratory in Kaven Hall,
where 3-5 drops of 10% hydrochloric acid (HCl) solution were added to neutralize organic growth in the
bottles. The samples were then stored in the refrigerator until needed.
58
Greenberg et al, p. 1-29
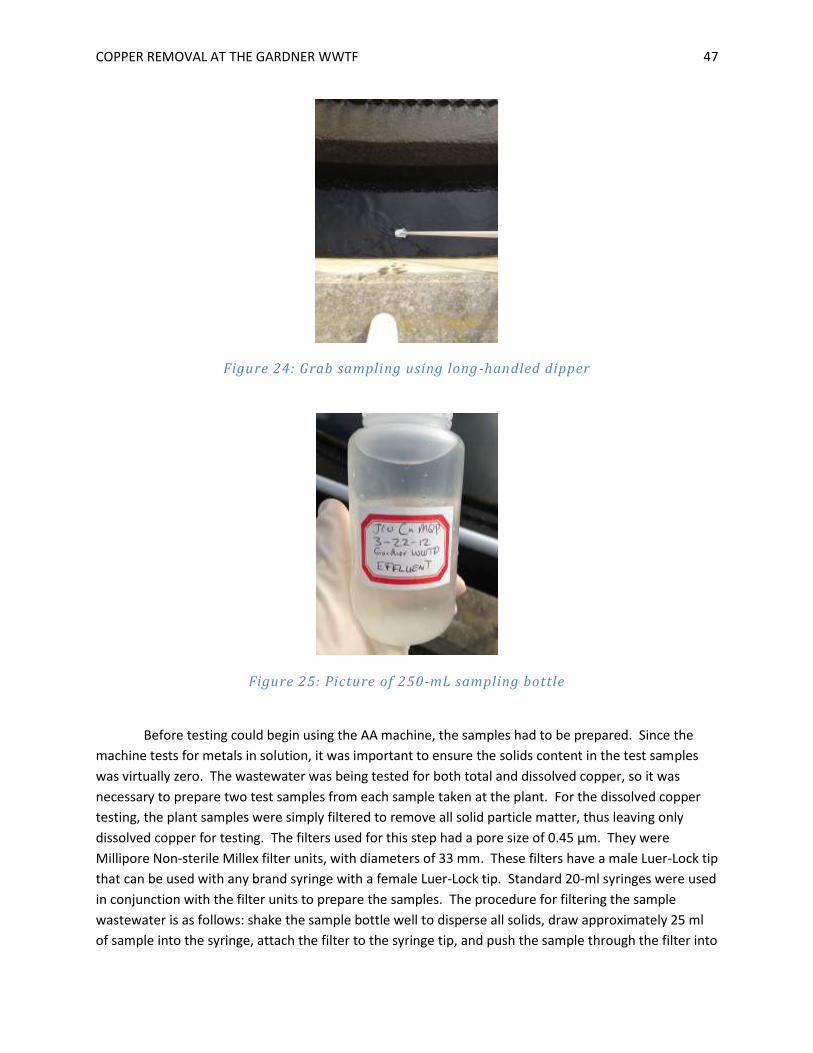
COPPER REMOVAL AT THE GARDNER WWTF 47
Figure 24: Grab sampling using long-handled dipper
Figure 25: Picture of 250-mL sampling bottle
Before testing could begin using the AA machine, the samples had to be prepared. Since the
machine tests for metals in solution, it was important to ensure the solids content in the test samples
was virtually zero. The wastewater was being tested for both total and dissolved copper, so it was
necessary to prepare two test samples from each sample taken at the plant. For the dissolved copper
testing, the plant samples were simply filtered to remove all solid particle matter, thus leaving only
dissolved copper for testing. The filters used for this step had a pore size of 0.45 µm. They were
Millipore Non-sterile Millex filter units, with diameters of 33 mm. These filters have a male Luer-Lock tip
that can be used with any brand syringe with a female Luer-Lock tip. Standard 20-ml syringes were used
in conjunction with the filter units to prepare the samples. The procedure for filtering the sample
wastewater is as follows: shake the sample bottle well to disperse all solids, draw approximately 25 ml
of sample into the syringe, attach the filter to the syringe tip, and push the sample through the filter into
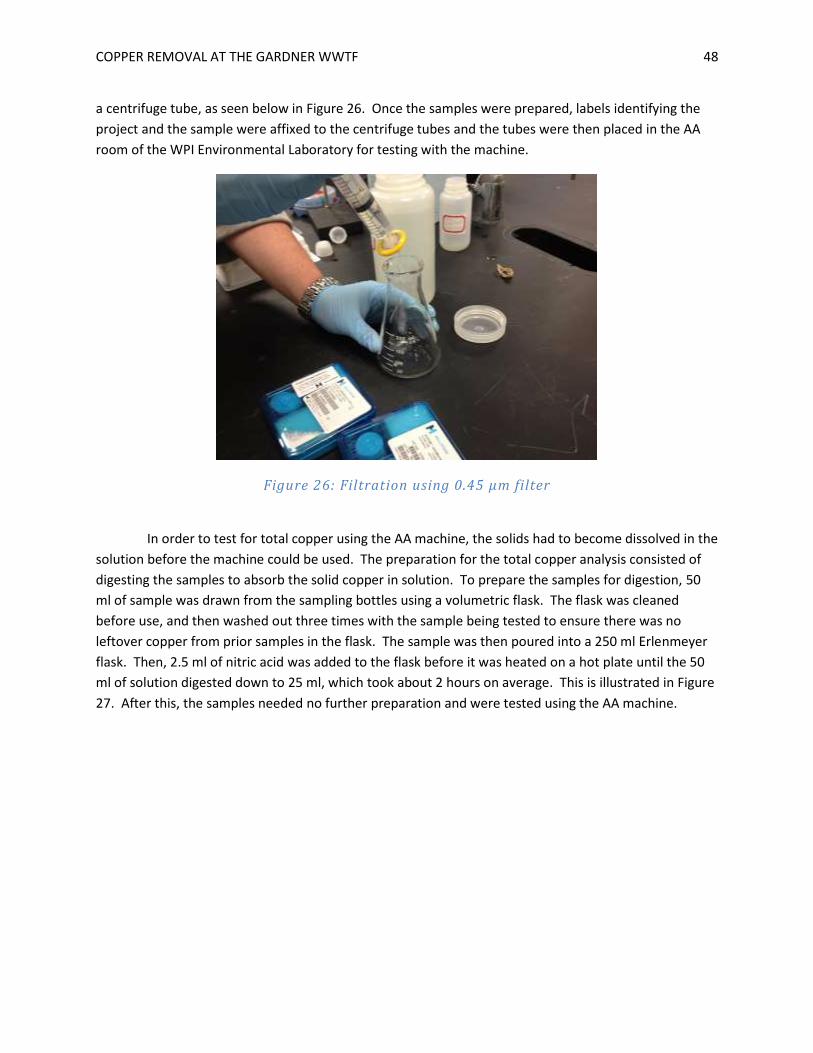
COPPER REMOVAL AT THE GARDNER WWTF 48
a centrifuge tube, as seen below in Figure 26. Once the samples were prepared, labels identifying the
project and the sample were affixed to the centrifuge tubes and the tubes were then placed in the AA
room of the WPI Environmental Laboratory for testing with the machine.
Figure 26: Filtration using 0.45 µm filter
In order to test for total copper using the AA machine, the solids had to become dissolved in the
solution before the machine could be used. The preparation for the total copper analysis consisted of
digesting the samples to absorb the solid copper in solution. To prepare the samples for digestion, 50
ml of sample was drawn from the sampling bottles using a volumetric flask. The flask was cleaned
before use, and then washed out three times with the sample being tested to ensure there was no
leftover copper from prior samples in the flask. The sample was then poured into a 250 ml Erlenmeyer
flask. Then, 2.5 ml of nitric acid was added to the flask before it was heated on a hot plate until the 50
ml of solution digested down to 25 ml, which took about 2 hours on average. This is illustrated in Figure
27. After this, the samples needed no further preparation and were tested using the AA machine.

COPPER REMOVAL AT THE GARDNER WWTF 49
Figure 27: Using hot plate to digest sample for testing
To avoid overloading the machine, for samples predicted to have high copper content, mainly
the influent samples, the AA flame was first used, and if more precision was necessary the samples were
retested using the AA furnace. Once AA testing had begun, a small amount of each prepared sample
was drawn and put in a vial which was then placed in a certain spot on the AA machine’s turntable. The
machine uses a straw to extract sample, and only drew about 15 µl of sample for each trial. The reason
that so little sample was used in each test is that copper is a very reactive metal and much more sample
would overload the AA machine. After the tests were completed, a printout was made containing a
calibration curve and all test results.
3.2 Sampling at Other WWTFs In order to confirm that the pattern observed at the Gardner WWTF is common among other
plants in the area, samples were taken from three other area WWTFs and analyzed for total and
dissolved copper in the lab at WPI. To ensure that most of the copper was being removed after primary
treatment, the group decided to retrieve influent samples, samples after primary treatment and effluent
samples from the area plants. After getting in touch with several plants in central Massachusetts, the
group ultimately decided to take samples from the Leominster Water Pollution Control Facility in
Leominster, MA, the Marlborough-Westerly Wastewater Treatment Plant in Marlborough, MA and the
Upper Blackstone Water Pollution Abatement District’s plant located in Millbury, MA. Leominster was
selected due to its proximity to Gardner. Marlborough-Westerly was chosen because the plant is
currently undergoing a major upgrade. The Upper Blackstone plant was selected because it treats all of
the wastewater from the city of Worcester and it surrounding towns, and there is much industrial
activity within those jurisdictions.
The procedure for carrying out the sampling at other local WWTFs was virtually identical to the
procedure for the plant sampling routine. The samples were collected using grab samples, stored in
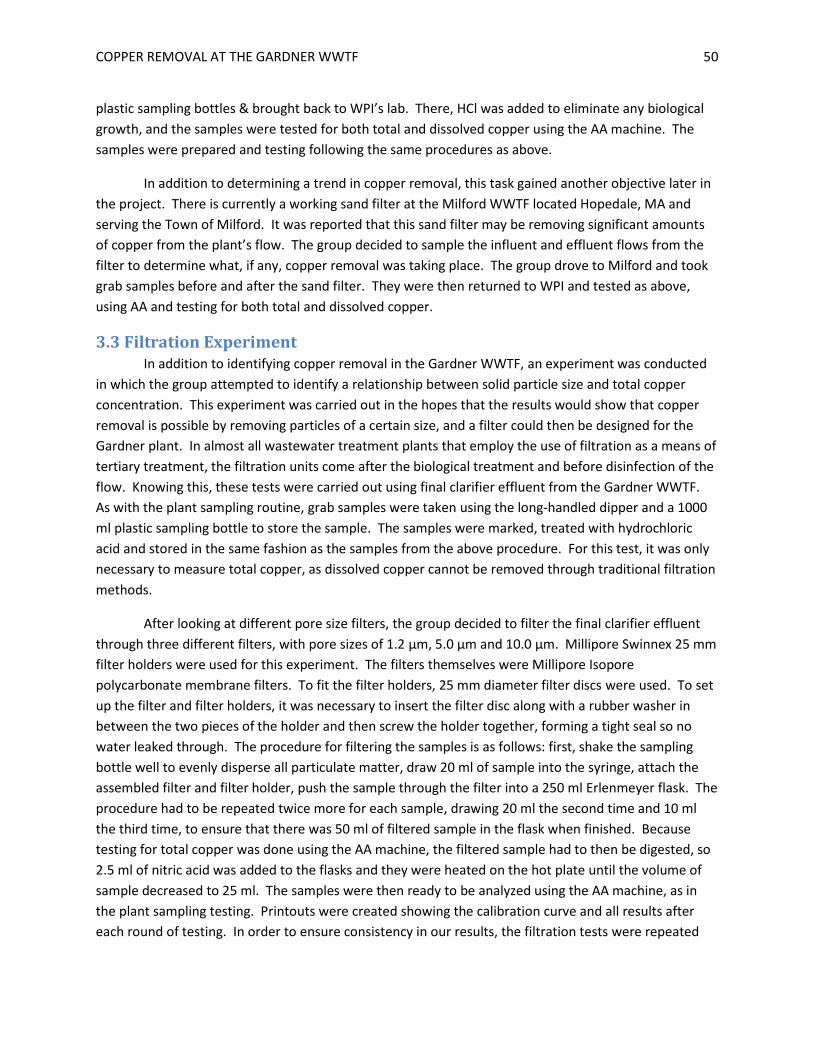
COPPER REMOVAL AT THE GARDNER WWTF 50
plastic sampling bottles & brought back to WPI’s lab. There, HCl was added to eliminate any biological
growth, and the samples were tested for both total and dissolved copper using the AA machine. The
samples were prepared and testing following the same procedures as above.
In addition to determining a trend in copper removal, this task gained another objective later in
the project. There is currently a working sand filter at the Milford WWTF located Hopedale, MA and
serving the Town of Milford. It was reported that this sand filter may be removing significant amounts
of copper from the plant’s flow. The group decided to sample the influent and effluent flows from the
filter to determine what, if any, copper removal was taking place. The group drove to Milford and took
grab samples before and after the sand filter. They were then returned to WPI and tested as above,
using AA and testing for both total and dissolved copper.
3.3 Filtration Experiment In addition to identifying copper removal in the Gardner WWTF, an experiment was conducted
in which the group attempted to identify a relationship between solid particle size and total copper
concentration. This experiment was carried out in the hopes that the results would show that copper
removal is possible by removing particles of a certain size, and a filter could then be designed for the
Gardner plant. In almost all wastewater treatment plants that employ the use of filtration as a means of
tertiary treatment, the filtration units come after the biological treatment and before disinfection of the
flow. Knowing this, these tests were carried out using final clarifier effluent from the Gardner WWTF.
As with the plant sampling routine, grab samples were taken using the long-handled dipper and a 1000
ml plastic sampling bottle to store the sample. The samples were marked, treated with hydrochloric
acid and stored in the same fashion as the samples from the above procedure. For this test, it was only
necessary to measure total copper, as dissolved copper cannot be removed through traditional filtration
methods.
After looking at different pore size filters, the group decided to filter the final clarifier effluent
through three different filters, with pore sizes of 1.2 µm, 5.0 µm and 10.0 µm. Millipore Swinnex 25 mm
filter holders were used for this experiment. The filters themselves were Millipore Isopore
polycarbonate membrane filters. To fit the filter holders, 25 mm diameter filter discs were used. To set
up the filter and filter holders, it was necessary to insert the filter disc along with a rubber washer in
between the two pieces of the holder and then screw the holder together, forming a tight seal so no
water leaked through. The procedure for filtering the samples is as follows: first, shake the sampling
bottle well to evenly disperse all particulate matter, draw 20 ml of sample into the syringe, attach the
assembled filter and filter holder, push the sample through the filter into a 250 ml Erlenmeyer flask. The
procedure had to be repeated twice more for each sample, drawing 20 ml the second time and 10 ml
the third time, to ensure that there was 50 ml of filtered sample in the flask when finished. Because
testing for total copper was done using the AA machine, the filtered sample had to then be digested, so
2.5 ml of nitric acid was added to the flasks and they were heated on the hot plate until the volume of
sample decreased to 25 ml. The samples were then ready to be analyzed using the AA machine, as in
the plant sampling testing. Printouts were created showing the calibration curve and all results after
each round of testing. In order to ensure consistency in our results, the filtration tests were repeated

COPPER REMOVAL AT THE GARDNER WWTF 51
three times during late January and early February. A visual of this experiment being done is shown in
Figure 28.
Figure 28: Filtration experiment testing
3.4 Chemical Precipitation After review of the results of the plant sampling routine and the filtration experiment, a brief
experiment was conducted to analyze the potential for using chemical precipitation as a means of
copper removal. This experiment was carried out to identify if it was possible to precipitate copper out
of the final clarifier effluent at the Gardner WWTF. In order to examine the possibilities of achieving
positive results using the low concentrations of copper at the Gardner WWTF, two control experiments
were first carried out. The first was done by dissolving 3.3479 grams of copper tubing in 100 ml of
deionized water using 10 ml of nitric acid, to achieve a copper concentration of 3,347.9 parts per million
(ppm). The intent of this test was to visually demonstrate to the group the effects of chemical
precipitation on a larger scale and to allow a good visual of flocculation and settling of copper out of the
solution. Figure 29 shows how the copper tubing was dissolved into solution. The second test was
carried out using 100 ml of a sample with a known copper concentration of 10 ppm. This test was done
to see if chemical precipitation was possible with lower copper concentrations.

COPPER REMOVAL AT THE GARDNER WWTF 52
Figure 29: Dissolving copper tubing into solution
The procedure for carrying out the precipitation experiment involved two main parts: raising the
pH of the solution and letting the flocs created settle to the bottom of the sample. The samples were
placed into 150-ml beakers for testing. The beaker was placed on a magnetic stirrer and a stir bar was
dropped to the bottom of the beaker to ensure mixing of the solution. A pH probe was then placed in
the solution to measure the pH as the chemical was added. The chemical selected for use in this
experiment was sodium hydroxide, NaOH. Due to the low concentrations of copper in the samples, a
low concentration of NaOH, 0.25%, was used. Once the pH probe was in place and stirrer turned on the
test could begin. Drops of 0.25% NaOH were added one-by-one until the pH of the solution stabilized
around 8.5. Once this occurred, no more drops were added and the solution was left, with the stirrer
on, for about 10 minutes. Figure 30 below shows the setup for testing using the 10 ppm sample. Once
the 10 minutes was up, the stirrer was turned off and the beaker was left overnight in the lab for settling
to occur. The next day, 25 ml of the solution was drawn using a transfer pipette and placed in a labeled
centrifuge tube and placed in the AA room for testing using the AA machine.
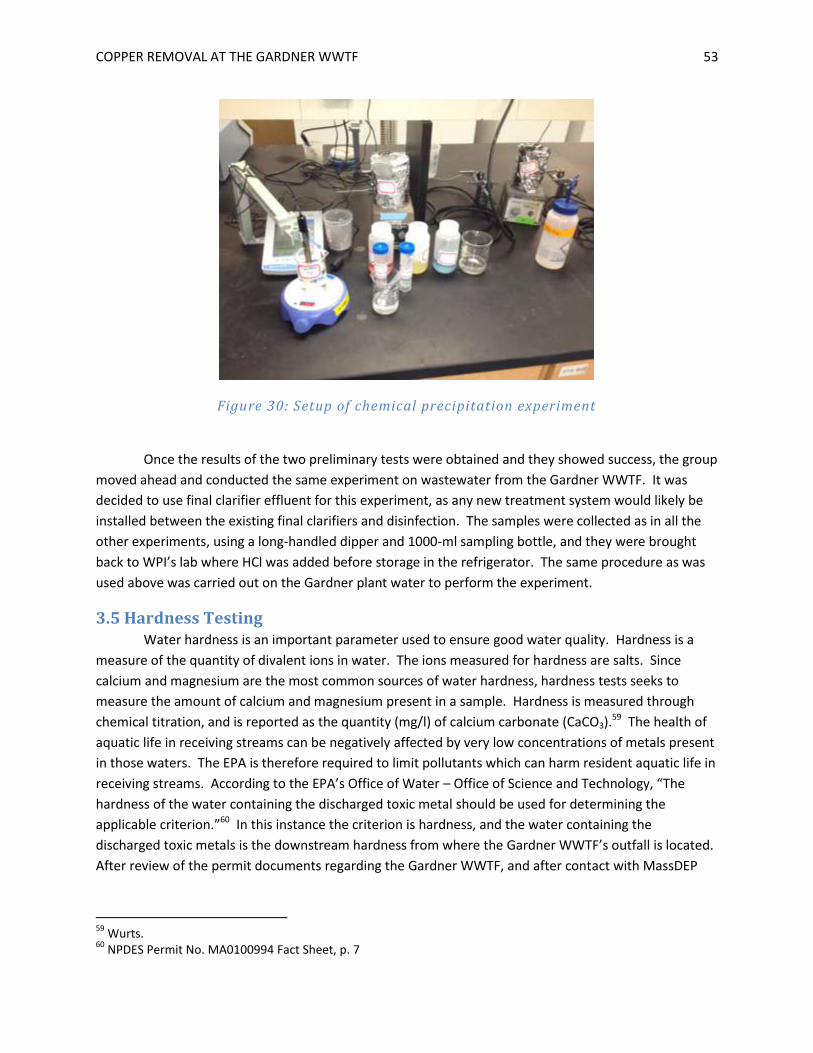
COPPER REMOVAL AT THE GARDNER WWTF 53
Figure 30: Setup of chemical precipitation experiment
Once the results of the two preliminary tests were obtained and they showed success, the group
moved ahead and conducted the same experiment on wastewater from the Gardner WWTF. It was
decided to use final clarifier effluent for this experiment, as any new treatment system would likely be
installed between the existing final clarifiers and disinfection. The samples were collected as in all the
other experiments, using a long-handled dipper and 1000-ml sampling bottle, and they were brought
back to WPI’s lab where HCl was added before storage in the refrigerator. The same procedure as was
used above was carried out on the Gardner plant water to perform the experiment.
3.5 Hardness Testing Water hardness is an important parameter used to ensure good water quality. Hardness is a
measure of the quantity of divalent ions in water. The ions measured for hardness are salts. Since
calcium and magnesium are the most common sources of water hardness, hardness tests seeks to
measure the amount of calcium and magnesium present in a sample. Hardness is measured through
chemical titration, and is reported as the quantity (mg/l) of calcium carbonate (CaCO3).59 The health of
aquatic life in receiving streams can be negatively affected by very low concentrations of metals present
in those waters. The EPA is therefore required to limit pollutants which can harm resident aquatic life in
receiving streams. According to the EPA’s Office of Water – Office of Science and Technology, “The
hardness of the water containing the discharged toxic metal should be used for determining the
applicable criterion.”60 In this instance the criterion is hardness, and the water containing the
discharged toxic metals is the downstream hardness from where the Gardner WWTF’s outfall is located.
After review of the permit documents regarding the Gardner WWTF, and after contact with MassDEP
59
Wurts. 60
NPDES Permit No. MA0100994 Fact Sheet, p. 7
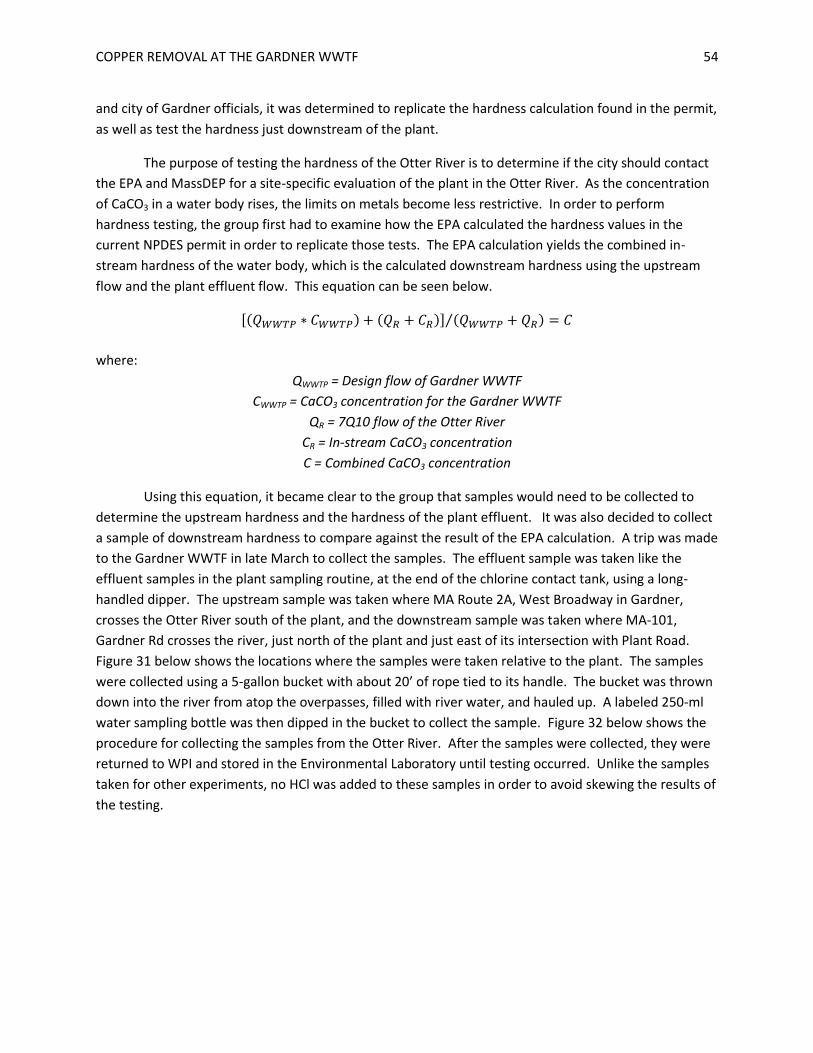
COPPER REMOVAL AT THE GARDNER WWTF 54
and city of Gardner officials, it was determined to replicate the hardness calculation found in the permit,
as well as test the hardness just downstream of the plant.
The purpose of testing the hardness of the Otter River is to determine if the city should contact
the EPA and MassDEP for a site-specific evaluation of the plant in the Otter River. As the concentration
of CaCO3 in a water body rises, the limits on metals become less restrictive. In order to perform
hardness testing, the group first had to examine how the EPA calculated the hardness values in the
current NPDES permit in order to replicate those tests. The EPA calculation yields the combined in-
stream hardness of the water body, which is the calculated downstream hardness using the upstream
flow and the plant effluent flow. This equation can be seen below.
[( ) ( )] ( ) ⁄
where:
QWWTP = Design flow of Gardner WWTF
CWWTP = CaCO3 concentration for the Gardner WWTF
QR = 7Q10 flow of the Otter River
CR = In-stream CaCO3 concentration
C = Combined CaCO3 concentration
Using this equation, it became clear to the group that samples would need to be collected to
determine the upstream hardness and the hardness of the plant effluent. It was also decided to collect
a sample of downstream hardness to compare against the result of the EPA calculation. A trip was made
to the Gardner WWTF in late March to collect the samples. The effluent sample was taken like the
effluent samples in the plant sampling routine, at the end of the chlorine contact tank, using a long-
handled dipper. The upstream sample was taken where MA Route 2A, West Broadway in Gardner,
crosses the Otter River south of the plant, and the downstream sample was taken where MA-101,
Gardner Rd crosses the river, just north of the plant and just east of its intersection with Plant Road.
Figure 31 below shows the locations where the samples were taken relative to the plant. The samples
were collected using a 5-gallon bucket with about 20’ of rope tied to its handle. The bucket was thrown
down into the river from atop the overpasses, filled with river water, and hauled up. A labeled 250-ml
water sampling bottle was then dipped in the bucket to collect the sample. Figure 32 below shows the
procedure for collecting the samples from the Otter River. After the samples were collected, they were
returned to WPI and stored in the Environmental Laboratory until testing occurred. Unlike the samples
taken for other experiments, no HCl was added to these samples in order to avoid skewing the results of
the testing.
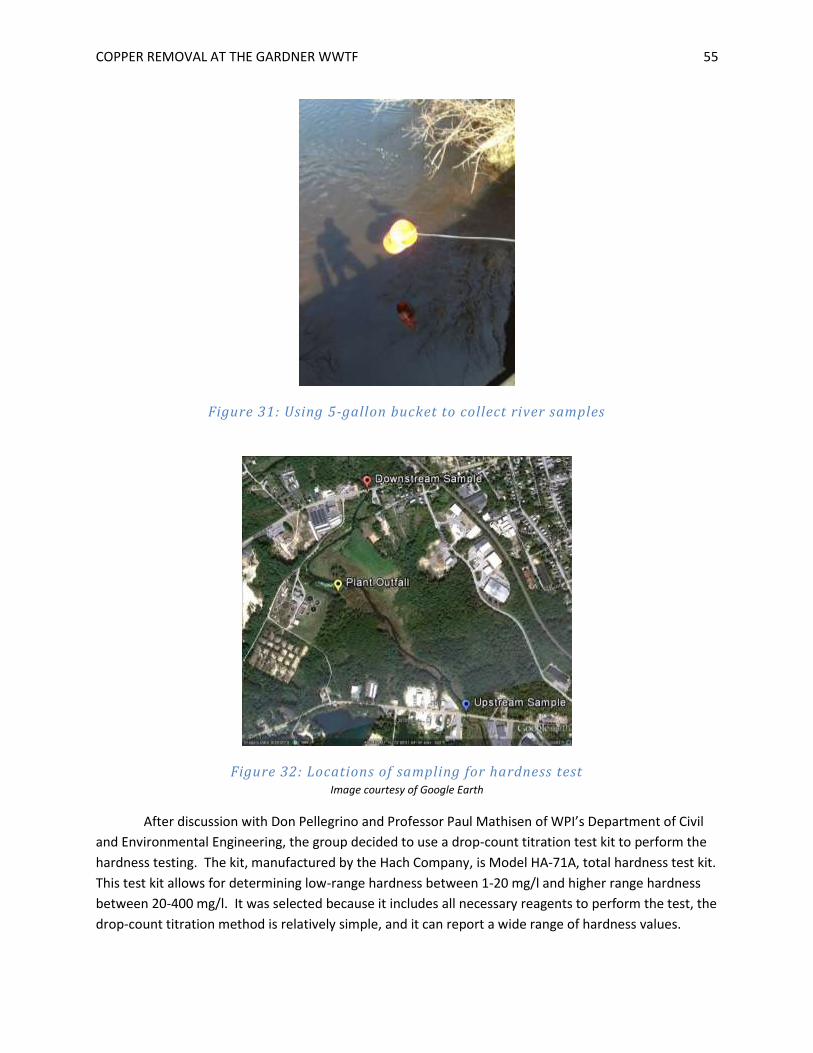
COPPER REMOVAL AT THE GARDNER WWTF 55
Figure 31: Using 5-gallon bucket to collect river samples
Figure 32: Locations of sampling for hardness test Image courtesy of Google Earth
After discussion with Don Pellegrino and Professor Paul Mathisen of WPI’s Department of Civil
and Environmental Engineering, the group decided to use a drop-count titration test kit to perform the
hardness testing. The kit, manufactured by the Hach Company, is Model HA-71A, total hardness test kit.
This test kit allows for determining low-range hardness between 1-20 mg/l and higher range hardness
between 20-400 mg/l. It was selected because it includes all necessary reagents to perform the test, the
drop-count titration method is relatively simple, and it can report a wide range of hardness values.
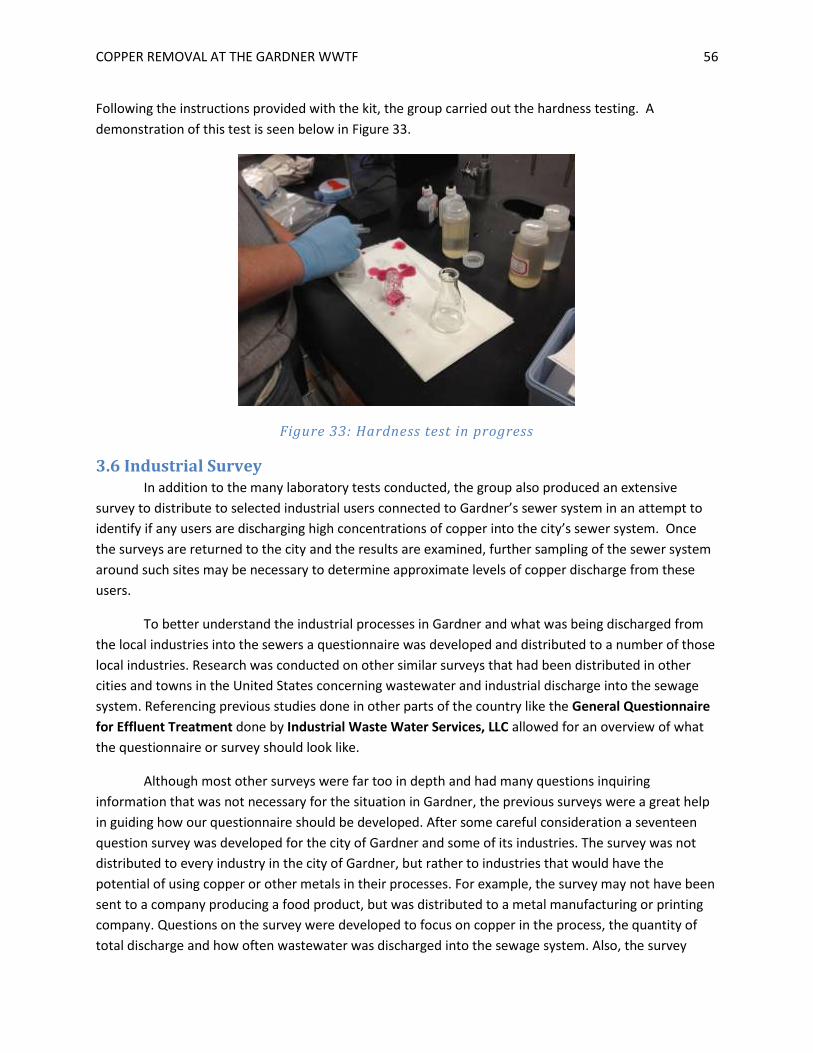
COPPER REMOVAL AT THE GARDNER WWTF 56
Following the instructions provided with the kit, the group carried out the hardness testing. A
demonstration of this test is seen below in Figure 33.
Figure 33: Hardness test in progress
3.6 Industrial Survey In addition to the many laboratory tests conducted, the group also produced an extensive
survey to distribute to selected industrial users connected to Gardner’s sewer system in an attempt to
identify if any users are discharging high concentrations of copper into the city’s sewer system. Once
the surveys are returned to the city and the results are examined, further sampling of the sewer system
around such sites may be necessary to determine approximate levels of copper discharge from these
users.
To better understand the industrial processes in Gardner and what was being discharged from
the local industries into the sewers a questionnaire was developed and distributed to a number of those
local industries. Research was conducted on other similar surveys that had been distributed in other
cities and towns in the United States concerning wastewater and industrial discharge into the sewage
system. Referencing previous studies done in other parts of the country like the General Questionnaire
for Effluent Treatment done by Industrial Waste Water Services, LLC allowed for an overview of what
the questionnaire or survey should look like.
Although most other surveys were far too in depth and had many questions inquiring
information that was not necessary for the situation in Gardner, the previous surveys were a great help
in guiding how our questionnaire should be developed. After some careful consideration a seventeen
question survey was developed for the city of Gardner and some of its industries. The survey was not
distributed to every industry in the city of Gardner, but rather to industries that would have the
potential of using copper or other metals in their processes. For example, the survey may not have been
sent to a company producing a food product, but was distributed to a metal manufacturing or printing
company. Questions on the survey were developed to focus on copper in the process, the quantity of
total discharge and how often wastewater was discharged into the sewage system. Also, the survey

COPPER REMOVAL AT THE GARDNER WWTF 57
inquired as to whether the industries performed any pretreatment prior to discharge into the sewage
system. The survey is located in Appendix B of this report.

COPPER REMOVAL AT THE GARDNER WWTF 58
Chapter 4: Findings The following chapter of this report describes the results of the many tests in the methodology
section. These tests were completed entirely by the group, with the exception of using the AA machine.
This sections demonstrates
4.1 Plant Sampling Routine Samples were collected throughout the treatment system at five locations. These locations are:
influent, primary clarifier, intermediate clarifier, final clarifier, and effluent. The most important results
of these tests would be the copper effluent levels, since that copper level represents the amount of
copper entering the Otter River from the Gardner WWTF. Of six trials conducted, only one was within
the EPA discharge limit of 13.6 ppb, as shown in Figure 34 below. The other trials indicate a copper
discharge level far greater than the EPA limit, although many of the samples taken were grab samples.
This sampling routine proved successful at demonstrating the Gardner WWTFs current copper removal.
In its current stat, the plant removes approximately 70% of the copper present in its influent flow before
discharge into the Otter River, all done without any copper-specific treatment. As can be seen below in
Figure 35, the average influent total copper concentration over the six trips to the plant was 79.21 ppb,
the average effluent total copper concentration was 23.15 ppb. This discharge concentration is still
higher than the permitted limit of the plant, but that can be attributed to the use of grab samples as
opposed to 24-hour composite samples, which are required by the permit. The grab samples represent
only one specific instance in time, and many of the group’s trips to the plant occurred during daily lower
flow conditions, and many of them took place during a winter which saw almost no precipitation.
Figure 34: Total copper effluent concentrations from 6 trials

COPPER REMOVAL AT THE GARDNER WWTF 59
Figure 35: Average results of plant sampling routine
Past studies have shown that the additional flow provided by rainfall has helped in achieving
copper limits within the EPA standards. The extra rainfall will increase the infiltration and inflow of the
plant influent, diluting the copper more than average daily flow. This trend can be seen in the Maguire
study shown below, where the copper levels (taken by composite sampling) are reduced during the
months with heavy rainfall.

COPPER REMOVAL AT THE GARDNER WWTF 60
Figure 36: Copper concentrations from previous Maguire study
Another important finding to note is that overall, the dissolved copper levels existing in the
plant are well below the NPDES permit discharge limit. The dissolved copper levels are not putting the
plant in violation of its NPDES permit. The total copper levels are the problem. This can be seen above
in Figure 35 and below in Figure 37. Removal of dissolved copper, which is more difficult and costly to
do than total copper, is not the recommended approach to take in helping the plant meet its discharge
limit. The total copper on the other hand, is where all efforts to remove copper concentrations should
primarily be focused. The remaining tests conducted for this project all follow upon this conclusion, and
all are aimed first at removing total copper from the plant flow.
Figure 37: Total vs. dissolved copper levels over the 6 trials
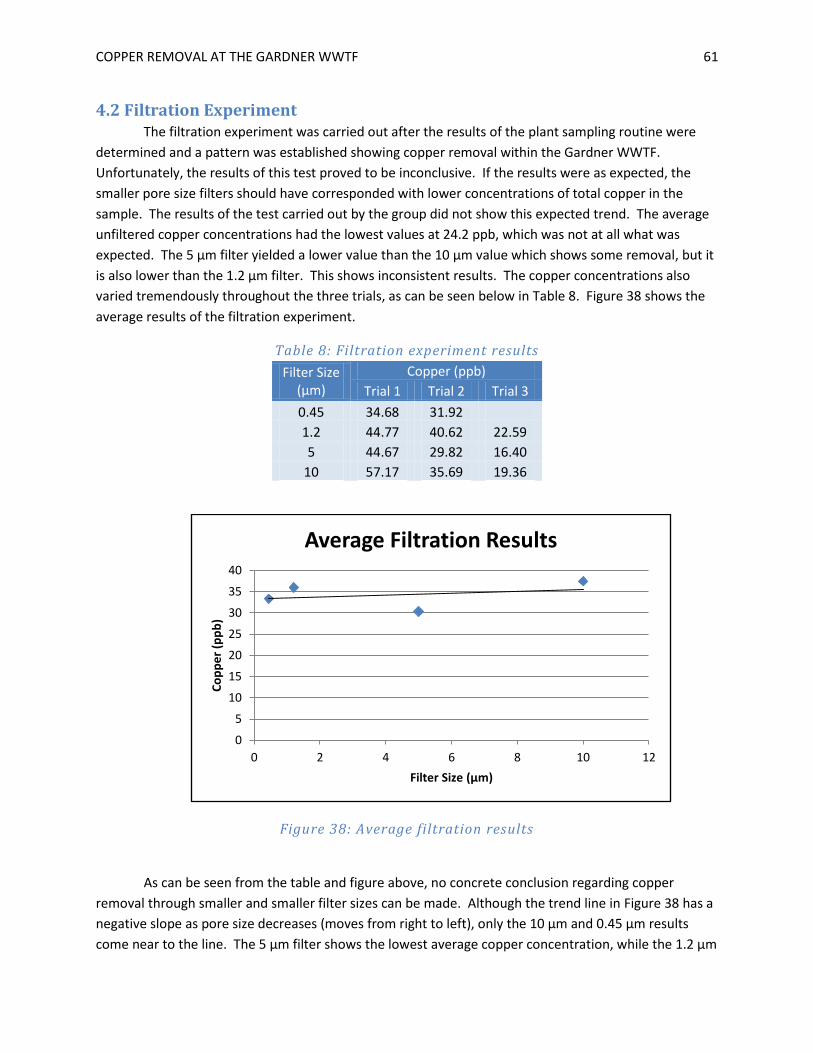
COPPER REMOVAL AT THE GARDNER WWTF 61
4.2 Filtration Experiment The filtration experiment was carried out after the results of the plant sampling routine were
determined and a pattern was established showing copper removal within the Gardner WWTF.
Unfortunately, the results of this test proved to be inconclusive. If the results were as expected, the
smaller pore size filters should have corresponded with lower concentrations of total copper in the
sample. The results of the test carried out by the group did not show this expected trend. The average
unfiltered copper concentrations had the lowest values at 24.2 ppb, which was not at all what was
expected. The 5 µm filter yielded a lower value than the 10 µm value which shows some removal, but it
is also lower than the 1.2 µm filter. This shows inconsistent results. The copper concentrations also
varied tremendously throughout the three trials, as can be seen below in Table 8. Figure 38 shows the
average results of the filtration experiment.
Table 8: Filtration experiment results
Filter Size (µm)
Copper (ppb)
Trial 1 Trial 2 Trial 3
0.45 34.68 31.92
1.2 44.77 40.62 22.59
5 44.67 29.82 16.40
10 57.17 35.69 19.36
Figure 38: Average filtration results
As can be seen from the table and figure above, no concrete conclusion regarding copper
removal through smaller and smaller filter sizes can be made. Although the trend line in Figure 38 has a
negative slope as pore size decreases (moves from right to left), only the 10 µm and 0.45 µm results
come near to the line. The 5 µm filter shows the lowest average copper concentration, while the 1.2 µm
0
5
10
15
20
25
30
35
40
0 2 4 6 8 10 12
Co
pp
er
(pp
b)
Filter Size (µm)
Average Filtration Results
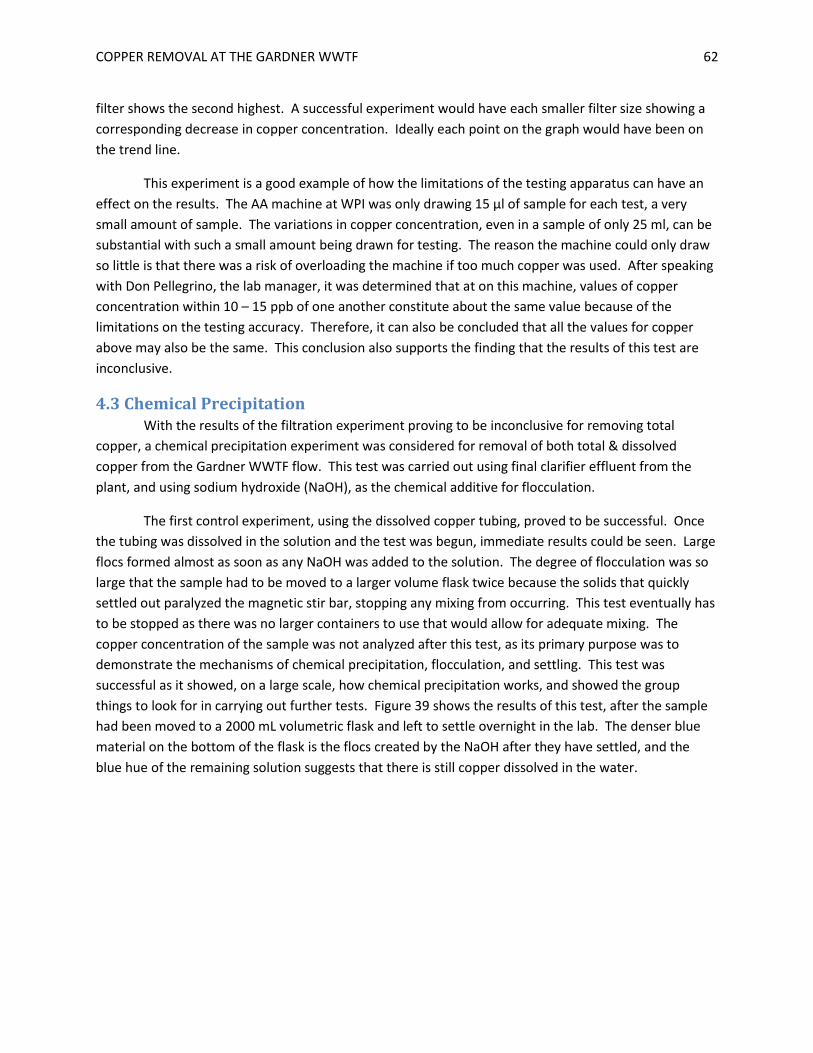
COPPER REMOVAL AT THE GARDNER WWTF 62
filter shows the second highest. A successful experiment would have each smaller filter size showing a
corresponding decrease in copper concentration. Ideally each point on the graph would have been on
the trend line.
This experiment is a good example of how the limitations of the testing apparatus can have an
effect on the results. The AA machine at WPI was only drawing 15 µl of sample for each test, a very
small amount of sample. The variations in copper concentration, even in a sample of only 25 ml, can be
substantial with such a small amount being drawn for testing. The reason the machine could only draw
so little is that there was a risk of overloading the machine if too much copper was used. After speaking
with Don Pellegrino, the lab manager, it was determined that at on this machine, values of copper
concentration within 10 – 15 ppb of one another constitute about the same value because of the
limitations on the testing accuracy. Therefore, it can also be concluded that all the values for copper
above may also be the same. This conclusion also supports the finding that the results of this test are
inconclusive.
4.3 Chemical Precipitation With the results of the filtration experiment proving to be inconclusive for removing total
copper, a chemical precipitation experiment was considered for removal of both total & dissolved
copper from the Gardner WWTF flow. This test was carried out using final clarifier effluent from the
plant, and using sodium hydroxide (NaOH), as the chemical additive for flocculation.
The first control experiment, using the dissolved copper tubing, proved to be successful. Once
the tubing was dissolved in the solution and the test was begun, immediate results could be seen. Large
flocs formed almost as soon as any NaOH was added to the solution. The degree of flocculation was so
large that the sample had to be moved to a larger volume flask twice because the solids that quickly
settled out paralyzed the magnetic stir bar, stopping any mixing from occurring. This test eventually has
to be stopped as there was no larger containers to use that would allow for adequate mixing. The
copper concentration of the sample was not analyzed after this test, as its primary purpose was to
demonstrate the mechanisms of chemical precipitation, flocculation, and settling. This test was
successful as it showed, on a large scale, how chemical precipitation works, and showed the group
things to look for in carrying out further tests. Figure 39 shows the results of this test, after the sample
had been moved to a 2000 mL volumetric flask and left to settle overnight in the lab. The denser blue
material on the bottom of the flask is the flocs created by the NaOH after they have settled, and the
blue hue of the remaining solution suggests that there is still copper dissolved in the water.
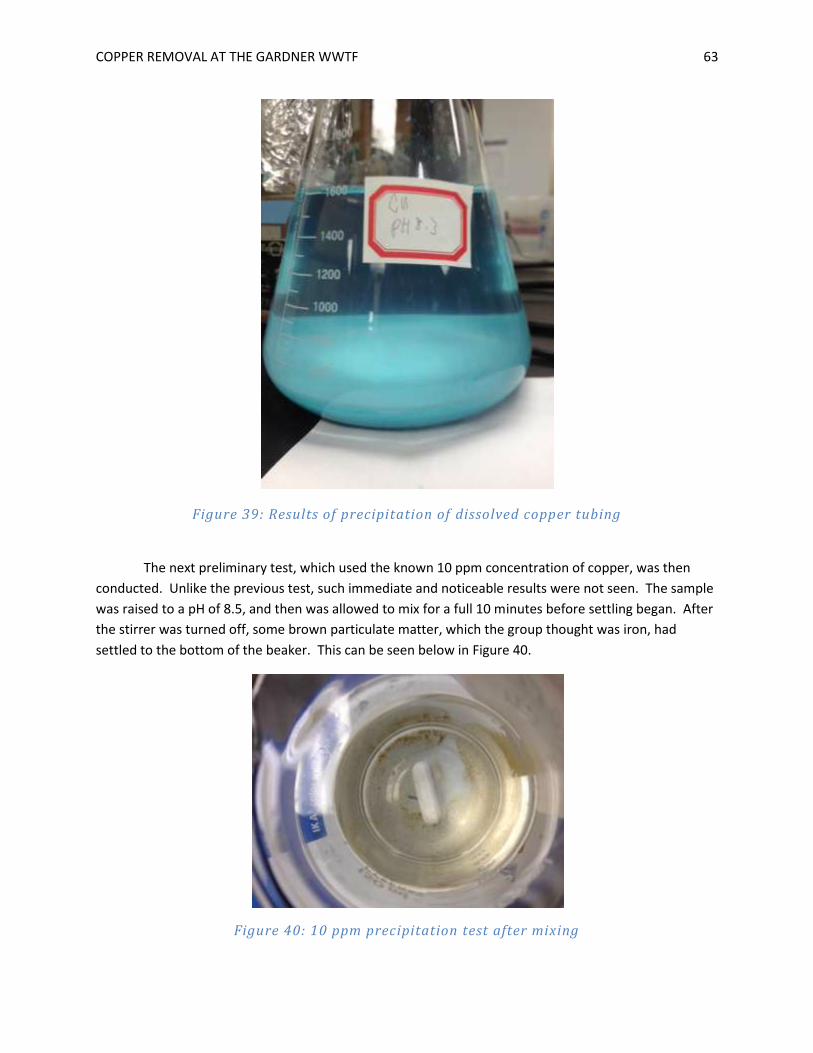
COPPER REMOVAL AT THE GARDNER WWTF 63
Figure 39: Results of precipitation of dissolved copper tubing
The next preliminary test, which used the known 10 ppm concentration of copper, was then
conducted. Unlike the previous test, such immediate and noticeable results were not seen. The sample
was raised to a pH of 8.5, and then was allowed to mix for a full 10 minutes before settling began. After
the stirrer was turned off, some brown particulate matter, which the group thought was iron, had
settled to the bottom of the beaker. This can be seen below in Figure 40.
Figure 40: 10 ppm precipitation test after mixing
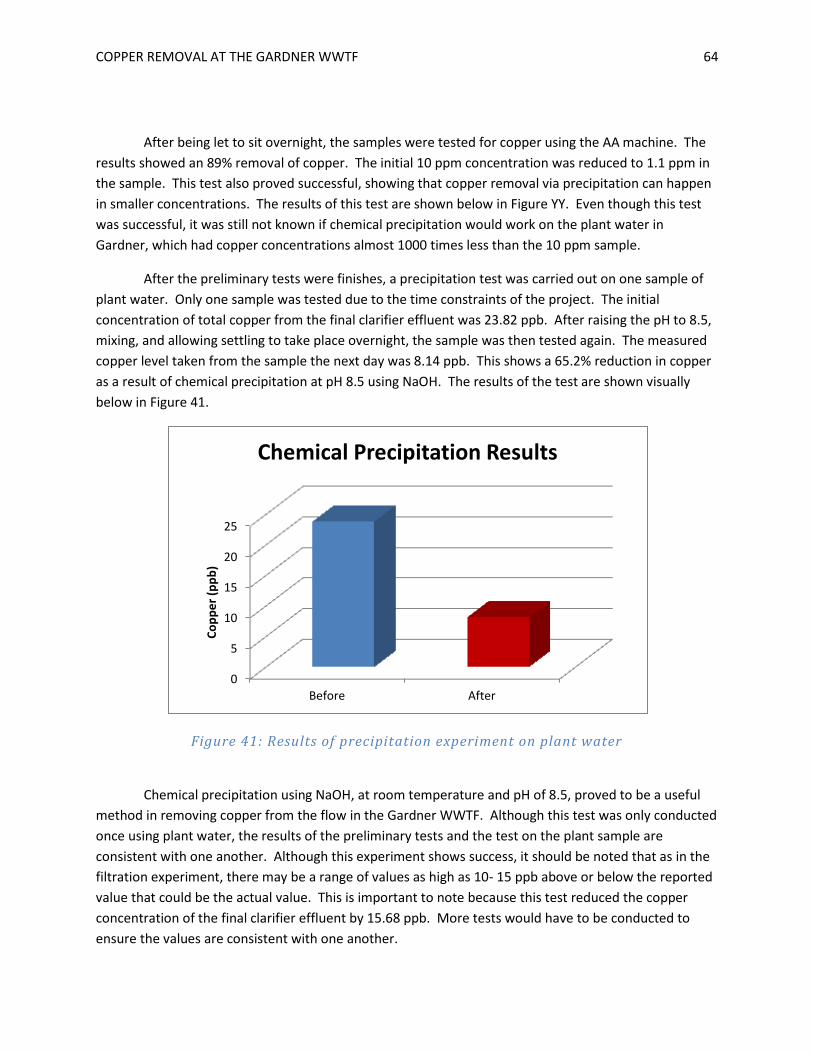
COPPER REMOVAL AT THE GARDNER WWTF 64
After being let to sit overnight, the samples were tested for copper using the AA machine. The
results showed an 89% removal of copper. The initial 10 ppm concentration was reduced to 1.1 ppm in
the sample. This test also proved successful, showing that copper removal via precipitation can happen
in smaller concentrations. The results of this test are shown below in Figure YY. Even though this test
was successful, it was still not known if chemical precipitation would work on the plant water in
Gardner, which had copper concentrations almost 1000 times less than the 10 ppm sample.
After the preliminary tests were finishes, a precipitation test was carried out on one sample of
plant water. Only one sample was tested due to the time constraints of the project. The initial
concentration of total copper from the final clarifier effluent was 23.82 ppb. After raising the pH to 8.5,
mixing, and allowing settling to take place overnight, the sample was then tested again. The measured
copper level taken from the sample the next day was 8.14 ppb. This shows a 65.2% reduction in copper
as a result of chemical precipitation at pH 8.5 using NaOH. The results of the test are shown visually
below in Figure 41.
Figure 41: Results of precipitation experiment on plant water
Chemical precipitation using NaOH, at room temperature and pH of 8.5, proved to be a useful
method in removing copper from the flow in the Gardner WWTF. Although this test was only conducted
once using plant water, the results of the preliminary tests and the test on the plant sample are
consistent with one another. Although this experiment shows success, it should be noted that as in the
filtration experiment, there may be a range of values as high as 10- 15 ppb above or below the reported
value that could be the actual value. This is important to note because this test reduced the copper
concentration of the final clarifier effluent by 15.68 ppb. More tests would have to be conducted to
ensure the values are consistent with one another.
0
5
10
15
20
25
Before After
Co
pp
er
(pp
b)
Chemical Precipitation Results
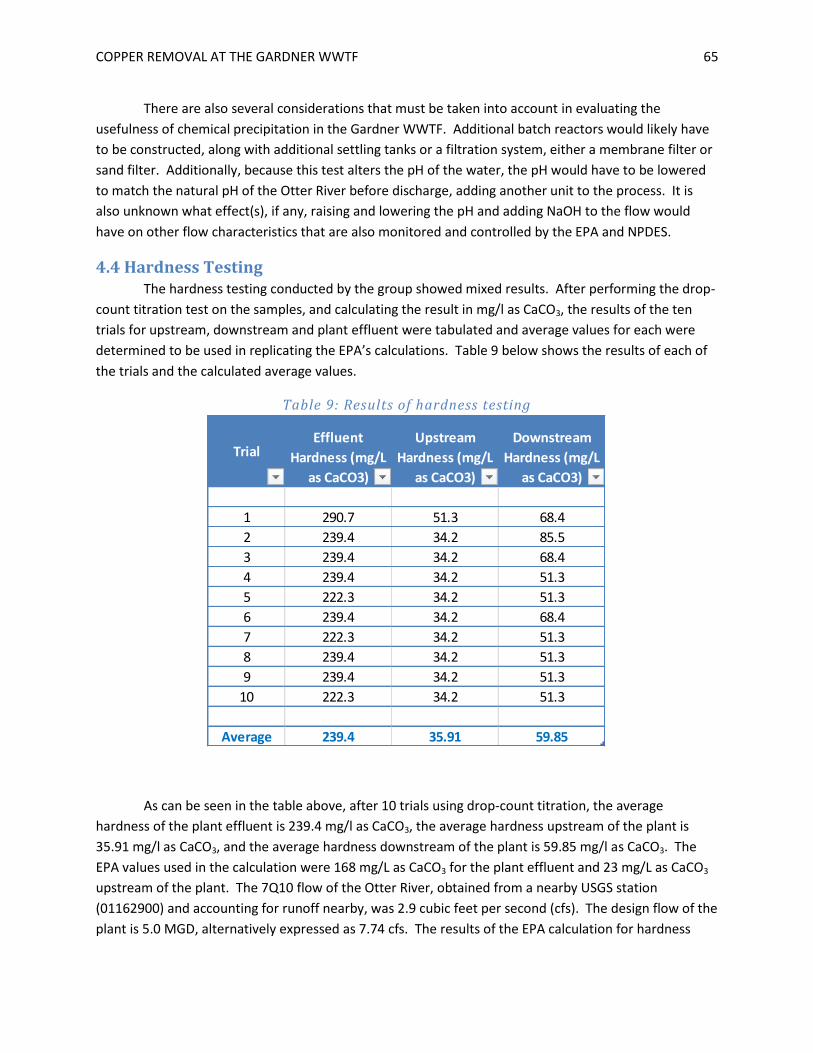
COPPER REMOVAL AT THE GARDNER WWTF 65
There are also several considerations that must be taken into account in evaluating the
usefulness of chemical precipitation in the Gardner WWTF. Additional batch reactors would likely have
to be constructed, along with additional settling tanks or a filtration system, either a membrane filter or
sand filter. Additionally, because this test alters the pH of the water, the pH would have to be lowered
to match the natural pH of the Otter River before discharge, adding another unit to the process. It is
also unknown what effect(s), if any, raising and lowering the pH and adding NaOH to the flow would
have on other flow characteristics that are also monitored and controlled by the EPA and NPDES.
4.4 Hardness Testing The hardness testing conducted by the group showed mixed results. After performing the drop-
count titration test on the samples, and calculating the result in mg/l as CaCO3, the results of the ten
trials for upstream, downstream and plant effluent were tabulated and average values for each were
determined to be used in replicating the EPA’s calculations. Table 9 below shows the results of each of
the trials and the calculated average values.
Table 9: Results of hardness testing
As can be seen in the table above, after 10 trials using drop-count titration, the average
hardness of the plant effluent is 239.4 mg/l as CaCO3, the average hardness upstream of the plant is
35.91 mg/l as CaCO3, and the average hardness downstream of the plant is 59.85 mg/l as CaCO3. The
EPA values used in the calculation were 168 mg/L as CaCO3 for the plant effluent and 23 mg/L as CaCO3
upstream of the plant. The 7Q10 flow of the Otter River, obtained from a nearby USGS station
(01162900) and accounting for runoff nearby, was 2.9 cubic feet per second (cfs). The design flow of the
plant is 5.0 MGD, alternatively expressed as 7.74 cfs. The results of the EPA calculation for hardness
TrialEffluent
Hardness (mg/L
as CaCO3)
Upstream
Hardness (mg/L
as CaCO3)
Downstream
Hardness (mg/L
as CaCO3)
1 290.7 51.3 68.4
2 239.4 34.2 85.5
3 239.4 34.2 68.4
4 239.4 34.2 51.3
5 222.3 34.2 51.3
6 239.4 34.2 68.4
7 222.3 34.2 51.3
8 239.4 34.2 51.3
9 239.4 34.2 51.3
10 222.3 34.2 51.3
Average 239.4 35.91 59.85

COPPER REMOVAL AT THE GARDNER WWTF 66
showed a combined in-stream concentration of 129 mg/L as CaCO3 for hardness. Using the same values
for the plant design flow and the 7Q10 flow of the Otter River, the group’s calculation of hardness is as
follows:
QWWTP = 7.74 cfs
CWWTP = 239.4 mg/L
QR = 2.9 cfs
CR = 35.91 mg/L
[( ) ( )] ( ) ⁄
This calculated value for in-stream hardness is higher than what the EPA calculated, thus leading
the group to consider that the discharge limits for metals could be raised. However, the downstream
sample showed a hardness of 59.85 mg/L as CaCO3. This value is much lower than both what the EPA
and the group each calculated. Because of this, the group cannot definitively say that the hardness of
the Otter River is high enough to push the EPA to recalculate and possibly raise metals limits, because it
could result in lowering the limits. The results of the group’s testing and the EPA testing probably vary
because of the accuracy of testing performed by each. The EPA has more accurate methods of
measuring hardness than a simple drop-count titration. The EPA most likely used a more complex test
method with far more accurate results.
4.5 Regional WWTF Sampling Other WWTF in the surrounding area of Gardner were also tested for copper levels. Samples
were taken from the Marlborough-Westerly plant, Leominster plant, and Upper Blackstone plant. Water
samples were collected and compared at the influent, primary clarifier, and effluent, with the exception
of Leominster, which did not submit a sample from the primary clarifier. Below are graphs that display
the total copper levels and dissolved copper levels of the surrounding WWTFs.

COPPER REMOVAL AT THE GARDNER WWTF 67
Figure 42: Total copper removal from other WWTFs
Figure 43: Dissolved copper removal from other WWTFs
0.00
20.00
40.00
60.00
80.00
100.00
120.00
Influent Primary Clarifier Effluent
Co
pp
er
(pp
b)
Total Copper Removal
Marlborough-Westerly
Leominster
Upper Blackstone
Gardner
0.00
2.00
4.00
6.00
8.00
10.00
12.00
14.00
16.00
Influent Primary Clarifier Effluent
Co
pp
er
(pp
b)
Dissolved Copper Removal
Marlborough-Westerly
Leominster
Upper Blackstone
Gardner
COPPER REMOVAL AT THE GARDNER WWTF 68
Leominster had an extremely low influent copper level of 24.05 ppb, and discharged at 5.43
ppb. Leominster also had low dissolved copper levels entering and exiting the plant at 3.01 ppb and 1.82
ppb respectively. Marlborough-Westerly (MW) also had low total copper levels in comparison to
Gardner. MW’s influent copper level measured at 54.96 ppb, which was reduced to 18.11 ppb. Their
dissolved copper was also significantly reduced from 7.51 ppb to 1.42 ppb. Upper Blackstone saw the
most drastic reduction in total copper from 100.2 ppb to 13.41 ppb, and a dissolved copper reduction
from 3.91 ppb to 1.27 ppb. The Gardner WWTF was graphed as a control to see if Gardner’s copper
levels are similar to those of other plants in the region. The Gardner WWTF had similar trends to the
other WWTFs, although Gardner’s copper reduction was not as high as the others.
Results from the test of the sand filter at the Milford WWTF indicate no influence on copper
removal. The total copper concentration of the filter influent is 24.10 ppb, and effluent total copper
concentration is also 24.10 ppb. Although the sand filter’s primary use is to stop large pathogens from
entering the Ultra Violet treatment stage, the filter should also be able to stop copper. Unfortunately,
only one test was conducted using this sand filter where more tests are necessary to conclude that the
sand filter is not capable of removing copper from wastewater.
COPPER REMOVAL AT THE GARDNER WWTF 69
Chapter 5: Recommendations The group is proposing several recommendations to the city of Gardner after completion and
review of all experiments and findings detailed in this report. These recommendations are intended as
possible next steps to be considered by the city in its efforts to more consistently meet its copper
discharge limit. The recommendations focus on treatment options, further studies, and management
implementations to be incorporated into the plant with upcoming renovations planned by the city.
5.1 Source Studies The first and foremost recommendation from the group to the Gardner Department of Public
Works is to continue work on surveying city industries. A more comprehensive study must be carried
out to attempt to identify any major contributors of copper into the city sewer system. While the
results from the survey sent out by the group do not point to any one industry as a significant
contributor of copper to the sewer system, another study is still recommended. The group’s survey
made it explicitly clear that its purpose was for an academic project, which does not carry much weight
with many business owners, especially if they fear they may be in violation of the city’s sewer ordinance.
If the city and/or its agent or representative sent out another survey, stating that follow up testing will
be conducted at suspected problem sites, business owners may be more inclined to be totally
forthcoming about their processes and chemicals used, etc. The city is encouraged to not only survey
potential high dischargers, but to go out in the field and test sewer flows upstream and downstream of
those users’ discharge points. Once the results of any surveying and/or testing are known, it is
recommended that the city compare those to its copper discharge limit of 300 ppm specified in its sewer
ordinance. If any users are found to be in violation of the ordinance, they city should take enforcement
action on them. City officials may also want to expand such a program to sample residential areas or
other large dischargers, such as the Town of Ashburnham or the North Central Correctional Institution.
Such expansion of the program is also recommended, if the city wishes to do so.
The group strongly encourages the city to initiate a source study before any additional
treatment methods are considered. Undertaking such a study has several benefits. First and foremost,
the cost to carry out a survey and sampling routine with lab testing is much less than the capital cost and
life-cycle costs associated with additional treatment systems at the WWTF. Also, if any user is found to
be in violation of the ordinance, it is their responsibility to meet the limit, not the city’s. Users would
become responsible for designing and implementing pretreatment systems to meet the sewer
ordinance discharge limit. The responsibility of the city would be reduced to testing the effluent; no
capital costs or other risks would have to be assumed by the city. Additionally, conducting a source
study of studies shows that the city is being proactive in its attempts to reduce copper levels in the
WWTF. This could buy the city more time from the EPA and MassDEP before more stringent limits are
imposed or fines are levied against the city. It could also help if the city decides to ask for a higher
temporary limit in order to work on the copper problem.
5.2 Effluent Diversion Another recommendation the group has for the city is to investigate the possibility of diverting
plant flow during low flow conditions in the Otter River. A study would have to be performed, as there

COPPER REMOVAL AT THE GARDNER WWTF 70
are a number of unknown questions about this solution. Such a study would involve finding times in the
past that the Gardner WWTF has not met its copper discharge limit and comparing those times to the
flow in the Otter River. If such instances occurred during low flow conditions in the Otter River,
diversion of the plant effluent may be an option to meet toxicity limits in the river water. The EPA and
MassDEP would have to be contacted, as toxicity limits for water bodies are normally specified in units
of lb/day, while the NPDES discharge limits are given in ppm or ppb. These agencies would also have to
be contacted to see if it would be allowed to use the toxicity limit for the Otter River rather than a plant
discharge limit for metals in the river.
Another aspect of the study for effluent diversion would have to include determining the
feasibility of either storing the effluent in a holding tank for later release into the Otter River or using it
for land application. The study would have to examine regulations and legislation for land use of treated
wastewater. Transport of the water, if land application is a recommended use, would also have to be
investigated. The other option would include storing the effluent on-site and releasing it slowly into the
river when the river flow is higher again. Storage tanks would have to be constructed for this to be a
viable option. If the planned addition of equalization tanks to the plant goes through, it may be possible
to use such tanks to hold the treated wastewater when they are not in use, which would save the city
money. This option is the group’s second recommendation, as it would be less costly than building new
treatment processes. The drawback to this option however is that much research would need to be
done, and it may be possible that the EPA and MassDEP may not allow such diversion and later
discharge.
5.3 Chemical Precipitation The final recommendation for copper removal the group has for the city is to investigate the
possibility of adding chemical precipitation to the WWTF. Of the tests conducted in the laboratory by
the group, the chemical precipitation worked best to remove both total and dissolved copper. In order
for such chemical precipitation to work on such a large scale, new reactors would have to be
constructed at the plant, as well as new settling tanks or a filtration unit. This option is the most costly.
The sheer magnitude of the capital improvements necessary to successfully remove copper through
chemical precipitation may make this option nonviable for the city to consider. This process would also
involve one or more long-term pilot studies at the WWTF. These studies would be necessary in order to
determine sizes of mixing tanks and filtration units, as well as how much or what chemicals would be
used. The effects of adding additional chemicals on other characteristics of the plant water would also
have to be investigated. The group recommends that the city look at this option last, as it would be the
most costly and would still take some time to implement.
5.4 Operations & Management As mentioned before, the study that was conducted by the group determined inconclusive
methods of treating copper in wastewater at the facility. However, this does not mean that in the
future, after other parties perform more research, that the source for high levels of copper in the
wastewater will be discovered. Currently, the source is still undetermined but does not have to remain
that way for the future. Therefore, recommendations have been made for the WWTF for different
COPPER REMOVAL AT THE GARDNER WWTF 71
changes and upgrades to the facility that might better identify any future problem and set up and
infrastructure at the plant that may be ready for the treatment or side treatment of any influent that
cannot be successfully treated at the WWTF. Whether it is implementing a side treatment process for
influent that is determined to need additional treatment before flowing to the WWTF, or establishing a
state of the art data and tracking system at the WWTF, these recommendations serve as a platform for
future problems or instances that may not be relevant and this current point in time.
With upgrades in the near future for the WWTF, there are a few recommendations that can be
considered after studying the process and the details involved with influent wastewater, the treatment
process, and necessary effluent characteristics. After research was performed by this and previous
groups that were studying the copper levels in the wastewater at the WWTF, it was discovered that the
most significant levels of copper in the influent to the plant was discharged from Ashburnham. If this
trend continues, our group recommends the potential of moving the town of Ashburnham’s wastewater
discharge into a side stream process. This would entail taking Ashburnham’s wastewater discharge and
diverting it to its own separate pretreatment process. If Ashburnham’s discharge can be treated
separately before being included in the WWTF influent it would potentially decrease the high levels of
copper, for example, and allow for an easier and much more efficient treatment process. Once a side
stream process is established, it would be possible to divert any other wastewater discharges to that
side stream process. For example, if it is found that high levels of copper are also involved in the
discharge from local industries or the local landfill, those discharges could be treated similarly, bringing
the influent to the WWTF to a much more manageable and treatable level.
Although very difficult to implement in a plant that has already been constructed and operating
for many years, the implementation of SCADA (Supervisory Control and Data Acquisition) system is also
possible. SCADA systems are used to monitor and control a plant. The SCADA system gathers
information about the process, for example, if there is a leak occurring, the SCADA system identifies and
transfers that information to a central site. A SCADA system would eliminate the need for there to be an
operator at the plant at all times and operators could control flow, valves, and treatment equipment
remotely from their home or any other location via computer. Not only could an operator control the
plant but also supervise and monitor at any point from anywhere via the internet. A SCADA system
usually consists of a human-machine interface, a supervisory system, remote terminal units,
programmable logic controllers, a communication infrastructure and other process and analytical
instrumentation. The implementation of a SCADA system would entail a very large investment, a great
amount of time, and the installation of many of the components mentioned previously. However, once
the SCADA system was established at the WWTF it would become unnecessary for an operator to be
present at the facility at all times. Therefore, electricians and maintenance personnel would be the only
absolutely necessary requirement for on-site at the WWTF. If the SCADA system was implemented, it
would save time and money in the long-run by permitting an operator to control and supervise the plant
from virtually anywhere. Problems with the wastewater treatment system would be known immediately
and the operator could then react accordingly whether on site or at a different location.

COPPER REMOVAL AT THE GARDNER WWTF 72
References About the City. Retrieved 2/20, 2012, from http://www.gardner- About the City. Retrieved 2/20, 2012,
from http://www.gardner-ma.gov/Pages/GardnerMA_WebDocs/about
Annual Water Report. (2011). Retrieved 12/6, 2011, from http://www.gardner-
ma.gov/Pages/GardnerMA_WaterSewer/quality.pdf
Broad Street Pump Outbreak. Retrieved 2/10, 2012, from
http://www.ph.ucla.edu/epi/snow/broadstreetpump.html
Burian, S. J., Nix, S. J., Pitt, R. E., & Durans, S. R. (2000). Urban wastewater management. Journal of
Urban Technology, 7(3), 33-62. Retrieved from
http://sewerhistory.org/articles/whregion/urban_wwm_mgmt/urban_wwm_mgmt.pdf
Ekster, A. & Jenkins, D. (1996). Nickel and copper removal at the San Jose/Santa Clara Water Pollution
Control Plant. Water Environment Research, 68(7), 1172-1178.
EPA, 2000, The History of Drinking Water Treatment, Environmental Protection Agency, Office of Water
(4606), Fact Sheet EPA-816-F-00-006, United States
Facts & Figures: By the Numbers. (2012). Retrieved 1/20, 2012, from
http://www.unitedwater.com/facts-and-figures.aspx
Greenberg, Arnold E., and R. Rhodes Trussell. Standard Methods for the Examination of Water and
Wastewater. Ed. Lenore S. Clesceri. 17th ed. Washington, D.C.: American Public Health
Association, 1989.
Maag, Benoit, Duane Boning and Bettina Voelker "Assessing the Environmental Impact of Copper CMP."
Massachusetts Institute of Technology, Oct. 2000. Web. 2 Mar. 2012. http://www-
mtl.mit.edu/researchgroups/Metrology/PAPERS/SemiInternationalOct2000/
Onsite Wastewater Demonstration Project. Retrieved 2/5, 2012, from
http://www.cefns.nau.edu/Projects/WDP/resources/treatmentsyst/Cesspool.htm
Our Mission and What We Do. Retrieved 1/16, 2012, from
http://www.epa.gov/aboutepa/whatwedo.html
Photomultiplier Tube (PMT). CHP. Retrieved 2/7, 2012, from <http://www.files.chem.vt.edu/chem-
ed/optics/detector/pmt.html>.
Public Access – When and How was the EPA Created?. Retrieved 1/21, 2012, from
http://publicaccess.supportportal.com/link/portal/23002/23012/Article/23723/When-and-how-
was-the-EPA-created
COPPER REMOVAL AT THE GARDNER WWTF 73
Sprague, Nicolle M. "Copper in the Urban Water Cycle: Sources and Sinks, Benefits and Detriments, and
Corrosion in Soft Waters." ETDs. Virginia Technical Institute, 7 Apr. 1999. Web. 2 Mar. 2012.
<http://scholar.lib.vt.edu/theses/available/etd-051899-145401/>.
The Sanitary Vault Privy: A Planning Guide and Minimum Requirements For the Construction of Vault
Privies. (1986). Retrieved 2/6, 2012, from http://www.in.gov/isdh/files/sanitary_privy.pdf
United Water in Gardner, Massachusetts. (2011). Retrieved 12/6, 2011, from
http://www.unitedwater.com/brochures/UW_8.5x11_Project_Flyer_Gardner_lowRes.pdf
Viessman, Jr., W., Hammer, M. J., Perez, E. M., & Chadik, P. A. (2009). Water supply & pollution control.
(8 ed.). Upper Saddle River, NJ: Pearson Education.
Wurts, William A. Understanding Water Hardness. Retrieved 3/15, 2012, from
<http://www.ca.uky.edu/wkrec/Hardness.htm>.

COPPER REMOVAL AT THE GARDNER WWTF 74
Appendix A: Results of Laboratory Experiments
Plant Sampling Routine:
Other WWTF Testing:
Filtration Experiment:
Filter Size (µm)
Copper (ppb)
Trial 1 Trial 2 Trial 3 Average
0.45 34.68 31.92
33.3
1.2 44.77 40.62 22.59 35.99333333
5 44.67 29.82 16.40 30.29666667
10 57.17 35.69 19.36 37.40666667
Unfiltered 20.85 32.23 19.56 24.21333333 Filter Paper 35.93
35.93

COPPER REMOVAL AT THE GARDNER WWTF 75
Hardness Testing:
Trial Effluent Hardness (mg/L as CaCO3)
Upstream Hardness (mg/L
as CaCO3)
Downstream Hardness (mg/L
as CaCO3)
1 290.7 51.3 68.4
2 239.4 34.2 85.5
3 239.4 34.2 68.4
4 239.4 34.2 51.3
5 222.3 34.2 51.3
6 239.4 34.2 68.4
7 222.3 34.2 51.3
8 239.4 34.2 51.3
9 239.4 34.2 51.3
10 222.3 34.2 51.3
Average 239.4 35.91 59.85
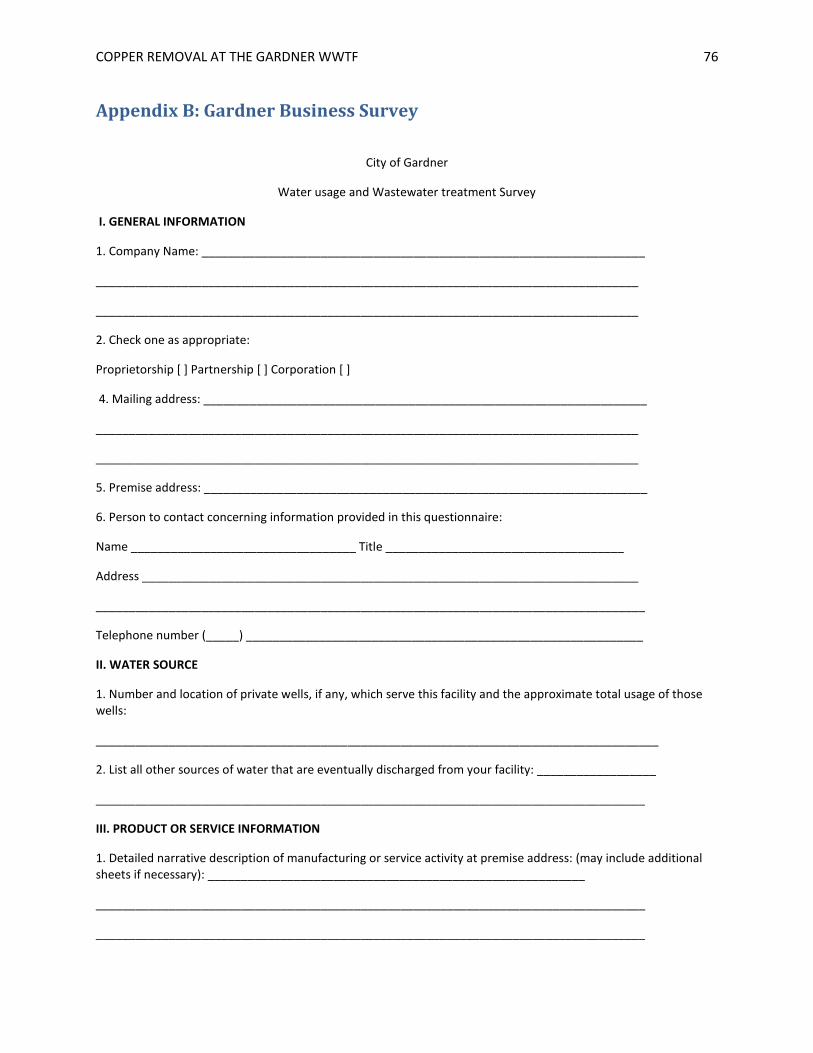
COPPER REMOVAL AT THE GARDNER WWTF 76
Appendix B: Gardner Business Survey
City of Gardner
Water usage and Wastewater treatment Survey
I. GENERAL INFORMATION
1. Company Name: ___________________________________________________________________
__________________________________________________________________________________
__________________________________________________________________________________
2. Check one as appropriate:
Proprietorship [ ] Partnership [ ] Corporation [ ]
4. Mailing address: ___________________________________________________________________
__________________________________________________________________________________
__________________________________________________________________________________
5. Premise address: ___________________________________________________________________
6. Person to contact concerning information provided in this questionnaire:
Name __________________________________ Title ____________________________________
Address ___________________________________________________________________________
___________________________________________________________________________________
Telephone number (_____) ____________________________________________________________
II. WATER SOURCE
1. Number and location of private wells, if any, which serve this facility and the approximate total usage of those wells:
_____________________________________________________________________________________
2. List all other sources of water that are eventually discharged from your facility: __________________
___________________________________________________________________________________
III. PRODUCT OR SERVICE INFORMATION
1. Detailed narrative description of manufacturing or service activity at premise address: (may include additional sheets if necessary): _________________________________________________________
___________________________________________________________________________________
___________________________________________________________________________________
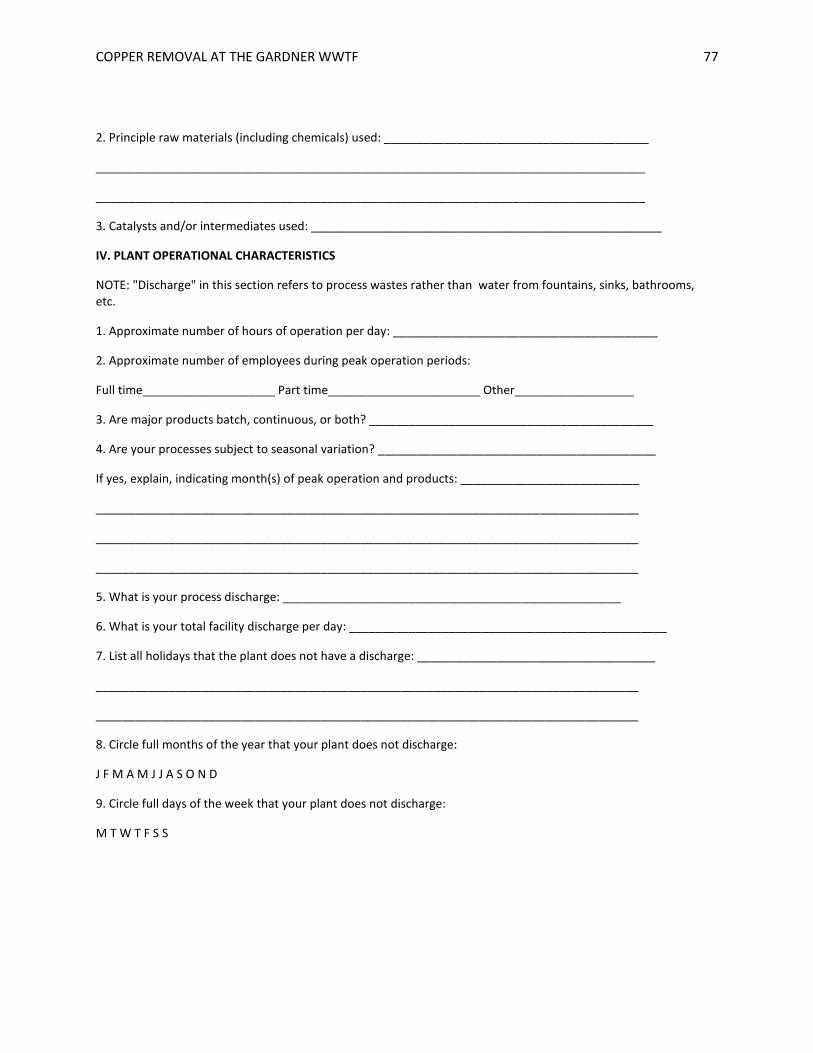
COPPER REMOVAL AT THE GARDNER WWTF 77
2. Principle raw materials (including chemicals) used: ________________________________________
___________________________________________________________________________________
___________________________________________________________________________________
3. Catalysts and/or intermediates used: _____________________________________________________
IV. PLANT OPERATIONAL CHARACTERISTICS
NOTE: "Discharge" in this section refers to process wastes rather than water from fountains, sinks, bathrooms, etc.
1. Approximate number of hours of operation per day: ________________________________________
2. Approximate number of employees during peak operation periods:
Full time____________________ Part time_______________________ Other__________________
3. Are major products batch, continuous, or both? ___________________________________________
4. Are your processes subject to seasonal variation? __________________________________________
If yes, explain, indicating month(s) of peak operation and products: ___________________________
__________________________________________________________________________________
__________________________________________________________________________________
__________________________________________________________________________________
5. What is your process discharge: ___________________________________________________
6. What is your total facility discharge per day: ________________________________________________
7. List all holidays that the plant does not have a discharge: ____________________________________
__________________________________________________________________________________
__________________________________________________________________________________
8. Circle full months of the year that your plant does not discharge:
J F M A M J J A S O N D
9. Circle full days of the week that your plant does not discharge:
M T W T F S S

COPPER REMOVAL AT THE GARDNER WWTF 78
10. Check all processes in the Industrial Categories listed below which generate wastewater or waste sludge at this plant's location:
1. [ ] Adhesives 21. [ ] Paint & Ink
2. [ ] Aluminum Forming 22. [ ] Pesticides
3. [ ] Automats & Other Laundries 23. [ ] Petroleum Refining
4. [ ] Battery Manufacturing 24. [ ] Pharmaceuticals
5. [ ] Coal Mining 25. [ ] Photographic Supplies
6. [ ] Coil Coating 26. [ ] Plastic & Synthetic Materials
7. [ ] Copper forming 27. [ ] Plastics Processing
8. [ ] Electric and Electronic Components 28. [ ] Porcelain Enamel
9. [ ] Electroplating 29. [ ] Printing & Publishing
10. [ ] Explosives Manufacturing 30. [ ] Pulp & Paper
11. [ ] Foundries 31. [ ] Rubber
12. [ ] Gum & Wood Chemicals 32. [ ] Soaps & Detergents
13. [ ] Inorganic Chemicals 33. [ ] Steam Electric
14. [ ] Iron & Steel 34. [ ] Textile Mills
15. [ ] Leather Tanning & Finishing 35. [ ] Timber
16. [ ] Mechanical Products
17. [ ] Metal Finishing
18. [ ] Nonferrous Metals
19. [ ] Ore Mining
20. [ ] Organic Chemicals
36. Other Processes
[ ] Dairy Products
[ ] Slaughter, Meat Packing, Rendering
[ ] Food or Edible Products Processing
[ ] Beverage Bottling
[ ] Other:__________________________________________________________________
[ ] NONE OF THE ABOVE

COPPER REMOVAL AT THE GARDNER WWTF 79
V. WASTEWATER TREATMENT AND DISCHARGE
1. Check all pretreatment devices or processes used for treating wastewater and/or sludge.
( ) Air flotation
( ) Centrifuge
( ) Chemical precipitation
( ) Chlorination
( ) Cyclone
( ) Filtration
( ) Flow equalization
( ) Grease trap
( ) Grit removal
( ) Ion exchange
( ) Neutralization, pH correction
( ) Ozonation
( ) Reverse osmosis
( ) Screen
( ) Sedimentation
( ) Septic tank
( ) Solvent separation
( ) Spill protection
( ) Sump
( ) Biological treatment, type:_____________________________________________________
( ) Grease or oil separation type:___________________________________________________
( ) Rainwater diversion or storage:_________________________________________________
( ) Other physical treatment:______________________________________________________
( ) Other chemical treatment:______________________________________________________
( ) NO PRETREATMENT
2. How often are the above facilities checked for proper operation and/or cleaned?
___________________________________________________________________________________
___________________________________________________________________________________
3. Does the plant discharge water into the City storm sewer or an open drainage way? If not, skip to question 3. If so, give locations and approximate amounts of discharges:
____________________________________________________________________________________
____________________________________________________________________________________
____________________________________________________________________________________

COPPER REMOVAL AT THE GARDNER WWTF 80
What is the nature of this water (cooling, process, wash, etc…) _________________________________
____________________________________________________________________________________
4. List all other sewage or sludge disposal systems or contract waste haulers, which are utilized:
____________________________________________________________________________________
____________________________________________________________________________________
____________________________________________________________________________________
If waste haulers are utilized, please explain what is hauled, and where it is hauled to:
____________________________________________________________________________________
____________________________________________________________________________________
____________________________________________________________________________________
5. List all environmental control permits now held or issued to this facility: ________________________
____________________________________________________________________________________
____________________________________________________________________________________
6. If any wastewater analyses have been performed on the process discharge(s) from your facilities, attach a copy of the most recent data to this questionnaire. Be sure to include the date of the analysis, name of laboratory performing the analysis, and location(s) from which the sample(s) were taken (attach sketches, plans, etc., as necessary).
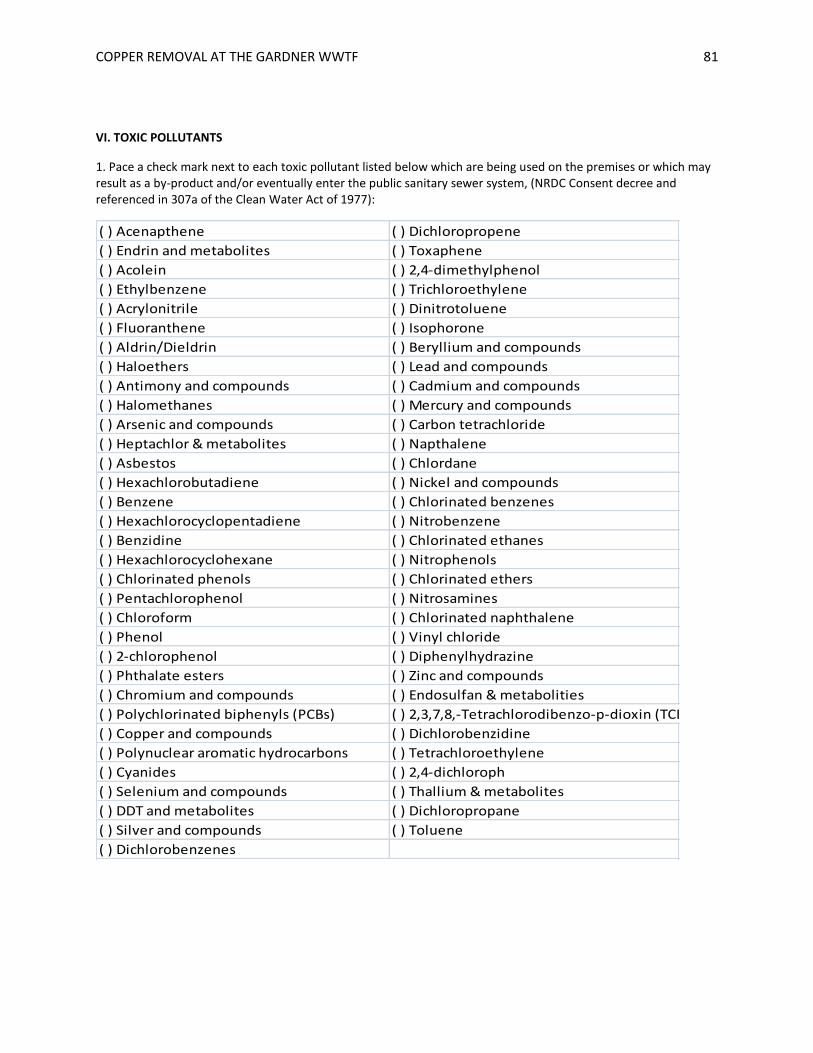
COPPER REMOVAL AT THE GARDNER WWTF 81
VI. TOXIC POLLUTANTS
1. Pace a check mark next to each toxic pollutant listed below which are being used on the premises or which may result as a by-product and/or eventually enter the public sanitary sewer system, (NRDC Consent decree and referenced in 307a of the Clean Water Act of 1977):
( ) Acenapthene ( ) Dichloropropene
( ) Endrin and metabolites ( ) Toxaphene
( ) Acolein ( ) 2,4-dimethylphenol
( ) Ethylbenzene ( ) Trichloroethylene
( ) Acrylonitrile ( ) Dinitrotoluene
( ) Fluoranthene ( ) Isophorone
( ) Aldrin/Dieldrin ( ) Beryllium and compounds
( ) Haloethers ( ) Lead and compounds
( ) Antimony and compounds ( ) Cadmium and compounds
( ) Halomethanes ( ) Mercury and compounds
( ) Arsenic and compounds ( ) Carbon tetrachloride
( ) Heptachlor & metabolites ( ) Napthalene
( ) Asbestos ( ) Chlordane
( ) Hexachlorobutadiene ( ) Nickel and compounds
( ) Benzene ( ) Chlorinated benzenes
( ) Hexachlorocyclopentadiene ( ) Nitrobenzene
( ) Benzidine ( ) Chlorinated ethanes
( ) Hexachlorocyclohexane ( ) Nitrophenols
( ) Chlorinated phenols ( ) Chlorinated ethers
( ) Pentachlorophenol ( ) Nitrosamines
( ) Chloroform ( ) Chlorinated naphthalene
( ) Phenol ( ) Vinyl chloride
( ) 2-chlorophenol ( ) Diphenylhydrazine
( ) Phthalate esters ( ) Zinc and compounds
( ) Chromium and compounds ( ) Endosulfan & metabolities
( ) Polychlorinated biphenyls (PCBs) ( ) 2,3,7,8,-Tetrachlorodibenzo-p-dioxin (TCDD)
( ) Copper and compounds ( ) Dichlorobenzidine
( ) Polynuclear aromatic hydrocarbons ( ) Tetrachloroethylene
( ) Cyanides ( ) 2,4-dichloroph
( ) Selenium and compounds ( ) Thallium & metabolites
( ) DDT and metabolites ( ) Dichloropropane
( ) Silver and compounds ( ) Toluene
( ) Dichlorobenzenes
COPPER REMOVAL AT THE GARDNER WWTF 82
SIGNATURE PAGE
I certify under penalty of law that this document and all attachments were prepared under my direction or supervision in accordance with a system designed to assure that qualified personnel properly gather and evaluate the information submitted. Based on my inquiry of the person or persons who manage the system, or those persons directly responsible for gathering the information, the information submitted is, to the best of my knowledge and belief, true, accurate, and complete. I am aware that there are significant penalties for submitting false information, including the possibility of fine and imprisonment for knowing violations.”
Signature: _______________________________________________ Date:____________________
Name and title of signing official: ______________________________________________________

COPPER REMOVAL AT THE GARDNER WWTF 83
Appendix C: Results from AA Testing
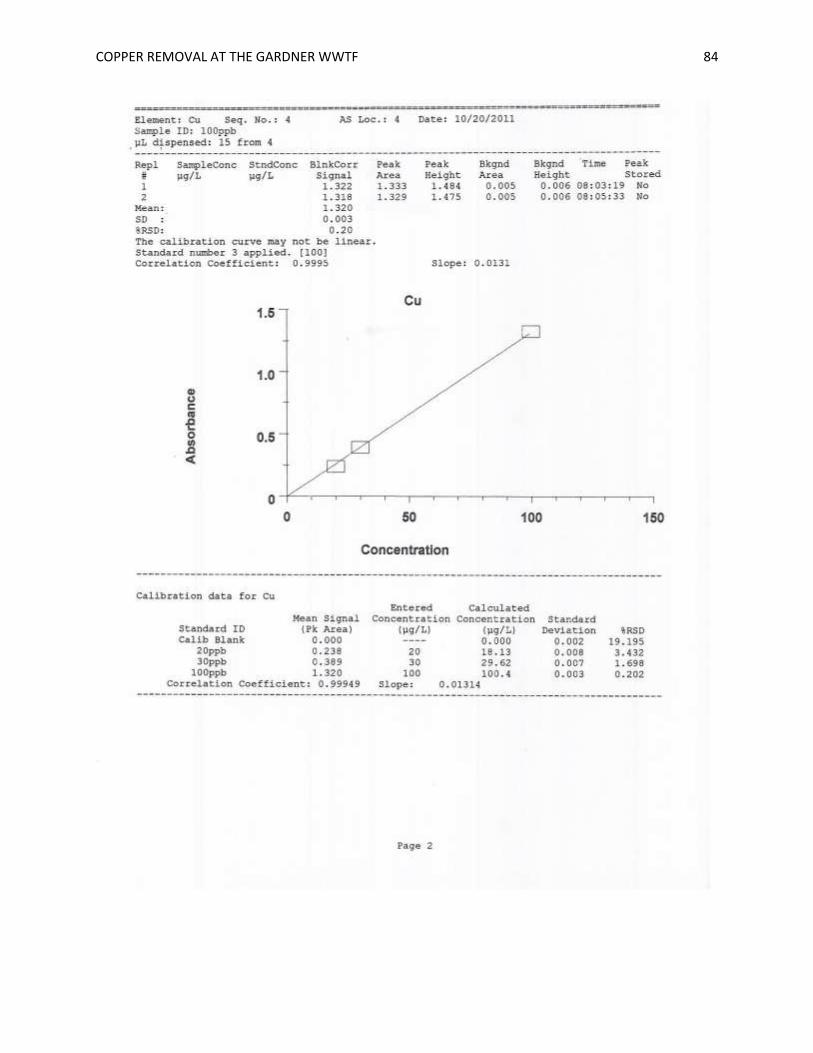
COPPER REMOVAL AT THE GARDNER WWTF 84
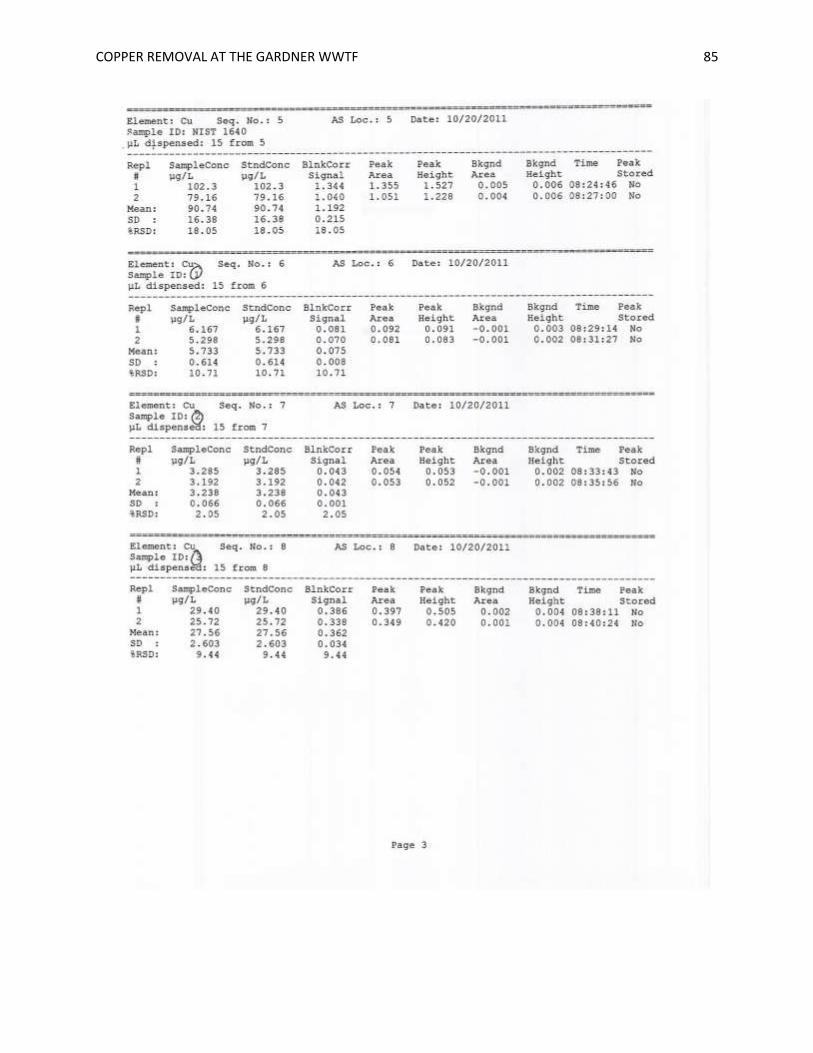
COPPER REMOVAL AT THE GARDNER WWTF 85
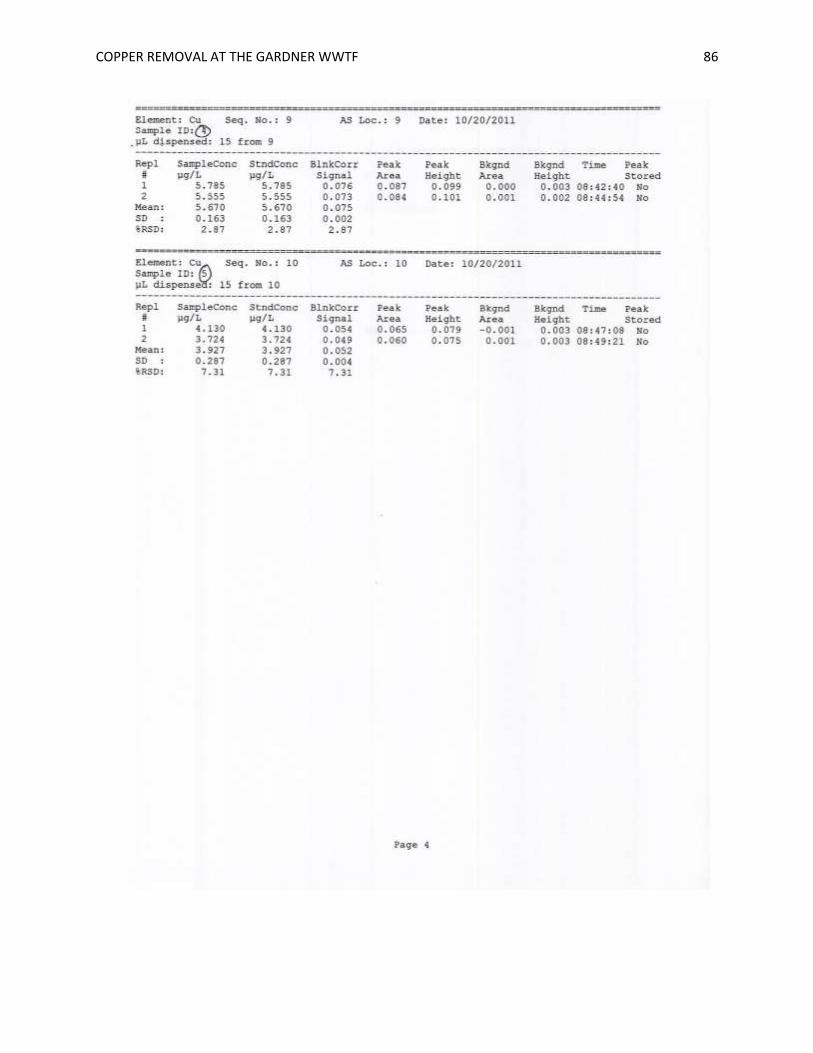
COPPER REMOVAL AT THE GARDNER WWTF 86
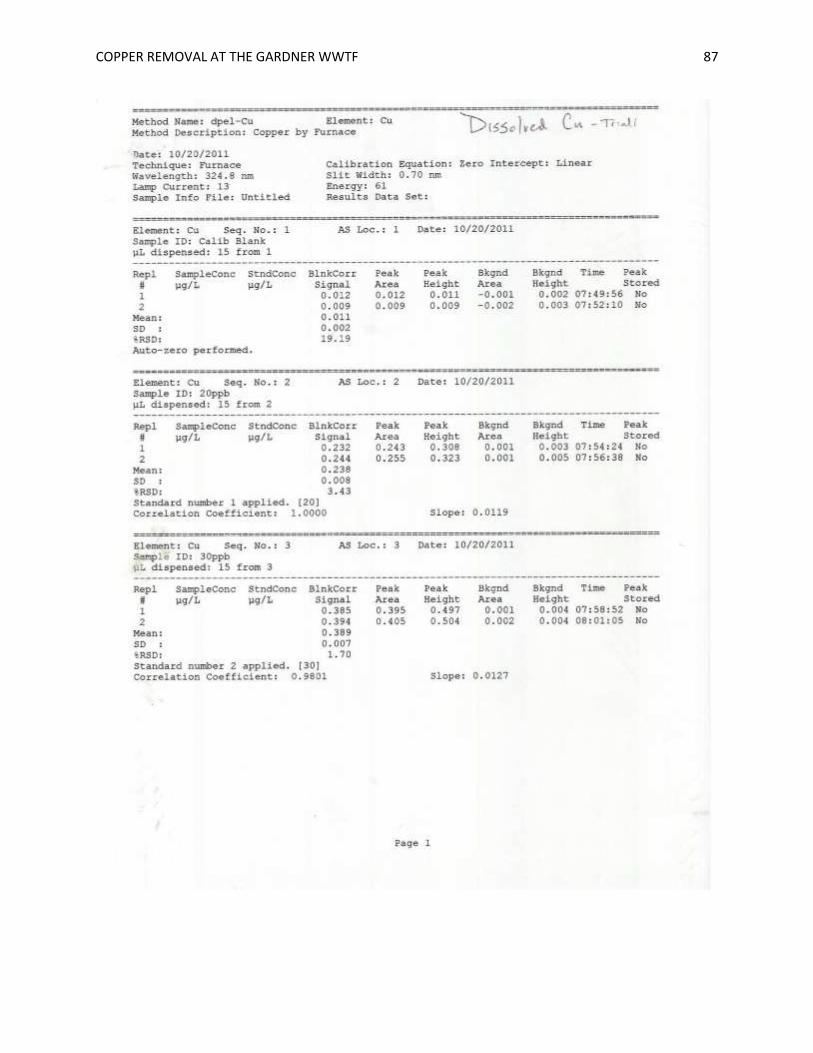
COPPER REMOVAL AT THE GARDNER WWTF 87
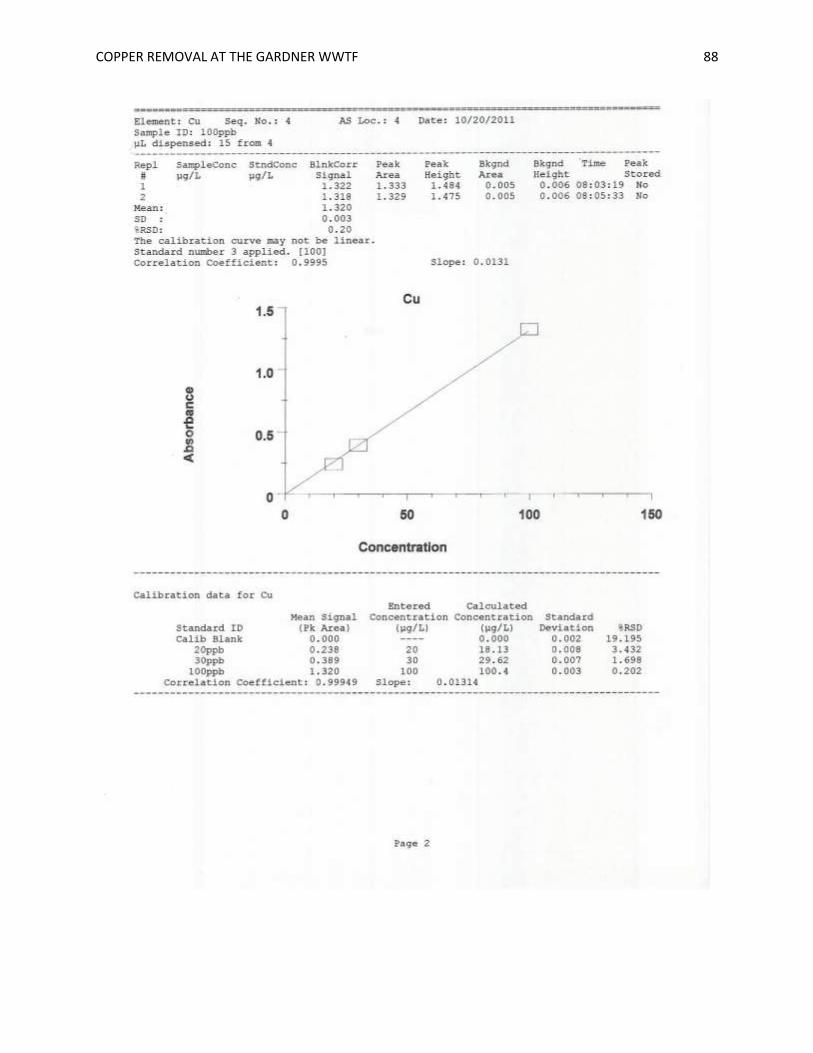
COPPER REMOVAL AT THE GARDNER WWTF 88
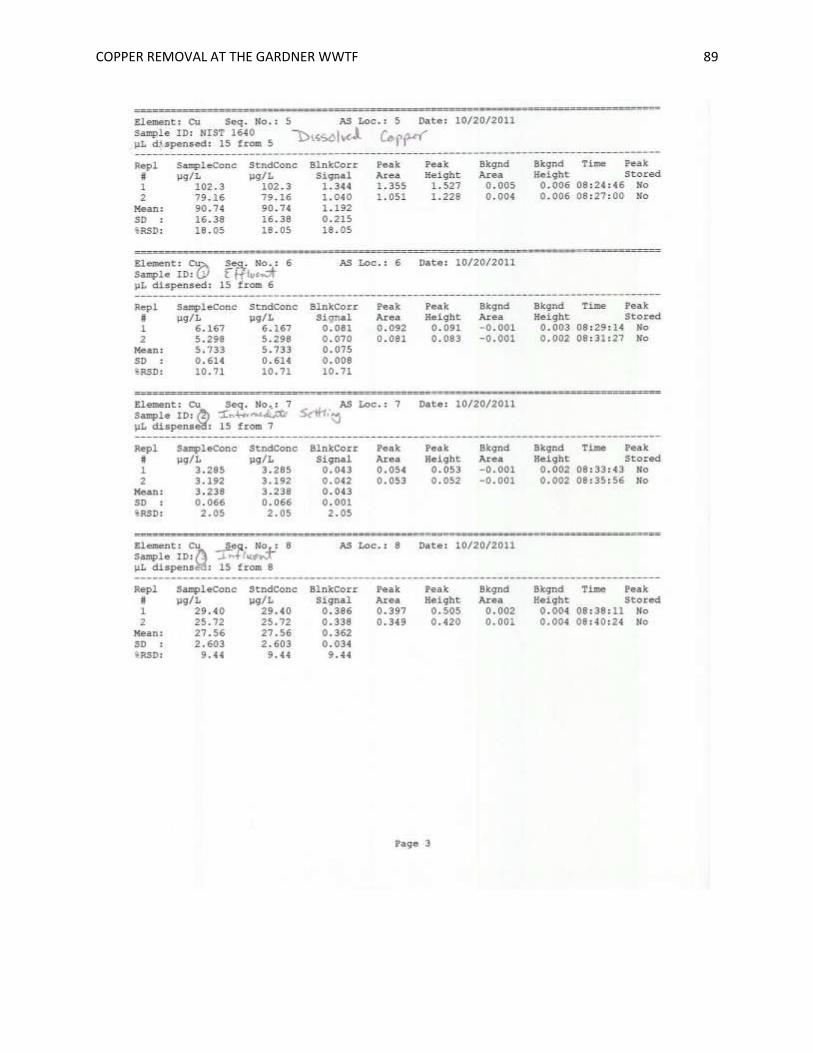
COPPER REMOVAL AT THE GARDNER WWTF 89

COPPER REMOVAL AT THE GARDNER WWTF 90

COPPER REMOVAL AT THE GARDNER WWTF 91
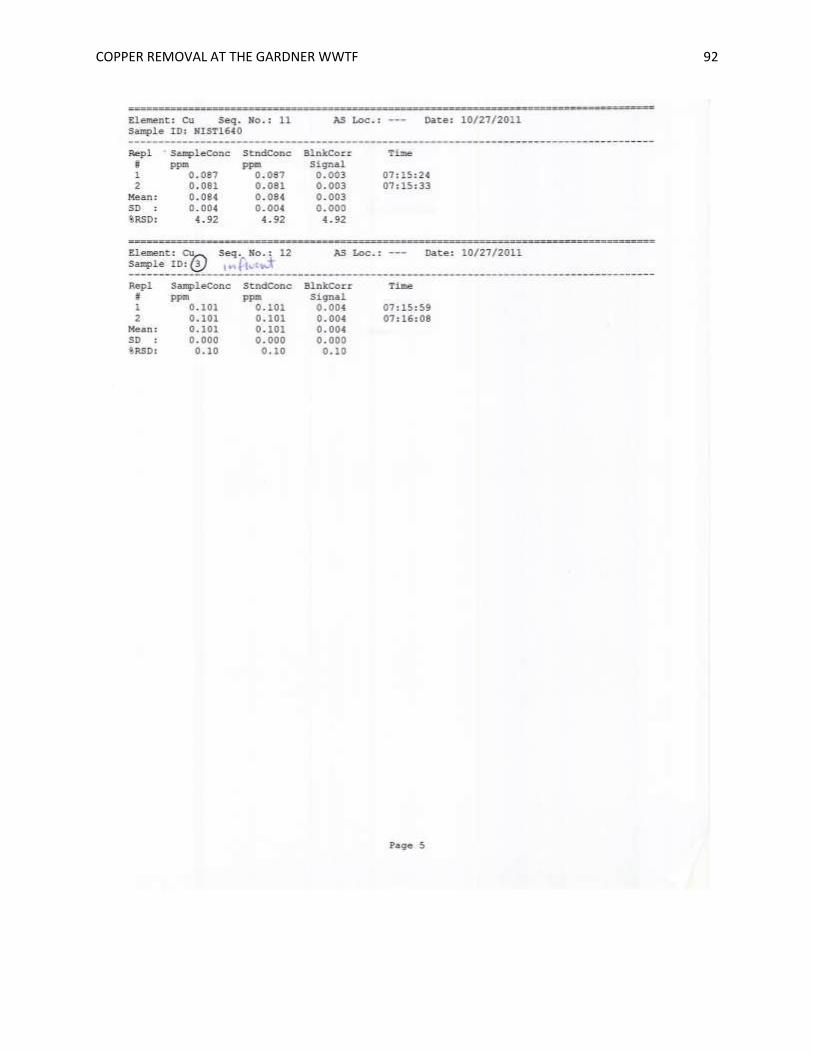
COPPER REMOVAL AT THE GARDNER WWTF 92
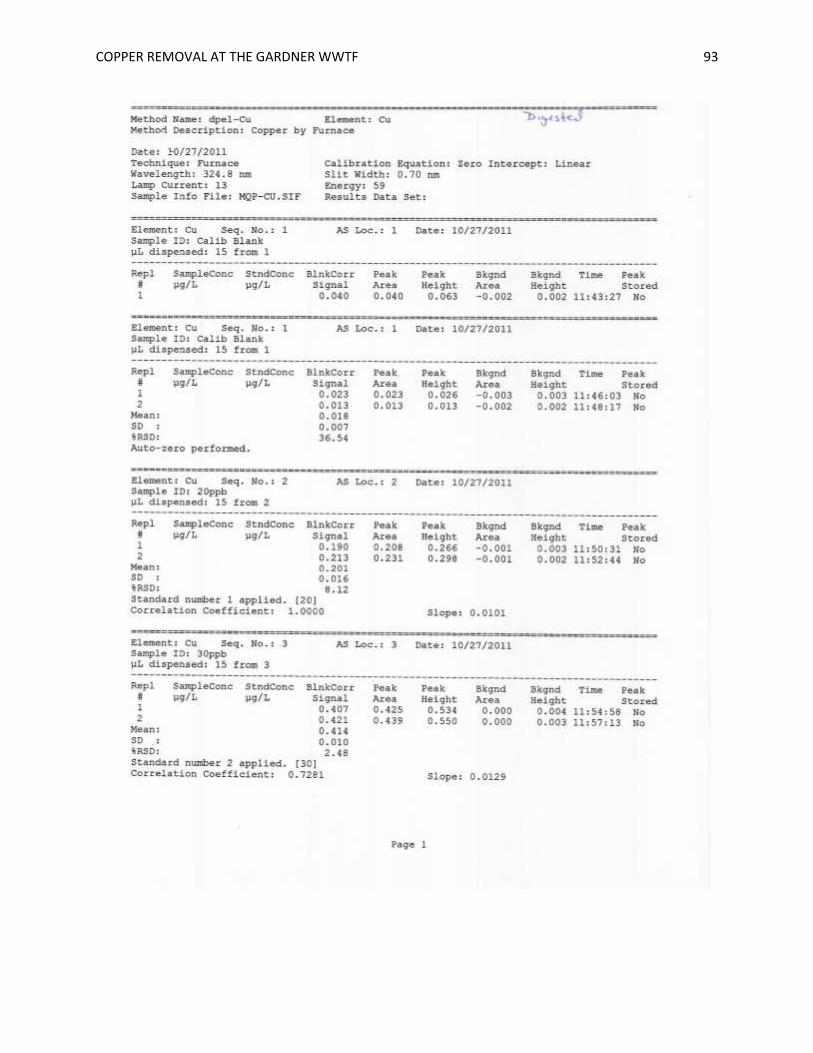
COPPER REMOVAL AT THE GARDNER WWTF 93
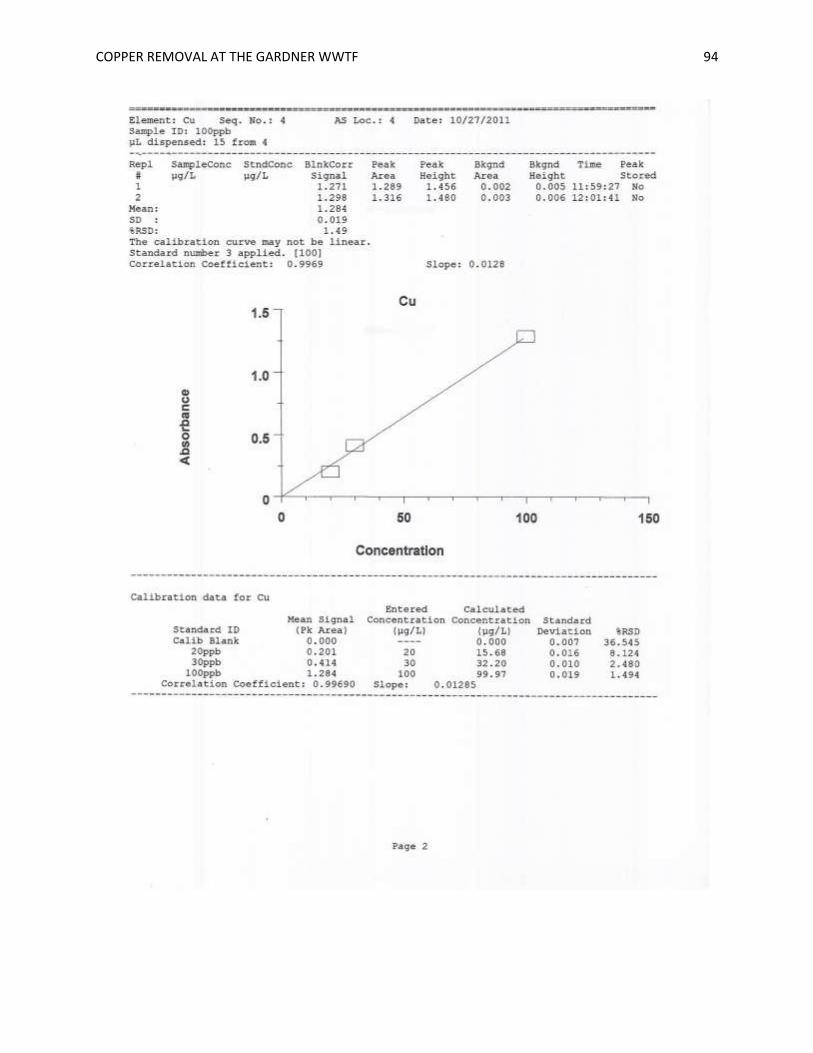
COPPER REMOVAL AT THE GARDNER WWTF 94
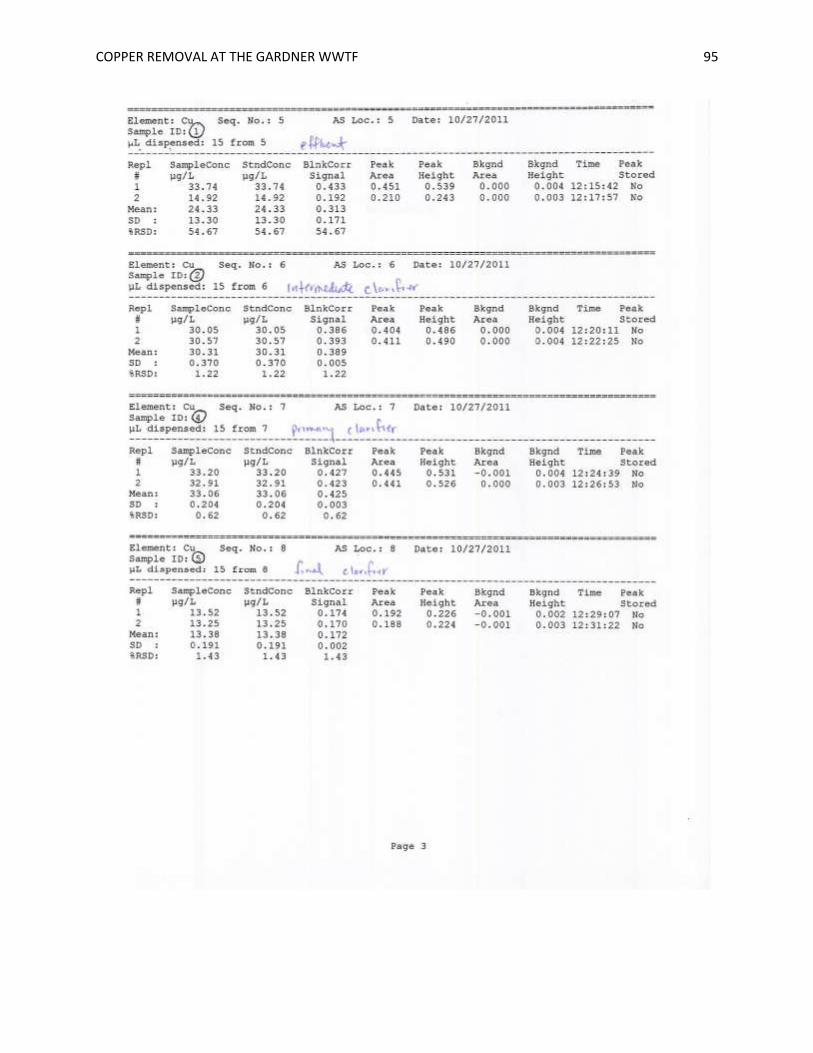
COPPER REMOVAL AT THE GARDNER WWTF 95

COPPER REMOVAL AT THE GARDNER WWTF 96

COPPER REMOVAL AT THE GARDNER WWTF 97
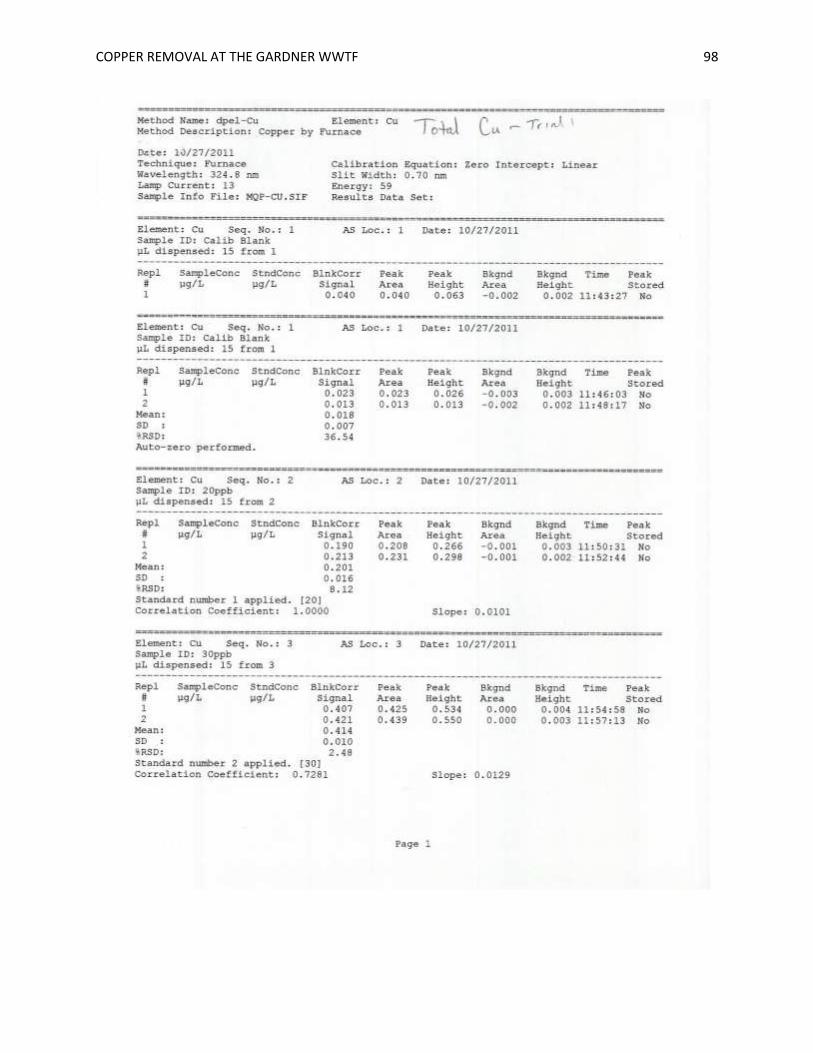
COPPER REMOVAL AT THE GARDNER WWTF 98

COPPER REMOVAL AT THE GARDNER WWTF 99

COPPER REMOVAL AT THE GARDNER WWTF 100
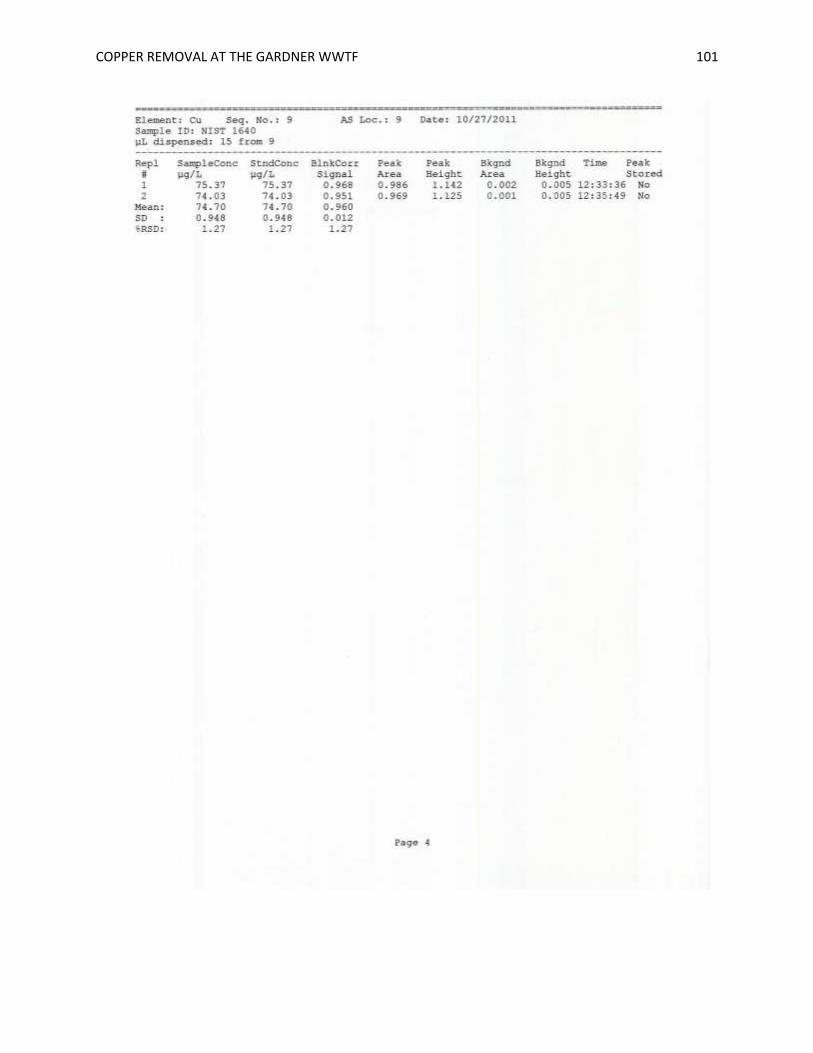
COPPER REMOVAL AT THE GARDNER WWTF 101
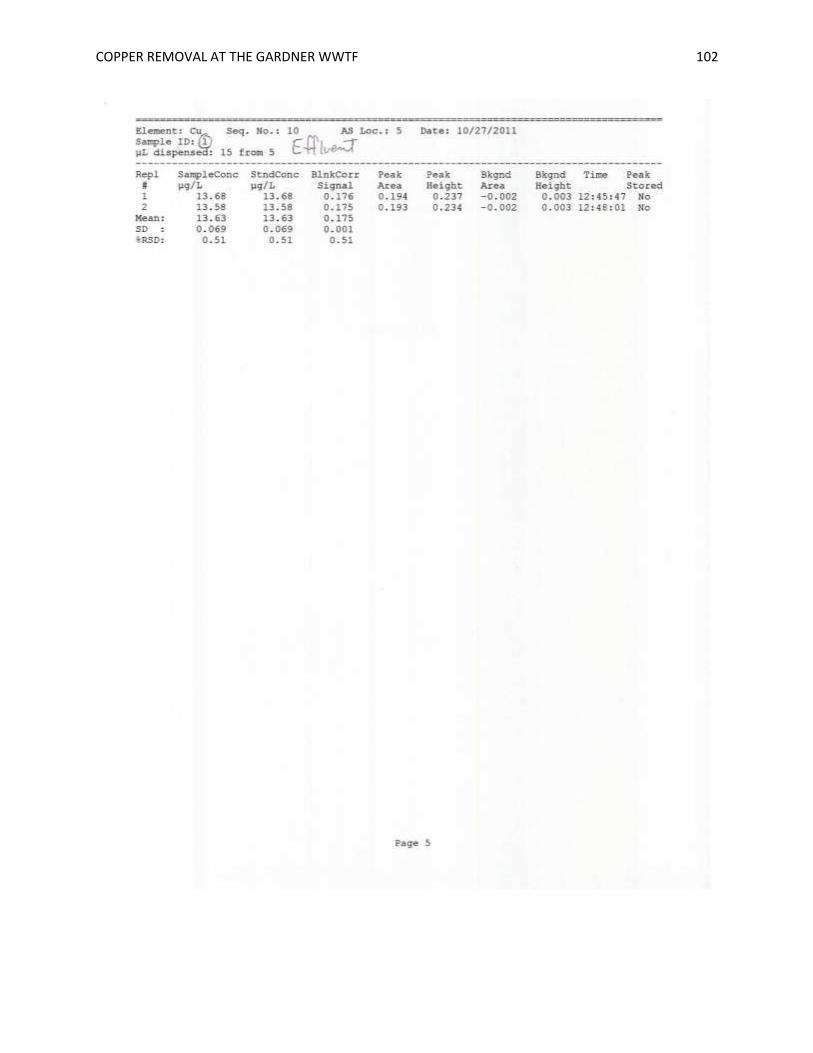
COPPER REMOVAL AT THE GARDNER WWTF 102

COPPER REMOVAL AT THE GARDNER WWTF 103

COPPER REMOVAL AT THE GARDNER WWTF 104

COPPER REMOVAL AT THE GARDNER WWTF 105
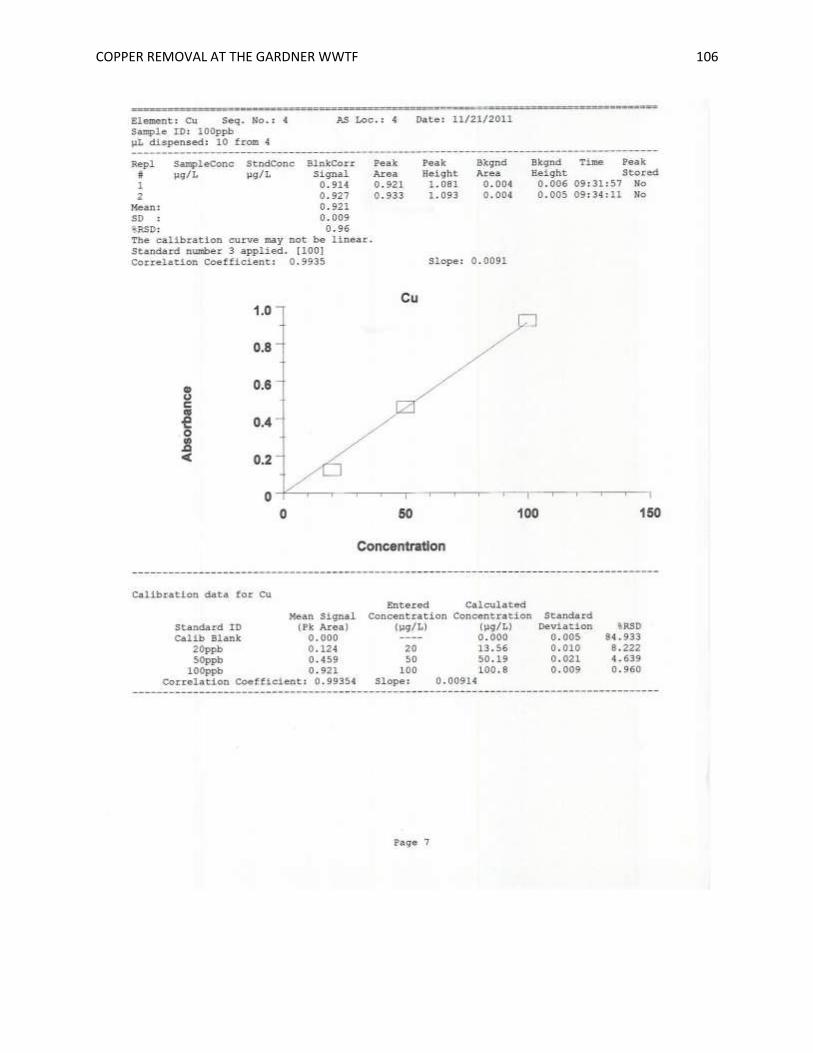
COPPER REMOVAL AT THE GARDNER WWTF 106
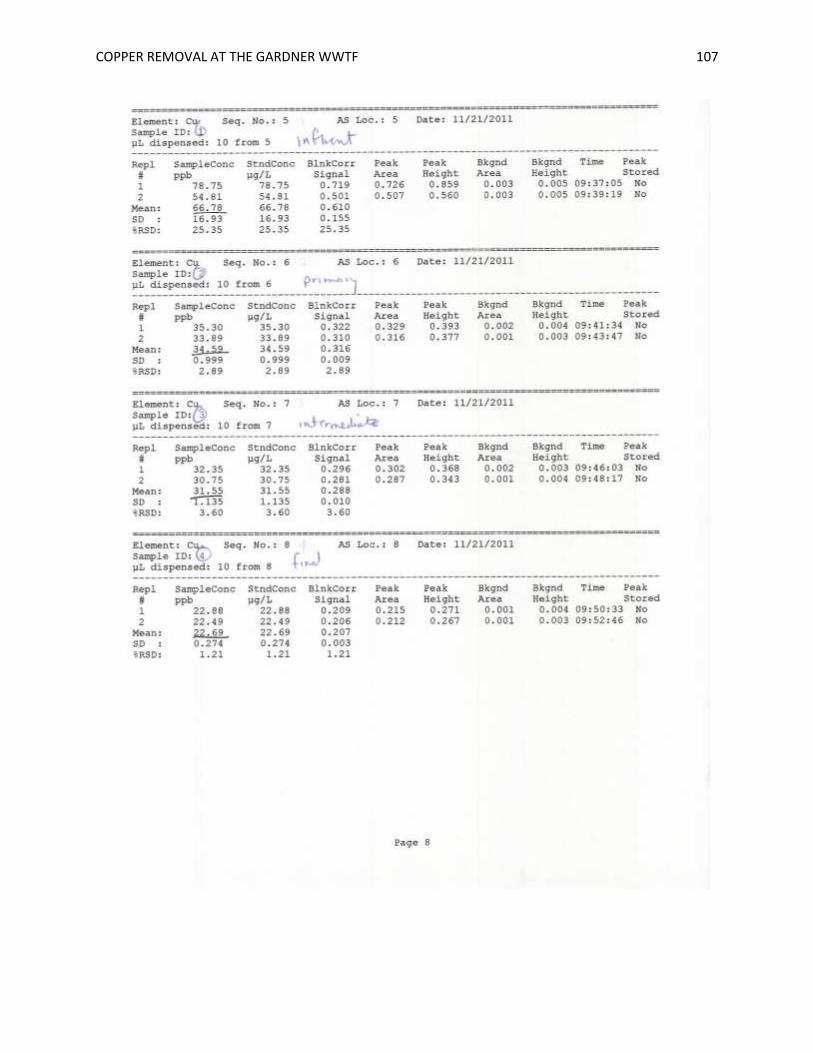
COPPER REMOVAL AT THE GARDNER WWTF 107
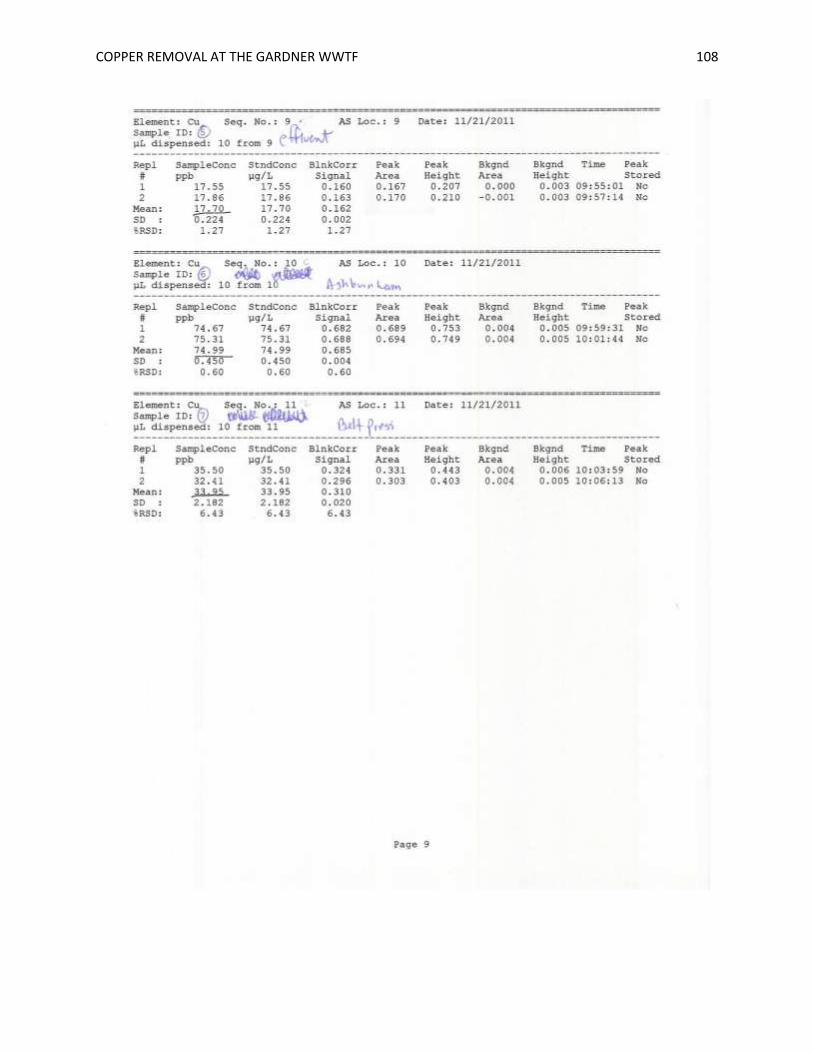
COPPER REMOVAL AT THE GARDNER WWTF 108
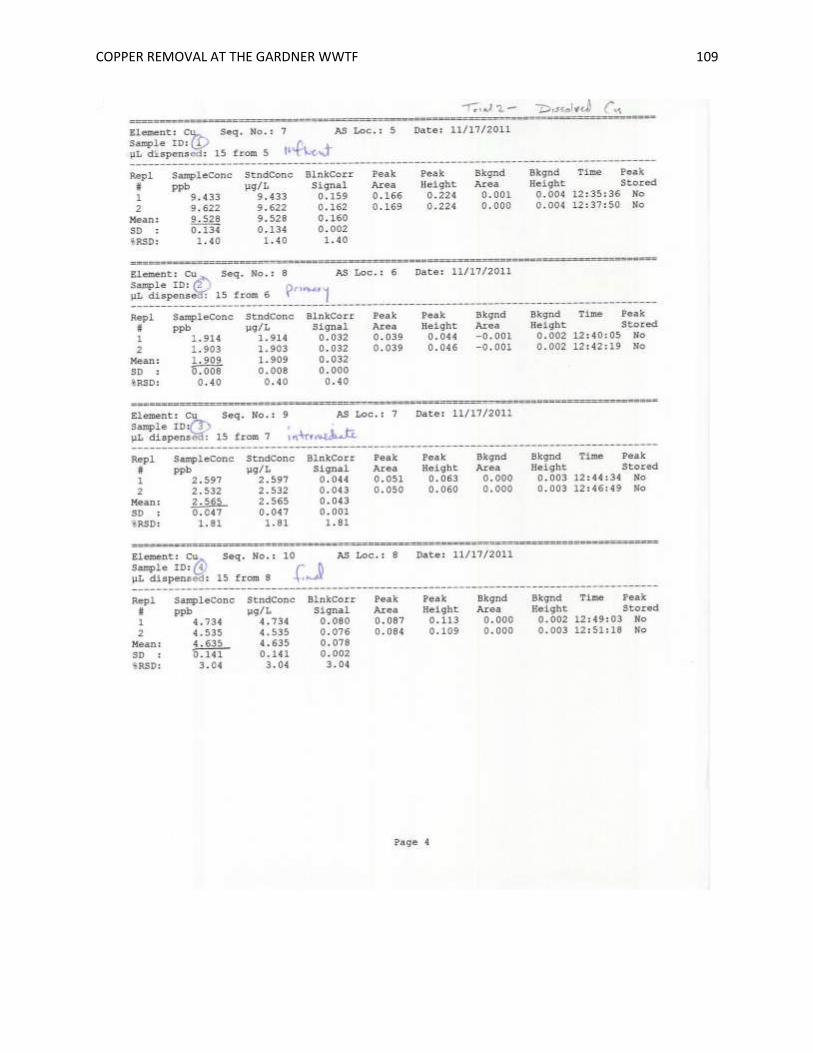
COPPER REMOVAL AT THE GARDNER WWTF 109
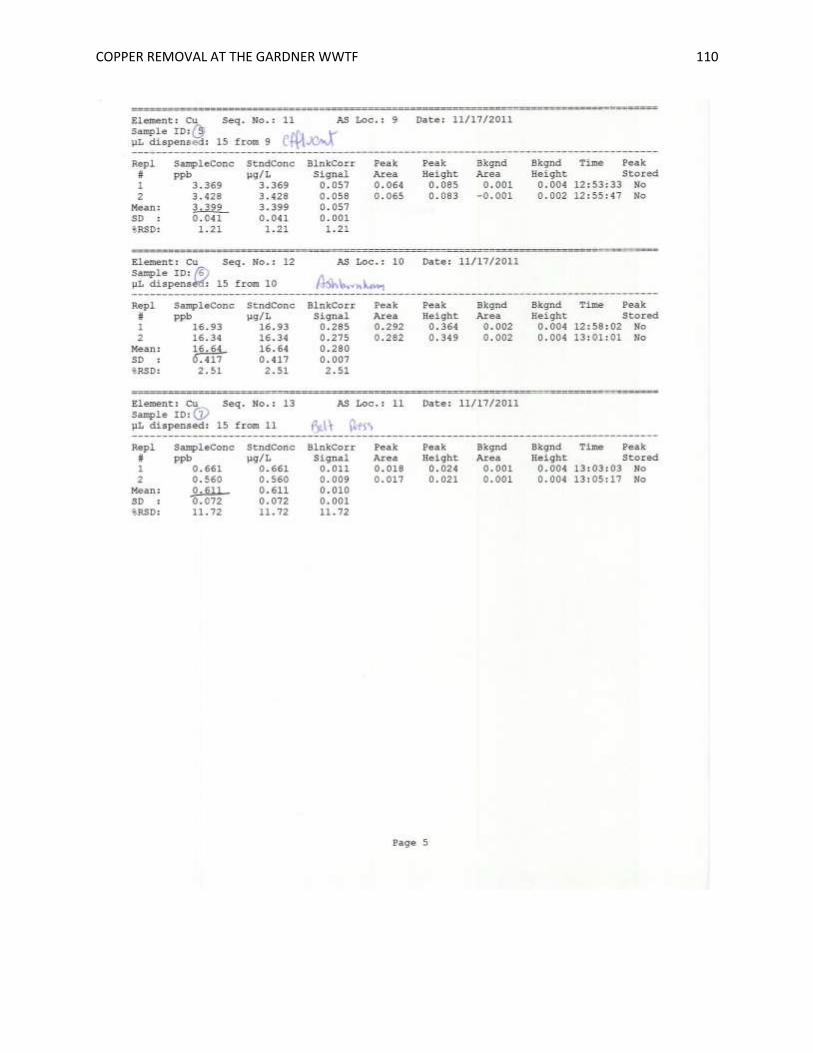
COPPER REMOVAL AT THE GARDNER WWTF 110

COPPER REMOVAL AT THE GARDNER WWTF 111

COPPER REMOVAL AT THE GARDNER WWTF 112

COPPER REMOVAL AT THE GARDNER WWTF 113
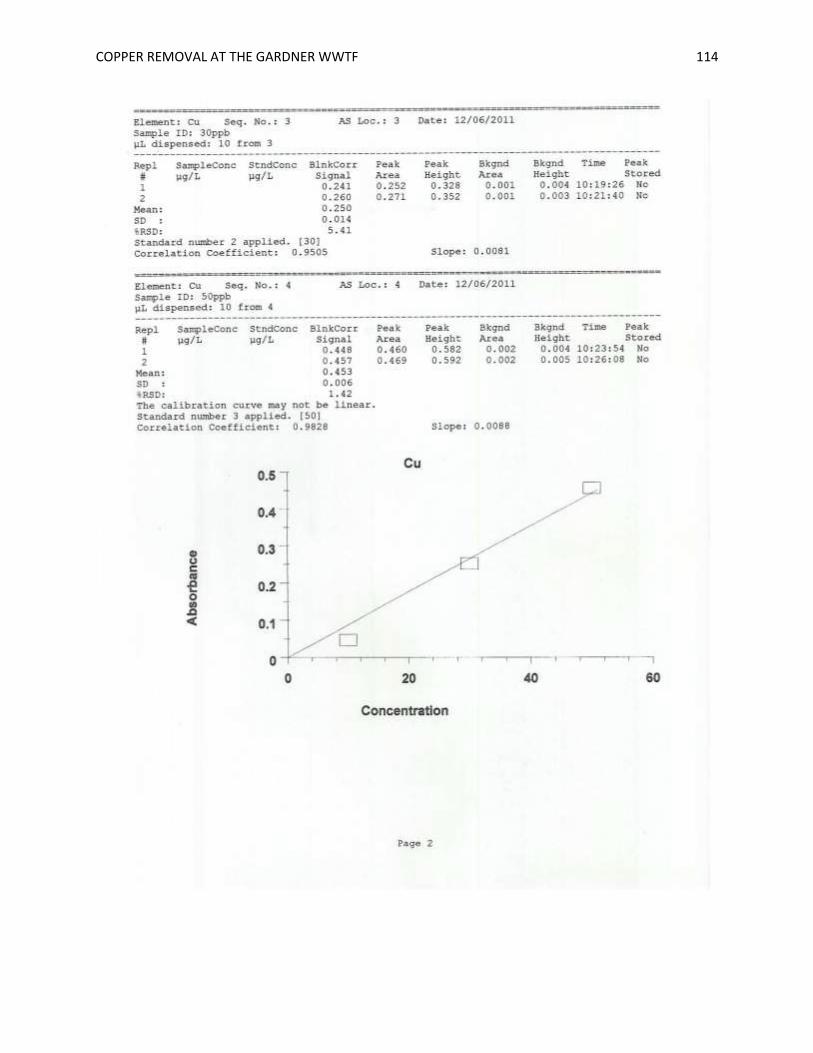
COPPER REMOVAL AT THE GARDNER WWTF 114

COPPER REMOVAL AT THE GARDNER WWTF 115

COPPER REMOVAL AT THE GARDNER WWTF 116
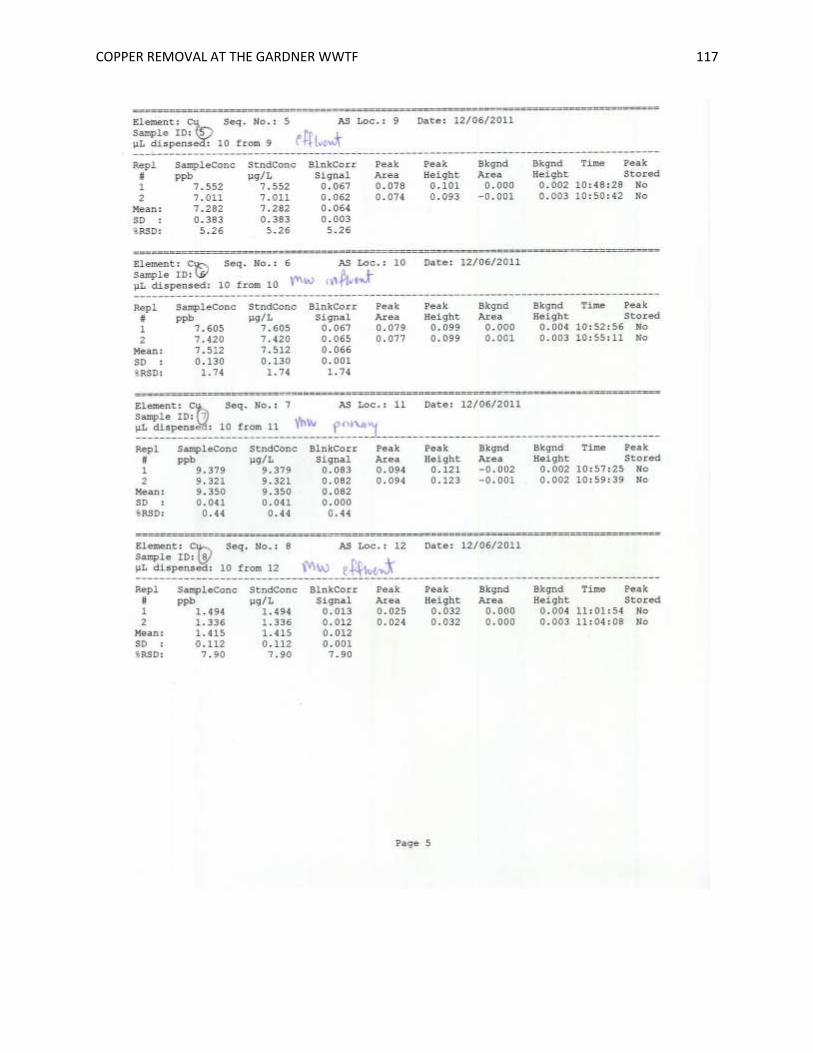
COPPER REMOVAL AT THE GARDNER WWTF 117
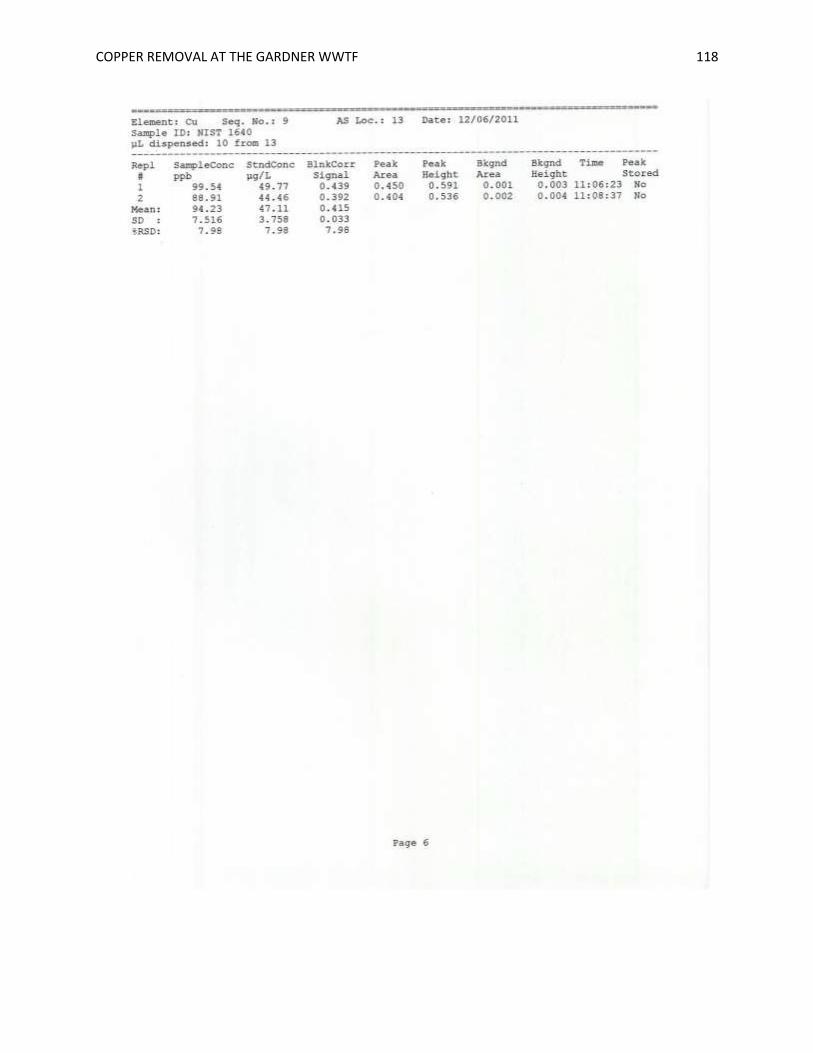
COPPER REMOVAL AT THE GARDNER WWTF 118
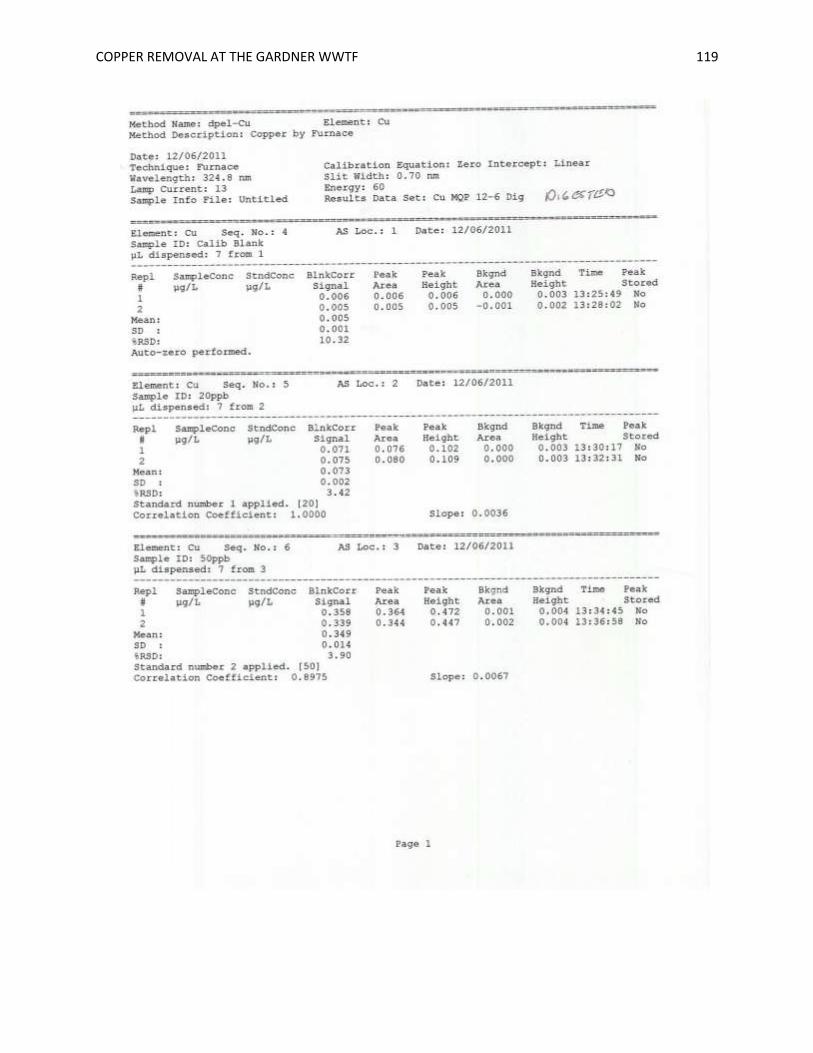
COPPER REMOVAL AT THE GARDNER WWTF 119

COPPER REMOVAL AT THE GARDNER WWTF 120
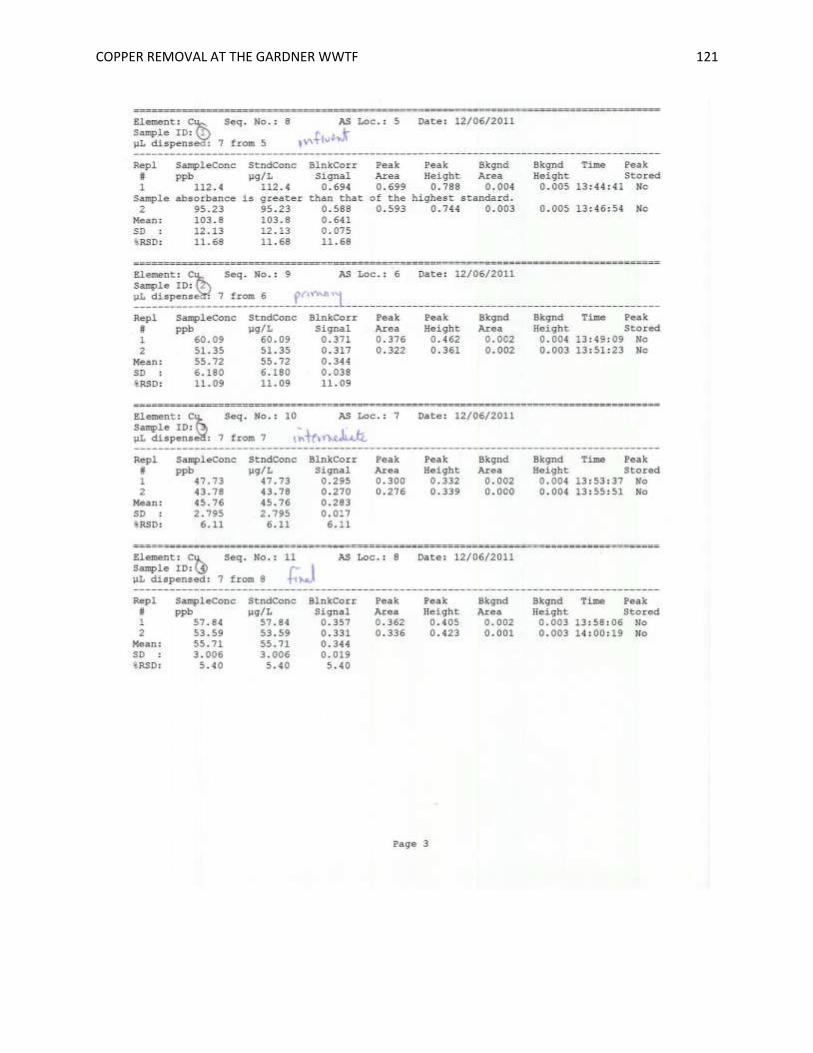
COPPER REMOVAL AT THE GARDNER WWTF 121

COPPER REMOVAL AT THE GARDNER WWTF 122
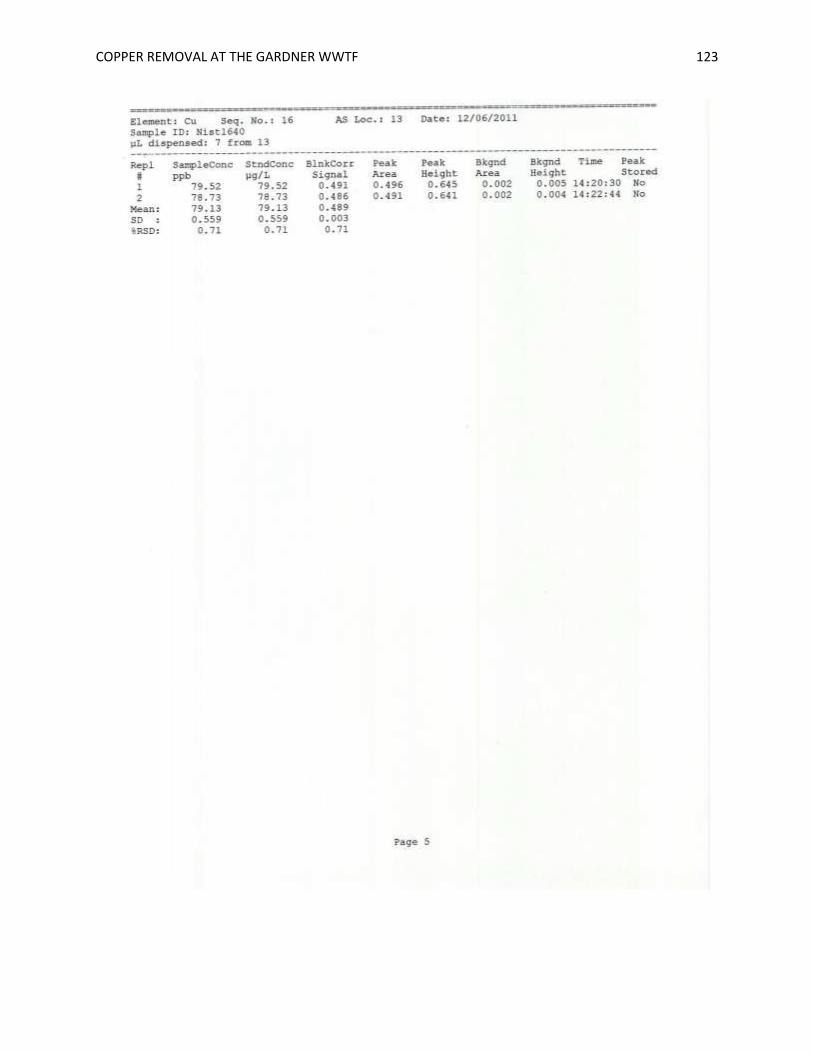
COPPER REMOVAL AT THE GARDNER WWTF 123

COPPER REMOVAL AT THE GARDNER WWTF 124
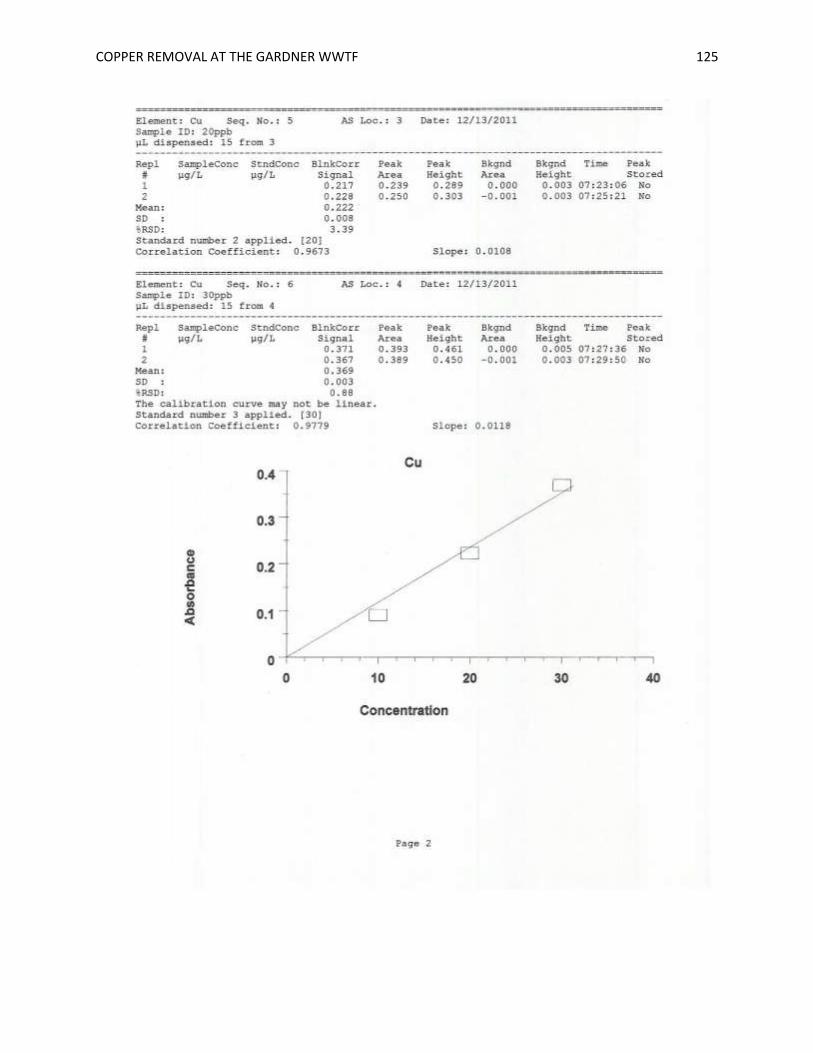
COPPER REMOVAL AT THE GARDNER WWTF 125

COPPER REMOVAL AT THE GARDNER WWTF 126

COPPER REMOVAL AT THE GARDNER WWTF 127
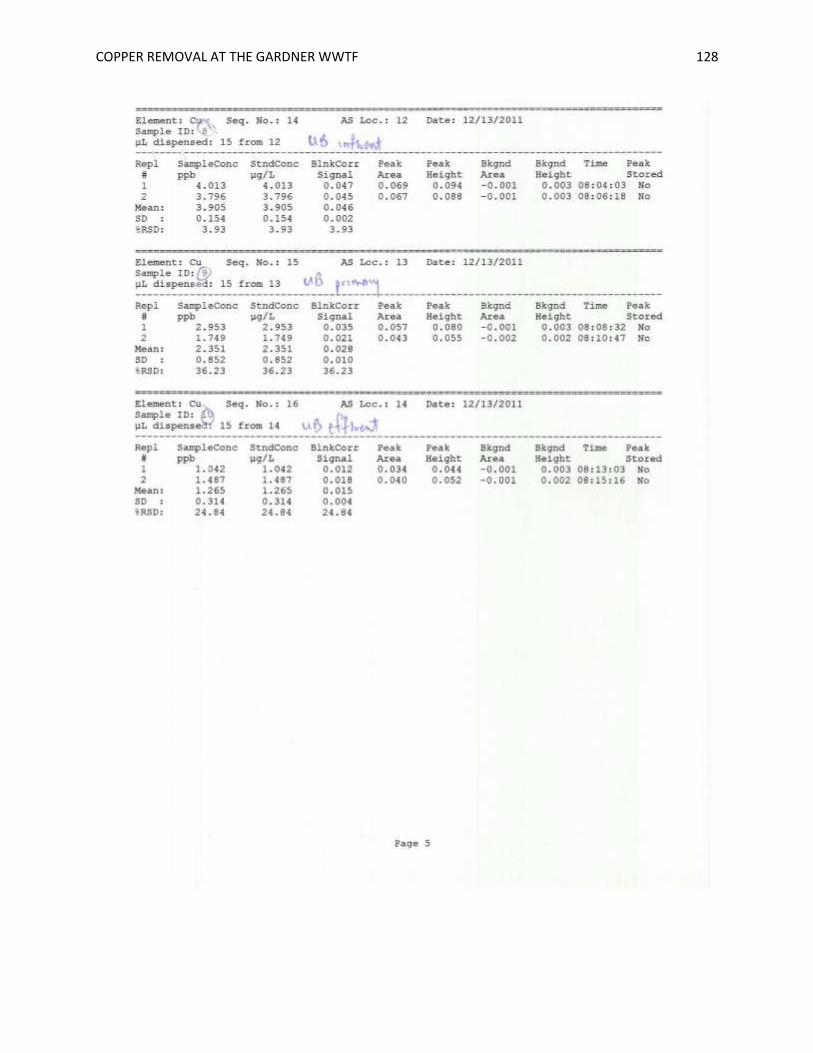
COPPER REMOVAL AT THE GARDNER WWTF 128

COPPER REMOVAL AT THE GARDNER WWTF 129

COPPER REMOVAL AT THE GARDNER WWTF 130
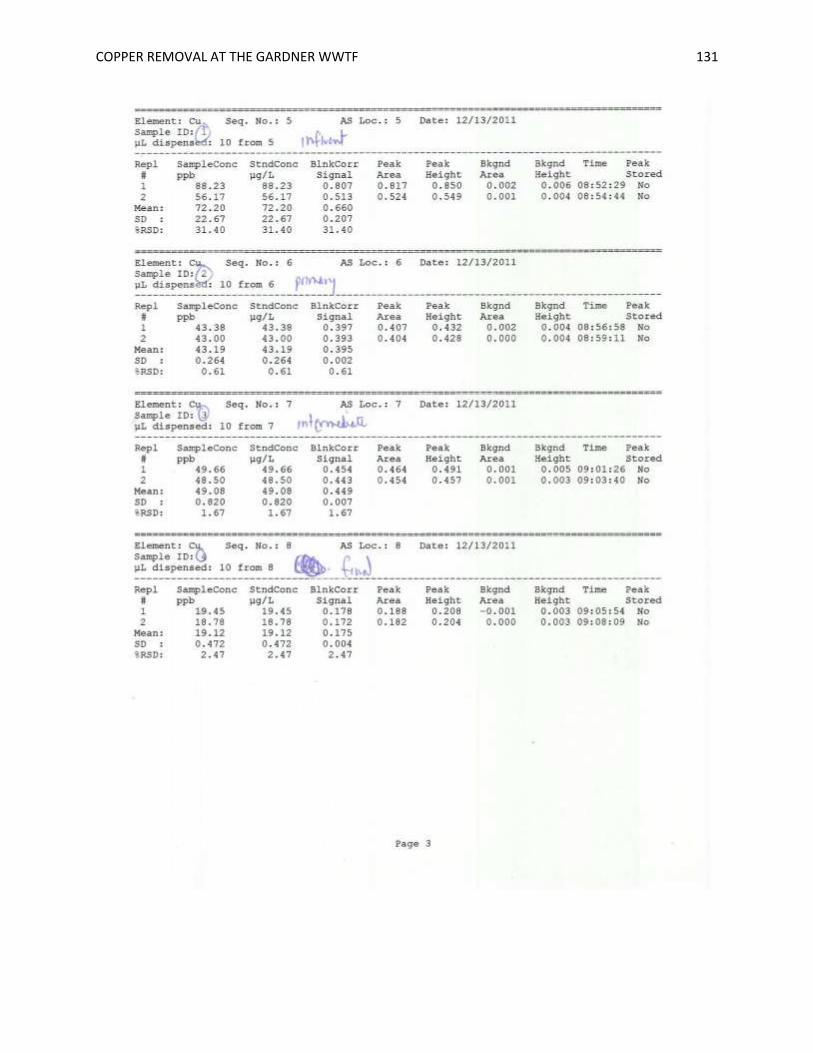
COPPER REMOVAL AT THE GARDNER WWTF 131
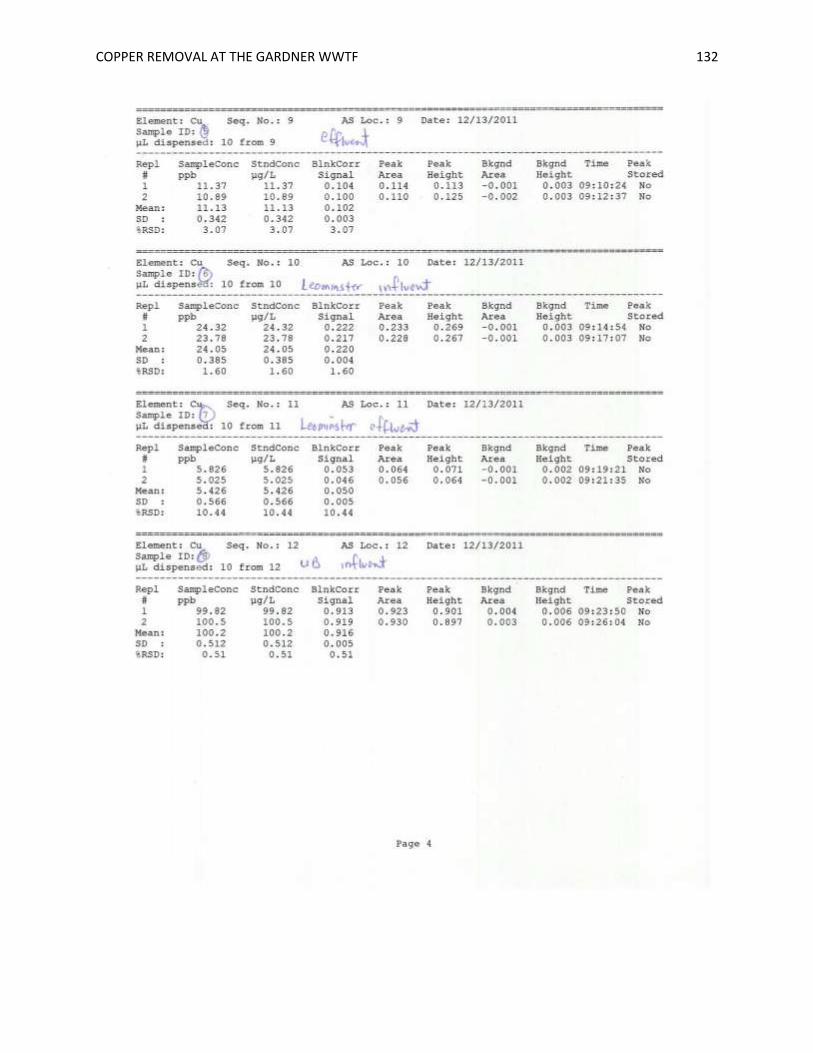
COPPER REMOVAL AT THE GARDNER WWTF 132
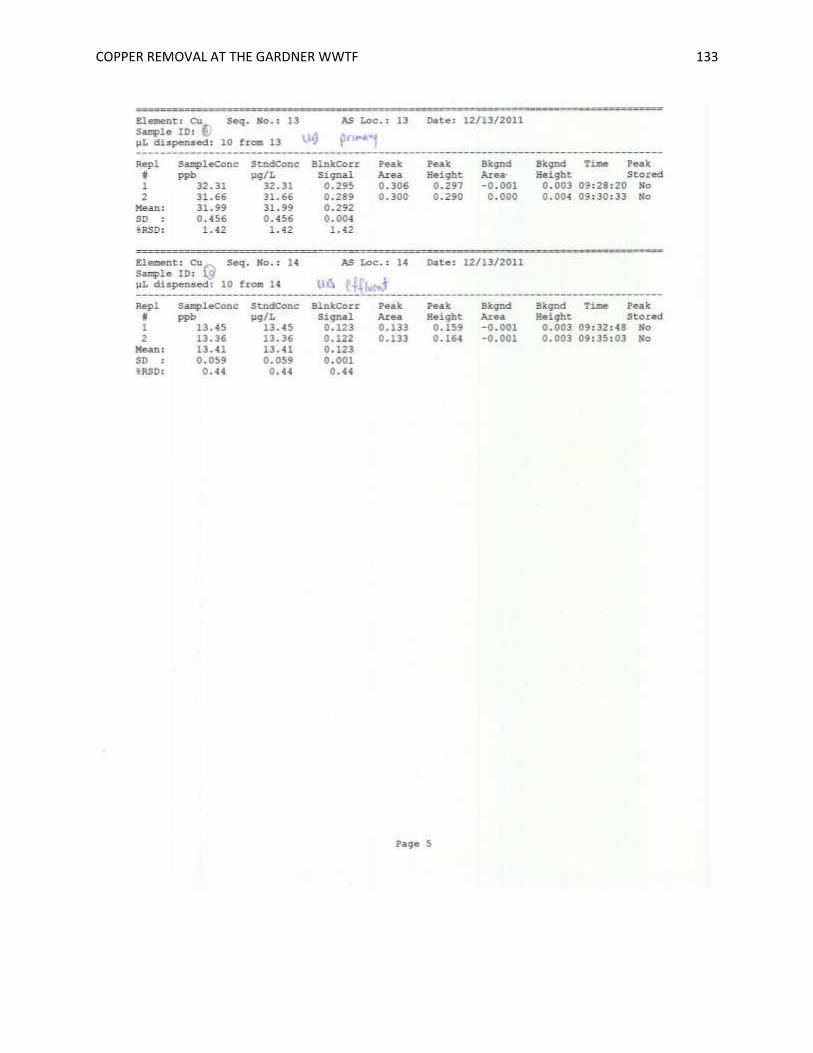
COPPER REMOVAL AT THE GARDNER WWTF 133

COPPER REMOVAL AT THE GARDNER WWTF 134

COPPER REMOVAL AT THE GARDNER WWTF 135
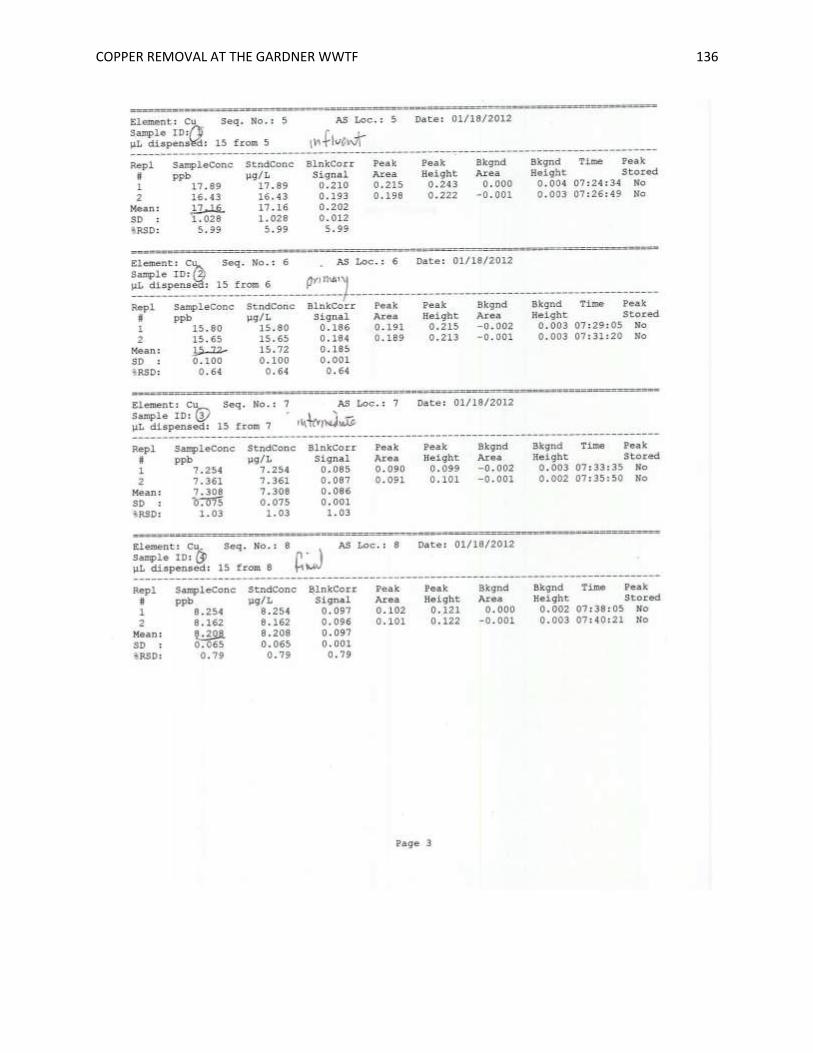
COPPER REMOVAL AT THE GARDNER WWTF 136
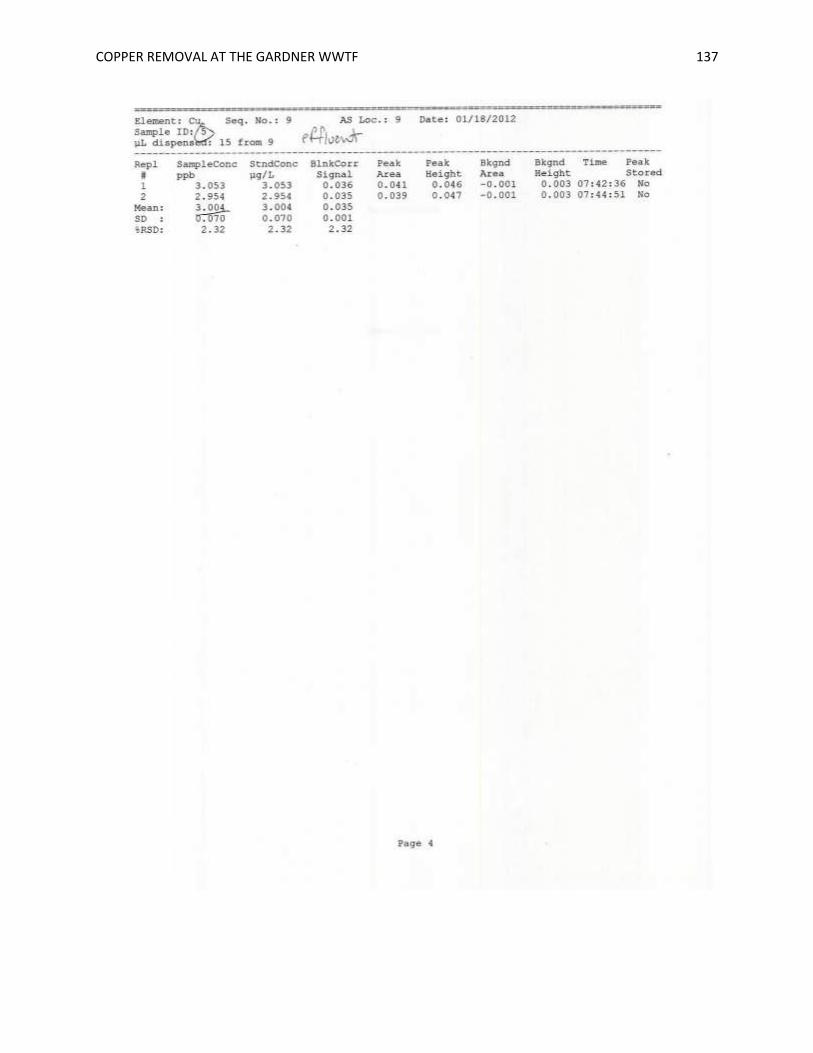
COPPER REMOVAL AT THE GARDNER WWTF 137

COPPER REMOVAL AT THE GARDNER WWTF 138

COPPER REMOVAL AT THE GARDNER WWTF 139
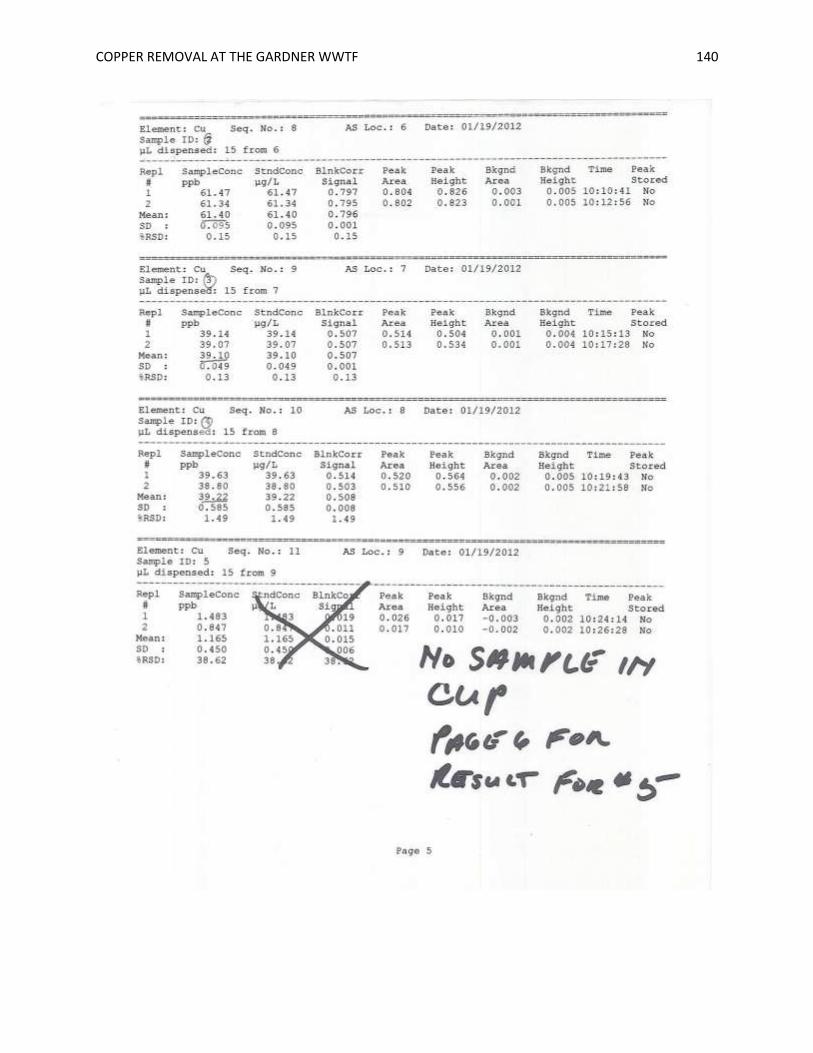
COPPER REMOVAL AT THE GARDNER WWTF 140
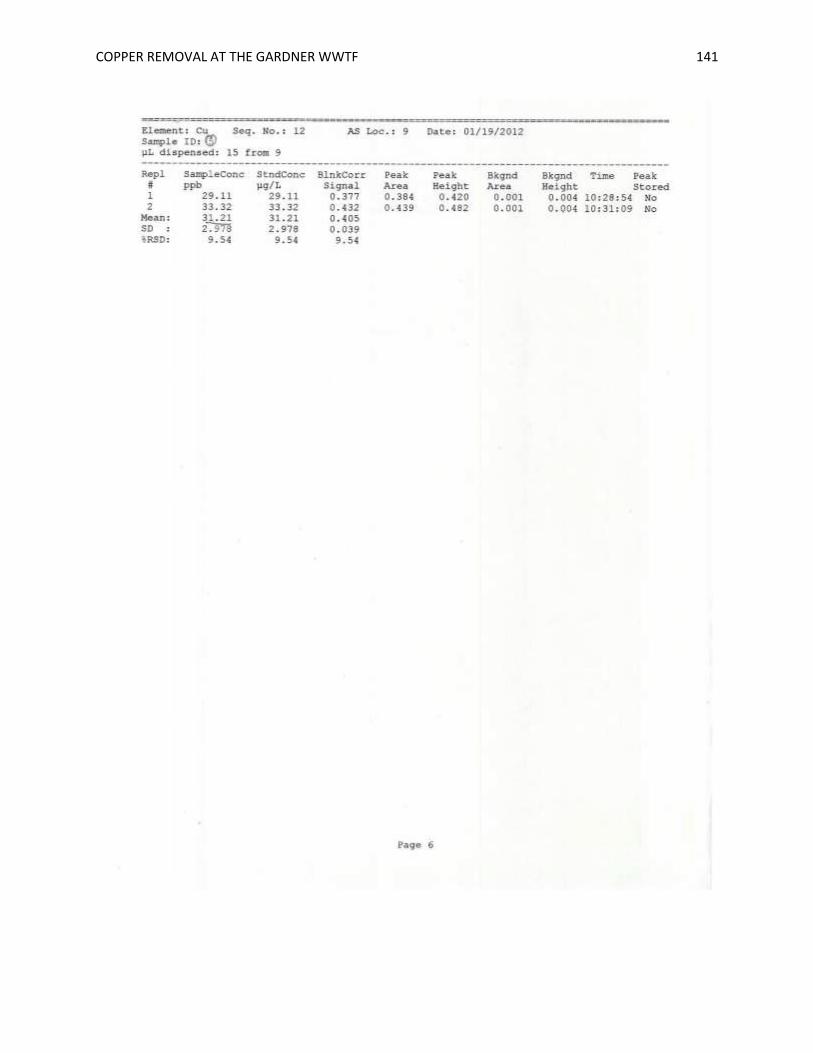
COPPER REMOVAL AT THE GARDNER WWTF 141

COPPER REMOVAL AT THE GARDNER WWTF 142
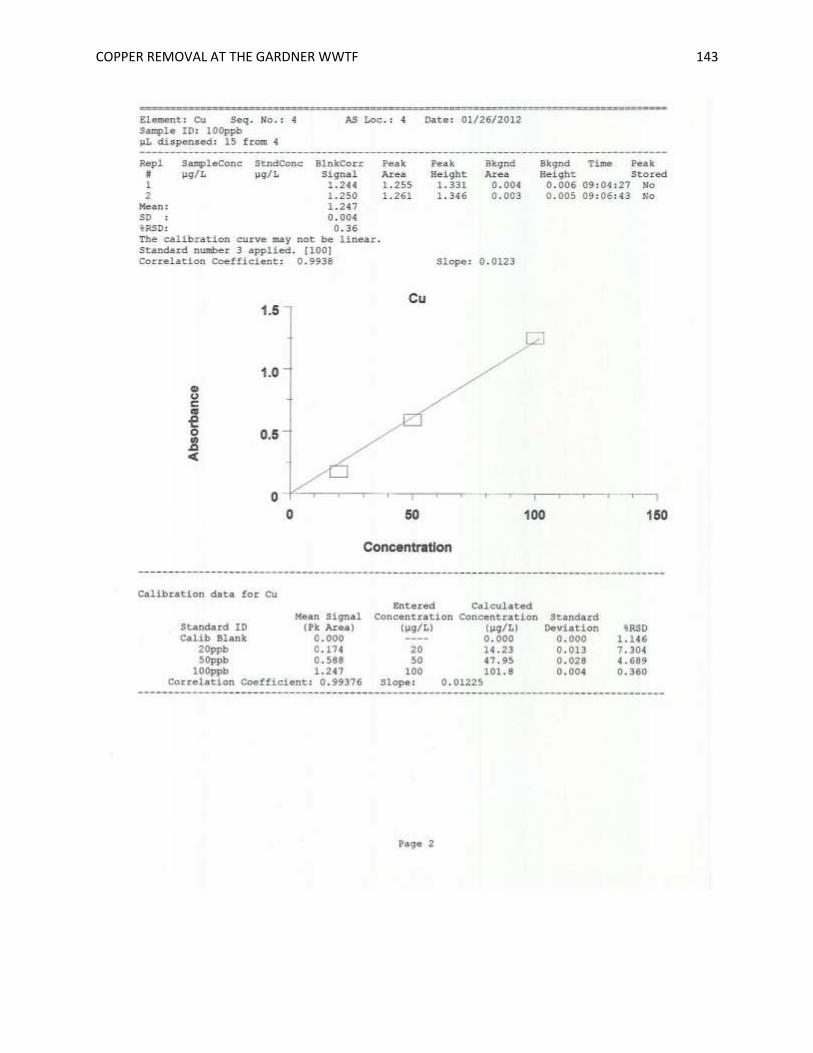
COPPER REMOVAL AT THE GARDNER WWTF 143

COPPER REMOVAL AT THE GARDNER WWTF 144
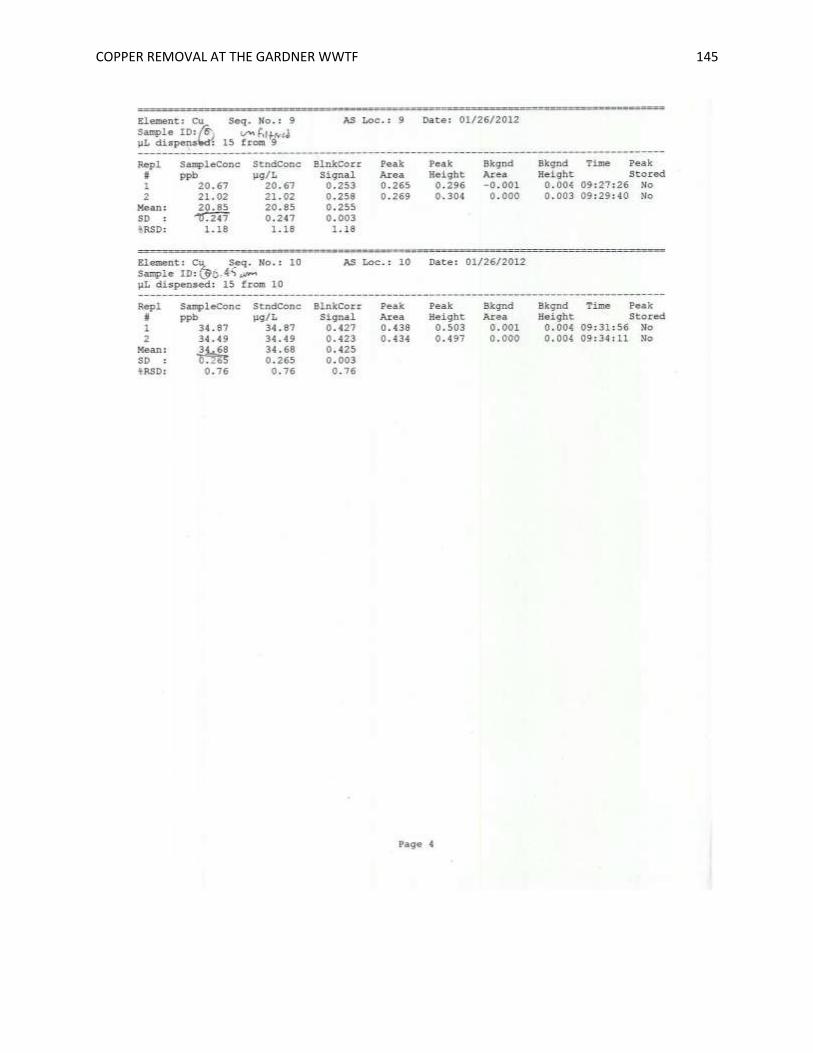
COPPER REMOVAL AT THE GARDNER WWTF 145

COPPER REMOVAL AT THE GARDNER WWTF 146

COPPER REMOVAL AT THE GARDNER WWTF 147
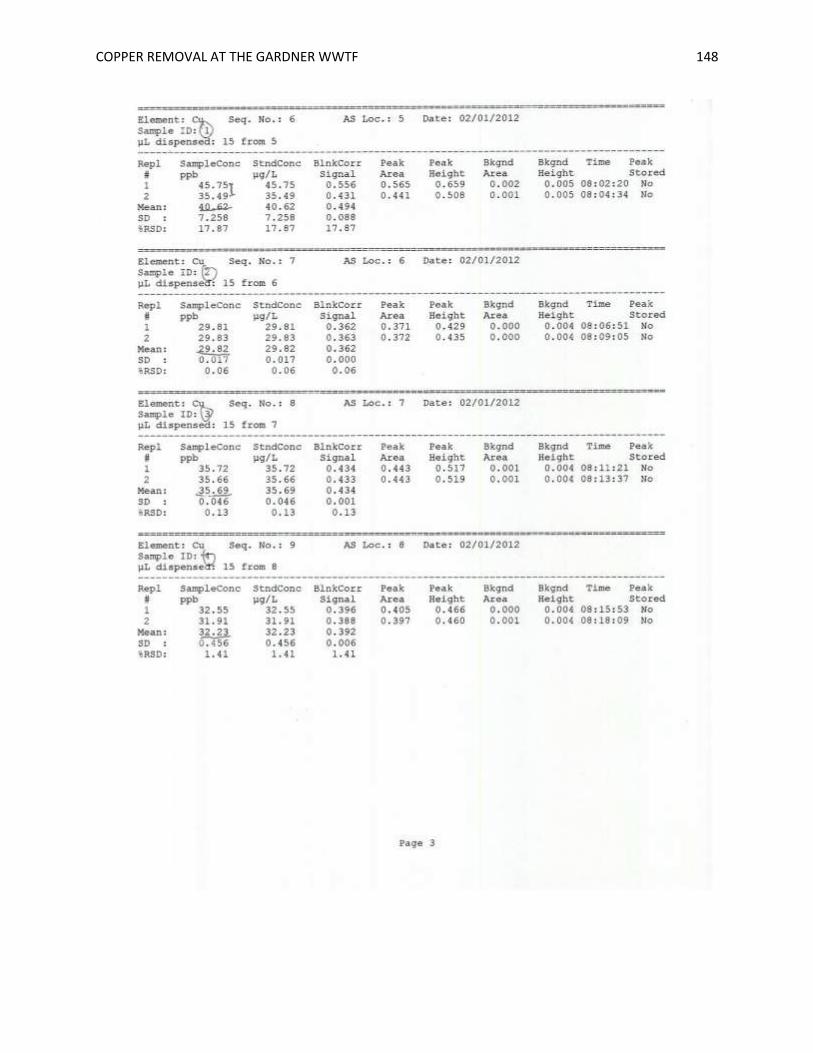
COPPER REMOVAL AT THE GARDNER WWTF 148

COPPER REMOVAL AT THE GARDNER WWTF 149
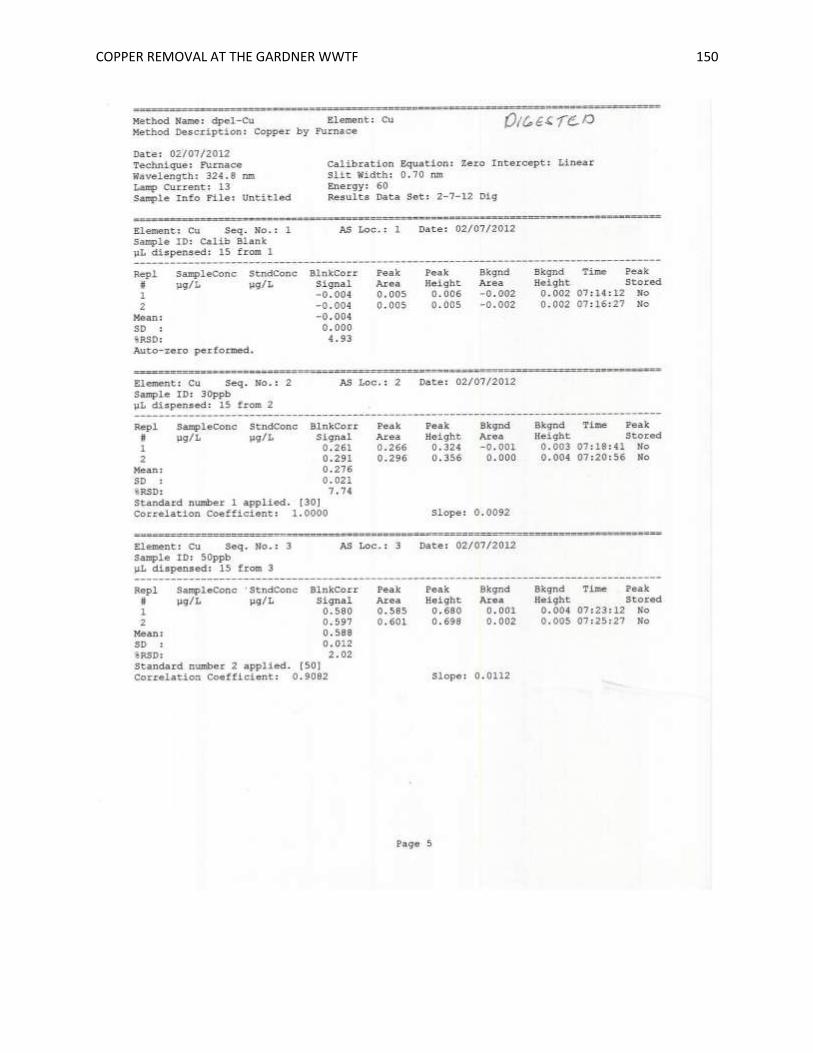
COPPER REMOVAL AT THE GARDNER WWTF 150

COPPER REMOVAL AT THE GARDNER WWTF 151

COPPER REMOVAL AT THE GARDNER WWTF 152
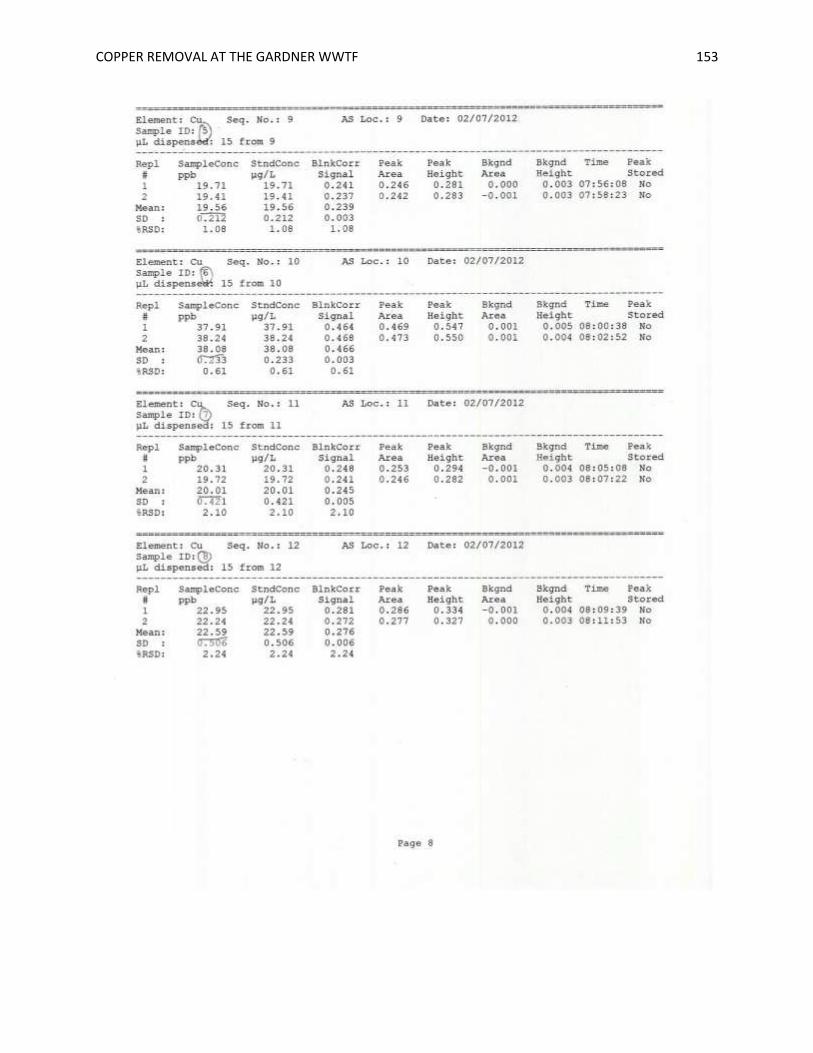
COPPER REMOVAL AT THE GARDNER WWTF 153

COPPER REMOVAL AT THE GARDNER WWTF 154
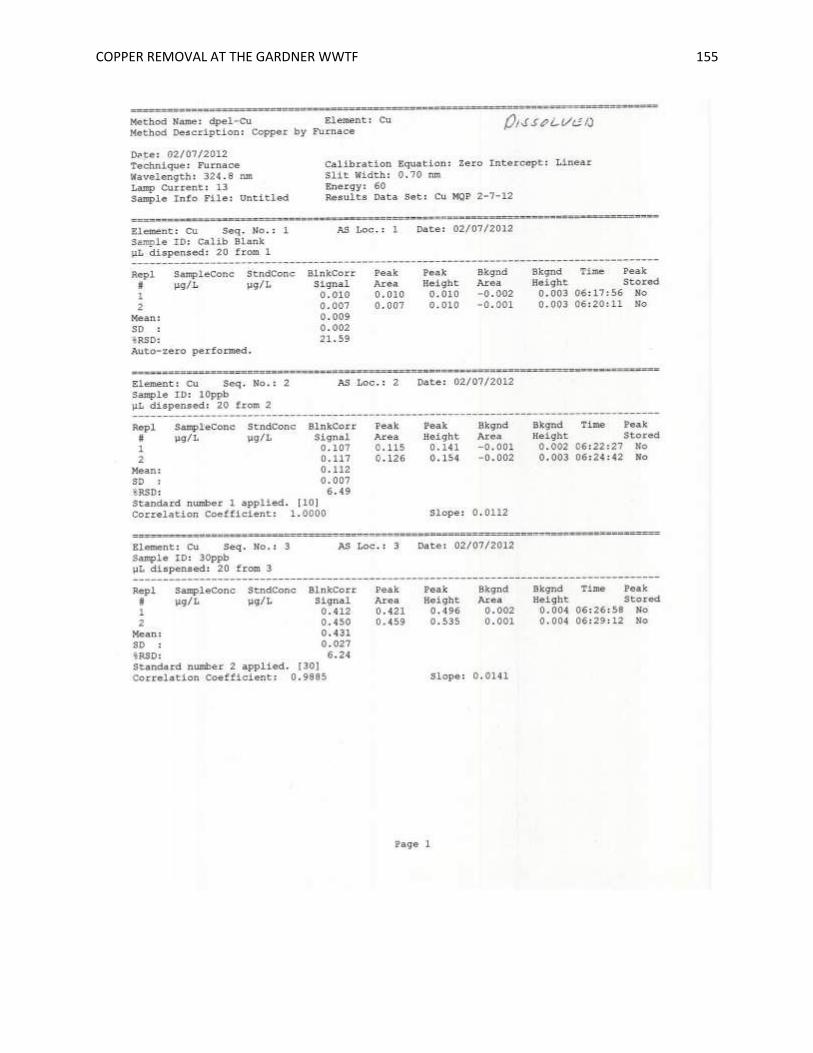
COPPER REMOVAL AT THE GARDNER WWTF 155
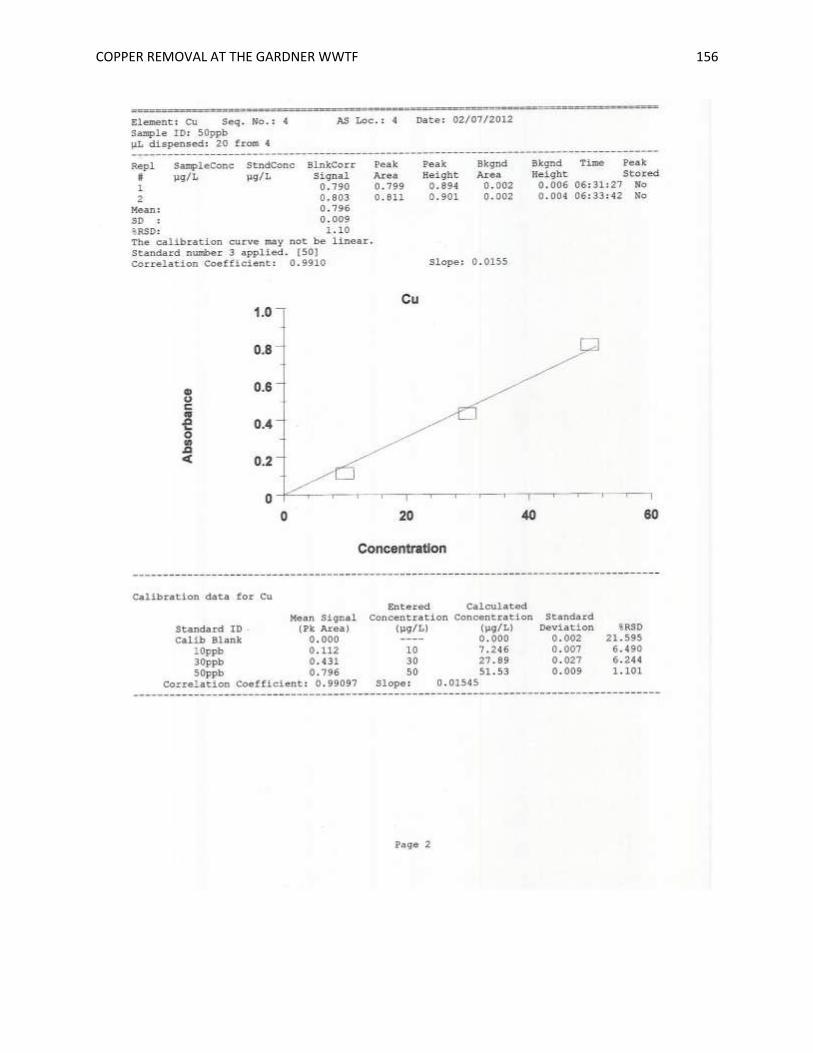
COPPER REMOVAL AT THE GARDNER WWTF 156

COPPER REMOVAL AT THE GARDNER WWTF 157

COPPER REMOVAL AT THE GARDNER WWTF 158
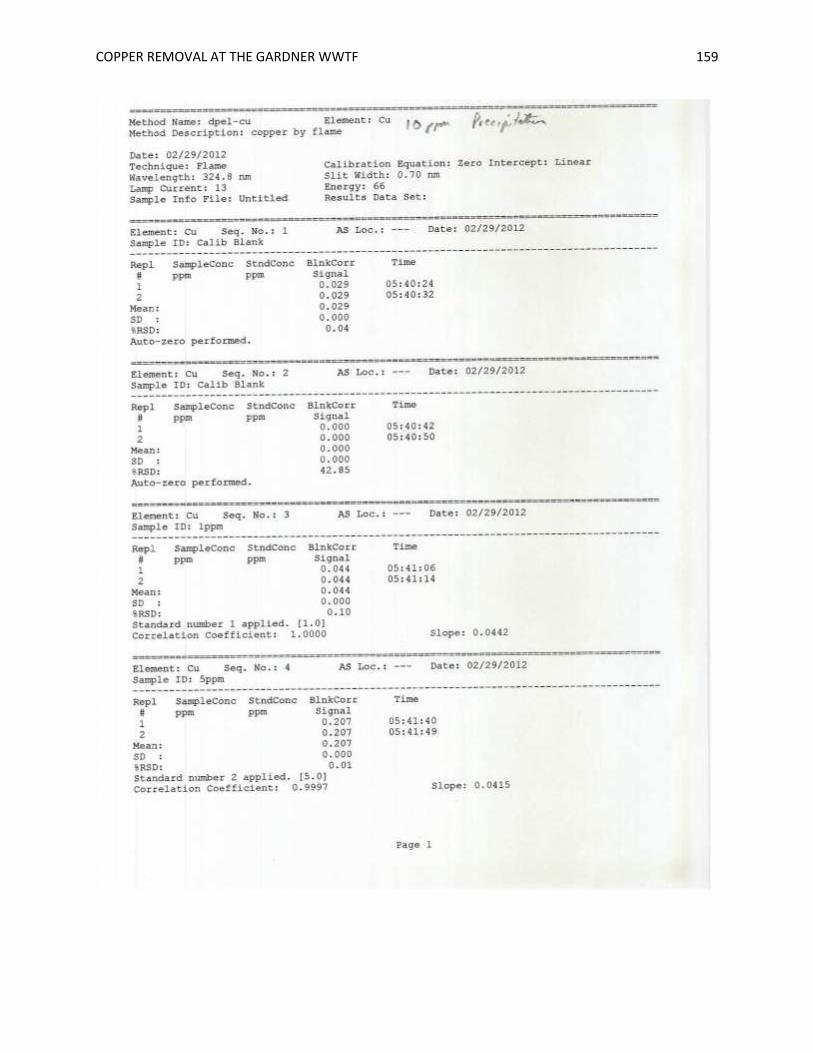
COPPER REMOVAL AT THE GARDNER WWTF 159
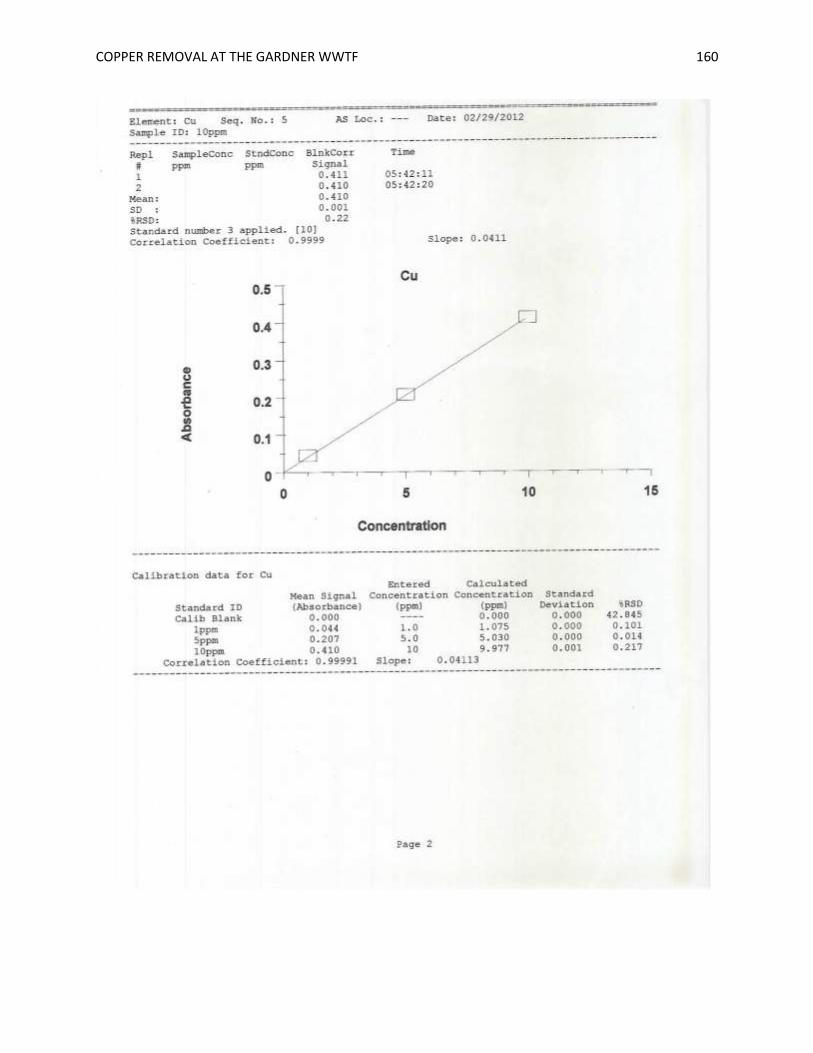
COPPER REMOVAL AT THE GARDNER WWTF 160
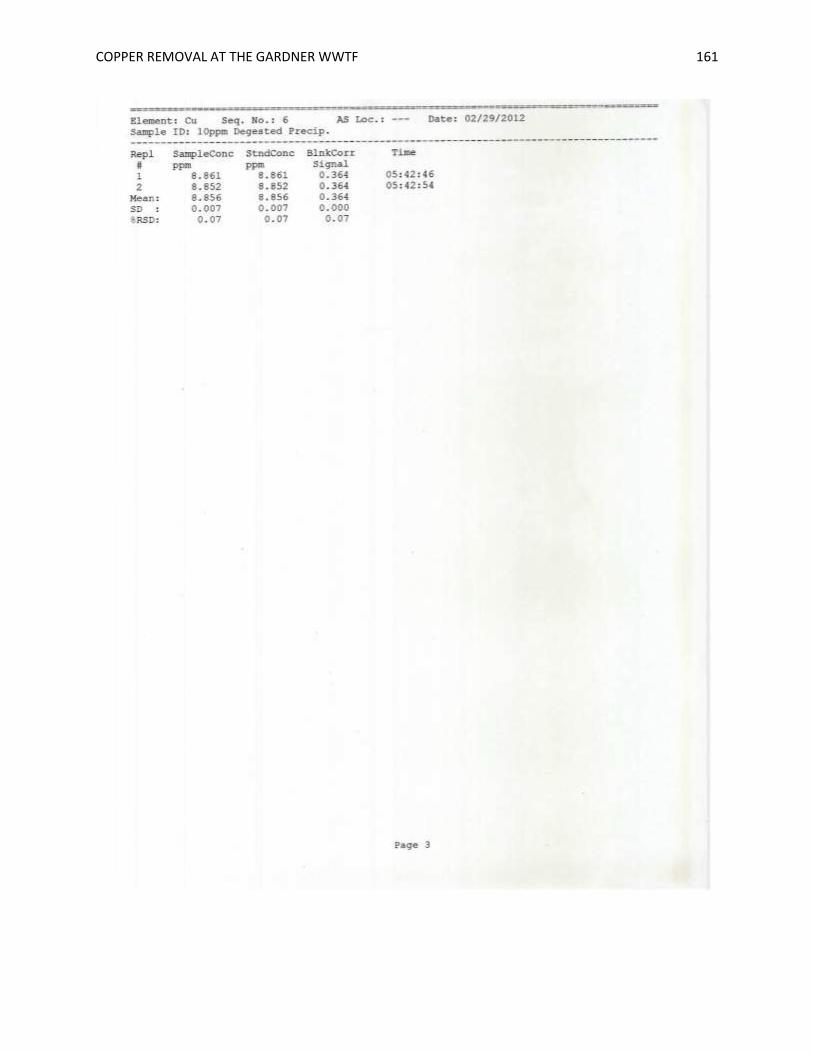
COPPER REMOVAL AT THE GARDNER WWTF 161
COPPER REMOVAL AT THE GARDNER WWTF 162
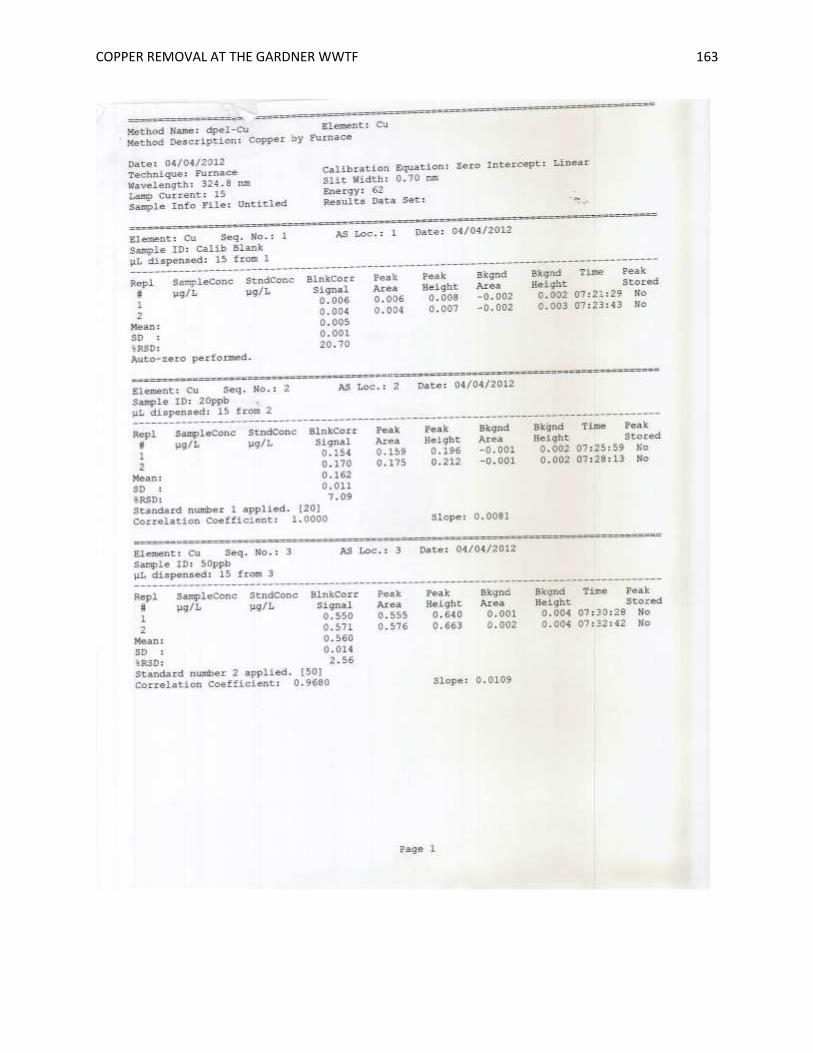
COPPER REMOVAL AT THE GARDNER WWTF 163
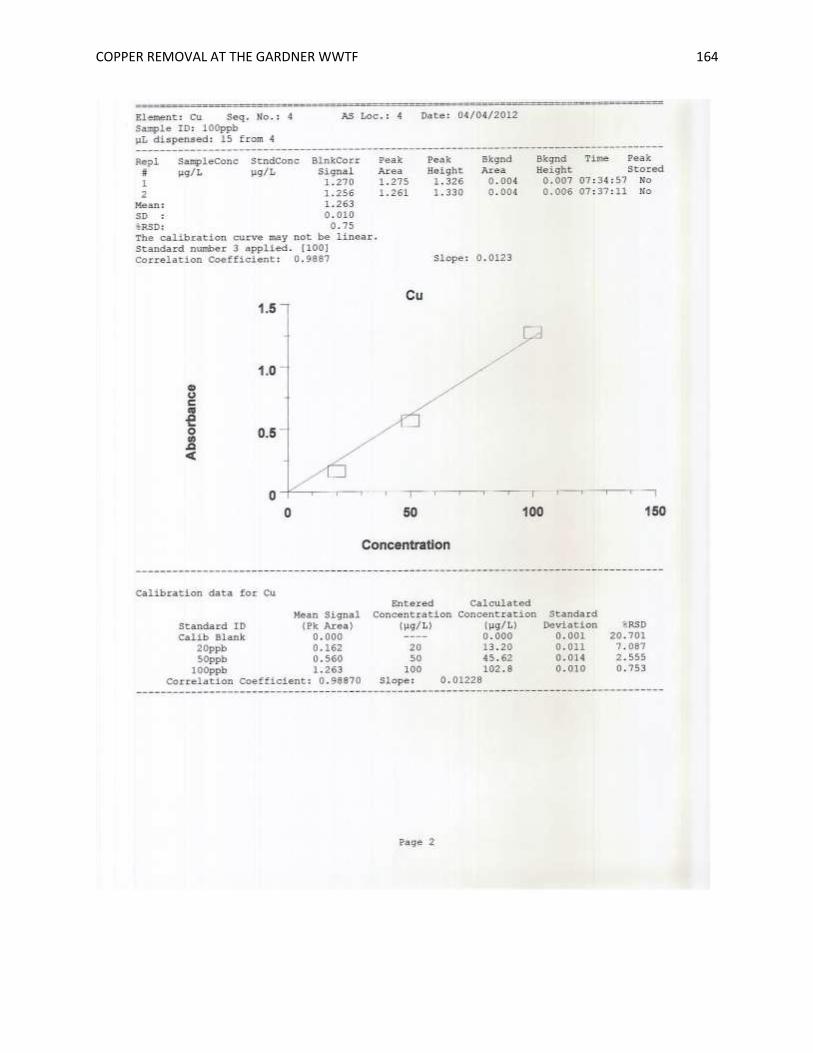
COPPER REMOVAL AT THE GARDNER WWTF 164

COPPER REMOVAL AT THE GARDNER WWTF 165

COPPER REMOVAL AT THE GARDNER WWTF 166