copper toxicity to paratya australiensis: i. … · singly charged complex (cu-glycine)+, also...
TRANSCRIPT

Environmental Toxicology and Chemistry, Vol. 9, pp. 997-1006, 1990 Printed in the USA. Pergamon Press pic
0730-7268/90 $3.00 + .00 Copyright © 1990 SET AC
COPPER TOXICITY TO PARATYA AUSTRALIENSIS: I. INFLUENCE OF NITRILOTRIACETIC ACID
A N D GLYCINE H E L E N R . D A L Y , I A N C . CAMPBELL and BARRY T . H A R T *
Centre for Stream Ecology, Chisholm Institute of Technology, Australia 3145 {Received 29 June 1989; Accepted 24 October 1989)
Abstract —The relationship between copper speciation and acute toxicity to the AustraHan freshwater shrimp, Paratya australiensis was determined using a combination of copper ion selective electrode measurements, complexing resins and computer calculations to measure the speciation in test solutions. A number of problems were encountered with the use of the copper ion selective electrode in waters containing added complexing agents.
In solutions containing nitrilotriacetic acid or glycine, uncomplexed copper(II) ions were found to be the most acutely toxic form of copper to the shrimp. However, at least one other species, the singly charged complex (Cu-Glycine)+, also appears to be mildly toxic. The results of this study demonstrate the importance of considering metal speciation when assessing the impact of heavy metals on aquatic organisms. Keywords —Copper toxicity Speciation NTA Glycine Paratya australiensis
INTRODUCTION It is now widely accepted that the toxicity, bio
availability, and transport of heavy metals in aquatic systems are dependent upon the physico-chemical forms, or speciation, of the particular metal [1-3]. Ahhough there are some exceptions, the free ionic form of a metal is generally the most acutely toxic form. This has been demonstrated for copper with bacteria [4], algae [5-8], aquatic mac-rophytes [9], invertebrates [10,11] and fish [12,13]; and also for zinc [6,14], cadmium [6,15,16] and lead [9,17].
Although there is a vast body of literature dealing with the effects of heavy metals on aquatic organisms, few studies have been pubhshed on the toxicity of heavy metals to Australian freshwater organisms [18], and none have dealt specifically with the relationship between metal speciation and toxicity.
The experiments reported in this paper were conducted as part of a study on the relationship between the physico-chemical forms of copper and its toxicity to the AustraUan freshwater shrimp, P.
*To whom correspondence may be addressed. The current address of H. R. Daly is Scientific Ser
vices Division, Environment Protection Authority, Melbourne, Australia, 3000.
australiensis. The experimental program was designed to test the hypothesis that the free cupric ion was the major copper species causing acute toxicity to P. australiensis. Acute toxicity tests were conducted using copper in Melbourne tap water (no added complexing ligands), and in the presence of two well-characterized organic complexing ligands (nitrilotriacetic acid (NTA) and glycine), a representative inorganic ligand (bicarbonate), and natural dissolved organic matter collected from three aquatic sites in Victoria, Austraha. The results of the tap water, NTA and glycine (Gly) experiments are reported here. Aspects of the remainder of the study will be reported in subsequent papers [19, 20].
Nitrilotriacetic acid was selected as one of the test ligands, because it forms a complex with copper, CuNTA", which has a stability constant similar to that of a number of copper complexes formed with naturally occurring compounds, and may therefore be considered thermodynamically representative of them [21].
The second test ligand, glycine (Gly-NHs C H 2 COOH), is a simple amino acid which exhibits copper complexing behavior typical of many amino acids [22]. Unlike the negatively charged complex formed by copper and NTA, the main copper-gly-cine complex formed under the conditions of
997
998 H. R. DALY ET AL.
these experiments carries a single positive charge (CuGly"*^). In addition, an uncharged complex, (Cu(Gly)2), is formed which becomes dominant when glycine concentrations exceed 0.1 mM.
MATERIALS AND METHODS General procedures
Adult shrimp {P. australiensis) were collected from the field and acclimated to the laboratory water supply (filtered, aged Melbourne tap water) at 15°C in continuous-flow aquaria for at least 10 d prior to tests. Mean values for diluent water chemical analyses are presented in Table 1.
For each experiment, six to eight copper concentrations plus a diluent control and a ligand control (where appropriate) were run in duplicate under continuous-flow conditions. Copper stock solutions were made up using analytical grade cupric sulphate (CuS04-5H20), and where required the appropriate concentration of either NTA or glycine.
Stock solutions were mixed well with diluent water at 15°C prior to delivery to paired 4.5 liter glass test tanks; these were maintained at 15°C. The flow rate to each tank was 51 ml/min, giving a 9 5 % molecular replacement time [23] of approximately 5 h.
At the beginning of each test, both test and mixing tanks were spiked with sufficient quantities of stock solutions to attain the required copper and Ugand concentrations.
Twenty-four hours before commencement of a test, 10 healthy adult shrimp were randomly assigned to each test tank. Gravid females were not
used. During each experiment, white fluorescent lights, controlled by a time switch, provided a 12:12 h d:l photoperiod. Test waters were continually aerated using filtered air to ensure adequate mixing and saturated dissolved oxygen conditions.
Mortality and number of moults were recorded at predetermined times for the first 48 h of each test and at least once a day thereafter. Dead animals were removed as soon as they were observed. The criterion for death was taken to be lack of movement of the pleopods and antennae when the animal was gently prodded, as recommended by Mills et al. [24]. Any test where the mortality in the control exceeded 10% was rejected.
Experiments with copper in diluent and copper plus NTA were run for 9 d. Following results analysis of these experiments, which indicated that the asymptotic lethal level was reached within 6 to 7 d, the glycine experiments were run for 6 d only. Asymptotic lethal levels were considered to have been attained 48 h after the last death in any of the test tanks [25].
Water samples for total copper analysis were collected from each tank on day 2 and day 5 of each experiment. If more than one copper concentration varied by greater than 10% either side of the mean during a test, the test was repeated. When only one test tank varied significantly in concentration, the result from that tank was not included in the analysis of the data. Temperature, conductivity, pH, alkalinity, hardness, dissolved oxygen and dissolved organic carbon levels were also monitored during each experiment, using Standard Methods [26].
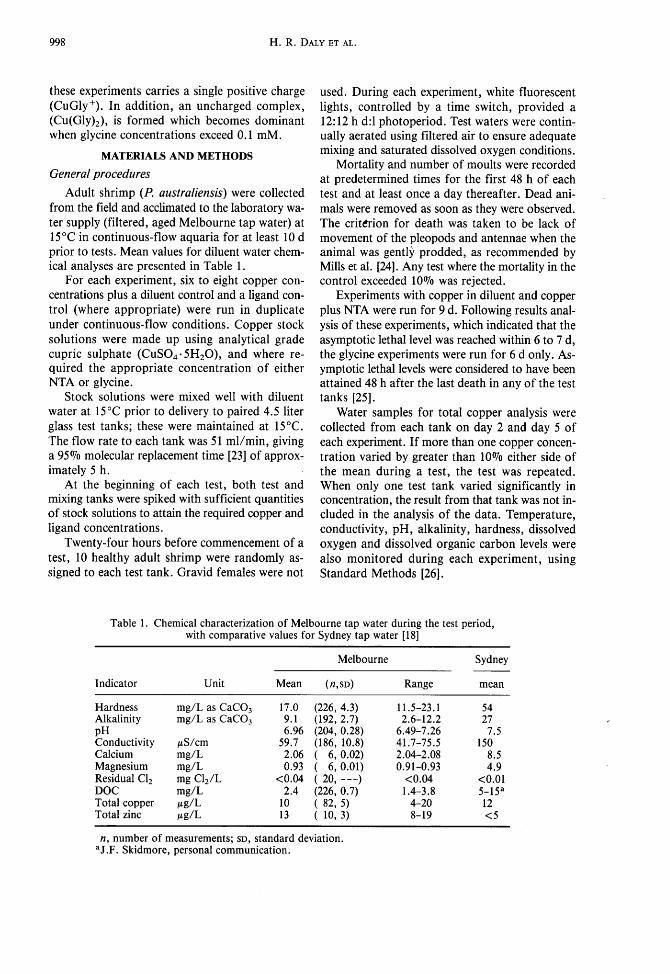
Table 1. Chemical characterization of Melbourne tap water during the test period, with comparative values for Sydney tap water [18]
Indicator Unit Melbourne Sydney
Indicator Unit Mean («,SD) Range mean Hardness mg/L as CaCOj 17.0 (226, 4.3) 11.5-23.1 54 Alkalinity mg/L as CaCOj 9.1 (192, 2.7) 2.6-12.2 27 pH 6.96 (204, 0.28) 6.49-7.26 7.5 Conductivity ^S/cm 59.7 (186, 10.8) 41.7-75.5 150 Calcium mg/L 2.06 ( 6,0.02) 2.04-2.08 8.5 Magnesium mg/L 0.93 ( 6,0.01) 0.91-0.93 4.9 Residual CI2 mg CI2 / L <0.04 ( 20, — ) <0.04 <0.01 DOC mg/L 2.4 (226, 0.7) 1.4-3.8 5-15« Total copper ^g/L 10 ( 82, 5) 4-20 12 Total zinc 13 ( 10, 3) 8-19 <5
n, number of measurements; SD, standard deviation. ^J.F. Skidmore, personal communication.

Copper toxicity to Paratya australiensis: I 999
Speciation scheme The total copper concentration in water samples
taken from each test tank was measured by atomic absorption spectrophotometry.
MINEQL, a computer program designed to calculate the equiUbrium distribution of species in aqueous systems [27], was used to calculate the concentrations of copper species present in each tank.
In addition to the MINEQL program, a number of analytical techniques, were used to try to distinguish the copper species chemically. These techniques included: (a) an Orion copper ion selective electrode (ISE; model No. 94-29A) to measure the concentration (actually the activity) of free ionic copper; and (B) Chelex-100 and SM2 resins (Bio-Rad Laboratories) to determine the "ion exchangeable" and "Upid soluble" fractions, respectively.
The Chelex resin is expected to retain the free ionic metal forms and that fraction of the metal complexes whose stabiUty constants are less than that for the metal with Chelex [1]. Bio Beads SM2 resin has a strong affinity for molecules that have both hydrophilic and hydrophobic components [1]; it is used to measure the lipid soluble fraction of a metal. Ligand concentrations
NTA experiments. In each experiment, P. australiensis was exposed to a range of copper concentrations in the presence of a fixed concentration of NTA. Four 9-d tests were conducted using NTA concentrations of 0.1, 0.25, 0.5 and 1 [M..
Glycine experiments. In each experiment, P. australiensis was exposed to a range of copper concentrations in the presence of a fixed concentration of glycine. Five 6-d tests were conducted using glycine concentrations of 1, 3.2, 5.6, 10 and 20 /xM.
On the basis of the results of these glycine experiments, an additional pair of experiment was run to test the hypothesis that CuGly+ contributed to the toxicity of copper to P. australiensis. An increase in glycine concentration resulted in an increase in the concentration of Cu(Gly)2 as well as CuGly"^, and it was necessary to demonstrate first that Cu(Gly)2 was nontoxic to P. australiensis. A 96-h static test was run with 10 mM glycine plus 0, 2, 6 and 12 fiM copper. At this concentration of glycine, it was estimated, using MINEQL, that 99.4% of the copper present was in the form of Cu(Gly)2 and approximately 0.6% was present as CuGly+.
In the second experiment, the glycine concentration was fixed at 0.5 mM, resulting in virtually all of the copper being present as CuGly-l- and Cu(Gly)2 (in a ratio of approximately 1 to 7). Eight duplicated test conditions were run in a 96-h static test: a tap water control, a 0.5-mM glycine control and 0.5 mM glycine plus 10, 15, 20, 30, 40 and 50 fiM added copper. Duplicate tanks of 30 and 40 |iM copper with 10 mM glycine were run simultaneously. Mortality and moults were recorded at regular intervals throughout the tests. Statistics
Initially, raw data were plotted on a graph of percentage mortality (on a probit scale) vs. total copper concentration (on a logarithmic scale). The line of best fit was calculated by Hnear regression analysis. Subsequently, LC50 values plus their 95% fiducial limits at 12, 24, 32 and 48 h, and 24-h intervals thereafter were calculated using a computer program for probit analysis by the maximum likelihood iterative method [28].
The LC50 values were expressed in terms of free copper(II) concentration as well as in terms of the total copper concentration. The copper(II) concentrations were obtained experimentally using a copper ion selective electrode and were also calculated from the total concentrations using the MINEQL chemical equilibrium computer program. Within each series of experiments, probit lines (in terms of copper(II) concentrations) were compared by an indirect chi square test for the discrepancy between toxicity curves at the 5% significance level [29]. When significance was obtained using the whole data set, subsets of the data were formed for a series of a posteriori tests of the homogeneity of the set of probit hues [30]. This method enabled identification of groups of probit Hnes which could be considered homogeneous. In general, the analyses of the whole probit lines confirmed the results of comparisons based on the LC50 values alone [31].
The data from the NTA and glycine experiments were also analyzed using a BMDP statistical package for an all possible subsets regression [32] to determine which chemical species were contributing to toxicity.
RESULTS Experiments with copper in Melbourne tap water
The LC50 values for P. australiensis exposed to copper for 48, 96, 144 and 216 h at 15°C are

1000 H . R. DALY ET AL.
Table 2. LC50 values for P. australiensis exposed to copper in Melbourne tap water Copper(II) ion LC50 (/xg Cu/L)
Total copper LC50 (/ig Cu/L) Calculated Measured
Time (h) LC50 (95% FL) MINEQL (95% FL) ISE («,SD)
48 43 (38, 51) 26 (22, 31) 22 (3,2) 96 34 (28, 41) 20 (17, 24) 16 (3,2)
144 30 (26, 37) 18 (16, 22) 11 (3, 3) 216 29 (25, 34) 17 <14, 20) 10 (3, 3) FL, fiducial limits; n, number of ISE measurements; SD, standard deviation of measurements.
presented in Table 2. Results are expressed in terms of total copper concentrations and of measured (ISE) and calculated (MINEQL) copper(II) ion concentrations.
Copper—NTA experiments The 48-, 96-, 144- and 216-h LC50 values for
P. australiensis exposed to copper at four different NTA concentrations are presented in Table 3. Results are expressed in terms of total copper concentrations and calculated copper(II) ion concentrations.
The 96-h LC50 values for P. australiensis with copper in Melbourne tap water and four different
NTA concentrations are shown in terms of total copper and calculated copper(II) ion concentrations in Figure 1. The 95% fiducial limits for each LC50 are indicated by diagonal lines: the horizontal component of these lines represents the fiducial limits for the LC50 values on a total copper basis, whereas the vertical component represents the fiducial limits on a copper(II) ion basis. Although the LC50 values expressed as total copper concentration increase with increasing NTA concentration, the LC50 values expressed as copper(II) ion concentration remain relatively constant over the range of NTA concentrations tested.
For the sake of brevity, detailed results of the
Table 3. LC50 values for P. australiensis exposed to copper in the presence of nitrilotriacetic acid (NTA)
NTA concentration (/xM)
Time (h)
Total copper LC50 (Mg Cu/L)
Calculated copper(II) ion LC50 (Mg Cu/L) NTA
concentration (/xM)
Time (h) LC50 (95% FL) MINEQL (95% FL)
0.10 48 52 (43, 69) 25 (20, 36) 0.25 59 (53, 67) 25 (21, 29) 0.50 95 (83, 158) 35 (28, 77) 1.00 109 (98, 136) 25 (19, 41) 0.10 96 44 (36, 54) 21 (16, 27) 0.25 51 (44, 56) 20 (16, 23) 0.50 76 (71, 82) 23 (19, 26) 1.00 101 (92, 119) 21 (17, 31) 0.10 144 37 (30, 44) 16 (12, 21) 0.25 49 (42, 54) 19 (15, 22) 0.50 74 (69, 80) 22 (18, 26) 1.00 99 (91, 114) 20 (15, 28) 0.10 216 35 (28, 41) 16 (11,19) 0.25 46 (40, 52) 17 (14,21) 0.50 74 (68, 79) 21 (18, 25) 1.00 95 (87, 106) 17 (13, 23) FL, fiducial limits.

Copper toxicity to Paratya australiensis: I 1001
A Copper only
• Copper with NTA • Copper with 2 5x10"^M NTA 0 Copper with 5x10"^M NTA • Copper with 10"^M NTA
[ C u Total ] pg/L
Fig. 1. LC50 values for P. australiensis exposed to copper in the presence of NTA, in terms of total copper concentration and calculated copper(II) ion concentration: 96-h test.
speciation scheme using Chelex and SM2 resins are not presented here (for details see [31]). In summary, virtually all the copper present in the NTA and glycine experiments was in an ion exchangeable form, being the fraction retained by Chelex resin. There was no obvious relationship between the toxicity of copper-with-NTA solutions or copper-with-glycine solutions and the concentra
tions of lipid soluble copper, as measured by the uptake of copper onto the SM2 resin. Copper—glycine experiments
The 48-, 96- and 144-h LC50 values for P. australiensis exposed to copper at five different glycine concentrations are presented in Table 4. Results are expressed in terms of total copper concentra-
Table 4. LC50 values for P. australiensis exposed to copper in the presence of glycine
Total Cu LC50 Glycine (^g Cu/L) concentration Time (|tM) (h) LC50 (95% FL)
1.0 48 69 ( 56, 111) 3.2 63 ( 57, 70) 5.6 81 ( 60, 168)
10.0 125 (109, 142) 20.0 130 (107, 196)
96 49 ( 42, 60) 57 ( 49, 63) 59 ( 49, 82) 87 ( 70, 107) 82 ( 68, 94)
144 43 ( 37, 51) 53 ( 44, 59) 52 ( 45, 67) 83 ( 59, 98) 72 ( 57, 84)
Cu(II) ion LC50 (/xg Cu/L) Calculated Measured
MINEQL (95% FL) ISE (W.SD)
34 (28, 56) 41 (4, 10) 21 (19, 24) 27 (3, 6) 19 (14, 41) 30 (3, 3) 18 (16, 21) 39 (3, 4) 10 ( 8, 15) 39 (3, 3) 25 (21, 30) 22 (3, 7) 19 (16, 21) 22 (3, 6) 14 (11, 19) 19 (3, 4) 12 (10, 16) 23 (3, 1) 6 ( 5, 7) 20 (3, 2)
21 (18, 25) 15 (3, 7) 17 (14, 20) 18 (3, 6) 12 (10, 16) 18 (3, 5) 12 ( 8, 14) 21 (3, 1) 5 ( 4 , 6) 16 (3, 2)
1.0 3.2 5.6
10.0 20.0
1.0 3.2 5.6
10.0 20.0
FL, fiducial limits; n, number of ISE measurements; SD, standard deviation of measurements.

1002 H . R . DALY ET AL.
• Copper only
• Copper with glycine
A Copper with 3 2x10"^M glycine O Copper with 5 6x10'^M glycine • Copper with 10"^M glycine A Copper with 2x10"^M glycine
[ C u T o t a l ] y j g / L
Fig. 2 . L C 5 0 values for P. australiensis exposed to copper in the presence of glycine, in terms of total copper concentration and calculated copper(II) ion concentration: 96-h test.
tions and the measured (ISE) and calculated (MINEQL) <iopper(II) ion concentrations. It is obvious that at the higher glycine concentrations used in these experiments, there is an increasing discrepancy between calculated and measured copper (I I) concentrations.
In Figure 2, the 96-h LC50 values for P. australiensis with copper in Melbourne tap water and five different glycine concentrations are shown in terms of total copper and calculated copper(II) ion concentrations. The 95% fiducial limits are represented as described above for the NTA experiments. Unlike the NTA results, the LC50 values
from the glycine experiments, when expressed in terms of calculated copper(II) concentrations, decrease as the concentration of the complexing ligand increases.
Results of the experiments with copper and 10 mM or 0.5 mM glycine concentrations are presented in Table 5. No mortality occurred during the 10 mM glycine experiment. In the 0.5-mM glycine test, death was preceded by moulting on all but one occasion. The exception was for an animal which was present in the highest copper concentration and which was in premouh (in which there is separation of the epidermis and cuticle).
Table 5 . Results of toxicity tests with P. australiensis exposed to copper in the presence of 1 0 mM and 0.5 mM glycine
Concentration Calculated copper speciation Glycine Copper C^x^+ CuGly+ Cu(Gly)2 % Mortality (mM) (MM) (MM) iixM) (MM) (96 h)
0 .0 0 .1 0 . 0 5 7 0 . 0 0 0 . 0 0 0 10 .0 0 - 4 0 0 . 0 0 0 0 . 0 0 - 0 . 2 4 0 . 1 3 - 3 9 . 8 0
0 .5 0 .1 0 0 . 0 1 0 . 1 1 0 0 .5 1 0 0 . 0 0 4 1.12 8.8 0 0 .5 15 0 . 0 0 7 1.70 13.3 1 0 0 .5 2 0 0 . 0 0 9 2 . 3 1 17.7 1 0 0 . 5 3 0 0 . 0 1 5 3 . 5 9 2 6 . 4 2 0 0 .5 4 0 0 . 0 2 2 4 . 9 8 3 5 . 0 4 0 0 .5 5 0 0 . 0 3 0 6 .47 4 3 . 5 4 0

Copper toxicity to Paratya australiensis: I 1003
DISCUSSION Tap water experiments
Although there is broad agreement between calculated (MINEQL) and measured (ISE) copper(II) concentrations (or activities) in Melbourne tap water, in general the calculated values are higher (Table 2). This discrepancy becomes particularly obvious at copper(II) concentrations below about 18 to 20 /xg/L, possibly because at these concentrations the ISE is approaching its detection Hmit in the tap water matrix. Further work is required to clarify the reasons for this discrepancy.
A number of problems were encountered with the use of the ISE during the NTA and glycine experiments (discussed in following sections). Because the tap water, NTA and glycine solutions could be well characterized chemically, the calculated (MINEQL) copper(II) concentrations were used rather than the ISE values as a basis for comparison between experiments.
It is interesting to compare the results obtained in our laboratory for P. australiensis exposed to copper at 15°C with those reported by Skidmore and Firth [18]. They obtained 96-h and 216-h LC50 values of 110 and 98 ii% Cu/L, respectively, for P. australiensis exposed to copper in Sydney tap water, approximately three times the corresponding values obtained in the present study (34 and 29 /xg Cu /L , respectively). There are a number of factors, apart from certain minor differences in experimental procedure, which could account for this apparent discrepancy. Sydney tap water has considerably higher hardness, alkaUnity and conductivity than Melbourne tap water (Table 1), all of which would tend to decrease the toxicity of copper to P. australiensis. Probably more importantly, the dissolved organic carbon concentration in Sydney tap water is 5 to 15 mg C/L (J.F. Skidmore, personal communication), compared with 2 to 4 mg C/L in Melbourne water. Therefore, it is likely that significantly more copper is complexed by organic matter in Sydney tap water than in Melbourne tap water. Free ionic copper constituted an estimated 20 to 25% of the filterable copper present in Skidmore and Firth's experiments [18], which compares with a value of approximately 50 to 60% in Melbourne tap water (present study). Based on Skidmore and Firth's estimate, the 96-h and 216-h LC50 values for P. australiensis in Sydney tap water in terms of free ionic copper would be 22 to 28 jixg/L and 20 to 25 jug/L, respectively. These results are very similar to the corresponding
values obtained in this laboratory, namely 20 /ig/L and 17 /xg/L respectively (Table 2).
NTA experiments It appears that P. australiensis can tolerate higher
total copper concentrations when NTA is present, since the LC50 value is seen to increase as NTA concentrations increase (Table 3, column 3). However, if the LC50 values are expressed in terms of copper(II) rather than total copper, as in Table 3 (column 4) and Figure 1, it is apparent that the 96-h LC50 values for P. australiensis with copper, and with copper plus four NTA concentrations, are similar, namely around 20 to 23 /xg Cu^'^/L. The same is true for the 216-h LC50 values, which are all between 16 and 21 /xg Cu^VL (Table 3).
When the data were analyzed using a BMDP statistical package for an all possible subsets regression [32], it was found that 80% of the variance in percentage mortality of test organisms could be predicted from the variance of the copper(II) concentration. Unfortunately, since the concentration of CuOH"^ and CuCOj were hnearly related to the cupric ion concentration in these experiments, it was not possible to determine whether or not they contributed to the toxicity. However, evidence from a number of other studies (e.g., [7], [12]) indicates that CuOH"^ and CuCOj make a negligible contribution to copper toxicity. Furthermore, in the present study the combined concentrations of these two copper species were low (approximately half the Cu "*" concentration), so it is unUkely that they made a significant contribution to the toxicity. The group of experiments described in [19] was designed to investigate whether or not C U C O 3 is toxic to Paratya. It is more difficult to determine the influence of CuOH"^ on toxicity, since changes in pH may have physiological effects on the test organisms, in addition to changing the proportions of CuOH+ present.
The results of the present study appear to indicate that the free copper(II) ion is the main toxic species under the conditions of these experiments, and that the CuNTA complex is not toxic to P. australiensis. Similarly, most studies on the effects of NTA on metal toxicity to aquatic organisms have shown that NTA significantly reduces copper toxicity by forming nontoxic complexes with the metal [4,11,21,33,34]. Laube et al. [35], however, reported that the presence of 10~^ to 10~^ M NTA in experimental media did not reduce the toxicity of copper, cadmium or lead to the blue-green alga
1004 H . R . DALY ET AL.
Anabaena, and in some cases actually enhanced toxicity. Their results suggest that the free ionic form of these metals is not the only species causing toxicity to Anabaena. However, other possible explanations are that the NTA itself is toxic to the alga at certain concentrations, or that NTA complexes some of the nutrients essential to algal growth, making them unavailable to the alga.
Under the conditions of these experiments, the Chelex resin was seen to be of little use in distinguishing between different copper species, since it retained virtually all the copper present.
If the mechanism of copper uptake by an organism involves simple diffusion of copper through a cell membrane, one would expect there to be a relationship between lipid solubility of the metal or metal complex and its toxicity [1]. However, in these experiments there was no obvious relationship between the toxicity of copper-with-NTA or copper-with-glycine solutions and the concentration of lipid soluble copper, as measured by retention on the SM2 resin. This suggests that copper uptake by cells involves some form of carrier-mediated transport in addition to, or instead of, simple diffusion.
ISE measurements of the copper(II) activity in test solutions containing NTA were unsuccessful, apparently because of NTA interference. The symptoms demonstrated were deterioration in sensitivity of the electrode, prolonged response times and poor reproducibility of results. Similar problems have been reported for copper ISEs used in the presence of EDTA, NTA and humic and fulvic acids [36].
Because of the difficulties encountered with the use of the copper ISE in the presence of NTA, it was necessary to estimate the concentration of cop-per(II) in each test solution using MINEQL. The use of chemical modeUng to calculate the speciation of copper in test waters is not without its problems: the model cannot accurately adjust for the effects of adsorption of the test metal onto container walls, or of complexation of the metal by the excretory products of the test organisms, while the accuracy of the estimates depends ultimately on the vahdity of the stability constants used in the calculations and on the completeness of the set of chemical equilibria used to define the system. Nevertheless, in these well-defined synthetic solutions, MINEQL can produce reasonable estimates of the concentration of the different copper species present for a given total copper and NTA concentration.
Glycine experiments There is reasonable agreement between calcu
lated and measured (ISE) copper(II) concentrations at the LC50 value for glycine concentrations between 1 and 5.6 nM (Table 4). However, as the concentration of glycine is increased, the discrepancy between calculated and measured values becomes greater. The interpretation of the data is dependent upon which of these measures is considered to be more rehable.
On the basis of the ISE data, copper(II) would be recognized as the toxic species, since the LC50 values in terms of copper(II) are approximately the same. However, the results of the ISE determinations for 10 fiM and 20 nM glycine cannot be reconciled with the expectation that there would be less copper(Il) present for the same amount of total copper at the higher glycine concentration.
If the LC50 values are expressed in terms calculated copper(II) concentrations (Table 4 and Fig. 2), it is apparent that they decrease as the concentration of glycine increases. It appears that, as the concentration of glycine, and consequently of CuGly"^, increases, the copper solutions become increasingly more toxic than would be expected on the basis of their copper(Il) concentrations alone. This suggests that the CuGly"^ complex contributes to the toxicity of copper to P. australiensis. The data from the copper-glycine experiments were tested using the same all possible subsets regression analysis as that used for the NTA experiments. In this case, it was demonstrated that 68% of the variance in percentage mortality of test organisms could be predicted from the variance of [Cu^"^] and a further 15% could be explained by the variance of [CuGly+].
The resuhs of the 10 mM and 0.5 mM glycine experiments (Table 5) support the hypothesis that CuGly"*" is at least mildly toxic to P. australiensis. No mortality occurred in copper concentrations of up to 40 fxM (i.e., around 2.5 mg/L) in the presence of 10 mM glycine. Because over 99% of the copper in these test waters was present as Cu(Gly)2, it is apparent that Cu(Gly)2 is not acutely toxic to P. australiensis. However, there was appreciable mortality in test waters containing copper as CuGly + and Cu(Gly)2, suggesting that CuGly+ is toxic to P. australiensis. Postmoult individuals were particularly affected.
Several studies have shown that the presence of glycine reduces copper toxicity to fish and invertebrates [37-40]. However, data from a study by

Copper toxicity to Paratya australiensis: I 1005
Borgmann and Ralph [40] on copper toxicity to Daphnia magna also suggest that at least one of the copper-glycine complexes, in addition to cop-per(ll), is toxic. Unfortunately, these authors do noi indicate clearly which complex they consider to be toxic. They imply, however, that Cu(Gly)2 is the toxic species, by specifically noting that over 70% of the copper in their test waters was in that form, without mentioning the amount present as CuGly+. It is possible to calculate the approximate concentration of CuGly"^ in their test waters at the EC50 value by using the total and free copper concentrations they provided and assuming that 80 to 85% of the copper is complexed as Cu(Gly)2 and in various inorganic forms. Because ion selective electrode measurements indicated that only about 0.001% of the copper in the test waters was present as the free copper(II), the remaining 15 to 20% is assumed to have been complexed as CuGly+.
The 48-h EC50 values obtained by Borgmann and Ralph for copper in the presence of 0.2 mM and 0.8 mM glycine were 10 fiM and 32 / xM, respectively, which would equal 1.5 to 2 fiM and 4.8 to 6 fiM as CuGly"^. The experiments conducted in our laboratory showed that concentrations of 1.7 /xM CuGly"*^ and over were acutely toxic to P. australiensis (Table 5). Thus, it seems possible that the toxicity of copper-glycine solutions to Daphnia reported by Borgmann and Ralph [40] could be due to CuGly+ rather than the Cu(Gly)2.
Acknowledgement-This study was funded by the Australian Water Resources Council.
REFERENCES 1. Florence, T.M. 1982. The speciation of trace ele
ments in waters. Talanta 29:345-364. 2. Hart, B.T. 1982. Trace metals in natural waters. I.
Speciation. Chem. Aust. 49:260-265. 3. Hart, B.T. 1982. Australian water quality criteria for
heavy metals. AustraHan Water Resources Council Technical Paper No. 77. Australian Government Publishing Service, Canberra, Austraha.
4. Sunda, W.G. and P.A. Gillespie. 1979. The responses of a marine bacterium to cupric ion and its use to estimate cupric ion activity. J. Mar. Res. 31: 761-777.
5. Sunda, W.G. and J.M. Lewis. 1978. Effect of complexation by natural organic ligands on the toxicity of copper to a unicellular alga Monochrysis lutheri. Limnol. Oceanogr. 23:870-876.
6. Canterford, G.S. and P.R. Csnterford. 1980. Toxicity of heavy metals to the marine diatom Ditylum brightwellii (West) Grunow: Correlation between toxicity and metal speciation. J. Mar. Biol. Assoc. (U.K.) 60:227-242.
7. Gavis, J., R.R.L. Guillard and B.L. Woodward. 1981. Cupric ion activity and the growth of phyto-plankton clones isolated from different marine environments, J. Mar. Res. 39:315-334.
8. Petersen, R. 1982. Influence of copper and zinc on the growth of a freshwater alga, Scenedesmus quad-ricauda:The significance of chemical speciation. Environ. Sci. Technol. 16:443-447.
9. Brown, B.T. and B.M. Rattigan. 1979. Toxicity of soluble copper and other metal ions to Elodea canadensis. Environ. Pollut. 20:303-314.
10. Andrpw, R.W., K.E. Biesiger and G.E. Glass. 1977. Effects of inorganic complexing on the toxicity of copper io Daphnia magna. Water Res. 11:309-315.
11. Sanders, B.M., K.D. Jenkins, W.G. Sunda and J.D. Costlow. 1983. Free cupric ion activity in seawater: Effects on metallothionein and growth in crab larvae. Science 222:53-55.
12. Chapman, G.A. and J.K. McCrady. 1977. Copper toxicity: A question of form. In R.A. Tubb, ed.. Recent Advances in Fish Toxicology: A Symposium. EPA 600 13-77-085, U.S. Environmental Protection Agency, Washington, DC, pp. 132-151.
13. Engel, D.W. and W.G. Sunda. 1979. Toxicity of cupric ion to eggs of the spot Leiostomus xanthurus and the Atlantic silverside Menidia menidia. Mar. Biol. 50:121-126.
14. Harrison, F.L. 1982. A review of the impact of copper released into marine and estuarine environments. UCRL-53042 and NUREG/CR-2823. Lawrence Livermore National Laboratory, Livermore, CA.
15. Sunda, W.G., D.W. Engel and R.M. Thuotte. 1978. Effect of chemical speciation on toxicity of cadmium to grass shrimp Palaemonetes pugio: Importance of the free cadmium ion. Environ. Sci. Technol. 12:409-413.
16. Laegreid, M., J. Alstad, D. Klaveness and H.M. Selp. 1983. Seasonal variation of cadmium toxicity toward the alga Selenastrum capricornutum Printz in two lakes with different humus content. Environ. Sci. Technol. 17: 357-361.
17. Freedman, M.L., P.M. Cunningham, J.E. Schindler and M.J. Zimmerman. 1980. Effect of lead speciation on toxicity. Bull. Environ. Contam. Toxicol. 25:389-393.
18. Skidmore, J.F. and I.C. Firth. 1983. Acute sensitivity of selected AustraHan freshwater animals to copper and zinc. Australian Water Resources Council Technical Paper No. 81. Australian Government Publishing Service, Canberra, Australia.
19. Daly, H.R., LC. Campbell and B.T. Hart. 1990. Copper toxicity to P. australiensis. II. Influence of bicarbonate and ionic strength. Environ. Toxicol. Chem. 9:1007-1011.
20. Daly, H.R., M.J. Jones, B.T. Hart and LC. Campbell. 1989. Copper toxicity to P. australiensis. III. Influence of dissolved organic matter. Environ. Toxicol. Chem. 9:1013-1018.
21. Shaw, T.L. and V.M. Brown. 1974. The toxicity of some forms of copper to rainbow trout. Water Res. 8:377-382.
22. Stiff, M.J. 1971. The chemical states of copper in poUuted fresh water and a scheme of analysis to differentiate them. Water Res. 5:585-599.
23. Sprague, J.B. 1968. Promising anti-pollutant: Che-

1006 H. R. DALY ET AL.
lating agent NTA protects fish from copper and zinc. Nature 220:1245-1346.
24. Mills, B.J., P.S. Lake and R. Swain. 1979. Two freshwater crustaceans suitable for toxicity tests in Australian waters. Water Studies Centre Technical Report No. 10. Caulfield Institute of Technology, Melbourne, Austraha.
25. Fogels, A. and J.B. Sprague. 1977. Comparative short-term tolerance of zebrafish, flagfish and rainbow trout to five poisons including potential reference toxicants. Water Res. 11:811-817.
26. American Public Health Association, American Water Works Association and Water Pollution Control Federation. 1975. Standard Methods for the Examination of Water and Wastewater, 14th ed. American Pubhc Health Association, Washington, DC.
27. Westall, J.C., J.L. Zachory and F.M. Morel. 1976. MINEQL, a computer program for the calculation of chemical equilibrium composition of aqueous systems. Technical Note 18. Ralph M. Parsons Water Quality Lab, Massachusetts Institute of Technology, Cambridge, MA.
28. Finney, D.J. 1971. Probit Analysis, 3rd ed. Cambridge University Press, London, U.K.
29. Bliss, C.L 1935. The comparison of dosage-mortality data. Ann. Appl. Biol. 22:307-333.
30. Sokal, R.R. and F.J. Rohlf. 1969. Biometry: The Principles and Practice of Statistics in Biological Research. W.H. Freeman and Co., San Francisco, CA.
31. Daly, H.R. 1985. An investigation of the relationship between copper speciation and toxicity to the freshwater shrimp Paratya australiensis. M. App. Sci. thesis, Chisholm Institute of Technology, Melbourne, Australia.
32. Dixon, W.J., M.B. Brown, L. Engelman, J.W.
Frane, M.A. Hill, R.L Jennrich and J.D. Toporek, eds. 1981. BMDP Statistical Software. University CaHfornia Press, Berkeley, CA.
33. Sprague, J.B. 1969. Measurement of pollutant toxicity to fish 1: Bioassay methods for acute toxicity. Water Res 3:193-m.
34. Erickson, S.J., T.E!. Maloney and J.H. Gentile. 1970. Effect of nitrilotriacetic acid on the growth and me-tabohsm of estuarine phytoplankton. J. Water Pollut. Control Fed. 42:329-335.
35. Laube, V.M., C.N. McKenzie and D.J. Kushner. 1980. Strategies of response to copper, cadmium and lead by a blue-green and a green alga. Can. J. Microbiol. 26:1300-1311.
36. Sekerka, 1. and i.F. Lechner. 1978. Response of cop-per(II) selective electrode to some complexing agents. Anal. Letts. All:415-427.
37. Brown, V.M., T.L. Shaw and D.G. Shurben. 1974. Aspects of water quality and the toxicity of copper to rainbow trout. Water Res. 8:797-803.
38. Chynoweth, D.P., J.A. Black and K.H. Mancy. 1976. Effects of organic pollutants on copper toxicity to fish. In R.W. Andrew, P.V. Hodson and D.E. Konasewich, eds.. Proceedings, Workshop on the Toxicity to Biota of Metal Forms in Natural Water. International Joint Commission, Windsor, Ontario, Canada, pp. 145-157.
39. Knezovich, J.P., F.L. Harrison and J.S. Tucker. 1981. The influence of organic chelators on the toxicity of copper to embryos of the Pacific oyster Cras-sostrea gigas. Arch. Environ. Contam. Toxicol. 10:214-248.
40. Borgmann, U. and K.M. Ralph. 1983. Complexation and toxicity of copper and the free metal bioassay technique. Water Res. 17:1697-1703.